

Abstract
Properties of the hyperpolarization-activated cation current (Ih) were investigated in thalamocortical neurones of an in vitro slice preparation of the rat ventrobasal thalamic complex (VB) before and during changes of pipette pH (pHp), intracellular pH (pHi) and bath pH (pHb) using the whole-cell patch-clamp technique and fluorescence ratio imaging of the pH indicator 2′,7′-bis(carboxyethyl)-5(and -6)-carboxyfluorescein (BCECF).
Recording of Ih with predefined pHp revealed significant shifts in the voltage dependence of Ih activation (V½) of 4-5 mV to more positive values for a pHp of 7.5 and 2-3 mV to more negative values for a pHp of 6.7 as compared to control values (pHp= 7.1).
Application of the weak acid lactate (20 mM), which produced a slow monophasic intracellular acidification, induced a reversible negative shift of V½ of up to 3 mV. Application of 20 mM TMA, which caused a distinct intracellular alkalinization, shifted V½ to 4-5 mV more positive values.
In slices bathed in Hepes-buffered saline, no significant pHo dependence of Ih was observed. Changing pHo by altering the extracellular [HCO3−] in the presence of constant pCO2 also revealed no significant pHo dependence of Ih.
Rhythmic stimulation of thalamocortical neurones with repetitive depolarizing pulse trains caused an intracellular acidification, which reversibly decreased the amplitude and time course of activation of Ih.
The results of the present study indicate that shifts in pHi result in a significant modulation of the gating properties of Ih channels in TC neurones. Through this mechanism activity-dependent shifts in pHi may contribute to the up- and downregulation of Ih.
Thalamocortical (TC) neurones can generate intrinsic oscillations due to the regular occurrence of low-threshold Ca2+ spikes and a depolarizing pacemaker potential (McCormick & Pape, 1990a;Soltesz et al. 1991). They are also part of a network which can generate both normal and pathological forms of synchronized oscillations, as for instance sleep spindles during slow-wave sleep and spike and wave discharges during generalized absence seizures (Steriade & Deschênes, 1984; Niedermeyer, 1990; Steriade et al. 1993, 1997). The generation of intrinsic oscillations, as well as the network oscillations, are critically dependent upon the h-current (Ih), a cation current activated by membrane hyperpolarization (McCormick & Pape, 1990a;Soltesz et al. 1991; Pape, 1996). Activity-dependent upregulation of Ih in thalamocortical neurones has been shown to result in dampening of intrinsic and network oscillations (McCormick & Pape, 1990b;Leresche et al. 1991; Bal & McCormick, 1996; McCormick & Bal, 1997). An activity-dependent upregulation of Ih mediated by intracellular Ca2+ was suggested in models of oscillations in thalamocortical networks (Desthexe et al. 1996). Recently, the role of Ca2+-mediated upregulation of Ih for the timing of synchronized thalamocortical oscillations has been directly shown in ferret thalamocortical neurones (Lüthi & McCormick, 1998). However, the mechanism of Ca2+-dependent upregulation of Ih in neurones is still controversial (Ingram & Williams, 1996; Budde et al. 1997; Lüthi & McCormick, 1998). Besides Ca2+, other ions may be critically involved in the control of voltage-dependent membrane conductances, such as Ih.
For instance, neuronal activity is accompanied by transient shifts in extracellular as well as intracellular pH, both under physiological and pathophysiological conditions (Caspers & Speckmann, 1972; Chesler, 1990; de Curtis et al. 1998; for review see also Kaila & Ransom, 1998). The exact time course of pHo and pHi shifts may vary between different neural tissues but most often a transient extracellular alkalinization is followed by a slower persistent extracellular acidification (Chesler & Kaila, 1992). In coronal slices of rat dorsal lateral geniculate nucleus, for instance, recordings with pH microelectrodes have revealed transient alkaline shifts of up to 0.04 pH units upon synchronous activation (Tong & Chesler, 1999). As the pHo shifts reflect transmembrane flux of acid or base equivalents, they are accompanied by pHi changes. Either one may lead to modulation of neuronal excitability, since even modest shifts in pHo and pHi have been shown to affect a variety of voltage- and ligand-gated ion channels (Moody, 1984; Traynelis & Cull-Candy, 1990; Tombaugh & Somjen, 1996; for review see also Kaila & Ransom, 1998). The possible role of activity-related changes in the concentration of H+ on Ih has not been considered in detail as yet, although early reports exist on a depressant effect of H+ on gating of Ih in starfish oocytes (Moody & Hagiwara, 1982) and lobster stretch receptor neurones (Edman & Grampp, 1991).
In the present study we investigated the possible modulation of Ih by extracellular and intracellular pH shifts in thalamocortical neurones in a slice preparation of rat ventrobasal thalamic complex (VB). We demonstrate that the voltage dependence and kinetics of Ih are sensitive to the intracellular concentration of H+. We hypothesize that modulation of Ih by intracellular pH may be involved in the timing of intrinsic oscillations in TC neurones, thereby contributing to control of synchronized oscillatory activity in thalamocortical networks. A preliminary report of some of the results has been communicated to the European Neuroscience Association (Munsch & Pape, 1998).
METHODS
Slice prepapration
Juvenile Long-Evans rats of postnatal age P12-P16 were deeply anaesthetized with fluothane (∼5 ml in a 2 l beaker) and decapitated. A block of brain tissue containing the VB was rapidly removed and immersed in cold (2-4°C) saline of the following composition (mM): sucrose, 195; glucose 11; Pipes, 20; KCl, 2.5; MgSO4, 10; CaCl2, 0.5; pH 7.35 with NaOH. Coronal slices of the thalamus were cut at 300 μm on a vibratome (Model 1000, Ted Pella, Redding, CA, USA), and kept submerged at room temperature (22-25°C) in artificial cerebrospinal fluid (ACSF) containing (mM): NaCl, 125; KCl, 2.5; NaH2PO4, 1.25; NaHCO3, 22-26; MgSO4, 2; CaCl2, 2; glucose, 20; pH 7.35 by equilibration with 95 % O2-5 % CO2. The [HCO3−] of the superfusate was somewhat lower than can be calculated from the Henderson-Hasselbalch equation for a pH of 7.35 to account for the loss of CO2 between storage container and experimental bath. However bath pH was routinely checked and adjusted by adding small amounts of NaHCO3 to the stock solution. In Hepes-buffered ACSF, NaHCO3 was substituted by an equimolar amount of Hepes and pH adjusted to the desired value by adding NaOH. The [HCO3−] used to change bath pH at constant pCO2 (5 %) was 15-17 mM for pH 7.2, 7-9 mM for pH 6.9 and 29-31 mM for pH 7.5. Again, actual bath pH was checked with a pH electrode and adjusted by adding small amounts of NaHCO3 to the stock solution.
All substances were obtained from Sigma (St Louis, MO, USA) except for Hepes (SERVA, Heidelberg, Germany).
Electrophysiological recording
Recordings were performed on VB neurones in the slice preparation. Individual neurones were approached under visual control by infrared videomicroscopy with patch pipettes pulled from borosilicate glass (GC 150TF-10, Clark Electromedical Instruments, Pangbourne, UK) and filled with the following pipette solution (mM): potassium gluconate, 95; potassium citrate, 20; NaCl, 10; Hepes, 10; MgCl2, 1; CaCl2, 0.1; 1,2-bis(2-aminophenoxy)-ethane-N,N,N′,N′-tetraacetic acid (BAPTA), 1; MgATP, 3; Na2GTP, 0.5; pH adjusted to 7.2 with KOH. For recordings with predefined pH values in the pipette Hepes concentration was increased to 30 mM and pH was carefully adjusted using N-methyl-D-glucamine (NMDG) in order to keep the transmembrane driving force for K+ constant (DiFrancesco, 1982). Membrane currents and membrane voltages were recorded in the whole-cell configuration using an EPC-9 amplifier operating Pulse software (v. 8.01, HEKA, Lambrecht, Germany). Recordings were started 10-15 min after obtaining the whole-cell configuration to allow stabilization of intracellular pH. Typical electrode resistances were 2-3 MΩ and access resistance ranged from 5-15 MΩ. Series resistance compensation of ≥30 % was routinely used. All measured potentials were corrected off-line for a liquid junction potential of 12 mV. Prior to measurements, slices were transfered to an experimental bath and continuously superfused with ACSF at room temperature (22-25°C). Sometimes, 0.5-1 mM Ba2+ or 0.5-1 mM Cs+ was added to the ACSF as indicated. In Ba2+-containing solutions MgSO4 was substituted by an equimolar amount of MgCl2. In solutions containing tetramethylammonium (TMA) or lactate, NaCl was substituted by an equivalent amount of TMA-Cl or sodium lactate.
The steady-state activation curve of Ih was constructed by measuring tail currents elicited by repolarizing the membrane to a fixed potential (-63 mV) following 2 s voltage steps to test potentials between -118 or -108 mV and -48 mV. In contrast to previous observations on thalamic relay cells, the voltage protocol used in the present study did not evoke low voltage-activated calcium currents (ILVA) when stepping back to -63 mV under the present experimental conditions. Measurements of Ih tail current amplitudes were carried out only in traces uncontaminated by the ILVA current, whose presence would have otherwise compromised their accuracy. Tail currents were measured 50 ms after termination of the hyperpolarizing voltage pulse, and normalized by:
| (1) |
The resulting data could be well fitted by a Boltzmann function of the form:
| (2) |
from which the value of half-maximal activation (V½) and the slope factor (k) were obtained. The fully activated current vs. voltage (I-V) relationship was obtained by calculating the ratio of Ih amplitudes during activation and deactivation for each voltage step and multiplying it by the amplitude of the maximal tail current for the largest test pulse. From plots of these data against the test potentials, the fully activated conductance underlying Ih (Gh) and the reversal potential (Vrev) could be obtained (Pape, 1994).
The time course of Ih activation was best approximated by single-exponential fits according to the equation:
| (3) |
where Ih(t) is the the amplitude of the current at time t, ao and a1 are constants and τ is the time constant.
pH imaging
VB neurones were loaded with 10-50 μm of the fluorescent pH indicator BCECF (Teflabs, Austin, TX, USA) via the patch pipette after establishing the whole-cell configuration. The dye was allowed to diffuse into the cell and equilibrate for at least 10 min before the recordings were started. Excitation of the dye was performed with a rapid scanning monochromator (TILL Photonics, Munich, Germany) coupled to the microscope (Zeiss, Axioscope FS, Oberkochen, Germany) via a light guide. Excitation light (420 or 440 and 495 nm, 500 ms exposure time) was directed onto the slice with a 505 nm dicroic (Omega Optical, Brattleboro, VT, USA) through a water immersion objective (LUMPLFL 40 × W, Olympus, Hamburg, Germany). Fluorescence was measured with a 12 bit slow-scan CCD camera (Theta System Elektronik GmbH, Gröbenzell, Germany or Princeton Instruments, Trenton, NJ, USA) after passing a 520 nm long-pass filter (Zeiss). Analysis was restricted to the cell somata. Aquisition rate was 0.03-1 Hz in order to minimize photobleaching of BCECF and photodynamic cell damage. Calibration of background-subtracted fluorescence ratios (F420 or F440/F495) with the nigericin-high K+ method was not performed since it does not work properly in slice preparations (Trapp et al. 1996a). The null-point calibration method (Eisner et al. 1989) was not used since all pHi regulatory mechanisms have to be blocked, which was not tolerated by the thalamic slices. However, to obtain some rough estimates for the magnitude of the changes in pHi induced by weak acids and bases or the activity-induced acidification, we calculated pHi values from the changes in BCECF fluorescence ratio in response to application of TMA and lactate (Szatkowski & Thomas, 1986; Eisner et al. 1989).
Statistics
The data in the results section are presented as means ±s.d. and as means ±s.e.m. in the figures, as indicated. Statistical significance was tested with an unpaired t test for small samples (Dixon & Massey, 1969) or Student's paired t test from the statistics package provided by Origin, v. 4.0 (Microcal, Northampton, MA, USA), as indicated.
RESULTS
Recording of TC neurones from rat VB in the whole-cell configuration of the patch-clamp technique revealed activation of two inward current components upon membrane hyperpolarization from a holding potential of -38 or -48 mV (Fig. 1), i.e. an instantaneous component and a component developing with a slower time course of activation. By adding 0.5-1 mM Ba2+ to the bathing solution (Fig. 1A, middle family of current traces), the instantaneous component was blocked leaving only a small ‘leak’ current and the slow current component. Rapid activation and Ba2+ sensitivity are characteristic of IKir, as recently reported for TC neurones from cat VB (Williams et al. 1997). The application of 0.5-1 mM Cs+ in the presence of Ba2+ blocked the second inward current component with slower, time-dependent activation (Fig. 1A, bottom family of current traces), which is characteristic of Ih in thalamic neurones (McCormick & Pape, 1990a;Soltesz et al. 1991). It also shows that there was no contamination of the tail currents by the ILVA, at least under the present experimental conditions. Analysis of the I-V relationships (n = 4) showed that Ih, measured as the difference of the steady-state inward current 50 ms before the end of the test pulse and the instantaneous current at the begining of the test pulse (Istst- Iinst) was not affected by the concentrations of Ba2+ used in this study (Fig. 1B). In order to isolate Ih, we therefore added 0.5-1 mM Ba2+ routinely to the ACSF.
Figure 1. Hyperpolarization-activated currents in TC neurones of VB.
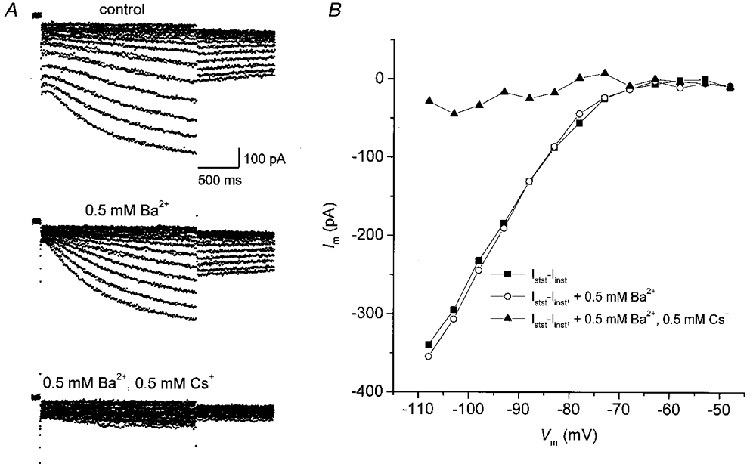
A, families of current traces recorded in a VB neurone upon hyperpolarizing voltage steps from -48 mV in 5 mV increments to -108 mV under control conditions and in the presence of 0.5 mM extracellular Ba2+ and 0.5 mM extracellular Cs+, as indicated. Holding potential was -38 mV. B, I-V relationship of Ih, measured as the difference between the steady-state inward current 50 ms before the end of the test pulse (Istst) and the instantaneous inward current (Iinst) obtained at the beginning of the hyperpolarizing voltage steps, before and after the addition of Ba2+ and Cs+.
pH sensitivity of Ih
In order to test for a possible pHi dependence of Ih, TC neurones were recorded with different predefined pH values in the patch pipette solution (Fig. 2). Analysis of the activation curves of Ih for pH values of 6.7, 7.1 and 7.5 (Fig. 2A) revealed significant shifts in the half-activation potential. Acidic pH (6.7) led to a leftward shift of V½ to 2-3 mV more negative potentials, while alkaline pH (7.5) resulted in a shift to 4-5 mV more positive potentials as compared to a control pH of 7.1 (Table 1). In contrast, no significant differences (P > 0.1) in the fully activated conductance underlying Ih and the extrapolated reversal potential of Ih (Table 1) were observed between the different populations of TC neurones recorded with different pHp values (Fig. 2B). Examination of the current traces (Fig. 2C) revealed that the time constant (τ) of activation of Ih appeared to decrease with an increase in pHp. Single-exponential fits of current traces recorded with different pH values (Fig. 3A) corroborated the strong voltage dependence of the Ih activation time course, and in addition showed a substantial dependence on pHp. At more acidic pH (6.7), τ was increased, while at a more alkaline pH (7.5), τ was decreased as compared to a pH value of 7.1 (Fig. 3B). For a test pulse to -93 mV, for instance, the time constant for activation of Ih was 1.74 ± 0.88 s (n = 8) for a pHi of 6.7, 1.25 ± 0.46 s (n = 8) for pHi= 7.1 and 827 ± 215 ms (n = 7) for a pHi of 7.5.
Figure 2. Modulation by pHp of Ih in TC neurones.
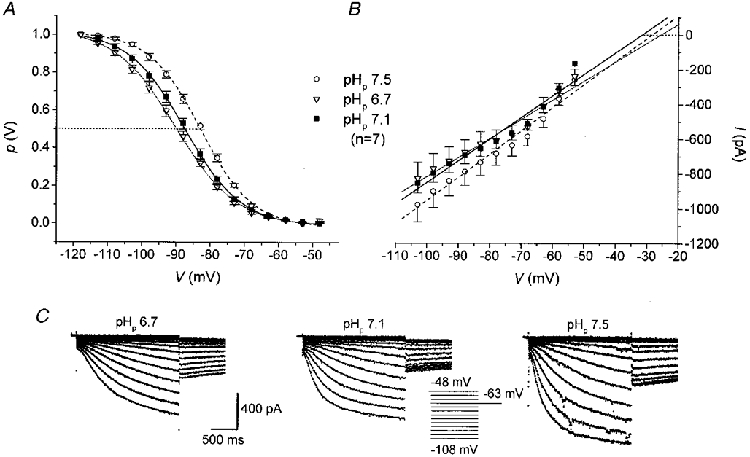
Mean steady-state activation curve (A) and fully activated I-V relationship (B) of Ih, recorded using pipette solutions of different pH values. Lines in A and B represent best fits of a Boltzmann distribution and linear regression analysis to the data points, respectively. Data represent means (n = 7) and s.e.m.C, examples of current families recorded with different pipette solutions as indicated. Inset shows voltage protocol.
Table 1.
pH sensitivity of Ih activation
| pHp | V1/2(mV) | k | Gh(pA mV−1) | Vrev(mV) | n |
|---|---|---|---|---|---|
| 7.5 | −82.8 ± 1.7* | 7.6 ± 1.8 | 13.2 ± 3.4 | −28.6 ± 2.2 | 7 |
| 7.1 | −87.5 ± 2.5*,** | 8.3 ± 2.1 | 12.4 ± 1.9 | −31.0 ± 2.1 | 7 |
| 6.7 | −90.2 ± 1.9** | 8.9 ± 1.3 | 11.0 ± 3.1 | −25.9 ± 3.0 | 7 |
Half-maximal activation voltage (V1/2), slope factor (k), fully activated conductance (Gh) and reversal potential (Vrev) of Ih in TC neurones recorded with Hepes-buffered pipette solutions of different pH values (pHp). Significant differences are
P≤ 0.01, unpaired t test
P≤ 0.05, paired t test.
Figure 3. pH dependence of Ih activation kinetics.
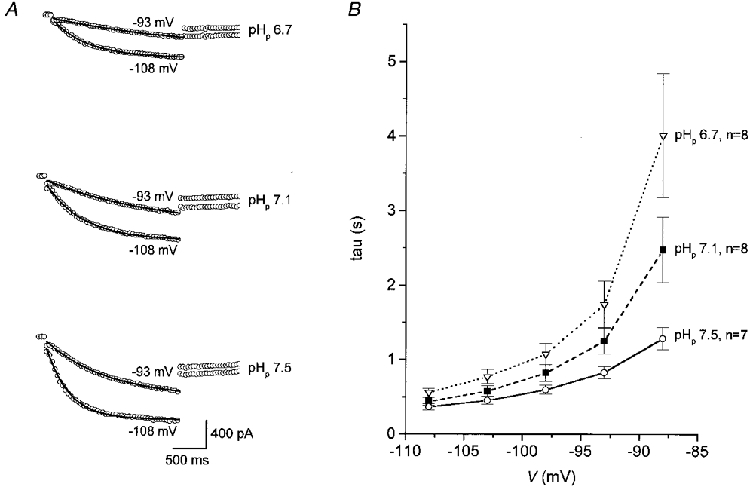
A, current traces recorded from VB neurones upon hyperpolarizing voltage steps to -93 and -108 mV, from a holding potential of -48 mV, with pipette solutions of different pH values as indicated. Continuous lines overlying current traces represent single-exponential fits through the data points. B, plot of activation time constant (τ) versus voltage of test steps from -48 to -108 mV for neurones recorded with intracellular solutions of different pH values. Data represent means (n as indicated) and s.e.m.
Modulation of Ih by intracellular alkalinization and acidification
In order to more directly determine the effect of changes in pHi on Ih in a given cell, weak bases and weak acids were applied with the bathing solution to intracellularly alkalinize and acidify the neurones, respectively. TMA is a weak base producing a monophasic intracellular alkalinization because of the membrane permeability of its non-protonated form (Szatkowski & Thomas, 1989; Eisner et al. 1989; Church et al. 1998). Superfusion of thalamic slices with 20 mM TMA for 10 min led to a distinct intracellular alkalinization of TC neurones, as revealed by the decrease in the BCECF fluorescence ratio (F440/F495) by about 30 % (mean = 30.7 ± 4.8 %, n = 6, Fig. 4C, bottom trace). Assuming an interstitial pH within the slice of 7.15-7.25, the estimated shift in pHi was 0.28-0.3 pH units, from an initial pHi of 6.95-7.05. The effect of TMA-induced intracellular alkalinization on the Ih of TC neurones was measured 8-10 min after TMA addition, as shown in Fig. 4A. For a given test pulse (from -38 to -93 mV in this cell), the steady-state current amplitude of Ih increased as compared to control values. Upon washout of TMA (10 min), Ih amplitude returned to control levels (Fig. 4A). The increase in h-current amplitude was due to a reversible shift in the activation curve to more positive values, as illustrated in Fig. 4B. The half-activation potential significantly (P < 0.01, paired t test) shifted from V½= -88.8 ± 3.9 mV (k = 9.2± 1.1, n = 5) to V½= -83.9 ± 4.4 mV (k = 8.8± 1.5, n = 5) in the presence of TMA. The fully activated conductance underlying Ih and the extrapolated reversal potential of Ih were not significantly changed (data not shown). By comparison, weak acids such as lactate have been shown to induce a fall in pHi (Szatkowski & Thomas, 1989; Church et al. 1998). Application of 20 mM lactate with the superfusate for 10-15 min caused a slow monophasic intracellular acidification, as revealed by the increase in F440/F495 by about 9 % (mean = 8.8 ± 1.4 %, n = 5, Fig. 4C, top trace; corresponding to an estimated fall in pHi by 0.08-0.1 pH units), and had only a moderate effect on Ih. The steady-state amplitude of Ih, as measured during a period of 10-12 min after addition of lactate, was reduced upon a step hyperpolarization to -93 mV (Fig. 4A), due to a shift in the mean half-activation potential to V½= -91.5 ± 3.7 mV (k = 8.7± 0.7, n = 5) as compared to the control value (Fig. 4B, P≤ 0.05, paired t test). Upon washout, the effect of lactate was fully reversible (Fig. 4A and C).
Figure 4. Modulation of Ih by intracellular acidification and alkalinization.
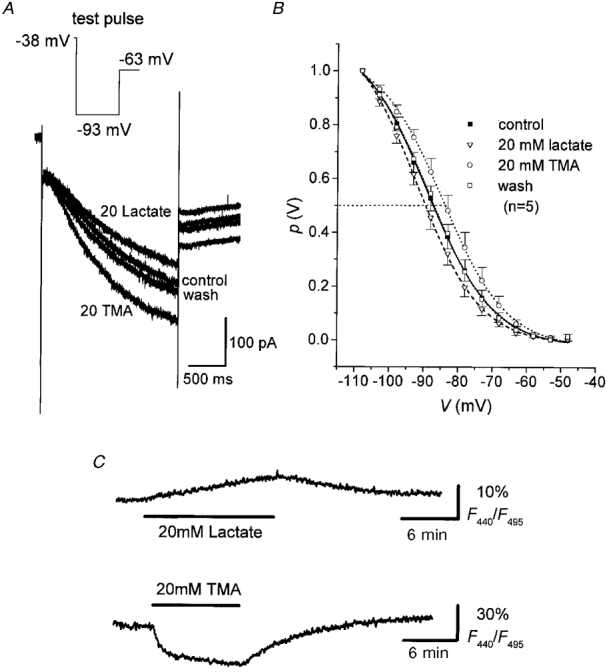
A, family of current responses to hyperpolarizing test pulses (see inset) under control conditions and in the presence of either TMA or lactate, as indicated. B, steady-state activation curves plotted from normalized tail current amplitudes recorded in ACSF (control), 8-10 min after addition of TMA or lactate and after 10 min wash with ACSF. Continuous lines represent best fits of a Boltzmann distribution to the data points. Data represent means (n as indicated) and s.e.m.C, plots of BCECF fluorescence ratio (F440/F495, expressed as a percentage) versus time measured in TC neurones upon superfusion of the slices with 20 mM TMA or 20 mM lactate. Upward deflection of F440/F495 indicates an acidosis. Acquisition rate was 1 Hz. The cell was loaded with 10 μm BCECF via the patch pipette.
In the next experimental step, the possibility was investigated that the effect of pHi changes on Ih is mediated via modulation of adenylate cyclase activity and subsequent changes in the intracellular cAMP concentration (see Pape, 1996). Addition of the adenylate cyclase activator forskolin (10 μm) to the superfusing solution increased Ih elicited by step hyperpolarizations (10 min after forskolin application) from -48 to -98 mV (Fig. 5A) and shifted V½ to -82.9 ± 2.1 mV (k = 7.8± 1.0, n = 5), as compared to control (V½= -88.2 ± 2.6 mV, k = 7.5 ± 0.7, n = 5). Additional application of lactate or TMA revealed that forskolin-upregulated Ih was still modulated by lactate-induced intracellular acidification or TMA-induced intracellular alkalinization (Fig. 5A and B). The half-maximal activation voltage significantly (P≤ 0.05, paired t test) shifted to V½= -85.5 ± 3.7 mV (k = 7.7± 1.1, n = 5) upon exposure to lactate (20 mM) and to V½= -79.9 ± 3.6 mV (k = 7.1± 1.7, n = 5) after addition of TMA (20 mM). To corroborate these findings, the effects of lactate and TMA were tested on TC neurones recorded with cAMP (100 μm) in the pipette solution, which shifts the voltage dependence of activation presumably by a direct effect on the channels underlying Ih (reviewed by Pape, 1996). In the presence of intracellular cAMP (100 μm), step hyperpolarizations to -98 mV revealed a decrease in Ih amplitude upon addition of lactate and an increase in Ih amplitude following application of TMA (Fig. 5C). Analysis of the activation curves of Ih revealed a modulation of the voltage dependence of activation (Fig. 5D). Lactate (20 mM) significantly (P < 0.01, paired t test) shifted the activation curve to more negative potentials (V½= -89.9 ± 2.2 mV, k = 7.5± 0.8, n = 5), whereas TMA (20 mM) induced a rightward shift to more positive potentials (V½= -84.3 ± 2.2 mV, k = 6.6± 0.9, n = 5) as compared to control (with 100 μm cAMP, V½= -86.6 ± 2.1 mV, k = 7.4± 0.7, n = 5). The findings suggest that the effects of TMA and lactate occur through a pathway independent of the adenylate cyclase-cAMP system and may be due, at least partly, to a direct effect of pHi on the properties of Ih channels.
Figure 5. Influence of the adenylate cyclase-cAMP system on TMA and lactate effects on Ih.
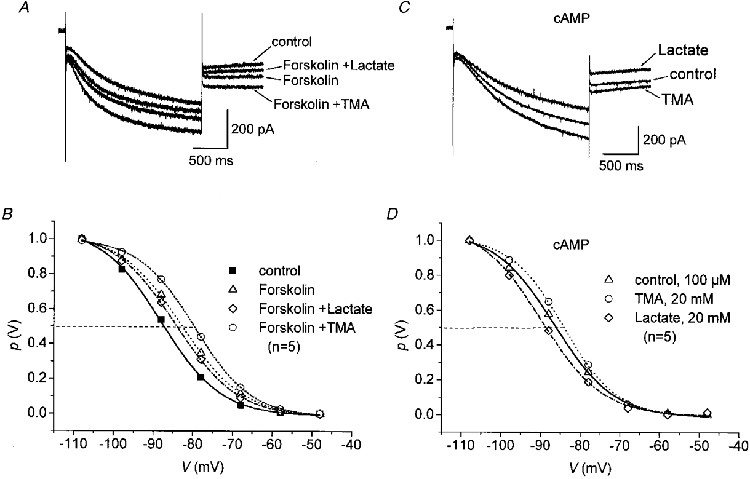
A, examples of current responses to hyperpolarizing voltage steps from -48 to -98 mV recorded under control conditions in the presence of forskolin (10 μm), and during addition of lactate (20 mM) or TMA (20 mM) to the forskolin-containing solution. B, steady-state activation curves recorded under control conditions, after bath application of 10 μm forskolin and 8-10 min after addition of either 20 mM lactate or 20 mM TMA in the presence of forskolin (data averaged from recordings in 5 cells). C, family of current responses to voltage steps to -98 mV with cAMP (100 μm) in the pipette solution (control) and after addition of lactate (20 mM) and TMA (20 mM). D, activation curves recorded with 100 μm cAMP in the patch pipette solution 8-10 min after application of 20 mM lactate or 20 mM TMA with the superfusing solution (n = 5). Continuous lines in A and B represent fits of a Boltzmann distribution. Error bars were omitted for clarity.
Effects of changes in bath pH
In order to test for a dependence of Ih of TC neurones on extracellular pH, slices were superfused with Hepes-buffered ACSF titrated to different pH values, and h-currents were elicited by step hyperpolarizations as before. Figure 6A illustrates sample current traces obtained from one cell successively superfused with salines of different bath pH (pHb), as indicated. The Ih activation curves (Fig. 6B) constructed from these experiments (measured 8-13 min after changing bath pH) revealed no significant differences (P > 0.1) between the half-activation voltages of cells recorded in salines of pHb 6.8 (V½= -86.6 ± 2.9 mV, k = 9.7± 0.7, n = 5), pHb 7.2 (V½= -85.1 ± 2.8 mV, k = 9.5± 0.6, n = 5) and pHb 7.6 (V½= -83.8 ± 2.3 mV, k = 8.9± 0.2, n = 5). Furthermore, there were no statistically significant differences in the fully activated conductance or extrapolated reversal potential of Ih (data not shown). Monitoring BCECF fluorescence in a different sample of TC neurones under the same experimental conditions revealed moderate changes in pHi upon changes of the pH of the superfusate (Fig. 6C). F440/F495 decreased by 5.9 ± 2.4 % (n = 5) upon changing bath pH for 10-15 min from 7.2 to 7.6 and increased by 5.3 ± 1.4 % (n = 5) upon changing bath pH to 6.8, indicating a moderate intracellular alkalinization of TC neurones in more alkaline superfusate and intracellular acidification in more acidic superfusate.
Figure 6. Effects of Hepes-buffered solutions on Ih and on pHi.
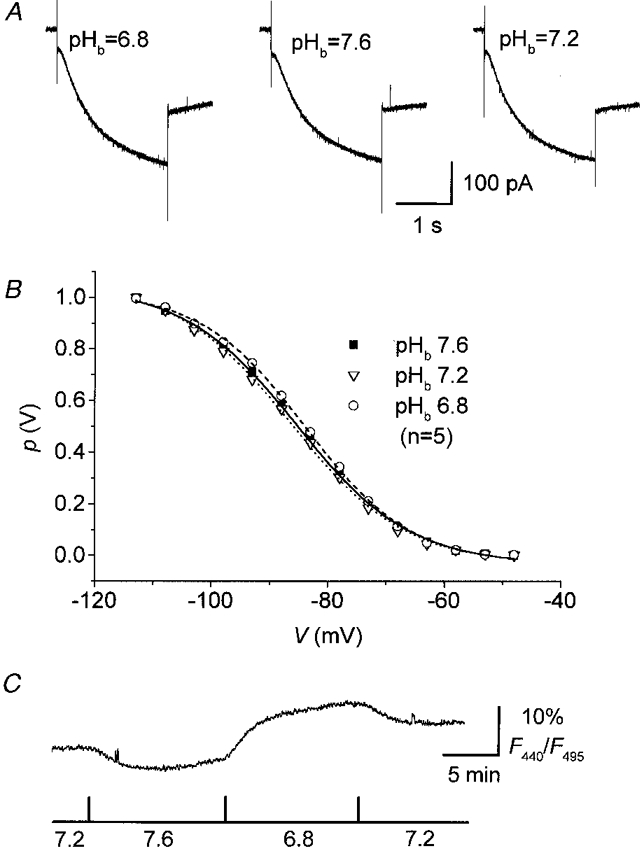
A, current responses to hyperpolarizing voltage steps from a holding potential of -48 mV to -108 mV recorded in Hepes-buffered bathing solutions of different pH values. B, steady-state activation curves recorded at different pH values of Hepes-buffered salines, as indicated. Continuous lines in B represent best fits to a Boltzmann distribution. Error bars were omitted for clarity. C, plot of BCECF fluorescence (F440/F495 expressed as a percentage) vs. time measured in TC neurones superfused with Hepes-buffered salines of different pH. Upward deflection of F440/F495 indicates an acidosis. Aquisition rate was 1 Hz. The cell was loaded with 10 μm BCECF.
Since superfusion of the slices with Hepes-buffered salines may probably wash out most of the HCO3−, and a pHo sensitivity of Ih may depend on the presence of HCO3− as the main buffer (Church, 1992), we changed the [HCO3−] of the saline at constant pCO2 and varied pHb. Under these conditions, there was no indication of pHb-dependent changes in either the time course of activation of Ih or the steady-state amplitude of Ih (Fig. 7A). Significant differences in the half-activation voltage of Ih of neurones recorded in salines of pHb 7.2 (V½= -91.4 ± 1.9 mV, k = 8.3± 1.1, n = 5) and pHb 7.5 (V½= -90.8 ± 2.3 mV, k = 7.8± 0.7, n = 5) (Fig. 7B) and in the fully activated conductance or the reversal potential of Ih did not occur (data not shown). Monitoring BCECF fluorescence under these conditions revealed even smaller changes in F440/F495 upon changing bath pH (Fig. 7C). Superfusion of the slices for 10-15 min with a solution of pH 7.5 decreased F440/F495 by 3.7 ± 1.2 % (n = 4), and a bath pH of 6.9 increased F440/F495 by 2.5 ± 0.4 % (n = 4).
Figure 7. Lack of significant pHb dependence of Ih and pHi in HCO3−-buffered saline.
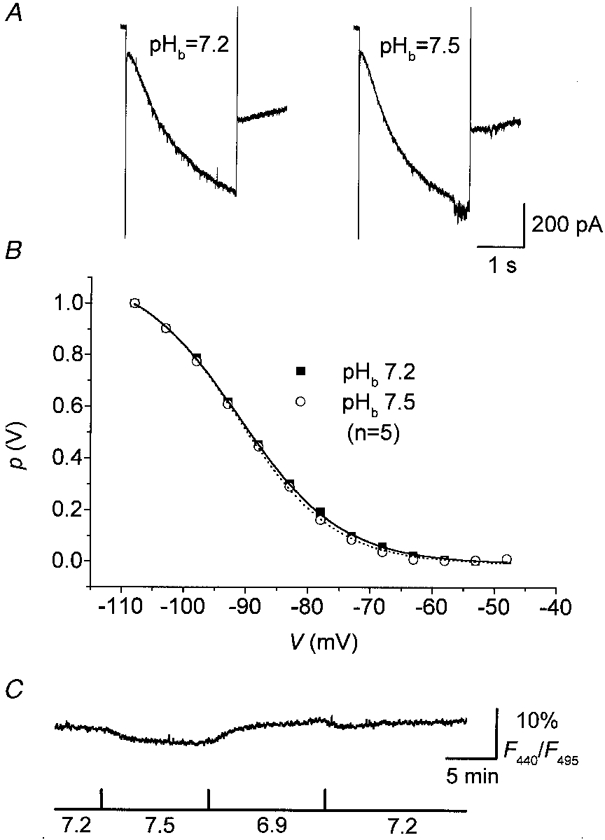
Current responses to hyperpolarizing test pulses (A) and steady-state activation curves (B) of VB neurones recorded in HCO3−-buffered salines of different pH values. Continuous lines in B represent best fits to a Boltzmann distribution. Error bars were omitted for clarity. C, plot of BCECF fluorescence (F440/F495, expressed as a percentage) vs. time measured in VB neurones superfused with HCO3−-buffered salines of different pH. Upward deflection of F440/F495 corresponds to an intracellular acidosis. Aquisition rate was 1 Hz. The cell was loaded with 10 μm BCECF.
Activity-dependent effects on Ih
Since increased activity is typically associated with a slow intracellular acidification in mammalian neurones (reviewed in Chesler, 1990; and Kaila & Ransom, 1998), we tested whether activity-dependent changes in pHi affect Ih in TC neurones. Changes in intracellular pH upon repetitive stimulation under voltage clamp conditions with depolarizing pulse trains were directly monitored with BCECF (Fig. 8A). Repetitive stimulation with 10 depolarizing pulse trains at a frequency of 0.1 Hz led to a pronounced acidification of TC, as revealed by the distinct increase in F440/F495 of about 40 % (mean = 34.8 ± 6.1 %, n = 11, Fig. 8A). According to the estimations of changes in pHi induced by TMA and lactate this corresponds to a shift in pHi of 0.34-0.4 pH units. Immediately before and after 10 trains, Ih was activated by a hyperpolarizing voltage step to -93 mV of 2 s duration from a holding potential of -38 mV (Fig. 8B). In addition, stepping back to -63 mV following the 2 s voltage step now evoked a T current. These pulse train-evoked T currents were not further investigated in this study. The activity-dependent intracellular acidification resulted in a slower time course of activation and a strongly reduced h-current amplitude (Fig. 8B). These findings support the hypothesis that activity-related pHi shifts may contribute to the control of rhythmic burst firing in TC neurones via modulation of Ih.
Figure 8. Reduction of Ih by activity-dependent intracellular acidification.
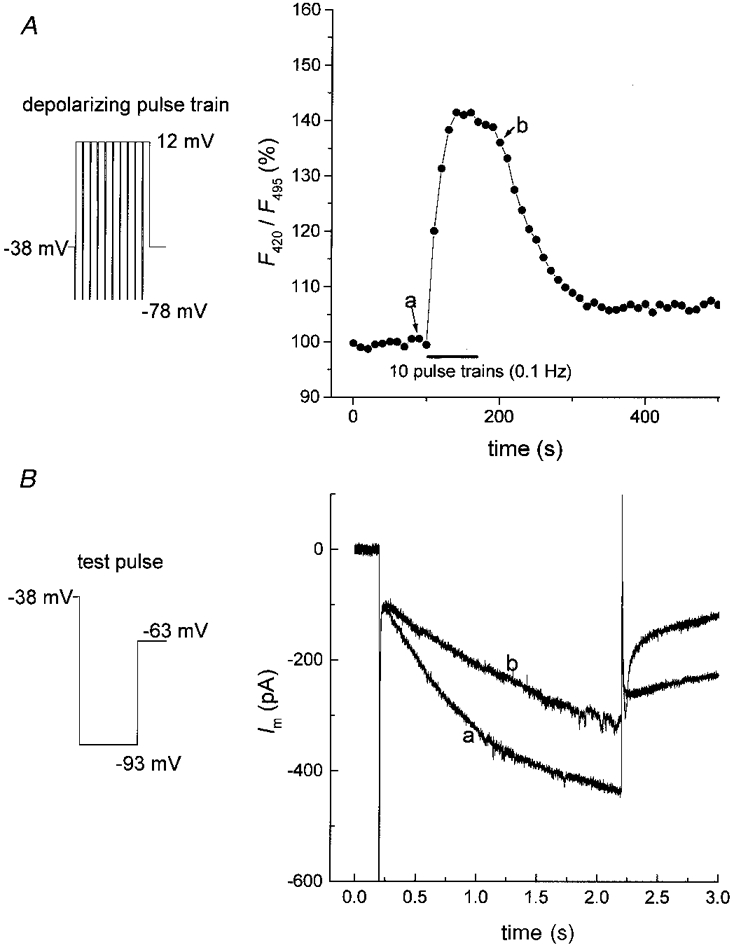
A, plot of BCECF fluorescence ratio (F440/F495) versus time of a VB neurone recorded before, during and after stimulation with 10 pulse trains delivered at 0.1 Hz (each train consisting of 10 pulses of 100 ms duration to +12 mV, separated by hyperpolarizing steps of 25 ms duration to -78 mV; see inset in A). At the points indicated by a and b, test pulses to -93 mV (see inset in B) were applied and the resulting current responses are shown in B. F440/F495 was monitored in a somatic region of the cell, following loading with 50 μm BCECF via the patch pipette. Upward deflection of F420/F495 indicates an intracellular acidosis.
DISCUSSION
The present investigation indicates that intracellular H+ may act as an modulator of Ih, relating activity-dependent shifts in intracellular pH to changes in the excitability of TC neurones. Activity-related acidification leads to downregulation of Ih, while alkalinization upregulates Ih, due to shifts in its voltage dependence of activation.
Mechanism of Ih modulation by H+
The channels underlying Ih are characterized by their sensitivity to low concentrations of extracellular Cs+ and their relative insensitivity to extracellular Ba2+, which makes these ions suitable tools to isolate the hyperpolarization-activated cation current from other inwardly rectifying conductances such as IKir (for review see Pape, 1996). As there is evidence for the existence of IKir in TC neurones (Karschin et al. 1996; Williams et al. 1997), and some members of the family of Kir channels have been shown to be particularly sensitive to changes in intracellular pH in the physiological range (for review see Fakler & Ruppersberg, 1996), particular care was taken in the present study to block the instantaneous inward rectifier current and an as yet unidentified leak current with Ba2+, in order to study the pH sensitivity of Ih in isolation.
Effects of various ions on Ih have been extensively studied in neuronal preparations (Pape, 1996). Among them, a depressant effect of extracellular H+ on Ih was observed in lobster stretch receptor neurones and was suggested to contribute to the control of membrane excitability during varying external conditions (Edman & Grampp, 1991). Cultured neurones of the fetal rat medulla were recently shown to be inhibited by increases in bath pCO2, mediated by CO2/H+-induced inhibition of Ih (Wellner-Kienitz & Shams, 1998). However, the site of action of H+ and the underlying biophysical mechanisms remained largely unclear, in particular because changes in intracellular pH due to variations of pHo could not be ruled out, as has been shown, for instance, for cultured rat hippocampal neurones (Church et al. 1998). In the present study moderate changes in pHi were caused by changes in bath pH. However, these changes in pH of Hepes-buffered solutions or changes in the [HCO3−] at constant pCO2 showed no significant effects on the voltage dependence or conduction properties of Ih. Two major explanations may account for this: either the shifts in pHi in response to changes in pHb were insufficient to modulate the channels underlying Ih or the actual pHo shifts near the cellular membrane were much smaller than those measured in the bath solution (Trapp et al. 1996a).
The shift in the activation curve of Ih, but unaltered fully activated conductance and reversal potential, indicates that changes in pHi affect the gating properties rather than the conductance of the channels underlying Ih. These conclusions are different from those obtained in lobster stretch receptor neurones and fetal rat medulla neurones, in which H+ decreased the conductance of Ih without affecting its voltage dependence (Edman & Grampp, 1991; Wellner-Kienitz & Shams, 1998). Based upon the observation of a small but significant shift in the reversal potential, it was concluded that variations in pHo lower the Ih channel conductivity for Na+ more than for K+.
In several neuronal and non-neuronal cell types including TC neurones in rat thalamus, modulation of the voltage dependence of Ih was shown to be mediated by the intracellular adenylate cyclase-cAMP system (for review see Pape, 1996). Therefore, changes in the intracellular cAMP concentration as a result of adenylate cyclase activation would shift the activation curve of Ih to more positive potentials. Different subtypes of adenylate cyclase (type I and VIII) were found to be expressed in the rat thalamus (Matsuoka et al. 1997) and H+ is capable of modulating the basal activity of adenylate cyclase (Johnson, 1982), which, in turn, might affect pHi via the cAMP system. Therefore, the question arises whether H+ directly affects h-channels or acts through modulation of adenylate cyclase activity and hence the cAMP level. In the present study lactate- and TMA-induced effects on Ih were not occluded by near-maximal stimulation of adenylate cyclase activity through forskolin (10 μm) or addition of 100 μm cAMP to the internal solution. These results argue in favour of a direct modulation of Ih channels through intracellular H+, although additional experiments should be performed addressing this issue. For instance, the genes encoding hyperpolarization-activated cation channels have recently been identified (Ludwig et al. 1998; Gauss et al. 1998; Santoro et al. 1998), and studies on single, re-expressed Ih channels will greatly facilitate the evaluation of the detailed mechanisms underlying modulatory influences.
Possible significance of Ih modulation by H+
Modulation of Ih has been shown to be important for the timing of rhythmic membrane potential oscillations in TC neurones (Bal & McCormick, 1996; Lüthi & McCormick, 1998).In particular, activity-related increases in the intracellular Ca2+ concentration resulting from rebound Ca2+ burst firing were shown to cause a persistent upregulation of Ih by shifting its activation curve to more positive potentials, presumably mediated via adenylate cyclase activity (Budde et al. 1997; Lüthi & McCormick, 1998). In addition, various other types of ions and second messenger pathways with important functional implications for the regulation of Ih have been reported in several neuronal preparations (see Pape, 1996 for review; Ingram & Williams, 1996; Cathala & Paupardin-Tritsch, 1997). This multitude of mechanisms suggests a rather complex scenario of Ih modulation. In the present study, repetitive activation of TC neurones with a stimulation protocol trying to follow as closely as possible the voltage responses during rhythmic oscillatory activity as, for instance, occurring during sleep spindle oscillations (Bal & McCormick, 1996; Budde et al. 1997) resulted in a pronounced transient intracellular acidification. This activity-related acidification is most likely to be due to secondary mechanisms, involving e.g. plasmalemmal Ca2+-H+ exchange, after stimulus-induced Ca2+ influx through voltage-gated Ca2+ channels (Schwiening & Boron, 1994; Ou-Yang et al. 1995; Trapp et al. 1996b). Our data provide direct evidence for the contribution of activity-related intracellular pH shifts in the modulation of Ih. Intracellular alkalinization results in upregulation of Ih and intracellular acidification, occurring during repetitive activity, results in downregulation of Ih. Following from this is the conclusion that upregulation and downregulation of Ih, resulting from Ca2+ influx and subsequent intracellular acidification due to Ca2+-H+-exchange, may reciprocally interact, thereby forming an activity-dependent mechanism to control the temporal characteristics of rhythmic oscillations in the thalamocortical network.
Acknowledgments
Thanks are due to Mrs R. Ziegler for excellent technical assistance and to Dr T. Budde for comments on this manuscript. This work was supported by the Deutsche Forschungsgemeinschaft (Pa 336/13-1) and the Human Capital and Mobility Program of the European Science Foundation (CHRX-CT9-40543).
References
- Bal T, McCormick DA. What stops synchronized thalamocortical oscillations? Neuron. 1996;17:297–308. doi: 10.1016/s0896-6273(00)80161-0. [DOI] [PubMed] [Google Scholar]
- Budde T, Biella G, Munsch T, Pape H-C. Lack of regulation by intracellular Ca2+ of the hyperpolarization-activated cation current in rat thalamic neurones. The Journal of Physiology. 1997;503:79–85. doi: 10.1111/j.1469-7793.1997.079bi.x. [DOI] [PMC free article] [PubMed] [Google Scholar]
- Caspers H, Speckmann E-J. Cerebral pO2, pCO2 and pH: changes during convulsive activity and their significance for spontaneous arrest of seizures. Epilepsia. 1972;13:699–725. doi: 10.1111/j.1528-1157.1972.tb04403.x. [DOI] [PubMed] [Google Scholar]
- Cathala L, Paupardin-Tritsch D. Neurotensin inhibition of the hyperpolarization-activated cation current (Ih) in the rat substantia nigra pars compacta implicates the protein kinase C pathway. The Journal of Physiology. 1997;503:87–97. doi: 10.1111/j.1469-7793.1997.087bi.x. [DOI] [PMC free article] [PubMed] [Google Scholar]
- Chesler M. The regulation and modulation of pH in the nervous system. Progress in Neurobiology. 1990;34:401–427. doi: 10.1016/0301-0082(90)90034-e. [DOI] [PubMed] [Google Scholar]
- Chesler M, Kaila K. Modulation of pH by neuronal activity. Trends in Neurosciences. 1992;15:396–402. doi: 10.1016/0166-2236(92)90191-a. [DOI] [PubMed] [Google Scholar]
- Church J. A change from HCO3−-CO2- to Hepes-buffered medium modifies membrane properties of rat CA1 pyramidal neurones in vitro. The Journal of Physiology. 1992;455:51–71. doi: 10.1113/jphysiol.1992.sp019290. [DOI] [PMC free article] [PubMed] [Google Scholar]
- Church J, Baxter KA, McLarnon JG. pH modulation of Ca2+ responses and a Ca2+-dependent K+ channel in cultured rat hippocampal neurones. The Journal of Physiology. 1998;511:119–132. doi: 10.1111/j.1469-7793.1998.119bi.x. [DOI] [PMC free article] [PubMed] [Google Scholar]
- De Curtis M, Manfridi A, Biella G. Activity-dependent pH shifts and periodic recurrence of spontaneous interictal spikes in a model of focal epileptogenesis. Journal of Neuroscience. 1998;18:7543–7551. doi: 10.1523/JNEUROSCI.18-18-07543.1998. [DOI] [PMC free article] [PubMed] [Google Scholar]
- Desthexe A, Bal T, McCormick DA, Sejnowski TJ. Ionic mechanism underlying synchronized oscillations and propagating waves in a model of ferret thalamic slices. Journal of Neurophysiology. 1996;76:2049–2070. doi: 10.1152/jn.1996.76.3.2049. [DOI] [PubMed] [Google Scholar]
- DiFrancesco D. Block and activation of the pace-maker channel in calf Purkinje fibres: effects of potassium, caesium and rubidium. The Journal of Physiology. 1982;329:485–507. doi: 10.1113/jphysiol.1982.sp014315. [DOI] [PMC free article] [PubMed] [Google Scholar]
- Dixon WJ, Massey FJ. Introduction to Statistical Analysis. 3. New York: McGraw Hill; 1969. [Google Scholar]
- Edman A, Grampp W. Ion (H+, Ca2+, Co2+) and temperature effects on a hyperpolarization-activated membrane current in the lobster stretch receptor neurone. Acta Physiologica Scandinavica. 1991;141:251–261. doi: 10.1111/j.1748-1716.1991.tb09075.x. [DOI] [PubMed] [Google Scholar]
- Eisner DA, Kenning NA, O'Neill SC, Pocock G, Richards CD, Valdeomilos M. A novel method for absolute calibration of intracellular pH indicators. Pflügers Archiv. 1989;413:553–558. doi: 10.1007/BF00594188. [DOI] [PubMed] [Google Scholar]
- Fakler B, Ruppersberg JP. Functional and molecular diversity classifies the family of inward-rectifier K+ channels. Cellular Physiology and Biochemistry. 1996;6:195–209. [Google Scholar]
- Gauss R, Seifert R, Kaupp UB. Molecular identification of a hyperpolarization-activated channel in sea urchin sperm. Nature. 1998;393:583–587. doi: 10.1038/31248. [DOI] [PubMed] [Google Scholar]
- Ingram S, Williams J. Modulation of the hyperpolarization-activated current (Ih) by cyclic nucleotides in guinea-pig primary afferent neurones. The Journal of Physiology. 1996;492:97–106. doi: 10.1113/jphysiol.1996.sp021292. [DOI] [PMC free article] [PubMed] [Google Scholar]
- Johnson RA. Changes in pH sensitivity of adenylate cyclase specifically induced by fluoride and vanadate. Archives of Biochemistry and Biophysics. 1982;218:68–76. doi: 10.1016/0003-9861(82)90322-8. [DOI] [PubMed] [Google Scholar]
- Kaila K, Ransom BR. pH and Brain Function. New York: Wiley-Liss; 1998. [Google Scholar]
- Karschin C, Dißmann E, Stühmer W, Karschin A. IRK(1–3) and GIRK(1–4) inwardly rectifying K+ channel mRNAs are differentially expressed in the adult rat brain. Journal of Neuroscience. 1996;16:3559–3570. doi: 10.1523/JNEUROSCI.16-11-03559.1996. [DOI] [PMC free article] [PubMed] [Google Scholar]
- Leresche N, Lightowler S, Soltesz I, Jassik-Gerschenfeld D, Crunelli V. Low frequency oscillatory activities intrinsic to rat and cat thalamocortical cells. The Journal of Physiology. 1991;441:155–174. doi: 10.1113/jphysiol.1991.sp018744. [DOI] [PMC free article] [PubMed] [Google Scholar]
- Ludwig A, Zong X, Jeglitsch M, Hofmann F, Biel M. A family of hyperpolarization-activated mammalian cation channels. Nature. 1998;393:587–591. doi: 10.1038/31255. [DOI] [PubMed] [Google Scholar]
- Lüthi A, McCormick DA. Periodicity of thalamic synchronized oscillations: the role of Ca2+-mediated upregulation of Ih. Neuron. 1998;20:553–563. doi: 10.1016/s0896-6273(00)80994-0. [DOI] [PubMed] [Google Scholar]
- McCormick DA, Bal T. Sleep and arousal: thalamocortical mechanisms. Annual Review of Neuroscience. 1997;20:185–215. doi: 10.1146/annurev.neuro.20.1.185. [DOI] [PubMed] [Google Scholar]
- McCormick DA, Pape H-C. Properties of a hyperpolarization-activated cation current and its role in rhythmic oscillation in thalamic relay neurones. The Journal of Physiology. 1990a;431:291–318. doi: 10.1113/jphysiol.1990.sp018331. [DOI] [PMC free article] [PubMed] [Google Scholar]
- McCormick DA, Pape H-C. Noradrenergic and serotonergic modulation of a hyperpolarization-activated cation current in thalamic relay neurones. The Journal of Physiology. 1990b;431:319–342. doi: 10.1113/jphysiol.1990.sp018332. [DOI] [PMC free article] [PubMed] [Google Scholar]
- Matsuoka I, Suzuki Y, Defer N, Nakanishi H, Hanoune J. Differential expression of type I, II and V adenylyl cyclase genes in the postnatal developing rat brain. Journal of Neurochemistry. 1997;68:498–506. doi: 10.1046/j.1471-4159.1997.68020498.x. [DOI] [PubMed] [Google Scholar]
- Moody WJ. Effects of intracellular H+ on the electrical properties of excitable cells. Annual Review of Neuroscience. 1984;7:257–278. doi: 10.1146/annurev.ne.07.030184.001353. [DOI] [PubMed] [Google Scholar]
- Moody WJ, Hagiwara S. Block of inward rectification by intracellular H+ in immature oocytes of the starfish Mediaster aequalis. Journal of General Physiology. 1982;79:115–130. doi: 10.1085/jgp.79.1.115. [DOI] [PMC free article] [PubMed] [Google Scholar]
- Munsch T, Pape H-C. Modulation by intracellular pH of the hyperpolarization-activated cation current (Ih) in rat thalamic relay neurones. European Journal of Neuroscience. 1998;10(suppl. 10):176. [Google Scholar]
- Niedermeyer E. The Epilepsies: Diagnosis and Management. Baltimore, MD, USA: Urban and Schwarzenberg; 1990. [Google Scholar]
- Ou-Yang Y-B, Kristián T, Kristiánová V, Mellergard P, Siesjö BK. The influence of calcium transients on intracellular pH in cortical neurons in primary culture. Brain Research. 1995;676:307–313. doi: 10.1016/0006-8993(95)00056-v. [DOI] [PubMed] [Google Scholar]
- Pape H-C. Specific bradycardic agents block the hyperpolarization-activated cation current in central neurons. Neuroscience. 1994;59:363–373. doi: 10.1016/0306-4522(94)90602-5. [DOI] [PubMed] [Google Scholar]
- Pape H-C. Queer current and pacemaker: the hyperpolarization-activated cation current in neurons. Annual Review of Physiology. 1996;58:299–327. doi: 10.1146/annurev.ph.58.030196.001503. [DOI] [PubMed] [Google Scholar]
- Schwiening CJ, Boron WF. Regulation of intracellular pH in pyramidal neurones from the rat hippocampus by Na+-dependent Cl−-HCO3− exchange. The Journal of Physiology. 1994;475:59–67. doi: 10.1113/jphysiol.1994.sp020049. [DOI] [PMC free article] [PubMed] [Google Scholar]
- Santoro B, Liu DT, Yao H, Bartsch D, Kandel ER, Siegelbaum SA, Tibbs GR. Identification of a gene encoding a hyperpolarization-activated pacemaker channel of brain. Cell. 1998;93:717–729. doi: 10.1016/s0092-8674(00)81434-8. [DOI] [PubMed] [Google Scholar]
- Soltesz I, Ligthowler S, Leresche N, Jassik-Gerschenfeld D, Pollard CE, Crunelli V. Two inward currents and the transformation of low-frequency oscillations of rat and cat thalamo-cortical cells. The Journal of Physiology. 1991;441:175–197. doi: 10.1113/jphysiol.1991.sp018745. [DOI] [PMC free article] [PubMed] [Google Scholar]
- Steriade M, Deschênes M. The thalamus as a neuronal oscillator. Brain Research Reviews. 1984;8:1–63. doi: 10.1016/0165-0173(84)90017-1. [DOI] [PubMed] [Google Scholar]
- Steriade M, Jones EG, McCormick DA. Organization and function. Vol. 1. New York: Elsevier Science; 1997. Thalamus. [Google Scholar]
- Steriade M, McCormick DA, Sejnowski TJ. Thalamocortical oscillations in the sleeping and aroused brain. Science. 1993;262:679–685. doi: 10.1126/science.8235588. [DOI] [PubMed] [Google Scholar]
- Szatkowski MS, Thomas RC. New method for calculating pHi from accurately measured changes in pHi induced by a weak acid and base. Pflügers Archiv. 1986;407:59–63. doi: 10.1007/BF00580721. [DOI] [PubMed] [Google Scholar]
- Szatkowski MS, Thomas RC. The intrinsic intracellular H+ buffering power of snail neurons. The Journal of Physiology. 1989;409:89–101. doi: 10.1113/jphysiol.1989.sp017486. [DOI] [PMC free article] [PubMed] [Google Scholar]
- Tombaugh GC, Somjen GG. Effects of extracellular pH on voltage-gated Na+, K+ and Ca2+ currents in isolated rat CA1 neurons. The Journal of Physiology. 1996;493:719–732. doi: 10.1113/jphysiol.1996.sp021417. [DOI] [PMC free article] [PubMed] [Google Scholar]
- Tong CK, Chesler M. Activity-evoked extracellular pH shifts in slices of rat dorsal lateral geniculate nucleus. Brain Research. 1999;815:373–381. doi: 10.1016/s0006-8993(98)01059-2. [DOI] [PubMed] [Google Scholar]
- Trapp S, Lückermann M, Brooks PA, Ballanyi K. Acidosis of rat dorsal vagal neurons in situ during spontaneous and evoked activity. The Journal of Physiology. 1996a;496:695–710. doi: 10.1113/jphysiol.1996.sp021720. [DOI] [PMC free article] [PubMed] [Google Scholar]
- Trapp S, Lückermann M, Kaila K, Ballanyi K. Acidosis of hippocampal neurones mediated by a plasmalemmal Ca2+/H+ pump. NeuroReport. 1996b;7:2000–2004. doi: 10.1097/00001756-199608120-00029. [DOI] [PubMed] [Google Scholar]
- Traynelis SF, Cull-Candy SG. Proton inhibition of N-methyl-D-aspartate receptors in cerebellar neurons. Nature. 1990;345:347–350. doi: 10.1038/345347a0. [DOI] [PubMed] [Google Scholar]
- Wellner-Kienitz M-C, Shams H. Hyperpolarization-activated inward currents contribute to spontaneous electrical activity and CO2/H+ sensitivity of cultivated neurons of fetal rat medulla. Neuroscience. 1998;87:109–121. doi: 10.1016/s0306-4522(98)00159-6. [DOI] [PubMed] [Google Scholar]
- Williams SR, Turner JP, Hughes SW, Crunelli V. On the nature of anomalous rectification in thalamocortical neurones of the cat ventrobasal thalamus in vitro. The Journal of Physiology. 1997;505:727–747. doi: 10.1111/j.1469-7793.1997.727ba.x. [DOI] [PMC free article] [PubMed] [Google Scholar]