

Abstract
The effect on sarcoplasmic reticulum (SR) function of exposure to high intracellular [Ca2+] was studied in mechanically skinned fibres from the extensor digitorum longus muscle of the rat, using caffeine to assay the SR Ca2+ content.
A 15 s exposure to 50 μm Ca2+ irreversibly reduced the ability of the SR to load/retain Ca2+ and completely abolished depolarization-induced Ca2+ release, whereas a 90 s exposure to 10 μm Ca2+ had no detectable effect on either function. The reduction in net SR Ca2+ uptake: (a) was near-maximal with treatment at 50 μm Ca2+, (b) was unrelated to voltage-sensor function, and (c) persisted unchanged for > 20 min. The reduction was primarily due to a threefold increase in leakage of Ca2+ out of the SR. This increased leakage was not substantially blocked by the presence of 10 mM Mg2+ or 2 μm Ruthenium Red.
The adverse effect on SR function of exposure to high [Ca2+] could also be observed by the reduction in the ability of the SR to maintain a low [Ca2+] within the skinned fibre in the face of elevated [Ca2+] in the bathing solution. When bathed in a solution with ≈1.5 μm Ca2+ (0.75 mM CaEGTA-EGTA), skinned fibres produced only low force responses for many minutes, but after high [Ca2+] treatment (15 s exposure to 50 μm Ca2+) they showed large, steady or oscillatory force responses.
These findings indicate that, in addition to uncoupling the Ca2+ release channels from the voltage sensors, exposure of skinned fibres to high [Ca2+] causes a persistent increase in resting Ca2+ efflux from the SR. Such efflux in an intact fibre would alter the distribution of Ca2+ between the SR, the cytoplasm and the extracellular solution. These results may be relevant to the basis of low-frequency fatigue and possibly other conditions in muscle.
In skeletal muscle, force development by the contractile apparatus is regulated by the intracellular [Ca2+], which in the short term is predominantly influenced by the release and re-uptake of Ca2+ by the intracellular store, the sarcoplasmic reticulum (SR). In a sequence of events known as excitation-contraction (E-C) coupling, action potentials depolarize the transverse-tubular (T-) system, activating specialized voltage-sensor molecules (dihydropyridine receptors, DHPRs), which in turn open the ryanodine receptors/Ca2+-release channels in the adjacent SR membrane, allowing efflux of Ca2+ into the cytoplasm (Melzer et al. 1995). This E-C coupling process can be studied using mechanically skinned muscle fibres, which retain the normal voltage-sensor control of Ca2+ release, and yet allow rapid manipulation of the intracellular conditions (Lamb & Stephenson, 1990, 1991).
Excitation-contraction coupling in mechanically skinned fibres is extremely robust, and numerous large depolarization-induced responses can normally be elicited. However, it was found that if the intracellular [Ca2+] was raised to 100 μm for 10 s, depolarization-induced responses in rat extensor digitorum longus muscle (EDL) fibres were completely and irreversibly abolished, even though Ca2+ release could still be elicited by directly stimulating the release channels with caffeine (Lamb et al. 1995). Half-maximal effects occurred at ∼25 μm Ca2+ in EDL fibres and at ∼2- to 3-fold lower [Ca2+] in toad iliofibularis fibres. The uncoupling did not involve proteolysis of the ryanodine receptor/Ca2+-release channel, the α1-subunit of the DHPR or triadin, an associated protein. Furthermore, confocal microscopy of fluo-3 trapped in the T-system of skinned fibres showed that the T-system remained sealed in its entirety. Importantly, electron microscopy of fibres uncoupled by high [Ca2+] treatment revealed that the triad junction, where the T-system abuts the SR, was commonly distorted or even severed (Lamb et al. 1995), and this possibly explained the loss of communication between the DHPR/voltage sensors and the Ca2+-release channels.
Lamb et al. (1995) suggested that this Ca2+-dependent uncoupling causes the reduction in Ca2+ release that underlies ‘low-frequency fatigue’, the long-lasting muscle fatigue evident at low stimulus frequencies for up to 24 h after prolonged exercise (Edwards et al. 1977; Allen et al. 1995; Chin & Allen, 1996). Subsequent experiments with intact fibres of the mouse showed that procedures designed to give large elevations in intracellular [Ca2+] (e.g. tetanic stimulation in the presence of caffeine or a SR pump blocker) did indeed irreversibly reduce Ca2+ release and result in low-frequency fatigue (Chin & Allen, 1996; Chin et al. 1997). It was not clear, however, whether the high [Ca2+] exposure reduced Ca2+ release solely by disrupting the normal coupling mechanism, or whether it also caused some change in SR function and the distribution of Ca2+. One indication that SR function is indeed altered after induction of low-frequency fatigue is the finding that the resting [Ca2+] remains elevated, possibly owing to reduced Ca2+ pumping and increased Ca2+ leakage from the SR (Westerblad et al. 1993).
Here we directly examine whether exposure to high intracellular [Ca2+] modifies the ability of the SR to take up and retain Ca2+. We use caffeine to assay the Ca2+ content of the SR in skinned fibres and show that high [Ca2+] treatment induces a substantial increase in Ca2+ leakage from the SR. If this phenomenon occurs in vivo, it would ultimately affect the amount and distribution of Ca2+ within a muscle fibre and contribute to fatigue.
METHODS
Isolation of skinned fibres
Long-Evans hooded rats (Rattus norvegicus) aged 14 to 20 weeks were anaesthetized by halothane (2 % v/v) and killed by asphyxiation in accordance with guidelines of the La Trobe University Animal Ethics Committee. As described previously (Lamb & Stephenson, 1994), both extensor digitorum longus muscles were then removed and placed in paraffin oil and kept cool on ice. Single muscle fibres were dissected free at one end from the muscle and mechanically skinned. The skinned fibre segment was mounted onto a force transducer (AME875, SensoNor, Horten, Norway), and stretched to 120 % of its resting length. The fibre was then placed into a 2 ml Perspex bath containing a potassium or sodium 1,6-diaminohexane-N,N,N’,N‘-tetraacetic acid (HDTA) solution to equilibrate before being stimulated by rapid substitution of an appropriate solution. All experiments were performed at room temperature (23 ± 2°C).
Solutions
All chemicals were obtained from Sigma unless stated otherwise. The make-up of the solutions used in the different parts of the experiments is set out below. All solutions had a pH of 7.10 ± 0.01 and an osmolality of 295 ± 5 mosmol kg−1, and unless stated otherwise had 1 mM free Mg2+ and 8 mM total ATP. Free [Ca2+] at ≥ 0.1 μm was verified with a Ca2+-sensitive electrode (Orion, Cambridge, MA, USA).
Depolarization-induced Ca2+ release
Polarizing (K-HDTA) solution
Composition (mM): K+, 126; Na+, 37; HDTA2− (Fluka, Buchs, Switzerland), 50; total ATP, 8.0; total creatine phosphate, 10.0; total magnesium, 8.5; Hepes, 90; NaN3, 1.0; total EGTA; 0.05, with pCa (i.e. -log10[Ca2+]) 6.8.
Depolarizing (Na-HDTA) solution
Same as polarizing solution with all K+ replaced with Na+.
High [Ca2+] treatment
Rigor solution
Composition (mM): K+, 126; Na+, 37; HDTA2−, 68; total magnesium, 1.5; Hepes, 90; NaN3, 1.0; total EGTA, 0.1; with pCa 7.2. This is similar to the polarizing K-HDTA solution, but with all ATP and creatine phosphate replaced with HDTA. Used to initially induce rigor.
Ca2+ rigor solutions
Similar to above rigor solution, but with calcium added to give a free [Ca2+] of 10, 40, 50 or 130 μm. Applied after inducing rigor in absence of Ca2+.
Caffeine-induced Ca2+ release
Pre-equilibration solution
K-HDTA solution similar to polarizing solution but with 0.5 mM total EGTA (or 0.5 mM BAPTA) at pCa 8. Used to ensure Ca2+ buffer is present in the fibre space before caffeine application.
Caffeine solution
K-HDTA solution with (mM): caffeine, 30; free Mg2+, 0.015 (total magnesium, 1.1); and EGTA, 0.5 (or BAPTA) at pCa 8, but otherwise similar to pre-equilibration solution. Used to induce release of all SR Ca2+.
Wash solution
Identical to pre-equilibration solution. Used to wash out caffeine.
Load solution
K-HDTA solution with 1 mM total EGTA at pCa 6.7 (or 6.4), but otherwise similar to pre-equilibration solution. Used to reload SR with Ca2+.
Leak solution
K-HDTA solution with 2 mM total EGTA (pCa > 8), but otherwise similar to pre-equilibration solution. Used to allow Ca2+ leakage from the SR in the absence of Ca2+ uptake.
Additional matching solutions were also made with 10 mM free Mg2+ (22.7 mM total magnesium) or with all K+ replaced with Na+ (for chronic T-system depolarization).
Contractile apparatus experiments
Relaxing solution
Potassium solution with 50 mM EGTA (pCa > 9), which is similar to the polarizing solution with all HDTA replaced with EGTA (see Stephenson & Williams, 1981).
Maximum-activation solution
Same as Relaxing solution but with 50 mM CaEGTA (pCa 4.5). Referred to as ‘Max’ in the figures.
Solutions of intermediate [Ca2+] were made by appropriate mixture of these two solutions.
Caffeine-induced Ca2+ release experiments
The skinned fibre was initially equilibrated for 2 min in the polarizing (K-HDTA) solution before commencement of repeated cycles of Ca2+ release and reloading. The Ca2+ content of the SR was assayed by pre-equilibrating the skinned fibre in 0.5 mM EGTA (pCa 8) (pre-equilibration solution) for 10 s, and then triggering rapid Ca2+ release in the 30 mM caffeine-low [Mg2+] solution with 0.5 mM EGTA (caffeine solution). In specified experiments, the Ca2+ buffering was altered in both the pre-equilibration and caffeine solutions (to 1.5 mM EGTA or 0.5 mM BAPTA). As shown in Results, the area (i.e. time integral) of the resulting force response is indicative of the amount of Ca2+ in the SR. The fibre was left in the caffeine solution for 2 min to ensure complete Ca2+ depletion (Fryer & Stephenson, 1996), washed for 30 s in the wash solution and then reloaded for set times in the load solution. The fibre was then either immediately fully depleted again with the caffeine solution or left to ‘leak’ Ca2+ for a specified time in the leak solution before being fully depleted. Fibres in which the area of the caffeine response altered by more than 10 % over three successive control load-release cycles were not further examined (< 20 % of fibres tested). When investigating the effects of 10 mM Mg2+ or 2 μm Ruthenium Red (RR) on Ca2+ leakage, these agents were present in the wash, load and leak solutions, but were not present in the pre-equilibration and caffeine solutions.
High [Ca2+] treatment
Skinned fibres were treated with high [Ca2+] in the absence of ATP, whilst they were in rigor. This was achieved by first placing the fibre in a low [Ca2+] solution with no ATP (rigor solution) for 1 min, over which time the fibre developed a steady level of rigor force (Fig. 3). The fibre was then transferred to a similar solution with elevated [Ca2+] (Ca2+ rigor solutions - see above) for either 90 s (10 μm Ca2+) or 15 s (for higher [Ca2+]), and then moved back to the rigor solution without Ca2+ for a further 15 s to wash out the Ca2+. Finally, the fibre was returned to the K-HDTA solution with ATP and it relaxed again. To determine the effect of rigor treatment alone, fibres were kept in the rigor solution (i.e. low [Ca2+]) for a total of 2 min without any exposure to high [Ca2+] (e.g. first rigor episode in Fig. 3). When a fibre was transferred between different rigor solutions, the force level often decreased to a lower level due to the slight stretching at the air-water interface and the inability of the fibre to recover its force level whilst in rigor (Fig. 3). Throughout the text, unless specified otherwise, the term ‘high [Ca2+] treatment’ refers to a 15 s exposure to 50 μm Ca2+ during rigor.
Figure 3. Exposure to high [Ca2+] reduces the size of subsequent caffeine responses.

The area of the force response to the caffeine stimulus was reduced substantially after exposure to 50 μm Ca2+ for 15 s (with ATP absent and the fibre in rigor), but not after similar treatment without raised [Ca2+]. Time scale: 2 s during caffeine stimulus and 30 s elsewhere.
RESULTS
Abolition of depolarization-induced force responses
As described previously (Lamb et al. 1995), raising the intracellular [Ca2+] to very high levels abolishes depolarization-induced force responses (Fig. 1). In the experiments here, the high [Ca2+] was applied in the absence of ATP (see Methods) in order to prevent Ca2+ uptake by the SR from modifying the [Ca2+] within the fibre. It was shown previously that high intracellular [Ca2+] causes such uncoupling irrespective of whether ATP was present or not (Lamb et al. 1995). The effect is evidently steeply dependent on the applied [Ca2+] because a 90 s exposure to 10 μm Ca2+ had no effect on the size of the response to depolarization (98 ± 2 % of control level) in the three EDL fibres examined, whereas a subsequent 15 s exposure to 50 μm Ca2+ caused complete abolition of depolarization-induced responses in the same three fibres (Fig. 1), as well as in every fibre examined without a preceding exposure to 10 μm Ca2+ (seven fibres from five different rats). This effect was shown to occur in tandem with the alteration in the caffeine response described below, using the same solutions and fibres from the same muscles. Following exposure to 50 μm Ca2+, no depolarization-induced responses could be elicited whatsoever for the remainder of the experiment, which could be 30 min or more. In contrast, substantial Ca2+ release from the SR could still be elicited by directly stimulating the Ca2+ release channels with caffeine (Fig. 1) or with low free [Mg2+] (not shown, see Lamb et al. 1995). Furthermore, depolarization-induced responses could not be restored by loading the SR with Ca2+ to even above its endogenous level. Thus, it is apparent that the abolition of the depolarization-induced responses is not simply due to depletion of releasable Ca2+ and must involve disruption of the normal E-C coupling mechanism.
Figure 1. Exposure to high cytoplasmic [Ca2+] abolishes E-C coupling in skinned fibres.

In a mechanically skinned EDL fibre of the rat, Na+ substitution depolarizes the sealed T-system (Depol) eliciting Ca2+ release from the SR and a large force response. Exposure of the fibre to 10 μm Ca2+ for 90 s did not affect the coupling, but exposure to 50 μm Ca2+ for 15 s caused complete abolition of depolarization-induced responses, even though caffeine (30 mM caffeine with low [Mg2+] and 0.5 mM EGTA) could still directly elicit Ca2+ release. Where indicated, the SR was additionally loaded for 20 s at pCa 6.7 (1 mM total EGTA) to ensure there was ample Ca2+ in the SR. The exposures to 10 and 50 μm Ca2+ were performed in the absence of ATP (with the fibre in rigor) so as to prevent SR Ca2+ uptake from locally altering the applied [Ca2+]. Maximum force was determined by exposure to a 50 mM CaEGTA solution at pCa 4.5 (Max). Time scale: 2 s during depolarizations and caffeine exposure and 30 s elsewhere.
Caffeine-induced responses
It is nonetheless unclear whether high [Ca2+] exposure, in addition to disrupting the coupling mechanism, also alters the Ca2+ handling properties of the SR in some way. This was investigated by using caffeine-induced responses as an assay of the ability of the SR to load and retain Ca2+ (Endo, 1985). Rat EDL fibres can be fully depleted of releasable Ca2+ by exposure to a solution with 30 mM caffeine and low free [Mg2+] (Fryer & Stephenson, 1996; Owen et al. 1997), the latter being necessary in mammalian fibres to ensure potent stimulation of the Ca2+-release channels. Each fibre can be subjected to repeated load-release cycles in which the SR is reloaded with Ca2+ by exposure to a load solution (see Methods) for a set period and then depleted again with the caffeine solution, eliciting a highly reproducible force response (Fig. 2A). In each fibre, the ‘area’ (i.e. time integral) of the force response increases progressively with increasing duration of the loading period (Fig. 2), until reaching saturation with long loads (e.g. after ∼60 s at pCa 6.7, 1 mM EGTA) (not shown). This relationship between load time and caffeine-response area (Fig. 2B) indicates that the area of the force response is indicative of the amount of Ca2+ loaded into the SR. The exact relationship depends on the Ca2+ buffering conditions used in the caffeine release solution. Throughout this study, except where specified, there was 0.5 mM EGTA (pCa 8) present in both the pre-equilibration and caffeine release solutions (see Methods), with these conditions chosen so that the caffeine stimulus elicited a measurable, non-saturated response when the SR was loaded at, or somewhat below, the normal endogenous level. The advantage of using fibres skinned under (paraffin) oil is that the force response to the first caffeine exposure is indicative of the amount of Ca2+ present in the SR endogenously. Here it was found that fibres required reloading for between 20 and 40 s (in the standard load solution: pCa 6.7, 1 mM total EGTA) in order to elicit a caffeine response similar to that when releasing the endogenous Ca2+ (Fig. 2A). For the 12 fibres shown in Fig. 2B, the mean area (±s.e.m.) of the caffeine response with the endogenous Ca2+ load was 84.6 ± 10.7 % of the response with 40 s loading (i.e. close to the level for 30 s loading).
Figure 2. Relationship between Ca2+ load time and the size of the caffeine response.

A, force responses of an EDL fibre to the caffeine stimulus (i.e. 30 mM caffeine, 0.05 mM Mg2+, 0.5 mM EGTA, pCa 8) after loading the SR with Ca2+ to various degrees by exposure to a pCa 6.7 solution (1 mM total EGTA) for the indicated times. The first caffeine response was elicited soon after skinning the fibre, whilst the SR contained the endogenous level of Ca2+. B, means ±s.e.m. of the relative area of the force response versus loading time in 12 EDL fibres. The responses in each fibre were expressed as a percentage of that for 40 s loading.
High [Ca2+] treatment reduces subsequent caffeine responses
Exposure to 50 μm Ca2+ for 15 s in the absence of ATP (referred to as ‘high [Ca2+] treatment’) caused a reduction in the area of the subsequent caffeine response (with 0.5 mM EGTA) in every fibre examined (Fig. 3), with the area on average declining to 61.2 ± 3.3 % (mean ±s.e.m., here and following) of that before the high [Ca2+] treatment (n = 25, P < 0.05) (Table 1). The duration of the caffeine response was also significantly reduced to 79.8 ± 2.3 % of the pre-treatment value (initially 4.2 ± 0.3 s, measured at 10 % of peak response). In contrast, neither a 90 s exposure to 10 μm Ca2+ (not shown) nor rigor treatment alone (Fig. 3), had any significant effect on either the area or the duration of the caffeine response, even though subsequent treatment of the same fibres with 50 μm Ca2+ caused a marked reduction in both parameters (Table 1).
Table 1.
Mean (±s.e.m.) relative area and duration of the caffeine response after various treatments
| Treatment | No. of fibres | Area (%) | Duration (%) |
|---|---|---|---|
| Rigor only | 6 | 101.7 ± 7.8 | 108.0 ± 3.7 |
| 50 μm Ca2+ (same fibres) | 59.7 ± 6.4* | 83.5 ± 3.5* | |
| 10 μm Ca2+ | 9 | 104.9 ± 8.6 | 103.3 ± 3.4 |
| 50 μm Ca2+ (same fibres) | 55.8 ± 4.7* | 80.0 ± 2.8* | |
| 40 μm Ca2+ (all fibres) | 6 | 68.7 ± 9.5* | 78.8 ± 6.3* |
| 50 μm Ca2+ (all fibres) | 25 | 61.2 ± 3.3* | 79.8 ± 2.3* |
| 130 μm Ca2+ (all fibres) | 6 | 53.7 ± 6.4* | 76.8 ± 5.2* |
The area (i.e. time integral) and duration of the caffeine response (in 0.5 mm EGTA) were measured after the indicated treatment and expressed as a percentage of the respective value before treatment in the same fibre (see Fig. 3). Duration was measured at 10% of the peak response before treatment. Measurements were made in a total of 25 fibres given a 15 s exposure to 50 μm Ca2+. In 9 of these cases, the fibre was given a 90 s exposure to 10 μm Ca2+ before the 50 μm Ca2+ treatment. In 6 of these latter cases, the fibre was consecutively given the rigor control treatment, the 10 μm Ca2+ treatment and finally the 50 μm Ca2+ treatment. Data are also shown for treatment with 40 and 130 μm Ca2+.
value was significantly different after the indicated treatment (P < 0.05, Student's paired t test). A sigmoidal fit to the data indicated half-maximal reduction in response area with ∼32 μm Ca2+.
The reduction in the caffeine response caused by high [Ca2+] treatment persisted unchanged over a period of at least 10 to 20 min (i.e. three to six repetitions of the load-release cycle), as illustrated by the mean data in Fig. 4A. Individual fibres displayed a similar constancy in the post-treatment response; for example the mean difference between the first and second response after high [Ca2+] treatment was 0.0 ± 1.9 % (n = 10). Thus, the spread indicated by the magnitude of the s.e.m. values following Ca2+ treatment in Fig. 4A (∼6 %) predominantly reflects variability in the extent of the reduction between different fibres, rather than variability between successive responses in the same fibre. In the one fibre examined over six consecutive responses following a single treatment, the area of the caffeine response changed by only 4 % (of the initial control) between the first and last repetition. Thus, the area of the caffeine response showed no recovery over a considerable period following the Ca2+ treatment. If a fibre was given a second exposure to 50 μm Ca2+, there was no further reduction in the size of the caffeine response (Fig. 4B). In other experiments, fibres were first treated with either 40 μm Ca2+ (two fibres) or 50 μm Ca2+ (three fibres) and then with 130 μm Ca2+, which resulted in a small, but significant, further reduction in area of the caffeine response in every case (means relative to initial control response: 63.4 ± 7.1 % and 49.3 ± 5.6 %, before and after 130 μm Ca2+, respectively, P < 0.05, Student's paired t test). These latter data show that the reduction in caffeine response does not occur in an all-or-nothing manner in individual fibres, but is instead graded by the [Ca2+] used. The mean values of the relative area and duration of the caffeine response after treatment at different [Ca2+] are shown in Table 1. A plot of mean area of the caffeine response versus treatment [Ca2+] was well fitted by a sigmoidal function with half-maximal effect at ∼32 μm Ca2+; such analysis indicated that 50 μm Ca2+ treatment induced ∼80-90 % of the maximum effect.
Figure 4. Effects on the caffeine response of two successive Ca2+ treatments.
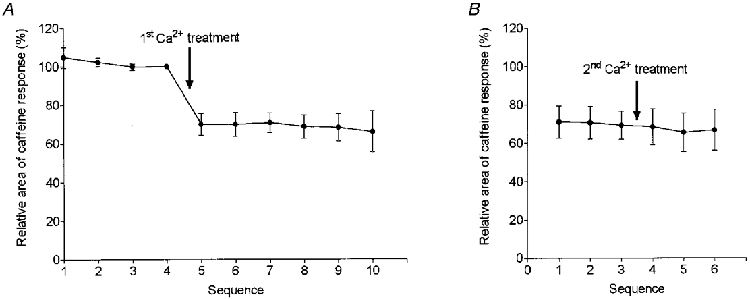
A, means ±s.e.m. of the relative area of the caffeine response before and after a first exposure to 50 μm Ca2+ in 10 fibres. The responses in each fibre were expressed as a percentage of that immediately prior to the treatment (i.e. the 4th control response). At least five caffeine responses were recorded following the first Ca2+ treatment, with the fibres being subjected to a further (identical) Ca2+ treatment following the third such response (6 fibres) or following the second (n = 1), fourth (n = 1) or fifth (n = 1) response or not all (n = 1). B, realignment of the responses for the seven fibres from A in which three caffeine responses were obtained both prior to and following the second Ca2+ treatment. The data in A and B show that the first Ca2+ treatment caused a persistent reduction in the area of the caffeine response, and that a second treatment did not cause any further reduction.
The reduction in the area and duration of the caffeine response following the high [Ca2+] treatment was not due to a change in the Ca2+ sensitivity of the contractile apparatus. Experiments in which the contractile apparatus was directly activated by heavily buffered Ca2+ solutions (50 mM CaEGTA-EGTA, see Methods) showed no change in the force response to submaximal Ca2+ stimuli following 50 μm Ca2+ treatment in any of the three fibres examined (mean change in pCa giving half-maximal force: -0.004 ± 0.004). This is in agreement with the previous finding of no change in Ca2+ sensitivity or maximum force following similar high [Ca2+] treatment (100 μm Ca2+ for 10 s during rigor; Lamb et al. 1995). Thus, the reduction in the size of the caffeine response indicates some change in Ca2+ handling by the SR.
Effect of different Ca2+ buffering in the caffeine solution
In order to investigate what changes in SR function underlie the reduction in the caffeine response, experiments were also performed using 0.5 mM BAPTA instead of EGTA in the caffeine and pre-equilibration solutions. The Ca2+ affinity of BAPTA is similar to that of EGTA (at pH 7.1; Harrison & Bers, 1987) but BAPTA is much faster at chelating Ca2+. The use of such a fast Ca2+ buffer permits estimation of the minimum amount and rate of Ca2+ release underlying the force response (see Discussion). The force response was smaller and slower to rise when BAPTA was present in the caffeine solution instead of EGTA (Fig. 5). In the five fibres examined with 0.5 mM BAPTA, the peak force and duration of the caffeine response were 55 ± 16 and 83 ± 24 % of the respective values with 0.5 mM EGTA at the same level of SR loading. In the two fibres examined both before and after treatment with 50 μm Ca2+, the area, peak force and duration of the caffeine responses in BAPTA were all reduced after treatment (to 53 and 59 %; to 82 and 84 %; and to 72 and 77 % of the pre-treatment values in the two fibres, respectively), and these reductions were in fact slightly greater than those occurring with EGTA (to 78 and 71 %; to 88 and 94 %; and to 84 and 81 %, respectively). Clearly, high [Ca2+] treatment caused a reduction in the size of the caffeine response, irrespective of the type of Ca2+ buffering used in the caffeine solution.
Figure 5. Effect of the fast Ca2+ buffer BAPTA.

When 0.5 mM BAPTA was used instead of 0.5 mM EGTA in the caffeine and pre-equilibration solutions, the peak size and rate of rise of the caffeine response were reduced for a given level of loading. Ca2+ treatment caused a reduction in the area of the responses irrespective of the Ca2+ buffer used, with the loading time in both cases having to be increased to about 40 s in order to produce a response similar to that found with 20 s loading before treatment. All loading performed at pCa 6.7 (1 mM EGTA). Time scale: 2 s during caffeine responses, vertical scale 0.05 mN.
As discussed later, the substantial force responses observed in the presence of the fast buffer, BAPTA, show that the caffeine stimulus induces the rapid efflux of most or all of the SR Ca2+ within ∼1 s, with the rate of subsequent force decline apparently being determined primarily by the diffusion of Ca2+-buffer complex out of the skinned fibre. It can thus be concluded (see Discussion) that the reduction in the size of the caffeine response after high [Ca2+] treatment must be the result of a reduction in the total amount of releasable Ca2+ in the SR, rather than simply a reduction in the rate of release. The size and time course of the force responses before and after high [Ca2+] treatment are also consistent with this. In general, the caffeine responses obtained after Ca2+ treatment closely resembled those obtained with a shorter loading period before Ca2+ treatment. For example in Fig. 5, the characteristics of the caffeine response with EGTA and 20 s loading after Ca2+ treatment appear intermediate between those with 14 and 20 s loading before treatment. Similarly, the effect of the Ca2+ treatment on the caffeine response appeared to be reversed simply by loading the SR for longer (e.g. 40 s loading instead of the 20 s loading recorded in Fig. 5).
Increase in SR Ca2+ leakage following high [Ca2+] treatment
The above findings suggested that the ability of the SR to load and/or retain Ca2+ was reduced after high [Ca2+] treatment. It is difficult to study Ca2+ loading by the SR in isolation, because the SR simultaneously leaks Ca2+ whilst loading. In contrast, the rate of Ca2+ leakage from the SR can be separately studied simply by loading the SR to some extent and then measuring the rate at which the SR loses Ca2+ in a solution where there should be no Ca2+ uptake (e.g. pCa > 8.5, 2 mM EGTA). As illustrated in Fig. 6, the area of the caffeine response was used to assay the Ca2+ content of the SR with and without various periods for Ca2+ leakage (in standard conditions with 1 mM free Mg2+ etc.). The area of the caffeine response progressively declined with increasing duration of the leakage period, and in general this was better described by a linear rather than an exponential relationship. The mean rate of decline of the caffeine response area was 1.4 ± 0.2 % s−1 (expressed per second of leakage period) in the seven fibres studied with the standard conditions (i.e. 1 mM Mg2+). Following Ca2+ treatment, the area of the caffeine response (for the same loading period) was reduced, as expected (Fig. 6). The SR was then loaded for a longer period at the same or higher [Ca2+] (i.e. pCa 6.7 or 6.4) in order to restore the area of the response close to that observed before Ca2+ treatment (range 70-110 %), and the effect of a Ca2+-leakage period was examined (Fig. 6). These experiments showed that the rate of Ca2+ leakage out of the SR was increased ∼3-fold after high [Ca2+] treatment, but was not significantly changed by rigor treatment alone (Table 2).
Figure 6. High [Ca2+] treatment causes an increase in the rate of Ca2+ leakage from the SR.

The caffeine response in this EDL fibre was measured either immediately after loading for 30 s at pCa 6.7 (1 mM EGTA) (first and fifth responses) or after loading and then allowing Ca2+ leakage out of the SR for various times (in a solution with 2 mM EGTA, pCa > 8.5) (second to fourth responses). High [Ca2+] treatment caused the typical reduction in the control caffeine response, and so the fibre was subsequently loaded in a solution with higher [Ca2+] (30 s in pCa 6.4, 1 mM EGTA) in order to restore the caffeine response to closer to the pre-treatment level, and then the effect of Ca2+ leakage duration was examined. After Ca2+ treatment, a 20 s leakage period caused a greater reduction in the caffeine response than did a 60 s leakage period before Ca2+ treatment. Time scale, 2 s during caffeine responses.
Table 2.
Mean (±s.e.m.) Ca2+ leakage rates from the SR recorded under various conditions, before and after high [Ca2+] treatment
| Rate of decrease in area of caffeine response during leakage period | ||||||
|---|---|---|---|---|---|---|
| Treatment | Leakage condition | No. of fibres | Before (% s−1) | After (% s−1) | Absolute change (% s−1) | Relative change |
| Rigor only | Standard | 3 | 1.2 ± 0.1 | 1.4 ± 0.4 | 0.2 ± 0.4 | 1.2 ± 0.4 |
| 50 μm Ca2+ | Standard | 4 | 1.6 ± 0.4 | 4.6 ± 0.9 | 3.1 ± 0.6* | 3.0 ± 0.2* |
| 50 μm Ca2+ | 10 mm Mg2+ | 3 | 1.3 ± 0.3 | 3.0 ± 0.4 | 1.7 ± 0.2* | 2.9 ± 0.3* |
| 50 μm Ca2+ | 2 μm RR | 3 | 1.8 ± 0.2 | 3.6 ± 0.2 | 1.8 ± 0.4* | 2.1 ± 0.4 |
| 50 μm Ca2+ | Na+ | 3 | 1.2 ± 0.3 | 3.4 ± 0.6 | 2.4 ± 0.1* | 3.1 ± 0.4* |
The rate of Ca2+ leakage out of the SR (both before and after the indicated treatment) was ascertained from the decrease in the area of the caffeine response after various different leakage periods in the indicated conditions, as illustrated in Fig. 6. The rate was determined for each fibre by a linear fit to a graph of caffeine response area versus leak duration. The change in the leakage rate after Ca2+ treatment (or rigor only) is expressed both in absolute and relative terms, and for the latter a value of 1.0 indicates no change.
Leak rate was significantly higher after the treatment (P < 0.05, Student's paired t test). Where indicated, 10 mm Mg2+ or 2 μm RR was present before and during loading and during the subsequent leakage period, but was not present in the pre-equilibration (10 s) and caffeine release solutions. ‘Na+’ indicates that the solutions were Na+ based, with no K+, to ensure the T-system was chronically depolarized and hence the voltage sensors inactivated.
Effects of 10 mM Mg2+ and Ruthenium Red
We then examined whether the SR Ca2+ leakage was blocked by factors known to greatly reduce the opening of the ryanodine receptor/Ca2+ release channels in mammalian skeletal muscle (RyR1), namely 10 mM Mg2+ and 2 μm Ruthenium Red (RR) (Meissner et al. 1986; Lamb & Stephenson, 1991; Soler et al. 1992; Laver et al. 1997). When fibres were pre-equilibrated and loaded in the presence of 10 mM Mg2+ (pCa 6.7, 1 mM EGTA), and then Ca2+ release stimulated under the standard (1 mM Mg2+) conditions, the area of the caffeine response was 75 ± 5 % of that found after comparable loading at 1 mM Mg2+ in the same fibres (n = 7), with the relationship between load time and response area not obviously changed. This reduction in net Ca2+ uptake at 10 mM Mg2+ is similar to that reported previously with skinned EDL fibres (Kabbara & Stephenson, 1994) and probably indicates that the presence of 10 mM Mg2+ reduces Ca2+ pumping at pCa 6.7. In fibres loaded in 10 mM Mg2+, high [Ca2+] treatment reduced the caffeine response to 46 ± 9 % (n = 11) of that before treatment. This indicates that despite the presence of 10 mM Mg2+, there was a reduction in net Ca2+ uptake following Ca2+ treatment. This must have been caused by either reduced Ca2+ pumping into the SR and/or increased leakage of Ca2+ during the Ca2+ pumping and the subsequent 10 s equilibration period before the caffeine stimulus was applied. Leakage experiments (e.g. like that in Fig. 6, but with 10 mM Mg2+ present during both the uptake and the leakage periods) indicated that: (a) before high [Ca2+] treatment, the Ca2+ leakage rate in 10 mM Mg2+ was quite similar to that in 1 mM Mg2+, and (b) the Ca2+ leakage rate in 10 mM Mg2+ was increased significantly after high [Ca2+] treatment (Table 2). Furthermore, the increase in the Ca2+ leakage rate following high [Ca2+] treatment was not significantly different between the 1 and 10 mM Mg2+ cases (Table 2), but this finding should be viewed with caution because it is not based on paired measurements in the same fibres.
Similar experiments were conducted using Ruthenium Red (RR). We have previously shown that 2 μm RR almost completely blocked (> 95 %) the response of EDL fibres to 30 mM caffeine at 1 mM Mg2+ (Lamb & Stephenson, 1991). We found here that the response to 30 mM caffeine/low [Mg2+] was also markedly inhibited by the presence of 2 μm RR, but that a substantial response could be elicited if the RR was washed out before transfer to the pre-equilibration and caffeine/low [Mg2+] solutions. In these experiments the SR was loaded in a solution at pCa 6.3 (1 mM total EGTA), because 2 μm RR apparently also inhibited net Ca2+ uptake at pCa 6.7, as indicated by the small size or complete absence of a response upon subsequent permeabilization of the SR with Triton X-100 (not shown). This is consistent with the finding that RR decreased the Ca2+ sensitivity of uptake in cardiac SR vesicles (Kargacin et al. 1998). Even with loading at pCa 6.3 and washout of RR before release, the response to successive repetitions typically declined by 10 % or more, making these experiments less reliable. Nevertheless by interpolating between bracketing control responses, it appeared that the area of the caffeine response was approximately linear with the loading duration and could thus be used as a measure of SR Ca2+ content. Further experiments with fibres loaded in the presence of 2 μm RR showed that high [Ca2+] treatment still reduced the area of caffeine response to 40 ± 7 % of the pre-treatment level (n = 6), which is comparable to that found in the absence of RR (61.2 ± 3.3 % with 1 mM Mg2+, Table 1; 46 ± 9 % with 10 mM Mg2+). Leakage experiments indicated that: (a) before high [Ca2+] treatment, the Ca2+ leakage rate was similar in the absence and presence of 2 μm RR, and (b) the Ca2+ leakage rate in 2 μm RR was significantly increased in absolute terms (but not relative terms) after high [Ca2+] treatment (Table 2). Thus, neither 2 μm RR nor 10 mM Mg2+ could prevent the increased SR leakage occurring after high [Ca2+] treatment.
Effect of voltage-sensor inactivation
We also examined whether the increase in Ca2+ leakage following high [Ca2+] treatment was the result of increased voltage-sensor stimulation of the Ca2+ release channels, which theoretically could arise from some direct effect on the voltage sensors or from depolarization of the T-system. In the following experiments, the T-system was kept chronically depolarized, and hence the voltage sensors inactivated, by the replacement of all K+ with Na+ in the bathing solutions (see Methods). In the three fibres examined, the caffeine stimulus elicited little or no response after 10 s loading (pCa 6.7) and the area of the response increased approximately linearly with longer loading times, with approximately 30 s loading required to elicit a response similar to that with endogenous level of Ca2+ loading (not shown). This probably means that the fibre loads Ca2+ similarly in the Na+-based and K+-based solutions, but that the size of the force response is disproportionately reduced at short load times, possibly due to lower Ca2+ sensitivity of the contractile apparatus in Na+ compared with K+ (Fink et al. 1986). In the fibres kept depolarized in Na+, the SR Ca2+ leakage rate (as indicated by the reduction in the caffeine response with 30 or 40 s loading and various leakage periods), was comparable to that found in (polarized) fibres under the standard conditions with K+ (Table 2). Following high [Ca2+] treatment, the area of the caffeine response (with 30 or 40 s loading at pCa 6.7) was reduced to 20 ± 10 % of the pre-treatment value (n = 3). The area of the response was restored to 80-95 % of the original level by loading (for 20-60 s) at pCa 6.4, and the Ca2+ leakage rate was then found to be significantly higher (about 3-fold) than before Ca2+ treatment (Table 2). Thus, high [Ca2+] treatment increases SR Ca2+ leakage even if voltage sensors are kept chronically inactivated, indicating that the treatment directly affects the properties of the SR.
Direct evidence of reduced SR Ca2+ accumulation
Finally, we wished to see if we could observe the alteration in SR properties more directly, that is without using the caffeine response as an assay of SR Ca2+ content. In these experiments, a skinned fibre was initially depleted of releasable Ca2+ (with caffeine) and then bathed in a solution moderately buffered (0.75 mM total EGTA) to 1.5 μm free Ca2+ (i.e. pCa 5.85) for 2 min or more. If the [Ca2+] near the contractile apparatus reached a level similar to that in the bathing solution, it would induce a large force response. Following the destruction of the SR by treatment with Triton X-100 (2 % v/v for 2 min and then washout), this was indeed seen to be the case, with exposure to the 1.5 μm Ca2+ solution inducing between 60 and 95 % of maximum Ca2+-activated force within 30 s in every fibre examined (n = 21) (Fig. 7). However, when the fibres were first exposed to the 1.5 μm Ca2+ solution before destruction of the SR with Triton X-100, little or no force was elicited over the whole exposure period (mean peak force 10 ± 3 % of force measured after SR destruction; n = 21) (Fig. 7). This change in the force response was not due to some effect of the Triton treatment on the contractile apparatus, because solutions in which the [Ca2+] was very heavily buffered (i.e. 50 mM total EGTA) to a similar level induced approximately the same large force response both before and after Triton treatment (not shown). Clearly, the SR, due to its ability to translocate Ca2+ and perhaps also its physical structure, kept the [Ca2+] near the contractile apparatus much lower (i.e. < 0.7 μm or pCa 6.15) than in the bathing solution, despite the Ca2+ buffering capacity of the EGTA present. (In the few fibres examined, the SR was observed to do this even with exposure to the solution for 10 min or more.) At the end of the exposure period, the SR was evidently very heavily loaded with Ca2+, because caffeine invariably induced a large force response despite the presence of a high free [EGTA] (1.5 or 2 mM, pCa > 8) in the pre-equilibration and caffeine solutions (Fig. 7).
Figure 7. Ca2+ treatment reduces the ability of the SR to keep the [Ca2+] low within the fibre.

A, the SR was first fully depleted of releasable Ca2+ with caffeine (not shown). Subsequent exposure to a solution moderately buffered (0.75 mM total EGTA) at 1.5 μm free Ca2+ (i.e. pCa 5.85) induced only a small force response over a prolonged exposure (3 min), but after Ca2+ treatment the same solution caused a large, oscillatory force response (displayed at slow time scale). The caffeine response (fast time scale: caffeine solution with 1.5 mM EGTA) following exposure to the 1.5 μm Ca2+ solution was much smaller after Ca2+ treatment than before, indicating reduced Ca2+ uptake by the SR. After the SR was destroyed by treatment with Triton X-100 (2 % v/v for 2 min), exposure to the same 1.5 μm free Ca2+ solution caused a large, relatively rapid force response, showing that, before the high [Ca2+] and Triton treatments, the SR had maintained the [Ca2+] near the contractile apparatus at a much lower level than in the bathing solution. B, example of a fibre exposed twice to the 1.5 μm Ca2+ bathing solution before high [Ca2+] treatment. Time scale in A and B:30 s during exposures to 1.5 μm Ca2+ solution and 2 s during caffeine responses.
If a fibre was then given the standard high [Ca2+] treatment (15 s exposure to 50 μm Ca2+ during rigor), exposure to the same 1.5 μm Ca2+ solution invariably induced a large force response, with the peak force reaching 69 ± 6 % (n = 8) of that elicited after Triton treatment (and with the associated caffeine response in the presence of 1.5 mM EGTA always being greatly reduced, see Fig. 7A). In three of these cases (e.g. Fig. 7A), the force response showed major oscillations, whereas in the other five cases (e.g. Fig. 7B) the force rapidly reached a high steady level after one or two small oscillations (cf. Szentes et al. 1998). This altered response to the 1.5 μm Ca2+ solution was not due simply to changes occurring during the first exposure (or the associated caffeine response), though in certain cases that first exposure did appear to alter the subsequent properties. These conclusions were made by distinguishing between fibres that gave little or no force response (< 5 % of the post-Triton level) upon the first exposure to the 1.5 μm Ca2+ solution, and those that gave a more substantial response (> 5 %). In the former group of fibres, those given a second exposure to the 1.5 μm Ca2+ solution without any preceding high [Ca2+] treatment, showed no significant increase in the force response (1 ± 1 % on first exposure, 3 ± 2 % on second, n = 6; P > 0.05), whereas those fibres given a second exposure after high [Ca2+] treatment (Fig. 7A) showed a large, significant increase (2 ± 1 % on first exposure, 60 ± 3 % on second, n = 4; P < 0.05). This shows that the high [Ca2+] treatment deleteriously affected the ability of the SR to maintain the [Ca2+] near the contractile apparatus at a relatively low level, which is consistent with the increased SR leakage detailed above. Interestingly, it was also found that in the fibres in which the first exposure to the 1.5 μm Ca2+ solution induced a substantial force response (15 ± 3 %, n = 7), a second exposure caused a much larger response (51 ± 14 %, P < 0.05), even though those fibres were not given the high [Ca2+] treatment in between the two exposures. (Not surprisingly, the comparable fibres given the high [Ca2+] treatment between the first and second exposures also showed this significant increase: 23 ± 7 to 79 ± 9 %, n = 4; P < 0.05.) These data suggest that first exposure to the 1.5 μm Ca2+ solution (or the associated caffeine response) itself adversely affected the ability of the SR to keep the [Ca2+] relatively low near to the contractile apparatus. This probably indicates that during the exposure to the 1.5 μm Ca2+ solution, the [Ca2+] near the release channels increased to such an extent that it induced a similar effect as the high [Ca2+] treatment (see Discussion).
DISCUSSION
Caffeine assay of Ca2+ content
In this section we consider the Ca2+ release profile underlying the caffeine response, and show that the reduction in the area of the caffeine response after high [Ca2+] treatment is indeed indicative of reduced SR Ca2+ content. The amount of releasable Ca2+ in the SR was assayed by stimulating rapid and complete release of Ca2+ by simultaneously adding caffeine and lowering the free [Mg2+] (Fryer & Stephenson, 1996). This induced a small to large force response, depending on the level to which the SR was loaded with Ca2+ and the amount and type of Ca2+ buffering present in the cytoplasm (Figs 2 and 5). A lower limit for the amount and rate of Ca2+ release can be made as follows, based on the experiments using BAPTA, because this buffer binds Ca2+ so rapidly that it should reach equilibrium with the cytoplasmic Ca2+ in a matter of milliseconds. When loaded at the endogenous level, the SR of EDL fibres contains ∼1 mM of releasable Ca2+ (expressed as mmol per litre total fibre volume, as if the Ca2+ were released into the whole volume of an intact fibre) (Fryer & Stephenson, 1996; Owen et al. 1997). In the EDL fibres here, which were loaded to ∼75 % of the endogenous level (i.e. with 20 s loading at pCa 6.7, see Fig. 2 and Results), the caffeine stimulus in the presence of 0.5 mM free BAPTA induced a peak force of ∼30-40 % of maximum, reaching 90 % of that level within ∼0.5 s of the caffeine addition (Fig. 5). Thus, given: (a) an apparent calcium association constant for BAPTA of 5 × 10⁶ m−1 (Harrison & Bers, 1987), and (b) a force-[Ca2+] relationship with half-maximal force at ∼pCa 6.1 in the caffeine solution (Wendt & Stephenson, 1983), this indicates that approximately 75 % of the total BAPTA in the fibre space (∼1.06 × 0.5 mM; see Owen et al. 1997), i.e. ∼0.4 mM, had Ca2+ bound at the peak of the force response. As another ∼0.1 mM Ca2+ must be bound to troponin C at such force levels (Fuchs, 1985) and additional Ca2+ may be bound to other fixed binding sites (Owen et al. 1997), the caffeine stimulus must have released at least 0.5 mM Ca2+, which is > 60-70 % of the total releasable Ca2+, within ∼0.5 s. This estimate of the Ca2+ release rate (∼1 mM s−1) is one tenth of the maximum release rate in voltage-clamped EDL fibres at this temperature (10 mM Ca2+ s−1; Shirokova et al. 1996) and should be considered a lower limit because it ignores the diffusional delays in applying the stimulus and activating the contractile apparatus.
Thus, the force response found using either EGTA or BAPTA apparently results from the rapid ‘bolus’ release of most of the Ca2+ in the SR, followed by the slow diffusional loss of the Ca2+-buffer complex from the fibre. During the latter phase, some of the Ca2+ initially released is presumably resequestered by the SR and subsequently released again, though at any time the majority of the Ca2+ must be bound to BAPTA/EGTA, troponin C and other fixed buffers in the cytoplasmic space. The peak of the force response with 0.5 mM EGTA was higher than with 0.5 mM BAPTA, presumably because BAPTA chelated a greater proportion of the Ca2+ before it reached the troponin C. In contrast, the decline in the force response from a given level was quite similar with either 0.5 mM BAPTA or 0.5 mM EGTA (Fig. 5), because the diffusional loss of Ca2+ from the fibre depended on the amount rather than the type of Ca2+ buffer present. Typically it took ∼3 s for the force to decline to 10 % of the peak, with the change in the force indicating that the free [Ca2+] dropped from about pCa 6.15 to pCa 6.4, and hence that the total amount of Ca2+ on the BAPTA and troponin C dropped from ∼0.5 mM to 0.3 mM, indicating an average diffusional loss of < 0.07 mM Ca2+ s−1, which is > 15 times slower than the Ca2+ release rate.
The above considerations indicate that most of the Ca2+ is rapidly released as a bolus and then the force declines relatively slowly as Ca2+-buffer complex transports Ca2+ out of the skinned fibre. As the size and rate of development of the force response in BAPTA indicated that the initial Ca2+ release rate was still at least 1 mM s−1 after high [Ca2+] treatment (Fig. 5), it is apparent that the reduction in the area of the caffeine response following the treatment cannot be due to a decrease in the rate of Ca2+ release, as the rate of Ca2+ release still greatly exceeded the rate of diffusional loss. Instead, the reduction in the area of the caffeine response indicates that the amount of releasable Ca2+ in the SR was reduced following the high [Ca2+] treatment, which in turn implies a reduction in the ability of the SR to load and/or hold Ca2+.
Ca2+ leakage from the SR before and after high [Ca2+] treatment
Even before any high [Ca2+] treatment, the SR of mechanically skinned fibres leaks Ca2+, albeit at a relatively low rate in the presence of a low cytoplasmic [Ca2+] (pCa > 8) and physiological levels of free Mg2+ (1 mM), ATP (8 mM total), pH (7.1) (Fig. 6). With the SR loaded at close to the endogenous level (∼1 mM Ca2+; see above), the EDL fibres placed in a solution with 2 mM free EGTA (pCa > 8) lost ∼1.4 % of the SR Ca2+ s−1 (Table 2), or ∼14 μm s−1, which is similar to that found previously with skinned EDL fibres placed in 5 mM BAPTA (Bakker et al. 1996). The Ca2+ leakage rate was not very different in the presence of 10 mM Mg2+ or 2 μm RR (1.3 and 1.8 % s−1, respectively; see Table 2). It is possible that this Ca2+ leakage occurs through the normal ryanodine receptor/Ca2+-release channel, and that neither 10 mM Mg2+ nor 2 μm RR are able to reduce the channel opening probability below the base level (note: the leakage rate implies a mean opening probability of ∼0.001 or lower, because peak release can reach ∼10 mM Ca2+ s−1; Shirokova et al. 1996). Alternatively, the leakage could occur through a modified type of ryanodine receptor, given that it has been reported that Ca2+ leaks out of mammalian skeletal muscle SR through a pathway that is insensitive to both ryanodine and RR and that this pathway can be converted back to the normal ryanodine-sensitive state by the sponge extract, bastadin-5 (Pessah et al. 1997). A third possibility is that the leak occurs via some quite different pathway, such as through the SR CaATPase; such Ca2+ leakage has been observed in frog SR vesicles and was not blocked by Mg2+, ryanodine or RR (Du et al. 1996; 1998).
Importantly, the Ca2+ leakage rate was increased approximately 3-fold after high [Ca2+] treatment (Fig. 6 and Table 2). This increased leak meant that the SR could only be reloaded to its original, endogenous level by loading for longer at pCa 6.7 (Fig. 5), or if this was still insufficient, by loading at a higher [Ca2+] (Fig. 6). The increased Ca2+ leakage was not noticeably blocked by the presence of either 10 mM Mg2+ or 2 μm RR (Table 2). It is not known, however, whether this increase in Ca2+ leakage is through the same pathway(s) as responsible for Ca2+ leakage in untreated fibres or through some additional pathway. As the increased leakage was not blocked by 10 mM Mg2+ or 2 μm RR, we were unable to separately examine whether the rate of Ca2+ pumping into the SR was also reduced, as we could not prevent Ca2+ leakage occurring simultaneously during the Ca2+ pumping. Nevertheless, noting that the net Ca2+ uptake rate before Ca2+ treatment is on average ∼33 μm s−1 (i.e. about 30 s to reload the SR from empty to ∼1 mM) despite simultaneous leakage at ∼14 μm s−1, it is apparent that a 3-fold increase in leakage by itself would seemingly fully account for the 40-50 % decrease in net Ca2+ uptake found after high [Ca2+] treatment. However, in view of the approximations and assumptions in such calculations, we do not rule out that high [Ca2+] treatment might also reduce the SR Ca2+ pumping rate to some extent.
In our original study showing that high intracellular [Ca2+] abolishes depolarization-induced responses (Lamb et al. 1995), we did not observe any reduction in net Ca2+ uptake in the few fibres examined. This is because the fibres were loaded in a very weakly buffered pCa 5.7 solution (50 μm total EGTA) and pre-equilibrated in a pCa 7 solution with only 50 μm EGTA (cf. this study: loading in 1 mM total EGTA at pCa 6.7 and pre-equilibrating in 0.5 mM EGTA at pCa 8), and so most of the extra Ca2+ leaking into the fibre space during these periods would have been recovered by the SR rather than chelated by the free EGTA (0.5 mM) present.
[Ca2+] gradients established by the SR
We also obtained further evidence that exposure to high [Ca2+] causes a change in SR Ca2+ handling, by examining the ability of the SR to keep the [Ca2+] relatively low near the contractile apparatus in the presence of elevated [Ca2+] in the bathing solution (Fig. 7). Before high [Ca2+] treatment, the SR was evidently able to establish a steady-state [Ca2+] gradient between the weakly buffered bathing solution (0.75 mM total EGTA, 1.5 μm free Ca2+, i.e. pCa 5.85) and the contractile apparatus. The steady-state level of force (∼5 to 10 % of maximum Ca2+-activated force) implied that the [Ca2+] at the contractile apparatus was about 0.8 μm (i.e. pCa 6.1) (see Fink et al. 1986; no caffeine) and thus given an apparent Ca2+-affinity constant for EGTA of 5 × 10⁶ m−1 (Fink et al. 1986), it seems that the ratio of CaEGTA:EGTA was 4:1 (i.e. 0.6:0.15 mM) near the contractile apparatus compared with 7:1 (i.e. 0.66:0.09 mM) in the bathing solution. Thus, to establish such a gradient the SR had to continuously translocate only a relatively small amount of Ca2+ (0.66 - 0.6 = 0.06 mM) to balance the diffusional influx occurring with 0.66 mM CaEGTA outside and 0.6 mM CaEGTA near the contractile apparatus. It is not clear whether the SR establishes this Ca2+ gradient by translocating the Ca2+ from the deeper to the more superficial regions of the skinned fibre, or by taking up Ca2+ all along the length of each myofibril and releasing it in the triadic regions. Irrespective of this, it was found that after high [Ca2+] treatment, fibres were less able to prevent the Ca2+ in the bathing solution from reaching and activating the contractile apparatus (Fig. 7), which is consistent with a reduction in net Ca2+ uptake by the SR. In some cases following high [Ca2+] treatment, the force response showed large oscillations (Fig. 7A), similar to those observed in Xenopus skinned fibres bathed in comparable solutions (0.5 mM EGTA, pCa 6-5.3; Szentesi et al. 1998). These oscillations evidently depend on using weakly buffered high [Ca2+] solutions such that the SR is initially able to sequester sufficient Ca2+ to prevent appreciable force development before it eventually becomes so full that it suddenly releases some of the stored Ca2+ (perhaps involving a Ca2+-induced Ca2+ release mechanism) and then subsequently starts to sequester the Ca2+ again.
Interestingly, we also found that if the force rose appreciably during the exposure to the weakly buffered 1.5 μm Ca2+ solution, the force response upon subsequent exposure was greatly increased, just as if the fibre had been given the high [Ca2+] treatment (see Results). This is most easily explained by the [Ca2+] locally near the release channels being considerably higher than in the bathing solution (e.g. > 10 μmversus 1.5 μm), owing to the heavy loading of the SR and the continual efflux of Ca2+, with this elevated [Ca2+] eventually causing alterations in the SR handling properties. Thus, it seems quite possible that the [Ca2+] in intact fibres subjected to prolonged, vigorous activity, would locally reach similar high levels and consequently would induce altered Ca2+ handling properties like those described here.
Physiological relevance
Westerblad et al. (1993) observed that the resting [Ca2+] in mouse fast-twitch fibres was still elevated by ∼40 % more than 30 min after induction of long-lasting ‘low-frequency’ fatigue. Based on mathematical modelling of the final fall in [Ca2+] after a tetanus, they suggested that there had been a 2-fold decrease in SR pumping rate and a ∼2.5-fold increase in the small level of SR Ca2+ leakage, though the exact values were quite model dependent. It has also been reported that following extremely prolonged (7 h) exercise in rats, the Ca2+ uptake capacity of the SR from both fast- and slow-twitch muscles was decreased by about 20 to 40 %, with no change in SR ATPase activity (Fitts et al. 1982). The authors suggested that Ca2+ transport by the SR ATPase became uncoupled or that the SR became ‘leaky’. The results of both studies might be explained by findings here. Specifically, the high [Ca2+] reached locally during the stimulus periods may have induced a long lasting increase in the rate of Ca2+ leakage from the SR, leading to reduced net Ca2+ uptake capacity and an increased resting [Ca2+].
If net Ca2+ uptake by the SR is reduced at the [Ca2+] close to the resting level (i.e. pCa ≤ 7.0), be this due entirely to increased Ca2+ leakage or also to reduced Ca2+ pumping, the amount of releasable Ca2+ in the SR of an intact fibre must inevitably be reduced over time. Furthermore, because the [Ca2+] in the cytoplasm is regulated in the long term by Ca2+ movements into and out of the muscle fibre, it is to be expected that the elevated intracellular [Ca2+] will ultimately lead to net loss of Ca2+ from the fibre as a whole. Thus, if the changes in net SR Ca2+ uptake reported here occurred in an intact fibre, it might well lead to substantial depletion of releasable Ca2+ in the SR. This effect would compound any decrease in Ca2+ release caused by uncoupling of the voltage sensors and Ca2+-release channels. Consequently, the reduction in Ca2+ release seen in low frequency fatigue may be due to the high local [Ca2+] occurring during stimulation inducing changes in both the SR properties and the coupling mechanism. It is not certain whether or how these two processes are linked, but one explanation is that both are caused by the physical changes occurring at the triad junction (Lamb et al. 1995; see swollen SR and altered triad dimensions). Alternatively, high [Ca2+] treatment might cause some change in the proportion of Ca2+ release channels in the ryanodine-sensitive and ryanodine-insensitive states (Pessah et al. 1997) which results both in the uncoupling and increased Ca2+ leakage. Whatever the relationship, if any, between these two phenomena, both may be of importance in muscle function in exercise and disease.
Acknowledgments
We thank Professor D. G. Stephenson for helpful comments and the National Health & Medical Research Council of Australia for financial support.
References
- Allen DG, Lännergren J, Westerblad H. Muscle cell function during prolonged activity: cellular mechanisms of fatigue. Experimental Physiology. 1995;80:497–527. doi: 10.1113/expphysiol.1995.sp003864. [DOI] [PubMed] [Google Scholar]
- Bakker AJ, Lamb GD, Stephenson DG. The effect of 2,5-di-(tert-butyl)-1,4-hydroquinone on force responses and the contractile apparatus in mechanically skinned muscle fibres of the rat and toad. Journal of Muscle Research and Cell Motility. 1996;17:55–67. doi: 10.1007/BF00140324. [DOI] [PubMed] [Google Scholar]
- Chin ER, Allen DG. The role of elevations in intracellular [Ca2+] in the development of low frequency fatigue in mouse single muscle fibres. The Journal of Physiology. 1996;491:813–824. doi: 10.1113/jphysiol.1996.sp021259. [DOI] [PMC free article] [PubMed] [Google Scholar]
- Chin ER, Balnave CD, Allen DG. Role of intracellular calcium and metabolites in low-frequency fatigue of mouse skeletal muscle. American Journal of Physiology. 1997;272:C550–559. doi: 10.1152/ajpcell.1997.272.2.C550. [DOI] [PubMed] [Google Scholar]
- Du G, Ashley CC, Lea TJ. Ca2+ effluxes from the sarcoplasmic reticulum vesicles of frog muscle: effects of cyclopiazonic acid and thapsigargin. Cell Calcium. 1996;20:355–359. doi: 10.1016/s0143-4160(96)90041-x. [DOI] [PubMed] [Google Scholar]
- Du G, Ashley CC, Lea TJ. The cation selectivity of the sarcoball Ca2+ channel in frog muscle fibres. Pflügers Archiv. 1998;436:365–370. doi: 10.1007/s004240050644. [DOI] [PubMed] [Google Scholar]
- Edwards RHT, Hill DK, Jones DA, Merton PA. Fatigue of long duration in human skeletal muscle after exercise. The Journal of Physiology. 1977;272:769–778. doi: 10.1113/jphysiol.1977.sp012072. [DOI] [PMC free article] [PubMed] [Google Scholar]
- Endo M. Calcium release from sarcoplasmic reticulum. Current Topics in Membranes and Transport. 1985;25:181–230. [Google Scholar]
- Fink RHA, Stephenson DG, Williams DA. Potassium and ionic strength effects on the isometric force of skinned twitch muscle fibres of the rat and toad. The Journal of Physiology. 1986;370:317–337. doi: 10.1113/jphysiol.1986.sp015937. [DOI] [PMC free article] [PubMed] [Google Scholar]
- Fitts RH, Courtright JB, Kim DH, Witzmann FA. Muscle fatigue with prolonged exercise: contractile and biochemical alterations. American Journal of Physiology. 1982;242:C65–73. doi: 10.1152/ajpcell.1982.242.1.C65. [DOI] [PubMed] [Google Scholar]
- Fryer MW, Stephenson DG. Total and sarcoplasmic reticulum calcium contents of skinned fibres from rat skeletal muscle. The Journal of Physiology. 1996;493:357–370. doi: 10.1113/jphysiol.1996.sp021388. [DOI] [PMC free article] [PubMed] [Google Scholar]
- Fuchs F. The binding of calcium to detergent-extracted rabbit psoas muscle fibres during relaxation and force generation. Journal of Muscle Research and Cell Motility. 1985;6:477–486. doi: 10.1007/BF00712584. [DOI] [PubMed] [Google Scholar]
- Harrison SM, Bers DM. The effect of temperature and ionic strength on the apparent Ca-affinity of EGTA and the analogous Ca-chelators BAPTA and dibromo-BAPTA. Biochimica et Biophysica Acta. 1987;925:133–143. doi: 10.1016/0304-4165(87)90102-4. [DOI] [PubMed] [Google Scholar]
- Kabbara AA, Stephenson DG. Effects of Mg2+ on Ca2+ handling by the sarcoplasmic reticulum in skinned skeletal and cardiac muscle fibres. Pflügers Archiv. 1994;428:331–339. doi: 10.1007/BF00724515. [DOI] [PubMed] [Google Scholar]
- Kargacin GJ, Ali Z, Kargacin ME. Ruthenium red reduces the Ca2+ sensitivity of Ca2+ uptake into cardiac sarcoplasmic reticulum. Pflügers Archiv. 1998;436:338–342. doi: 10.1007/s004240050641. [DOI] [PubMed] [Google Scholar]
- Lamb GD, Junankar PR, Stephenson DG. Raised intracellular [Ca2+] abolishes excitation-contraction coupling in skeletal muscle fibres of rat and toad. The Journal of Physiology. 1995;489:349–362. doi: 10.1113/jphysiol.1995.sp021056. [DOI] [PMC free article] [PubMed] [Google Scholar]
- Lamb GD, Stephenson DG. Calcium release in skinned muscle fibres of the toad by transverse tubule depolarization or by direct stimulation. The Journal of Physiology. 1990;423:495–517. doi: 10.1113/jphysiol.1990.sp018036. [DOI] [PMC free article] [PubMed] [Google Scholar]
- Lamb GD, Stephenson DG. Excitation-contraction coupling in skeletal muscle fibres of rat and toad in the presence of GTPγS. The Journal of Physiology. 1991;444:65–84. doi: 10.1113/jphysiol.1991.sp018866. [DOI] [PMC free article] [PubMed] [Google Scholar]
- Lamb GD, Stephenson DG. Effects of intracellular pH and [Mg2+] on excitation-contraction coupling in skeletal muscle fibres of the rat. The Journal of Physiology. 1994;478:331–339. doi: 10.1113/jphysiol.1994.sp020253. [DOI] [PMC free article] [PubMed] [Google Scholar]
- Laver DR, Owen VJ, Junankar PR, Taske NL, Dulhunty AF, Lamb GD. Reduced inhibitory effect of Mg2+ on ryanodyine receptor-Ca2+ release channels in malignant hyperthermia. Biophysical Journal. 1997;73:1913–1924. doi: 10.1016/S0006-3495(97)78222-5. [DOI] [PMC free article] [PubMed] [Google Scholar]
- Meissner G, Darling E, Eveleth J. Kinetics of rapid Ca2+ release by sarcoplasmic reticulum. Effects of Ca2+, Mg2+, and adenine nucleotides. Biochemistry. 1986;25:236–244. doi: 10.1021/bi00349a033. [DOI] [PubMed] [Google Scholar]
- Melzer W, Herrmann-Frank A, Lüttgau HC. The role of Ca2+ ions in excitation-contraction coupling of skeletal muscle fibres. Biochimica et Biophysica Acta. 1995;1241:59–116. doi: 10.1016/0304-4157(94)00014-5. [DOI] [PubMed] [Google Scholar]
- Owen VJ, Lamb GD, Stephenson DG, Fryer MW. Relationship between depolarization-induced force responses and Ca2+ content in skeletal muscle fibres of rat and toad. The Journal of Physiology. 1997;498:571–586. doi: 10.1113/jphysiol.1997.sp021884. [DOI] [PMC free article] [PubMed] [Google Scholar]
- Pessah IN, Molinski TF, Meloy TD, Wong P, Buck ED, Allen PD, Mohr FC, Mack MM. Bastadins relate ryanodine-sensitive and -insensitive Ca2+ efflux pathways in skeletal SR and BC3H1 cells. American Journal of Physiology. 1997;272:C601–614. doi: 10.1152/ajpcell.1997.272.2.C601. [DOI] [PubMed] [Google Scholar]
- Shirokova N, Garcia J, Pizarro G, Rios E. Ca2+ release from the sarcoplasmic reticulum compared in amphibian and mammalian skeletal muscle. The Journal of Physiology. 1996;107:1–18. doi: 10.1085/jgp.107.1.1. [DOI] [PMC free article] [PubMed] [Google Scholar]
- Soler F, Fernandez-Belda F, Gomez-Fernandez JC. The Ca2+ release channel in junctional sarcoplasmic reticulum: gating and blockade by cations. International Journal of Biochemistry. 1992;24:903–909. doi: 10.1016/0020-711x(92)90095-i. [DOI] [PubMed] [Google Scholar]
- Stephenson DG, Williams DA. Calcium-activated force responses in fast-and slow-twitch skinned muscle fibres of the rat at different temperatures. The Journal of Physiology. 1981;317:281–302. doi: 10.1113/jphysiol.1981.sp013825. [DOI] [PMC free article] [PubMed] [Google Scholar]
- Szentesi P, Zaremba R, Stienen GJM. Calcium handling by the sarcoplasmic reticulum during oscillatory contractions of skinned skeletal muscle fibres. Journal of Muscle Research and Cell Motility. 1998;19:675–687. doi: 10.1023/a:1005385232010. [DOI] [PubMed] [Google Scholar]
- Wendt IR, Stephenson DG. Effects of caffeine on Ca-activated force production in skinned cardiac and skeletal muscle fibres of the rat. The Journal of Physiology. 1983;398:210–216. doi: 10.1007/BF00657153. [DOI] [PubMed] [Google Scholar]
- Westerblad H, Duty S, Allen DG. Intracellular calcium concentration during low-frequency fatigue in isolated single fibres of mouse skeletal muscle. Journal of Applied Physiology. 1993;75:382–388. doi: 10.1152/jappl.1993.75.1.382. [DOI] [PubMed] [Google Scholar]