

Abstract
Cardiac V3 myosin generates slower actin filament velocities and higher average isometric forces (in an in vitro motility assay) when compared with the V1 isoform.
To account for differences in V1 and V3 force and motion generation at the molecular level, we characterized the mechanics and kinetics of single V1 and V3 myosin molecules using a dual laser trap setup.
No differences in either unitary displacement (≈7 nm) or force (≈0.8 pN) were observed between isoforms; however, the duration of unitary displacement events was significantly longer for the V3 isoform at MgATP concentrations > 10 μm.
Our results were interpreted on the basis of a cross-bridge model in which displacement event durations were determined by the rates of MgADP release from, and MgATP binding to, myosin.
We propose that the release rate of MgADP from V3 myosin is half that of V1 myosin without any difference in their rates of MgATP binding; thus, kinetic differences between the two cardiac myosin isoforms are sufficient to account for their functional diversity.
Myosin is a mechanoenzyme that generates force and motion by cyclically interacting with actin in a reaction driven by the hydrolysis of ATP. Type II myosins, including cardiac, skeletal and smooth muscle myosin, are dimers. Each myosin monomer is structurally defined by a myosin heavy chain (MHC) and two non-covalently bound light chains (Weeds & Lowey, 1971). The MHC contains a globular catalytic domain that possesses the hydrolytic and motor function of myosin.
In the heart, both α- and β-MHC isoforms exist (Hoh et al. 1979). Expression of these isoforms is species dependent and both developmentally and hormonally regulated (Everett et al. 1984; Lompre et al. 1984). In smaller adult mammals (e.g. mouse and rat), α-MHC expression predominates (Hamilton & Ianuzzo, 1991) and myosin molecules associate as αα-MHC homodimers known as V1 cardiac myosin. V3 cardiac myosin, a ββ-MHC homodimer, predominates in larger mammals (Hamilton & Ianuzzo, 1991) and humans (Mercadier et al. 1983). Certain pathological conditions, such as pressure-overload hypertrophy or hyperthyroidism, can change the pattern of isoform expression (Litten et al. 1982; Nagai et al. 1987). In the rabbit, pressure-overload hypertrophy promotes an increase in β-MHC expression (up to > 95 %) whereas treatment with L-thyroxine shifts the expression to predominantly α-MHC (> 99 %) (Litten et al. 1982). Reports of pathologically induced changes in MHC isoform expression in human ventricular myocardium, at both the mRNA and protein level, are conflicting and difficult to reconcile (Scheir & Adelstein, 1982; Mercadier et al. 1983; Alousi et al. 1990; Lowes et al. 1997; Nakao et al. 1997). However, recent reports (Lowes et al. 1997; Nakao et al. 1997) suggest that a significant downregulation of α-MHC mRNA expression may indeed be of some consequence to the failing human heart.
Changes in cardiac myosin isoform expression should have functional consequences in the myocardium due to the hydrolytic and mechanical differences between V1 and V3 myosin. For example, both the Ca2+-stimulated and actin-activated ATPase activity of V1 myosin are approximately twice that of V3 myosin (Pope et al. 1980; VanBuren et al. 1995). In addition, fibre preparations containing V1 myosin have faster maximal velocities of unloaded shortening than fibres containing V3 myosin (Maughan et al. 1974; Cappelli et al. 1989). Although differences in peak twitch tension are not apparent, the energetic economy and tension-time integral for preparations containing predominantly V1 myosin are less than that of preparations with predominantly V3 myosin (Alpert & Mulieri, 1982; Holubarsch et al. 1985; Hasenfuss et al. 1991). These mechanical differences between V1 and V3 myosin may reflect inherent differences between these myosins' force- and motion-generating capacities.
In an in vitro motility assay, V1 cardiac myosin propels actin filaments at velocities (vmax) 2-3 times faster than V3 myosin (Harris et al. 1994; Suguira et al. 1995; VanBuren et al. 1995), while generating half the average isometric force (Favg) (VanBuren et al. 1995). At the single molecule level, vmax is related to the unitary step displacement (d) and step duration (ton) of myosin, under unloaded conditions, as follows (Huxley, 1990): vmax≈ (d/ton). Therefore, differences in d and/or ton may account for differences in vmax for V1 and V3 myosin.
Favg is defined by myosin's unitary force (F) and duty cycle (f), with f being the fraction of the cross-bridge cycle time during which myosin is strongly bound to actin under isometric conditions as follows (VanBuren et al. 1994): Favg=Ff. Thus differences in Favg between V1 and V3 myosin can be accounted for by changes in F and/or duty cycle (VanBuren et al. 1995). In both cases, differences in vmax and Favg most probably reflect inherent differences in these myosins' molecular mechanics (i.e. d and F) and/or kinetics of the cross-bridge cycle (i.e. ton and f).
To address these possibilities, we have used a dual laser trap to directly measure the molecular parameters d, F and ton. Our results suggest that differences between the V1 and V3 myosin isoforms are solely kinetic. Furthermore, we propose a mechanism to account for the kinetic differences that is related to the rate of MgADP release from the myosin molecule.
METHODS
Proteins
Myosin
Shifts to predominate V1 (induced by L-thyroxine) or V3 isoform expression (induced by constriction of the pulmonary artery) were generated in myocardium of adult male New Zealand White rabbits (weighing 1.5-1.7 kg) as previously described (Litten et al. 1982). Animals were killed by blunt cranial trauma, in accordance with the University of Vermont Institutional Animal Care and Use Committee. Cardiac myosin was isolated using a slight modification of the method of Nguyen et al. (1996). Briefly, 100 mg samples of right ventricular tissue were manually homogenized using a Corning glass-glass homogenizer in 0.2 ml ice-cold extraction buffer (EB: 0.3 M KCl, 0.15 M K2HPO4, 10 mM Na4P2O7, 1 mM MgCl2, 1 mM MgATP, 2 mM DTT, pH 6.8). The homogenate was extracted at 4°C for 1 h with gentle stirring in a total volume of 0.4 ml EB and then centrifuged for 1 h at 140 000 g using a Beckman TLX tabletop ultracentrifuge. The supernatant was collected and diluted 25 × with ice-cold 2 mM DTT and allowed to precipitate for 1 h on ice. The myosin precipitate was collected by centrifugation for 20 min at 20 000 g with the use of a Beckman SW41 swinging bucket rotor in a Beckman ultracentrifuge. Pellets were resuspended in a solution containing 0.6 M KCl, 40 mM Imidazole, 4 mM DTT, pH 6.8, and the protein concentration determined using the Bio-rad protein assay (Bio-rad Laboratories, Hercules, CA, USA). The myosin stock was diluted 1:1 with glycerol and stored at -20°C. One to three milligrams of myosin were routinely isolated using this procedure. Purity was assessed by SDS-PAGE. Myosin isoform content in the rabbit hearts was previously determined by pyrophosphate gel electrophoresis and densitometric analysis (Litten et al. 1982). Prior to use in the laser trap assay, V1 and V3 myosin were further purified from the myosin stock by centrifugation in the presence of equimolar actin and 1 mM ATP in myosin buffer (MB: 0.3 M KCl, 25 mM Imidazole, 1 mM EGTA, 4 mM MgCl2, 10 mM DTT, pH 7.4). Proteins were used within 1-2 days of preparation.
Actin
Actin was isolated from chicken pectoralis as previously described (Pardee & Spudich, 1982) and fluorescently labelled by incubation with tetramethlyrhodamine isothiocyanate-labelled phalloidin (TRITC-phalloidin) (Sigma) overnight prior to use (Warshaw et al. 1990).
Laser-trap experimental protocol
Flow cells and solutions
Details of flow cell construction, solution composition and the experimental protocol have been previously published in detail (Dupuis et al. 1997; Guilford et al. 1997). Briefly, flow cells (∼20 μl) were constructed by gluing (UV curable-Norland Optical Adhesive, New Brunswick, NJ, USA) a 22 mm × 22 mm coverslip, coated with 2 μm silica beads (the beads act as pedestals elevating the myosin off the surface of the coverslip) and nitrocellulose, to a 24 mm × 30 mm coverslip with 100 μm mylar shims (McMaster Carr, New Brunswick, NJ, USA). The experimental flow cell chamber was prepared by applying solutions in the following order: (1) 20 μl of 1 μg ml−1 V1 or V3 myosin in MB, incubation for 2 min, (2) 20 μl of 0.5 mg ml−1 bovine serum albumin (BSA) in MB, incubation for 1 min, (3) 3 × 20 μl washes with actin buffer (AB: 25 mM KCl, 25 mM imidazole, 1 mM EGTA, 4 mM MgCl2, 10 mM DTT, pH 7.4, with the addition of oxygen scavengers (0.1 mg ml−1 glucose oxidase, 0.018 mg ml−1 catalase, 2.3 mg ml−1 glucose)), (4) 3 × 20 μl washes with AB containing 0.001-1 mM MgATP, and (5) 20 μl of a solution composed of 1 nM TRITC- phalloidin-labelled actin and 0.013 % NEM-myosin-coated polystyrene beads (1.0 μm diameter, Polysciences Inc., Warrington, PA, USA) in AB containing 0.001-1 mM MgATP.
Laser-trap experiments
Details of our laser trap, including trap stiffness, quadrant detector calibration and data analysis have been described in detail elsewhere (Dupuis et al. 1997; Guilford et al. 1997). In brief, the dual laser trap setup, similar in design to that previously described (Finer et al. 1994), was implemented by expanding two orthogonally polarized beams to fill the back plane of a high numerical aperture objective (Nikon, × 100 planapo, n.a. 1.4). The two beams were split from a single beam generated by a variable power Nd:YAG solid state laser (Spectra Physics, Model T-10V-106C, TEM00, maximum power 2.5 W, 1064 nm). Each beam formed an independent trap in which an NEM-myosin-coated polystyrene bead was trapped. By microscope stage manipulation, the ends of a fluorescently labelled actin filament were attached to the trapped beads. After pre-tensioning the filament (∼4 pN), the bead-actin-bead system was brought into close proximity of the surface of a silica bead pedestal sparsely coated with whole V1 or V3 myosin, allowing unitary events to be observed. All experiments were performed at 25°C, precisely controlled by a thermal jacket on the microscope objective.
Unitary displacement measurements
Unitary displacement events were detected at low trap stiffness (∼0.02 pN nm−1) as changes in the bright field image position of one of the trapped beads. This image was projected onto a quadrant photodiode detector. Displacement signals were obtained in both the x and y directions, where x was parallel to the axis of the actin filament. Data records were rejected if significant activity was observed in the y trace (perpendicular to the axis of the actin filament).
Force measurements
Force was measured under feedback control as previously described (Guilford et al. 1997; Lauzon et al. 1998) with the use of an acousto-optic modulator (AOM; Neos Technologies, Melbourne, FL, USA). The AOM was used to rapidly deflect the laser beam to counter the force produced by myosin, thus keeping the bead stationary. Forces were obtained by calibration of the correction signal sent to the AOM from the feedback circuitry. In feedback mode, trap stiffness was effectively 2 orders of magnitude greater than in displacement mode. The bead position was controlled to a frequency of 140 Hz.
Note that the sub-piconewton forces measured in this study and in other studies using a similar technique should be interpreted with caution (Molloy et al. 1995; Guilford et al. 1997; Tyska et al. 1999). Specifically, the mode of attachment for both the actin to the beads and the myosin to the coverslip surface may contribute significant compliance to the preparation (Dupuis et al. 1997; Mehta et al. 1997; Veigel et al. 1998). Such compliance, in addition to a relatively slow force feedback system, will result in an underestimate of the true force-generating potential of myosin. In fact, the myosin power stroke probably occurs much faster than the feedback system can respond, such that our measure of force may only be an estimate of the load-bearing capacity of myosin rather than the unitary force of the power stroke.
Data analysis
Mean-variance analysis
Displacement (Bessel filtered at 2 kHz) and force signals were digitized at 4 kHz and analysed using the mean-variance (MV) analysis technique. This technique was originally developed for use in measuring single ion channel currents and kinetics (Patlak, 1993). Application of this analysis technique for the determination of single myosin molecule mechanical and kinetic parameters, i.e. d, F and ton, has been described in detail elsewhere (Guilford et al. 1997). Briefly, MV analysis involves passing a time window over the data, point by point, and calculating a mean and variance for all points contained in that window. The mean and variance data are then compiled as a 3-dimensional histogram: mean (X-axis), variance (Y-axis) and counts (Z-axis) (see Fig. 1B and D). For clarity, MV histograms are presented in 2 dimensions (i.e. mean and variance) with the total counts at a given mean and variance being colour mapped. Typically, MV histograms have two apparent regions of high density (populations) that can be attributed to baseline and positive unitary events. However, in some cases negative events (see Fig. 1B, arrow) contribute noticeable density to the MV histograms. A complete description of the statistical characterization of the baseline and positive event populations, as well as the meaning of negative events was previously reported (Guilford et al. 1997). Since baseline and event populations do overlap (as seen in Fig. 1B and D), it is imperative that an accurate description of the baseline data be obtained and then subtracted from the raw MV histogram. Once subtracted, the only remaining entries to the MV histogram are those from unitary events and transitions between the baseline and the event itself (see minus baseline sections in Fig. 1B and D). The event population can then be fitted to obtain a mean displacement or force that defines the population d or F, respectively.
Figure 1. Determination of unitary step displacement (d) and force (F) in V1 and V3 cardiac myosin.

A, 5 s of time-series displacement data obtained with V1 myosin (upper trace) and V3 myosin (lower trace) at 0.005 mM MgATP. Arrows bracket discrete displacement events. B, corresponding raw and baseline-subtracted (- Baseline) MV displacement histograms for the complete (≈60 s) time-series data shown in Fig. 1A. The MV histograms were generated using a 20 ms window. For a complete description of MV analysis see Methods. The letters ‘B’ and ‘e’ identify the baseline and event populations, respectively. MV histograms are presented 2-dimensionally with the third dimension, i.e. counts, colour mapped. A colour bar (log scale) that applies to all histograms is illustrated, with minimum and maximum counts of -222 and 1268 and -270 and 2572 for the V1 and V3 histograms, respectively. For these data, the event populations for the V1 and V3 were fitted at 4.9 ± 0.1 nm (mean ±s.d.) and 5.4 ± 0.1 nm, respectively. See Table 1 for compilation of all d values for the various MgATP concentrations studied. Occasionally, events in the negative direction are observed and are noted in the V1 MV histogram by an arrow. C, 5 s of time-series force data obtained with V1 myosin (2 upper traces) and V3 myosin (2 lower traces) at 0.005 mM MgATP. For each isoform, the upper time-series trace is the AOM correction signal, which is calibrated to force. The lower trace is the residual displacement trace in feedback mode, i.e. the motion of the bead while under feedback control. Arrows bracket discrete unitary force events, where the reduction in variance is most apparent on the residual displacement trace. D, corresponding raw and baseline-subtracted (- Baseline) MV force histograms generated using a 20 ms window from the complete time-series force data shown in Fig. 1C. The colour bar (log scale) minimum and maximums were -148 and 769 and -178 and 1142 for the V1 and V3 isoforms, respectively. The event populations in the V1 and V3 histograms were fitted at 0.7 ± 0.02 and 1.2 ± 0.02 pN, respectively.
Additional resolving power is obtained through MV analysis, as event populations are offset from the baseline population by the reduction in variance that occurs during a unitary event. This decrease in variance occurs as myosin attaches to actin that reduces the inherent bead-actin-bead displacement noise attributed to Brownian motion. In feedback mode, the variance reductions are not as prominent in the force trace as in displacement mode. However, significant reductions in variance do exist in the residual displacement time-series traces (lower time-series data traces obtained with V1 and V3 myosin illustrated in Fig. 1C). Therefore, force MV histograms are generated using the AOM correction signal to calculate a mean and the residual displacement trace for the variance.
In some cases, MV histograms are described by more than one event population. Multiple event populations are usually fitted as harmonics (2x, 3x) of the mean (x) of the first event population. This result suggests that potentially more than one myosin molecule may be interacting with the actin filament. Therefore, we only report the values for the first positive event population.
To estimate ton, MV histograms are generated using different time windows (W), and the volume (V) of counts in the event population at each window width is recorded. V will be related to the number of events (N) with a duration, ton, that is equal to or greater than that time window. Thus V will decay exponentially as window width increases (Fig. 2A) and can be fitted by the equation: V =tonNe-W/ton. The volume data were fitted to this equation and an estimate for both ton and N determined. As illustrated in Fig. 2B, when differences in the rate of the exponential decay are apparent then differences in average ton duration are predicted.
Figure 2. Determination of ton.
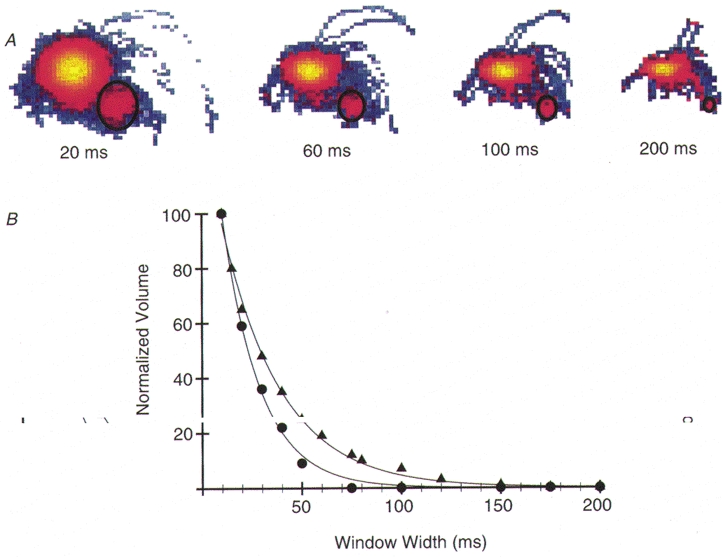
A, representative MV histogram illustrating the exponential decay in the event population volume (encircled by black ellipse) as window width is increased. B, representative volume versus window width curves generated from data collected with V1 and V3 myosin at 0.010 mM MgATP. To determine average ton a gallery of MV histograms generated at different time window widths (10, 15, 20, 30, 40, 50, 60, 75, 80, 100, 120, 150, 175 and 200 ms) was created. The number of counts in the event populations of the various MV histograms was recorded. As illustrated in Fig. 2A the volume of counts decays exponentially as time window widths increase. For illustrative purposes, the data were normalized to the maximum number of counts obtained at the 10 ms window width. As with all data, the normalized data were fitted to the equation: V =N tone-W/ton. N is the estimated number of events within the record and W is the window width. The V1 plot (•) was fitted with ton= 18 ± 0.01 ms (mean ± s.e.) and N = 81± 4, r2= 0.997 whereas the V3 plot (▴) was fitted with ton= 31 ± 0.01 ms with an N = 320± 13, r2= 0.999. Estimates of N vary with the total record length. The representative V1 and V3 data sets were chosen because their average ton values were similar to the mean ton calculated for all V1 and V3 data, respectively, at 0.01 mM MgATP.
RESULTS
Unitary displacements
To account for the previously reported 2-fold difference (Harris et al. 1994; Suguira et al. 1995; VanBuren et al. 1995) in actin filament velocity and average force generation we measured the molecular parameters, d, F and ton, for both V1 and V3 myosin in the laser trap.
In Fig. 1A, 5 s of displacement data for V1 and V3 myosin obtained in 0.005 mM MgATP are shown. These data show discrete unitary events, bracketed by arrows, that are interspersed within the Brownian noise (baseline) of the system. Note the discernable reduction (∼30-40 % decrease) in noise variance that occurs during the events, as described above. This reduction in variance was used to our advantage in the MV analysis to determine if differences in unitary displacement amplitude exist between the V1 and V3 myosin isoforms.
MV histograms, Fig. 1B, were generated from the complete time-series data records (at least 60 s) from which the 5 s examples for the V1 and V3 isoforms were taken. The raw displacement MV histograms are characterized by two distinct regions with arches that connect these regions. Arches are formed in MV histograms as the time window crosses over a transition between two steady levels. In this case, arches form during transitions from baseline (B), which is centred at a mean displacement of 0 nm, to an event level. Baseline and event populations do overlap; thus it is imperative that an accurate statistical description of the baseline data be obtained and subtracted from the raw MV histogram (see Fig. 1B; - Baseline). After baseline subtraction, the event populations (e) remain and have a mean displacement that differs from zero. The event populations are statistically characterized, with the mean displacements derived from the fit to the event population expressed relative to the baseline population. In all instances, the predominant event population is positive, although in some experiments a small but noticeable negative event population (see Fig. 1B, arrow) appears.
For the given displacement data presented in Fig. 1, the predominant event populations were fitted at ∼5 nm for both the V1 and V3 myosin. However, an assessment of the unitary displacement was determined with multiple myosin preparations at several MgATP concentrations (i.e. 0.001- 1 mM) with the results presented in Table 1. MV histograms were generated from time-series data of at least 1 min in length, containing an estimated tens to hundreds of unitary events. There was no statistical correlation between MgATP concentration and d either within or between isoforms. The mean apparent d across all MgATP concentrations was 7.8 ± 3.2 nm (mean ±s.d., n = 36) and 7.2 ± 3.1 nm (n = 34) for the V1 and V3 isoforms, respectively, and were not statistically different.
Table 1.
d and ton values for V1 and V3 isoforms at varying [MgATP]
| [MgATP] (mm) | |||||
|---|---|---|---|---|---|
| 0.001 | 0.005 | 0.01 | 1 | ||
| d (nm) | V1 | 8 ± 4 (7) | 6 ± 3 (11) | 8 ± 2 (10) | 9 ± 3 (8) |
| V3 | 6 ± 2 (4) | 7 ± 2 (12) | 6 ± 3 (11) | 9 ± 4 (7) | |
| ton (ms) | V1 | 245 ± 38 (7) | 66 ± 7 (10) | 19 ± 2 (12) | 11 ± 2 (8) |
| V3 | 212 ± 35 (7) | 64 ± 9 (9) | 32 ± 4* (14) | 19 ± 3* (8) | |
d values (mean ± s.d.) and ton values (mean ± s.e.m.) at 0.001, 0.005, 0.010 and 1 mm MgATP calculated by MV analysis for the V1 and V3 myosin isoforms. A complete description of MV analysis is presented in Methods. Numbers in parentheses represent the number of MV histograms analysed, which in turn represent the number of independent myosins studied. Tens to hundreds of events are represented within a given MV histogram. There is a significant dependence of ton on [MgATP] as determined by ANOVA (P < 0.001) with no such dependence of d on [MgATP] (P = 0.381). For a given [MgATP], statistical significance for differences in ton between V1 and V3 myosin was determined and denoted as
P < 0.05, Student's t test.
Unitary force measurements
As with the displacement data, unitary force events are discernable in the representative time-series records (Fig. 1C). All force data were collected at 0.005 mM MgATP. In contrast to the displacement records, there is no noticeable reduction in variance upon myosin attachment in the force data (Fig. 1C, upper trace for both V1 and V3 myosin). Instead, under feedback control, changes in variance are observed in the residual displacement traces (Fig. 1C, lower trace for both V1 and V3 myosin). As with the displacement data, the raw force MV histograms (Fig. 1D) from the complete time-series record are characterized by a significant baseline population (B) centred at 0 pN. Once again, after baseline subtraction, event populations (e) appear at a higher mean force. Baseline and event populations are statistically fitted in the same manner as described for the displacement histograms (see Methods). For the specific MV histograms shown, the unitary force event populations were fitted to means of 0.7 ± 0.02 pN (mean ±s.d.) and 1.2 ± 0.02 pN for the V1 and V3 myosins, respectively. For all myosins, the mean apparent F was not statistically different with estimates of 0.8 ± 0.3 pN (n = 17) and 0.8 ± 0.4 pN (n = 16) for the V1 and V3 isoforms, respectively.
Determination of displacement step duration (ton)
Having determined that the mechanics of the two myosin molecules did not differ it is likely that differences in the kinetics, i.e. ton, account for isoform differences in the velocity of motion. The average step duration (ton) was determined for V1 and V3 myosin at various MgATP concentrations and the results presented in Table 1. The ton for both V1 and V3 isoforms was dependent on MgATP concentration (see Fig. 3) with the duration increasing with lower MgATP concentration. However, when isoforms were compared at a given MgATP concentration, no difference existed at 0.001 or 0.005 mM MgATP; this accounts for the lack of any noticeable difference in step duration for the displacement records shown in Fig. 1A, where data were collected at 0.005 mM MgATP. In contrast, at 0.01 and 1.0 mM MgATP, the average ton for V3 myosin is 1.7 times that of V1 myosin. The ability to discern such a difference in tonvalues using the MV analysis is illustrated in Fig. 2B where the normalized relationship between event volume and window width is presented for an individual V1 and V3 data set collected at 0.01 mM MgATP.
Figure 3. Representative displacement time-series data traces (5 s) obtained with V1 cardiac myosin at various MgATP concentrations.

Arrows bracket discrete unitary displacement events (at 1 mM MgATP one arrow identifies each event). As shown there are obvious differences in the durations of unitary events at different MgATP concentrations. At 1 mM MgATP events become too fast to visually identify and thus the MV analysis becomes essential for estimating d and ton. The estimated d and ton for the V1 and V3 myosin for each [MgATP] range are given in Table 1.
DISCUSSION
In this study we have determined that inherent differences in the cardiac myosin isoforms can account for the differences in the force- and motion-generating capacities of myocardial tissue composed primarily of either the V1 or V3 myosin isoforms. Although differences do not exist in the abilities of these myosins to produce force, F, or motion, d, the time course, or kinetics, i.e. ton, of their mechanical performance is significantly different. Based on our studies, this kinetic difference would be most apparent under physiological MgATP concentrations and can be attributed to a difference in the rate of MgADP release from the V1, versus the V3, myosin catalytic site.
Unitary displacements
Comparing V1 and V3 myosin at the single molecule level, we do not find any differences in the motion-generating capacity of these myosins as evidenced by an ∼7 nm unitary displacement for both myosins. Thus at the molecular level, differences in the mechanical capacities between the V1 and V3 myosins cannot account for the differences in the velocities of these myosin isoforms. The d values we report are slightly lower than those previously reported (Suguira et al. 1998) (∼8-9 nm) and even lower than those from our own laboratory for skeletal and smooth muscle myosin (∼10-11 nm; Guilford et al. 1997; Lauzon et al. 1998). Our lower d estimates for the cardiac myosins can be explained by the fact that in analysing their data, Sugiura et al. (1998) would have biased their estimate to a larger value since they scored events by eye and accepted only events that were ≥ 5 nm. However, using mean-variance (MV) analysis, no such cut-off is necessary and event detection is statistical rather than subjective. Therefore our estimates should be a more accurate representation of these myosins' unitary step displacements.
Are the lower values for the cardiac myosins, compared to our reported values for either skeletal or smooth muscle myosin, indicative of differences in the molecular mechanics amongst muscle myosins? Data from our laboratory (Tyska et al. 1999) suggest that the displacement generated by either double-headed smooth or skeletal muscle myosin (∼10-11 nm) is twice that of biochemically prepared single-headed myosin (∼4-6 nm). These data suggest that the individual heads of myosin are capable of generating motion and that the two heads interact to generate twice the displacement of a single head. One could speculate that the lower d values for the cardiac myosins might reflect a difference in the head-to-head interaction for cardiac myosin compared with the smooth and skeletal muscle myosins. If so, cardiac myosin might operate more often as a single-headed myosin. To test this hypothesis, experiments that compare the mechanics of single- versus double-headed cardiac myosin must be performed.
Unitary forces
Once again, previously described differences (VanBuren et al. 1995) in the average isometric force-generating capacity between V1 and V3 myosins are most probably due to differences in cross-bridge kinetics. This conclusion is based on the observation that F is not different between isoforms, in agreement with Sugiura et al. (1998). The similarity in F suggests that the greater average force-generating capacity of V3 myosin must be due to a 2-fold higher duty cycle than that of V1 myosin. Therefore, kinetic differences between V1 and V3 myosin are the sole determinant of the differences in the force-generating capacity of these myosins.
A kinetic mechanism
If the kinetics of the cross-bridge cycle differ for V1 and V3 myosin as shown here and as previously suggested by Sugiura et al. (1998), is it possible to identify which step or steps in the cycle are isoform dependent? Since the kinetics of the cycle are reflected in our measurement of ton, it may be possible to relate ton to one or more transitions in the cross-bridge cycle.
We have previously shown that ton equals the time that myosin is strongly bound to actin (illustrated in Fig. 4A), with the duration related to the time for myosin to first release MgADP (t-ADP), followed by the period in rigor as it waits for MgATP to rebind (t+ATP), before it detaches from actin (see Lauzon et al. 1998; Warshaw et al. 1998). This model is supported by the longer ton observed with lower [MgATP] (Fig. 3, Table 1), as myosin must wait for a longer period before MgATP enters the active site. Using the relationship between ton and [MgATP] it is then possible to estimate the rate constant for MgADP release (k-ADP) and the second order rate constant for MgATP binding (k+ATP) using data collected in the laser trap for each myosin.
Figure 4. Kinetic model to account for functional diversity between cardiac myosin isoforms.

A, kinetic model of ton. The duration of strong actin-myosin (AM) binding can be modelled as two discrete kinetic steps, t-ADP and t+ATP, which correspond to biochemical transitions in the cross-bridge cycle. At physiological MgATP concentrations ton will be predominantly determined by t-ADP, which is related to the rate of ADP release from the active site. Thus the rigor, AM state, will be very short lived. However, as MgATP concentrations decrease, more of the total ton duration will be accounted for by the time spent waiting for ATP rebinding (t+ATP) and the rigor AM state is prolonged. B, relationship between ton and [MgATP]. V1 (•) and V3 (▴) ton data are expressed as the mean ±s.e.m. at the indicated [MgATP] (see Table 1). tonversus[MgATP] data were fitted by least squares regression analysis using TableCurve 2D software (SPSS Inc., Chicago, IL, USA) to eqn (2) as described in the text.
Assuming that:
| (1) |
where:
and
then by substitution:
| (2) |
By fitting the data for tonversus[MgATP] to eqn (2) (see Fig. 4B) estimates for k-ADP and k+ATP for V1 and V3 are predicted. Based on these fits, k+ATP values of 6.1 × 10⁶ and 5.1 × 10⁶ M−1 s−1 are estimated for the V1 and V3 isoforms, respectively, and are not significantly different by t test on the parameter fits; 71 d.f. (Z = 0.68). These values are in agreement with the biochemically derived 4 × 10⁶ M−1 s−1 value for cardiac muscle from Marston & Taylor (1980). In addition, k-ADP values are estimated to be 110 ± 22 and 57 ± 8 s−1 for the V1 and V3 myosin, respectively, which are significantly different by nearly a factor of 2 (t test on the parameter fits, Z = 2.68, P < 0.05). This is in agreement with the factor of 2.3 obtained when comparing the biochemically derived MgADP release rate for bovine cardiac myosin (Siemankowski & White, 1984) (predominantly V3) of 65 s−1 with that of chicken cardiac myosin (Marston & Taylor, 1980) (predominantly V1) of > 150 s−1. Worth noting is the overall remarkable agreement between the rate constants even having been determined under extremely different circumstances (mechanically versus biochemically). In as much as we attribute the 2-fold difference in ton between the cardiac isoforms to differences in the rate of ADP release, it is important to mention that the actual biochemical state that correlates with the power stroke is unknown. To this end there are several studies which suggest a biochemical and kinetic basis for the power stroke occuring before Pi release (Kawai & Halvorson, 1991; Dantzig et al. 1992; Walker et al. 1992). The transient duration of the AM-ADP-Pi state would then contribute to the overall duration of ton and, even at 1 mM ATP, some fraction of ton, which we have attributed solely to the duration of ADP release, would be accounted for by the duration of this state. At this time the resolution of another state would require biochemical manipulation and isolation of cross-bridge states in the context of the laser trap assay. Based on the excellent agreement with the biochemical data, we maintain that the kinetic differences between the V1 and V3 cardiac myosin isoforms can be attributed to a 2-fold difference in the rate of MgADP release and believe this conclusion provides a plausible mechanism to explain how the kinetics of V1 and V3 myosin differ.
Structural basis for functional differences
The α- and β-cardiac myosin heavy chains have 93 % identity in primary structure (McNally et al. 1989). What makes these two isoforms a unique model for studying molecular structure and function is that most of the remaining 7 % cluster into four structural domains within the globular catalytic domain. These regions of sequence diversity include: (1) the putative fulcrum, or converter region; (2) the 25-50 kDa surface loop (loop 1); (3) the 50-20 kDa surface loop (loop 2); and (4) the neck region near the essential light chain binding domain (Guilford & Warshaw, 1998; McNally et al. 1989). Each of these regions is believed to contribute either to the molecular mechanics and/or kinetics of the myosin molecule. For example, loop 1, a structurally unresolved surface loop that spans the opening to the nucleotide binding pocket (Rayment et al. 1993), is believed to be important in modulating the rate of ADP release from the nucleotide binding cleft. Sweeney et al. (1998) showed that chimeric substitution of loop 1 from various myosin sources into a smooth muscle heavy meromyosin construct revealed a direct correlation between the length/flexibility of the loop and both the rates of ADP release and ATP binding. Through ton analysis in our laser trap assay, Lauzon et al. (1998) confirmed this prediction by comparing two smooth muscle myosin isoforms that differ only by a seven amino acid insert in loop 1. This is in contrast to our present ton analysis from V1 and V3 myosin, where alterations in ADP release rate, but not ATP binding, are observed. However, there is no a priori reason to assume that the rates of ADP release and ATP binding must be linked. In fact, Murphy & Spudich (1998) demonstrate this point by chimeric substitution of loop 1 into expressed Dictyostelium myosin, where only the rate of release of a fluorescent ADP analogue (mantADP) correlated to MgADP release kinetics for the parent myosin from which the loop was obtained, but not the rate of ATP binding. Given that the length of loop 1 in V1 myosin is only one amino acid longer than the V3 loop, it would appear that the loop 1 length is not the sole determinant of the ADP release rate.
The challenge will be to determine whether specific sites of sequence heterogeneity between the V1 and V3 isoforms can be linked to differences in specific hydrolytic and mechanical properties. The problem, though, may be quite complex and may relate more to the overall 3-dimensional structure of the individual myosins, which may differ due to the multiple sites of sequence divergence. Indeed, the profound hydrolytic and mechanical effects of single point mutations in the β-myosin heavy chain that are causal for familial hypertrophic cardiomyopathy point to a tightly coupled structure-function relationship of the myosin protein. In the future, the expression of cardiac myosin chimera that have either single or multiple substitutions based on the sequence diversity between α and β cardiac myosin, in conjunction with crystallographic and molecular biophysical data, will provide the most direct approach to linking cardiac myosin isoform structural differences to its mechanical performance.
Acknowledgments
We would like to thank Eric Hayes and Janet M. Vose for excellent technical assistance and Don Gaffney for his computer expertise. In addition we would like to thank Gary J. Badger of the University of Vermont, Department of Medical Biostatistics, for thoughtful discussion. This work was supported by NIH Grant PHS RO1 HL51126 (N.R.A. and D.M.W.) and NIH Training Grant PHS T32 HL 07647 (K.A.P.).
References
- Alousi AA, Grant AM, Etzler JR, Cofer BR, van der Bel-Kahn J, Melvin D. Reduced cardiac myofibrillar Mg-ATPase activity without changes in myosin isoenzymes in patients with end-stage failure. Molecular and Cellular Biochemistry. 1990;96:79–88. doi: 10.1007/BF00228455. [DOI] [PubMed] [Google Scholar]
- Alpert NR, Mulieri LA. Increased myothermal economy of isometric force generation in compensated cardiac hypertrophy induced by pulmonary artery constriction in the rabbit. Circulation Research. 1982;50:491–500. doi: 10.1161/01.res.50.4.491. [DOI] [PubMed] [Google Scholar]
- Cappelli V, Bottinelli R, Poggesi C, Moggio R, Reggiani C. Shortening velocity and myosin and myofibrillar ATPase activity related to myosin isoenzyme composition during postnatal development in rat myocardium. Circulation Research. 1989;65:446–457. doi: 10.1161/01.res.65.2.446. [DOI] [PubMed] [Google Scholar]
- Dantzig JA, Goldman YE, Millar NC, Lacktis J, Homsher E. Reversal of the cross-bridge force-generating transition by photogeneration of phosphate in rabbit psoas muscle fibres. The Journal of Physiology. 1992;451:247–278. doi: 10.1113/jphysiol.1992.sp019163. [DOI] [PMC free article] [PubMed] [Google Scholar]
- Dupuis DE, Guilford WH, Wu J, Warshaw DM. Actin filament mechanics in the laser trap. Journal of Muscle Research and Cell Motility. 1997;18:17–30. doi: 10.1023/a:1018672631256. [DOI] [PubMed] [Google Scholar]
- Everett AW, Sinha AM, Umeda PK, Jakovcic S, Rabinowitz M, Zak R. Regulation of myosin synthesis by thyroid hormone: Relative change in the α- and β-myosin heavy chain mRNA levels in rabbit heart. Biochemistry. 1984;23:1596–1599. doi: 10.1021/bi00303a002. [DOI] [PubMed] [Google Scholar]
- Finer JT, Simmons RM, Spudich JA. Single myosin molecules mechanics: Piconewton forces and nanometre steps. Nature. 1994;368:113–118. doi: 10.1038/368113a0. [DOI] [PubMed] [Google Scholar]
- Guilford WH, Dupuis DE, Kennedy G, Wu J, Patlak JB, Warshaw DM. Smooth muscle and skeletal muscle myosins produce similar unitary forces and displacements in the laser trap. Biophysical Journal. 1997;72:1006–1021. doi: 10.1016/S0006-3495(97)78753-8. [DOI] [PMC free article] [PubMed] [Google Scholar]
- Guilford WH, Warshaw DM. The molecular mechanics of smooth muscle myosin. Comparative Biochemistry and Physiology. 1998;119:451–458. doi: 10.1016/s0305-0491(98)00002-9. [DOI] [PubMed] [Google Scholar]
- Hamilton N, Ianuzzo CD. Contractile and calcium regulating capabilities of myocardia of different sized mammals scale with resting heart rate. Molecular and Cellular Biochemistry. 1991;106:133–141. doi: 10.1007/BF00230179. [DOI] [PubMed] [Google Scholar]
- Harris DE, Work SS, Wright RK, Alpert NR, Warshaw DM. Smooth, cardiac and skeletal muscle myosin force and motion generation assessed by cross-bridge mechanical interactions in vitro. Journal of Muscle Research and Cell Motility. 1994;15:11–19. doi: 10.1007/BF00123828. [DOI] [PubMed] [Google Scholar]
- Hasenfuss G, Mulieri LA, Blanchard EM, Holubarsch C, Leavitt B, Ittleman F, Alpert NR. Energetics of isometric force development in control and volume-overload human myocardium. Circulation Research. 1991;68:836–846. doi: 10.1161/01.res.68.3.836. [DOI] [PubMed] [Google Scholar]
- Hoh JFY, Yeoh GPS, Thomas MAW, Higgenbottom L. Structural differences in the heavy chains of rat ventricular myosin isoenzymes. FEBS Letters. 1979;97:330–334. doi: 10.1016/0014-5793(79)80115-5. [DOI] [PubMed] [Google Scholar]
- Holubarsch C, Goulette RP, Litten RZ, Mulieri LA, Alpert NR. The economy of isometric force development, myosin isoenzyme pattern and myofibrillar ATPase activity in normal and hypothyroid rat myocardium. Circulation Research. 1985;56:78–86. doi: 10.1161/01.res.56.1.78. [DOI] [PubMed] [Google Scholar]
- Huxley HE. Sliding filaments and molecular motile systems. Journal of Biological Chemistry. 1990;265:8347–8350. [PubMed] [Google Scholar]
- Kawai M, Halvorson HR. Two step mechanism of phosphate release and the mechanism of force generation in chemically skinned fibers of rabbit psoas muscle. Biophysical Journal. 1991;59:329–342. doi: 10.1016/S0006-3495(91)82227-5. [DOI] [PMC free article] [PubMed] [Google Scholar]
- Lauzon A-M, Tyska MJ, Rovner AS, Freyson Y, Warshaw DM, Trybus KM. A 7 amino acid insert in the heavy chain nucleotide binding loop alters the kinetics of smooth muscle myosin in the laser trap. Journal of Muscle Research and Cell Motility. 1998;19:825–837. doi: 10.1023/a:1005489501357. [DOI] [PubMed] [Google Scholar]
- Litten RZ, Martin BJ, Low RB, Alpert NR. Altered myosin isozyme patterns from pressure-overloaded and thyrotoxic hypertrophied rabbit hearts. Circulation Research. 1982;50:856–864. doi: 10.1161/01.res.50.6.856. [DOI] [PubMed] [Google Scholar]
- Lompre A-M, Nadal-Ginard B, Mahdavi V. Expression of the cardiac ventricular α- and β-myosin heavy chain genes is developmentally and hormonally regulated. Journal of Biological Chemistry. 1984;259:6437–6446. [PubMed] [Google Scholar]
- Lowes BD, Minobe W, Araham WT, Rizeq MN, Bohlmeyer TJ, Quaife RA, Roden RL, Dutcher DL, Robertson AD, Voelkel NF, Badesch DB, Groves BM, Gilbert EM, Bristow MR. Changes in gene expression in the intact human heart: downregulation of α-myosin heavy chain in hypertrophied failing ventricular myocardium. Journal of Clinical Investigation. 1997;100:2315–2324. doi: 10.1172/JCI119770. [DOI] [PMC free article] [PubMed] [Google Scholar]
- Mcnally EM, Kraft R, Bravo-Zehnder M, Taylor DA, Leinwand LA. Full-length rat alpha and beta cardiac myosin heavy chain sequences. Journal of Molecular Biology. 1989;210:665–671. doi: 10.1016/0022-2836(89)90141-1. [DOI] [PubMed] [Google Scholar]
- Marston SB, Taylor EW. Comparison of the myosin and actomyosin ATPase mechanisms of the four types of vertebrate muscles. Journal of Molecular Biology. 1980;139:573–600. doi: 10.1016/0022-2836(80)90050-9. [DOI] [PubMed] [Google Scholar]
- Maughan D, Low E, Litten R, Brayden J, Alpert NR. Calcium-activated muscle from hypertrophied rabbit hearts. Circulation Research. 1974;44:279–287. doi: 10.1161/01.res.44.2.279. [DOI] [PubMed] [Google Scholar]
- Mehta AD, Finer JT, Spudich JA. Detection of single-molecule interactions using correlated thermal diffusion. Proceedings of the National Academy of Sciences of the USA. 1997;94:7927–7931. doi: 10.1073/pnas.94.15.7927. [DOI] [PMC free article] [PubMed] [Google Scholar]
- Mercadier J-J, Bouveret P, Gorza L, Schiaffino S, Clark WA, Zak R, Swynghedauw B, Schwartz K. Myosin isoenzymes in normal and hypertrophied human ventricular myocardium. Circulation Research. 1983;53:52–62. doi: 10.1161/01.res.53.1.52. [DOI] [PubMed] [Google Scholar]
- Molloy JE, Burns JE, Kendrick-Jones J, Tregear RT, White DCS. Movement and force produced by single myosin head. Nature. 1995;378:209–212. doi: 10.1038/378209a0. [DOI] [PubMed] [Google Scholar]
- Nagai R, Pritzl N, Low RB, Stirewalt WS, Zak R, Alpert NR, Litten RZ. Myosin isozyme synthesis and mRNA levels in pressure-overloaded rabbit hearts. Circulation Research. 1987;60:692–699. doi: 10.1161/01.res.60.5.692. [DOI] [PubMed] [Google Scholar]
- Nakao K, Minobe W, Roden R, Bristow MR, Leinwand LA. Myosin heavy chain gene expression in human heart failure. Journal of Clinical Investigation. 1997;100:2362–2370. doi: 10.1172/JCI119776. [DOI] [PMC free article] [PubMed] [Google Scholar]
- Nguyen T-T T, Hayes E, Mulieri LA, Leavitt BJ, Ter Keurs HEDJ, Alpert NR, Warshaw DM. Maximal actomyosin ATPase activity and in vitro myosin motility are unaltered in human mitral regurgitation heart failure. Circulation Research. 1996;79:222–226. doi: 10.1161/01.res.79.2.222. [DOI] [PubMed] [Google Scholar]
- Pardee JD, Spudich JA. Purification of muscle actin. Methods in Cell Biology. 1982;24:271–289. doi: 10.1016/s0091-679x(08)60661-5. [DOI] [PubMed] [Google Scholar]
- Patlak JB. Measuring kinetics of complex single ion channel data using mean-variance histograms. Biophysical Journal. 1993;65:29–42. doi: 10.1016/S0006-3495(93)81041-5. [DOI] [PMC free article] [PubMed] [Google Scholar]
- Pope B, Hoh JFY, Weeds A. The ATPase activities of rat cardiac myosin isoenzymes. FEBS Letters. 1980;118:205–208. doi: 10.1016/0014-5793(80)80219-5. [DOI] [PubMed] [Google Scholar]
- Rayment I, Rypniewski WR, Schnmidt-Base K, Smith R, Tomchick DR, Benning MM, Winkelmann DA, Wesenberg G, Holden HM. Three-dimensional structure of myosin subfragment-1: a molecular motor. Science. 1993;261:50–58. doi: 10.1126/science.8316857. [DOI] [PubMed] [Google Scholar]
- Scheir JJ, Adelstein RS. Structural and enzymatic comparison of human cardiac muscle myosins isolated from infants, adults, and patients with hypertrophic cardiomyopathy. Journal of Clinical Investigation. 1982;69:816–825. doi: 10.1172/JCI110521. [DOI] [PMC free article] [PubMed] [Google Scholar]
- Siemankowski RF, White HD. Kinetics of the interaction between actin, ADP, and cardiac myosin-S1. Journal of Biological Chemistry. 1984;259:5045–5053. [PubMed] [Google Scholar]
- Suguira S, Kobayakawa N, Fujita H, Yamishita H, Momomura S, Chaen S, Omata M, Sugi H. Comparison of unitary displacements and forces between two cardiac myosin isoforms by the optical trap technique. Circulation Research. 1998;82:1029–1034. doi: 10.1161/01.res.82.10.1029. [DOI] [PubMed] [Google Scholar]
- Suguira S, Yamashita H, Sata M, Momomura S, Serizawa T, Oiwa K, Chaen S, Shimmen T, Sugi H. Force- velocity relations of rat cardiacmyosin isozymes sliding on algal cell actin cables in vitro. Biochimica et Biophysica Acta. 1995;1231:69–75. doi: 10.1016/0005-2728(95)00062-n. [DOI] [PubMed] [Google Scholar]
- Sweeny HL, Rosenfeld SS, Brown F, Faust L, Smith J, Xing J, Stein LA, Sellers JR. Kinetic tuning of myosin via a flexible surface loop adjacent to the nucleotide binding pocket. Journal of Biological Chemistry. 1998;273:6262–6270. doi: 10.1074/jbc.273.11.6262. [DOI] [PubMed] [Google Scholar]
- Tyska MJ, Dupuis DE, Guilford WH, Patlak JB, Waller GS, Trybus KM, Warshaw DM, Lowey S. Two heads of myosin are better than one for generating force and motion. Proceedings of the National Academy of Sciences of the USA. 1999;96:4402–4407. doi: 10.1073/pnas.96.8.4402. [DOI] [PMC free article] [PubMed] [Google Scholar]
- VanBuren P, Harris DE, Alpert NR, Warshaw DM. Cardiac V1 and V3 myosins differ in their hydrolytic and mechanical activities in vitro. Circulation Research. 1995;77:439–444. doi: 10.1161/01.res.77.2.439. [DOI] [PubMed] [Google Scholar]
- VanBuren P, Work SS, Warshaw DM. Enhanced force generation by smooth muscle myosin in vitro. Proceedings of the National Academy of Sciences of the USA. 1994;91:202–205. doi: 10.1073/pnas.91.1.202. [DOI] [PMC free article] [PubMed] [Google Scholar]
- Veigel C, Bartoo ML, White DCS, Sparrow JC, Molloy JE. The stiffness of rabbit skeletal actomyosin cross-bridges determined with an optical tweezers transducer. Biophysical Journal. 1998;75:1424–1428. doi: 10.1016/S0006-3495(98)74061-5. [DOI] [PMC free article] [PubMed] [Google Scholar]
- Walker JW, Lu Z, Moss RL. Effects of Ca2+ on the kinetics of phosphate release in skeletal muscle. Journal of Biological Chemistry. 1992;267:2459–2466. [PubMed] [Google Scholar]
- Warshaw DM, Desrosiers JM, Work SS, Trybus KM. Smooth muscle myosin cross-bridge interactions modulate actin filament sliding velocity in vitro. Journal of Cell Biology. 1990;111:453–463. doi: 10.1083/jcb.111.2.453. [DOI] [PMC free article] [PubMed] [Google Scholar]
- Warshaw DM, Hayes E, Gaffney D, Lauzon AM, Wu J, Kennedy G, Trybus K, Lowey S, Berger C. Myosin conformational states determined by single fluorophore polarization. Proceedings of the National Academy of Sciences of the USA. 1998;95:8034–8039. doi: 10.1073/pnas.95.14.8034. [DOI] [PMC free article] [PubMed] [Google Scholar]
- Weeds AG, Lowey S. Substructure of the myosin molecule. Journal of Molecular Biology. 1971;61:701–725. doi: 10.1016/0022-2836(71)90074-x. [DOI] [PubMed] [Google Scholar]