

Abstract
In vertebrate rods activation of the phototransduction cascade by light triggers changes in the concentrations of at least two diffusible intracellular second messengers (cGMP and Ca2+) whose actions depend on how far they spread from their site of production or entry. To address questions about their spatial spread, cell-attached patch current recording and fluorescence imaging of Calcium Green-dextran were used to measure the longitudinal spread of cGMP and Ca2+, respectively, in functionally intact isolated Gecko gecko lizard rod outer segments under whole-cell voltage clamp.
The light-evoked changes in cGMP and Ca2+ concentrations decayed with distance from a site of steady focal activation by two-photon absorption of 1064 nm light with similar decay lengths of ≈3.5 μm.
These results can be understood on the basis of a quantitative model of coupled diffusible intracellular messengers, which is likely to have broad relevance for second messenger signalling pathways in general.
The decay length for the spread of adaptation from a site of steady local illumination was about 8 μm, i.e. substantially longer than the decay lengths measured for the spread of cGMP and Ca2+. There are a number of factors, however, that could broaden the apparent relationship between functional changes in the light response and the concentration of a diffusible messenger. For these reasons the measured decay length is an upper limit estimate of the spread of adaptation and does not rule out the possibility that Ca2+ and/or cGMP carry the adaptation signal.
Light activation of the phototransduction cascade in vertebrate retinal photoreceptors triggers changes in the concentration of two intracellular second messengers, cGMP and Ca2+. In darkness, current carried by Ca2+ and Na+ flows into the rod outer segment (ROS) through cyclic nucleotide-gated (CNG) channels that bind cGMP to open. Light reduces the standing dark current by activating rhodopsin (Rh*) and thus triggering an amplified G protein-coupled cascade that increases cGMP hydrolysis by stimulating cGMP-specific phosphodiesterase (PDE). The resulting decrease in [cGMP] causes CNG channels to close. This reduces the influx of Ca2+ while its efflux by Na+-Ca2+, K+ exchange continues, causing a drop in [Ca2+].
The light-induced fall in [Ca2+]i is commonly referred to as the calcium feedback signal. It acts to counteract the loss of cGMP due to light-stimulated hydrolysis, by activating guanylyl cyclase. This accelerates the resynthesis of cGMP, which is necessary for the recovery of the dark current following light exposure. The calcium feedback signal is also thought to be an important player in light adaptation (Matthews et al. 1988; Nakatani & Yau, 1988), but its molecular mechanism of action is not fully understood, nor is it certain that it is the only messenger of adaptation (Gray-Keller & Detwiler, 1996).
Fundamental questions about signals carried by changes in second messengers, other than the obvious ones about how they are generated and where they act, include how big the signals are, how long they last, and how far they spread. The answers to these basic questions are not known in detail for any signal transduction pathway using second messengers, but are probably best understood in rod photoreceptors. The amplitude and duration of the changes in cGMP and Ca2+ that occur during a flash and step response have been described (Gray-Keller & Detwiler, 1994). The present study examines how light-evoked changes in these second messengers spread from a site of local activation.
Previous work on the spatial properties of rod signals has dealt either with the spread of current activation, which is an expression of spatial changes in [cGMP], or with the spread of desensitization caused by steady local background illumination. The earliest work established that neither the effect of activation nor adaptation was spatially confined to the site of photon absorption (Hagins et al. 1970; Donner & Hemilä, 1978; Bastian & Fain, 1979; Hemilä & Reuter, 1981). On the basis of field potentials recorded from a population of retinal receptors, local activation was estimated to spread < 12 μm (Hagins et al. 1970) or between 5 and 20 μm (Reuter & Hemilä, 1981). The first experiments on single rods by Lamb et al. (1981) used a suction electrode to record flash responses to a bar of light. The conclusion drawn from a direct measurement, based on locally illuminating regions outside of the recording pipette, was that activation spread < 16 μm. This estimate was further reduced by the finding that the intensity-response relationship at fixed times using local illumination was consistent with a diffusion-based model in which the effects of the ‘internal messenger of activation’ decayed with an exponential length constant of ∼3 μm. In a later study, Matthews (1986) recorded light responses from a cell-attached patch of outer segment membrane and estimated its effective collecting area on the basis of the response probability of the membrane patch to full-field flashes as a function of intensity. This analysis gave ∼0.5 μm as a lower estimate of the decay constant for activation.
The length constant for the spread of adaptation has been reported to be 6-7 μm (Lamb et al. 1981; Cornwall et al. 1990). There have been no direct measurements of the spread of the change in [Ca2+]i, but since [Ca2+]i is thought to be important in adaptation, the spread of desensitization might be expected to be related to the spatial changes in [Ca2+]i.
To test this assumption and to provide additional information about the spatial properties of the cyclic nucleotide and Ca2+ signals in rods, we used cell-attached patch current recording and calcium imaging to measure, respectively, how far changes in [cGMP] and [Ca2+]i spread from a localized site of steady activation. The spatial characteristics of the cGMP and Ca2+ signals were compared with those observed for the spread of the adaptational changes in the flash response that occur during steady local activation of the cascade.
METHODS
All procedures were done in darkness using infrared illumination and night vision goggles (NVEC-800HP, Night Vision Equip.). Medium to large (14-28 cm) Gecko gecko lizards were dark adapted overnight, instantly decapitated, the head and spinal cord swiftly pithed and both eyes removed. Everything concerning the housing, feeding and treatment of the animals was done according to the guidelines established by the National Institutes of Health and the University of Washington Animal Care Committee.
As described previously (Rispoli et al. 1993; Gray-Keller & Detwiler, 1994), ROS were detached and isolated from retinal pieces and dialysed via whole-cell voltage clamp with an internal solution that contained (mM): 110 potassium aspartate, 10 KCl, 6.05 MgCl2, 5 Hepes, 5 ATP, 1 GTP and 0.05 Calcium Green-1-10 000 MW dextran (Ca2+-Green), pH 7.40 with KOH. Standard Ringer solution contained (mM): 160 NaCl, 3.3 KCl, 2.8 Hepes, 1 CaCl2, 1.7 MgSO4 and 10 dextrose, pH 7.4 with NaOH. In experiments that included a cell-attached pipette to record current from a membrane patch on an isolated ROS under whole-cell voltage clamp, the patch pipette was filled with either standard Ringer solution or Ringer solution with no added Ca2+ or Mg2+.
After establishing whole-cell recording conditions the mechanical connection between the pipette and the cell was used to position the ROS on the top surface of the coverslip that formed the bottom of the recording chamber, where it was stimulated by flashes of either green (514 nm) light via a water-immersion objective (Zeiss × 40, 0.75 n.a.) that formed the roof of the chamber, or 1064 nm light from a Nd:Yag CW laser (Santa Fe Laser, model MYLS-100 mini-YAG) that was shuttered, reflected off orthogonal galvanometer scanners (Cambridge Technology, model 6800), filtered and focused by an oil-immersion objective (Zeiss × 40, 1.3 n.a.) to a diffraction-limited spot (Fig. 1). Test flashes of either 514 or 1064 nm light were adjusted to elicit electrical light responses that suppressed ≤∼20 % of the circulating dark current. The unattenuated intensity of the unpolarized 514 nm light was ∼3 × 10⁵ photons μm−2 s−1. A 20 ms, 514 nm flash that delivered ∼150 photons to a 1.25 μm diameter spot suppressed roughly the same fraction of circulating current as a 5 ms flash of 1064 nm light at -1.7 log10 attenuation. A 5 ms flash of 488 nm light from an argon ion laser (Spectra Physics, model 165 ion laser) excited Ca2+-Green fluorescence. Fluorescence emission light at 530 nm was collected by the bottom objective, and for imaging, passed via a dichroic mirror to a frame transfer CCD camera (Paultex Fast Imaging CCD camera, model C100). Images were stored on an optical disk memory recorder (Panasonic, model TQ-3031F) and analysed using Metamorph software from Universal Imaging Corporation. The 5 ms flash of 488 nm excitation light allows the camera to capture a snapshot of the distribution of Ca2+-Green fluorescence before the activation of the transduction cascade by the short wavelength flash has had enough time to close channels and change [Ca2+]i.
Figure 1. Optical set-up used for two-photon excitation of rhodopsin and imaging Ca2+-sensitive fluorescence in dialysed isolated ROS.
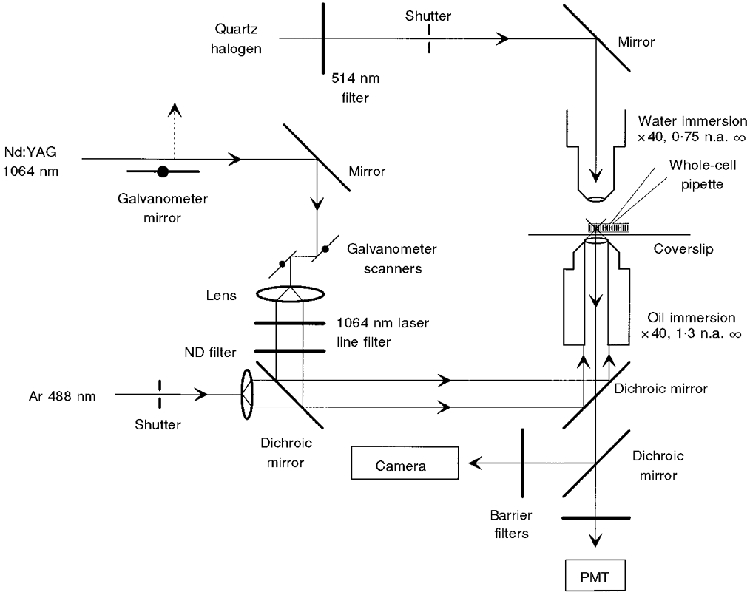
PMT, photomultiplier tube; ND, neutral density.
All chemicals were obtained from Sigma except Calcium Green-1-10 000 MW dextran, which was purchased from Molecular Probes. Unless stated otherwise all data are means ±s.e.m. The holding potential in whole-cell voltage clamp after correction for the liquid-junction potential was -30 mV; the temperature was 16 ± 1°C.
RESULTS
Two-photon excitation of rhodopsin
Isolated ROS dialysed in whole-cell voltage clamp with an internal solution containing 1 mM GTP and 5 mM ATP maintain an inward dark current that is suppressed by light and give rise to electrical responses that have the same sensitivity, kinetics and adaptational properties as flash responses recorded from intact rods (Sather, 1988; Rispoli et al. 1993; Gray-Keller & Detwiler, 1994). The transduction process was locally activated by two-photon excitation of rhodopsin using 1064 nm light, a wavelength that provides insufficient quantal energy to excite rhodopsin by one-photon absorption. Two-photon excitation, with its quadratic dependence on light intensity (Göppert-Mayer, 1931), was used to confine rhodopsin activation to a smaller volume than is possible with one-photon excitation using shorter wavelength light. As expected for two-photon excitation, the electrical response to brief flashes of 1064 nm light was steeply dependent on the plane of focus and increased with the square of the intensity. This is illustrated in Fig. 2A, which shows that doubling the intensity of the 1064 nm flashes resulted in a 4-fold increase in the mean amplitude of the electrical response. Figure 2B shows that the amplitude of the light response declined sharply as the rod was moved vertically in 2.5 μm steps from the focal plane of the 1064 nm light. Moving the rod 70 μm vertically had no effect on responses to 20 ms flashes of diffuse green (514 nm) light (Fig. 2C).
Figure 2. Two-photon excitation of rhodopsin.
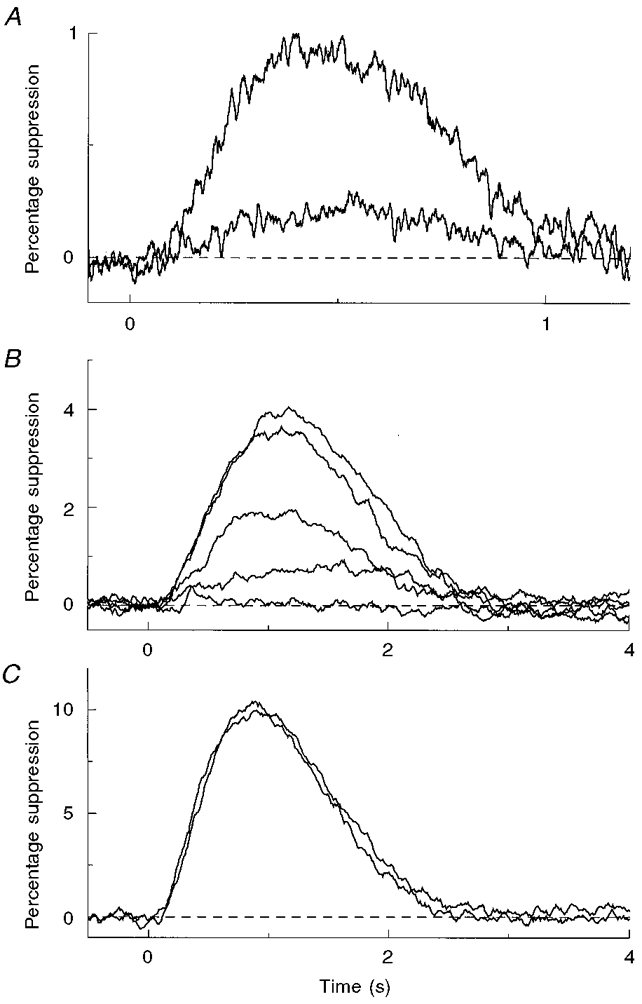
A, mean responses to 150 μs, 1064 nm flashes using intensities that differed by a factor of two. As expected for two-photon excitation the amplitude of the responses increased with the square of the light intensity. The recording was filtered (0.1-2.5 Hz band pass) to remove baseline fluctuations in circulating current. The peaks of the two responses suppressed about 1 and 0.25 % of the resting dark current and were the mean of 20 and 40 flashes, respectively. Flashes were delivered at 5 s intervals, which increased the level of light adaptation and speeded response kinetics. Two-photon excitation was also steeply dependent on focus. B, the decline of the light response (10 ms flash, -1.7 log10 attenuation) as the rod was moved vertically in 2.5 μm steps from the focal plane of the 1064 nm light at the top surface of the bottom coverslip in a different cell from that in A. Moving the rod 70 μm vertically in the same cell had no effect on responses to 20 ms flashes (0.3 photons μm−2 flash−1) of diffuse green light (C).
An additional argument for 1064 nm illumination exciting rhodopsin by a two-photon mechanism rather than a one-photon mechanism is that the energy of a single 1064 photon is much less than the energy difference between the electronic ground state of the rhodopsin chromaphore and its lowest electronic excited state. Several previous studies have shown that at long wavelengths rod sensitivity falls off exponentially with decreasing quantal energy or increasing wavelength (Stiles, 1948). Extrapolation of the long wavelength fall-off suggests that rod sensitivity at 1064 nm is reduced by ∼13 orders of magnitude relative to its peak sensitivity at 520 nm.
Spread of excitation (cGMP)
Current recorded from CNG channels in a cell-attached patch of outer segment membrane was used as a detector to map spatial changes in cGMP that occurred in response to localized flashes delivered at different distances from the recorded patch of membrane. The arrangement of the whole-cell and cell-attached electrodes, and the position of local 1064 nm excitation, are shown in Fig. 3A for a representative experiment. The two pipettes record currents of opposite polarity since one measures current flowing out of the pipette into the outer segment through a small patch of membrane (Fig. 3B) and the other records current flowing into the pipette from the whole cell (Fig. 3C).
Figure 3. Spread of activation (cGMP).
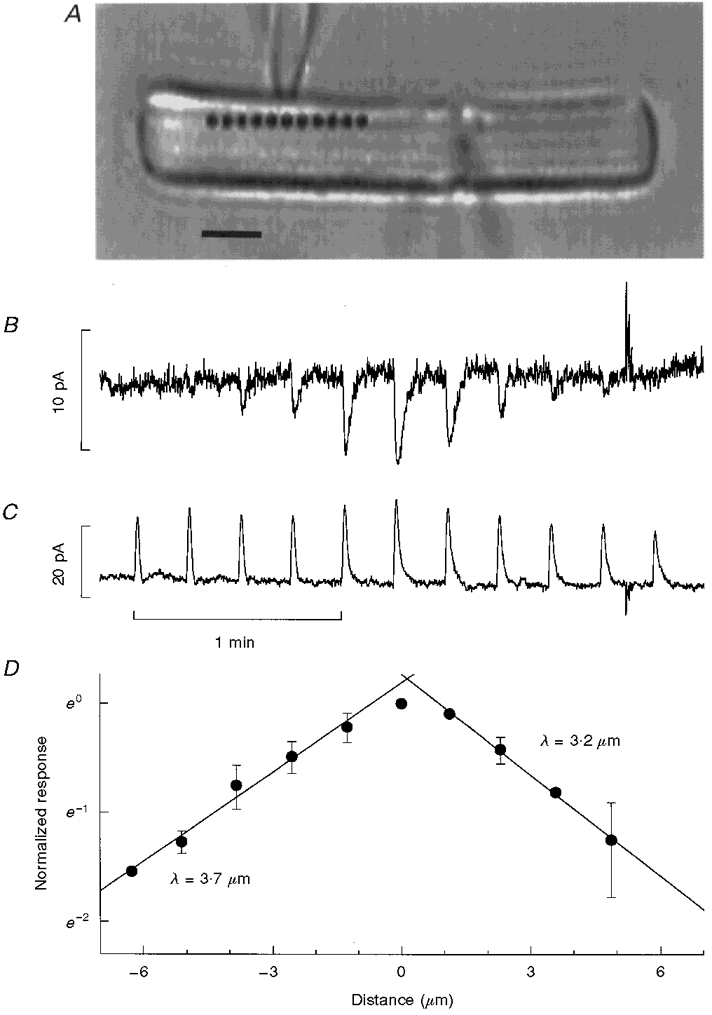
A, the arrangement of whole-cell and cell-attached electrodes, shown in a photograph taken using diffuse 900 nm illumination (scale bar, 5 μm). Galvanometer scanners were used to deliver brief (5 ms) flashes of a fixed intensity 1064 nm light (-1.7 log10 attenuation) at the positions indicated by the filled circles. The resulting changes in cell-attached and whole-cell currents are shown in B and C, respectively. The amplitude of the cell-attached response decreased with increasing distance between the site of two-photon excitation and the recording pipette. The variations in the amplitude of the whole-cell response were due to local differences in light sensitivity. Cell-attached responses were scaled by the relative changes in the whole-cell response to correct for regional differences in sensitivity. The same series of 1064 nm flashes was repeated 3 times and the normalized mean amplitude of the response at each position is plotted on semi-logarithmic co-ordinates against distance between the recording pipette and the stimulus site in the positive and negative directions (D). Decay lengths (λ) for the spread of activation were estimated from the slope of straight lines fitted to the data. The maximum amplitude of the cell-attached current response evoked by two-photon stimulation centred on the recorded patch was 74 % of the response evoked by a saturating full-field stimulus. Cell-attached responses evoked by two-photon stimulation positioned further than 5 μm from the patch pipette in the positive direction were too small to be measured and are not plotted.
In cell-attached recording the size of the response depended on the amount of membrane captured by the patch pipette, the concentration of divalent cations in the pipette filling solution and the strength of local illumination. The saturating response produced by strong local illumination of the recorded patch was the same as that produced by diffuse green light, which closed all the CNG channels in the outer segment (data not shown). Responses recorded when the pipette contained an obvious bleb of membrane had noticeably slower kinetics and were discarded. In five recordings made from ‘flat patches’ with pipettes filled with standard Ringer solution, maximum responses were barely detectable (∼200 fA).
To make the current response large enough to be measured reliably, the conductivity of the CNG channels was increased by removing divalent ions from the cell-attached pipette filling solution. Under these conditions the peak amplitude of the patch response to a saturating flash ranged from 2.4 to 10 pA (mean, 4.9 ± 1 pA; n = 9). Responses evoked by two-photon stimulation, centred on the cell-attached recording site, were graded in amplitude depending on stimulus intensity (data not shown).
The mean amplitude of cell-attached responses to a fixed intensity of local stimulation (5 ms, -1.7 log10 attenuation, 1064 nm flashes) was 73 ± 0.04 % (n = 8) of the maximum cell-attached current and decreased as the distance between the site of two-photon excitation and the recording pipette increased (Fig. 3B). In contrast, the amplitude of the whole-cell responses (Fig. 3C) varied somewhat with position but showed no systematic dependence on the separation between the positions of the stimulus and the patch pipette. The position-dependent changes in the amplitude of the whole-cell response were used to correct the cell-attached responses for regional differences in light sensitivity. In Fig. 3D the normalized mean amplitude of cell-attached responses is plotted against the distance between the stimulus and recording sites. The decay lengths for the spread of activation were estimated from the slopes of straight lines fitted to the data for positive and negative displacements. The spread of the peak of the two-photon flash response was the same in the two directions (3.6 ± 0.4 and 3.9 ± 0.3 μm, n = 9 for both), with the overall mean characteristic length being 3.8 ± 0.2 μm (n = 18).
Responses recorded at different distances from the site of local activation were identical when scaled to the same peak amplitude, indicating that there is little or no temporal dispersion of the response as it spreads along the outer segment. This agrees with results of experiments using steps of light. During a 7 s step of 1064 nm light (-2.7 log10 attenuation), which suppressed the maximum cell-attached current by 65 ± 7 % (n = 3), there was little peak-to-plateau relaxation (5 ± 0.7 %, n = 4). The characteristic lengths for the spread of the early and late phases of the step response were similar (3.4 ± 0.4 and 2.9 ± 0.4 μm, respectively; n = 8).
The amount of membrane recorded by the patch pipette was estimated from the maximum amplitude of the cell-attached patch response recorded with pipettes filled with normal Ringer solution (∼200 fA). When expressed as the fractional change in circulating current (85 pA) and multiplied by the total surface area of the isolated ROS (1000 μm2), this gave a patch area of ∼2.4 μm2. Since the single CNG channel current in the presence of divalent cations is about 4 fA (Bodoia & Detwiler, 1985; Gray & Attwell, 1985) this suggests that the recorded patch contains about 50 open channels corresponding to an open channel density of about 20 μm−2.
Spread of Ca2+
The steady-state changes in intracellular Ca2+ that occur during a local step of 1064 nm light (-2.7 log10 attenuation) were imaged in ROS dialysed with Ca2+-Green by using a 5 ms flash of 488 nm light to take a ‘snapshot’ of the spatial distribution of Ca2+-sensitive fluorescence. The flash was brief enough that the image was complete before the activation of the signal transduction cascade had time to affect [Ca2+]i. The 5 ms flash of excitation light is considerably shorter than the 20-30 ms delay (at 16°C) that precedes the onset of the electrical response (Gray-Keller & Detwiler, 1994). An image of the rod taken using weak full-field 900 nm infrared illumination is shown on the left in Fig. 4A with the position of the local step of 1064 nm light marked by the filled rectangle. The fluorescence image of the cell after 45 s of steady local illumination (Fig. 4A, middle pseudocolour image) shows a local depression in fluorescence that is roughly centred on the position of the step of two-photon activation. The 5 ms flash of 488 nm excitation strongly activated the transduction cascade and closed all the CNG channels to generate a saturated electrical response that did not recover over the remaining time course of the experiment. The absence of open channels shuts off Ca2+ influx, while efflux by Na+-Ca2+, K+ exchange continues and [Ca2+]i falls. This is illustrated in Fig. 5 by the series of snapshot images taken in a separate experiment at the indicated times after the first image (time = 0 s). The mean pixel intensity of a fixed region of the outer segment is plotted against time in Fig. 5A, showing that fluorescence drops to a final minimum value after about 20 s.
Figure 4. Spatial distribution of the change in Ca2+-Green fluorescence in response to steady local illumination.
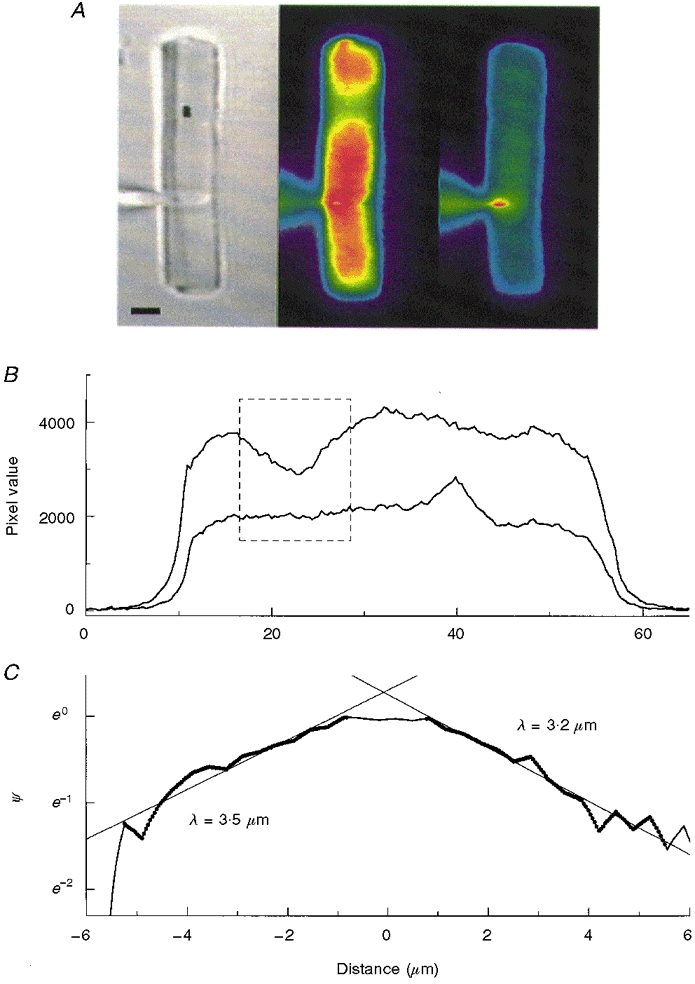
A, the images show the location (left, filled rectangle) of a local step of 1064 nm light (-2.7 log10 attenuation) taken with weak full-field 900 nm illumination (scale bar, 5 μm), and the distribution of Ca2+-Green fluorescence (pseudocolour) excited by a 5 ms flash of intense 488 nm light after 45 s of local 1064 nm activation (middle) and then 60 s later (right), after the response to the short wavelength excitation light had closed all the channels and [Ca2+]i had fallen to its minimal value. The spatial changes in fluorescence were analysed by utilizing a line scan down the middle of the ROS and plotting in the mean pixel value as a function of distance for the first (B, upper trace) and second fluorescence images (lower trace). The pixels corresponding to the region around the site of local 1064 nm illumination (dashed line box) were normalized by subtracting the value of the second image from that of the first (F1 - F2) and dividing by the value of the second image ((F1 - F2)/F2 = ΔF). These results were normalized to the maximum value of ΔF (ΔFmax), i.e. ψ=ΔF/ΔFmax, and plotted semi-logarithmically as a function of distance from the site of steady local 1064 nm stimulation (C). The slopes of the straight lines fitted to the data (filled circles) provide estimates of the length constants for the spread of the change in fluorescence in the two directions. The data around zero distance are approximately equal to 1, suggesting that there is a region about 1 μm wide where the fluorescence signal is approximately constant.
Figure 5. Calibration of the Ca2+ dependence of Ca2-Green fluorescence.
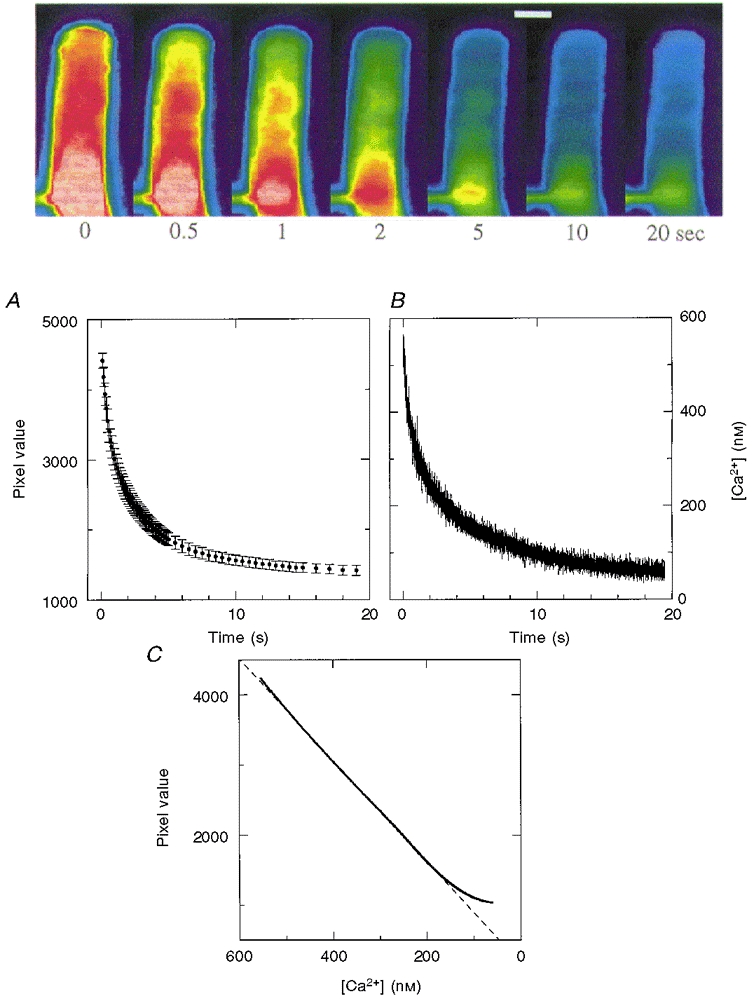
The upper panel shows pseudocolour image snapshots of the Ca2-Green fluorescence of a dark-adapted ROS taken using 5 ms flashes of intense 488 nm light at time zero (the time of the first 488 nm flash) and at the indicated times after the first snapshot (scale bar, 5 μm). The flash of short wavelength light used to excite Ca2+-Green fluorescence also excites rhodopsin and the transduction cascade, closing all the CNG channels and causing [Ca2+]i to fall as the exchanger pumps Ca2+ to a final minimal value. A, the time course of the fall in fluorescence based on the mean pixel value in a 4 μm × 4 μm region of the middle of the outer segment. B, indo-dextran fluorescence and an in vivo calibration procedure (Gray-Keller & Detwiler, 1994, 1996) were used to determine the time course of the decline in [Ca2+] evoked by a saturating step of short wavelength excitation light. The pixel values in A and Ca2+ concentration in B were fitted according to the equation a exp(-t/τ1) +b exp(-t/τ2) +c (Gray-Keller & Detwiler, 1994). The values were 1401, 0.46 s, 1657, 2.66 s and 990 in A and 230 nM, 0.58 s, 270 nM, 5.45 s and 54 nM in B for a, τ1, b, τ2, and c, respectively. The equation fitted to A also included a linear term to account for the photobleaching of the dye, which had a slope of -7.87 s−1 and y-axis intercept of 535. The bleaching rate was determined in a separate set of experiments in which the time-dependent decline in fluorescence intensity was measured in ROS that had previously been exposed to saturating green light. That there is a linear relationship between Ca2+-Green fluorescence intensity and [Ca2+] is shown in C, where the fitted values for pixel intensity in A are plotted against the fitted values for Ca2+ concentration in B at the same time points after the onset of the fluorescence excitation light.
For the ROS in Fig. 4A, an image of Ca2+-Green fluorescence after [Ca2+]i had reached its final minimum level is shown in the right-hand panel. The light-evoked change in fluorescence illustrated by the difference in the two pseudocolour images is also apparent in Fig. 4B, which plots fluorescence intensity over the length of the dialysed ROS for the first and second snapshot images. As is commonly done, to correct for possible spatial differences in path length and dye concentration, longitudinal changes in fluorescence over the indicated region (Fig. 4B, boxed area) were normalized by subtracting the pixel values of the second fluorescence image from those of the first (F1 - F2) and dividing by the value of the second image to give (F1 - F2)/F2 = ΔF. The change in fluorescence (ΔF) relative to the maximum change (ΔFmax) was plotted as a function of distance from the site of steady local two-photon activation (Fig. 4C). Length constants were estimated from the slope of straight lines fitted to the data on a semi-logarithmic plot. The spatial spread of the local change in fluorescence was the same in the positive and negative directions; the mean decay length was 3.2 ± 0.6 μm (n = 19) and single estimates ranged from 2.1 to 4.0 μm. These measurements were not limited by the resolution of the optics as shown by the fact that the spatial change of fluorescence intensity at the end of the rod was much sharper than in the locally illuminated region. Similar analysis of line scans in the radial direction indicated that changes in fluorescence caused by local activation were uniform in this dimension, as expected from previous studies of radial diffusion (Lamb et al. 1981).
The imaging experiments provide a direct measure of the distribution of changes in the Ca2+-Green fluorescence, which represents the longitudinal spread of Ca2+ assuming the indicator is a linear Ca2+ detector. To evaluate the relationship between [Ca2+] and Ca2+-Green fluorescence, the time-dependent change in fluorescence intensity shown in Fig. 5A was compared with the time course of the fall in [Ca2+] (Fig. 5B) measured in the same preparation using an in vivo calibration of ratiometric changes in indo-dextran fluorescence as described previously (Gray-Keller & Detwiler, 1994, 1996). In both cases the first exposure to short wavelength light used to excite dye fluorescence, irreversibly closed all the CNG channels causing [Ca2+] to fall. In Fig. 5C, curves fitted to the raw data in Fig. 5A and B are plotted against each other to obtain a plot of fluorescence intensity versus measured [Ca2+]. This shows that fluorescence intensity is linearly related to internal [Ca2+] over most of its dynamic range.
Spread of adaptation
The spatial spread of adaptational changes in the flash response from a site of steady local illumination was measured as illustrated in Fig. 6A. The record shows responses evoked by dim small diameter (1.3 μm) green (514 nm) test flashes before and after turning on a step of 1064 nm light located 3 μm from the position of the test spot. The electrical recording ends with a saturating response, which was evoked when the steady-state spatial change in [Ca2+] produced by the local step illumination was imaged using a flash of 488 nm light (see above). Mean flash responses in the dark and during the adapting step (n ≥ 4) were compared at higher gain and time resolution for this experiment (Fig. 6C) and two others (Fig. 6B and D) with different distances separating the step and test spot. For each experiment, responses in the dark and the light are plotted on a fixed scale, equivalent to the way they appear in the recording.
Figure 6. Spread of adaptation.
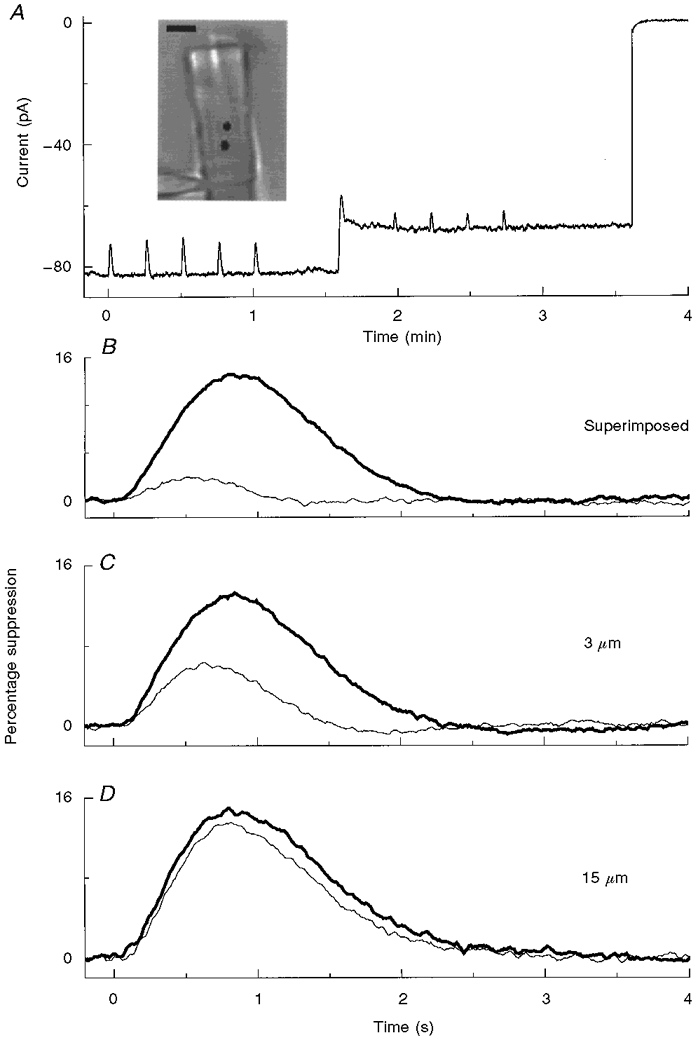
The basic experiment is illustrated in A. The photograph was taken with full-field 900 nm infrared illumination of a dialysed ROS; the position of a step of 1064 nm light (-2.7 log10 attenuation) and the location of a 514 nm test flash (1.3 μm diameter spot, 155 photons μm−2) are indicated by the filled circles, which are separated by 3 μm (scale bar, 5 μm). The chart record shows the changes in whole-cell current in response to five test flashes in the dark and four test flashes superimposed on the continuous step of 1064 nm illumination. In all experiments of this type circulating current at the peak and plateau of the 1064 nm step was reduced by ≈30 and ≈13 % (mean, 13.6 ± 0.5 %; n = 24), respectively. At the end of the recording a 5 ms flash of 488 nm fluorescence excitation light was delivered to take a snapshot of the distribution of Ca2+-Green fluorescence. B-D, the superimposed mean responses to small spot test flashes given in the dark (bold traces) and during steady local background illumination (thin traces) when the site of local activation and the position of the test flash were either superimposed or separated by 3 or 15 μm. The responses in the dark and during the background step were normalized to the resting dark current.
The effect of the local adapting step decreased as the distance separating the position of the two-photon step and the test spot increased. This is shown in Fig. 7. Since the effect of adaptation would be expected to be largest at the site of local activation, the data are plotted as one minus the relative change in peak amplitude (1 - response in the light/response in the dark). The decay length, estimated by fitting a single exponential function, was 8.2 μm. Data points less than 1.5 μm from the adapting step were excluded from the fitting procedure to account for the effective width of the small spot test flash.
Figure 7. Spatial spread of adaptational changes in the flash response.
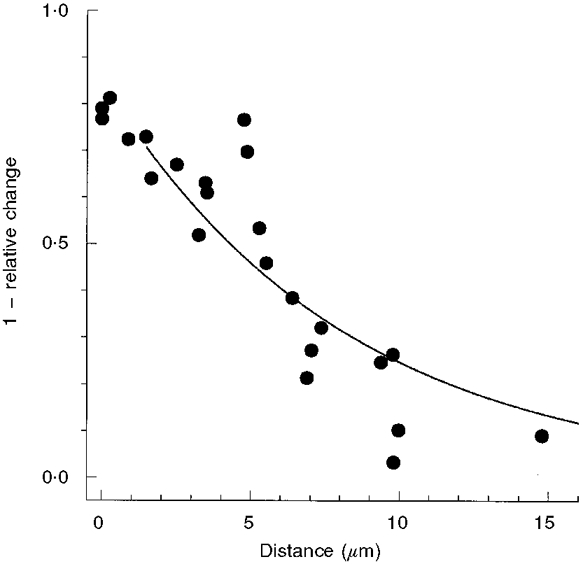
One minus the relative change in the peak amplitude of the test flash response caused by a local step (-2.7 log10 attenuation) of 1064 nm light (i.e. 1 - response in the light/response in the dark) plotted as a function of the distance separating the positions of the test flash and the adapting step. Each data point represents the result of a single experiment at a fixed separation distance, as illustrated in Fig. 6. The continuous line is a single exponential function:(y = 0.85exp(-distance/8.2 μm)) fitted to data points extending from 1.5 to 15 μm.
DISCUSSION
The length constant for the spatial spread of a diffusible messenger is set by competition between longitudinal diffusion and relaxation towards the resting state (see Carslaw & Jaeger, 1959). Thus, if cGMP and Ca2+ were independent messengers in the rod, their decay lengths would be given by:
| (1) |
| (2) |
where DcGMP and DCa are diffusion coefficients, and r and α are the turnover rates in darkness for the free pools of cGMP and Ca2+, respectively. The diffusion coefficients for cGMP and Ca2+ have been reported to be 60 μm2 s−1 (Koutalos et al. 1995a,b) and 5 μm2 s−1 (Koutalous & Nakatani, 1999), respectively. The turnover rates for cGMP and Ca2+ are also thought to be quite different. In dialysed Gecko ROS, cGMP is turned over about once per second (Sather, 1988; Rispoli et al. 1993) in general agreement with other estimates (Hodgkin & Nunn, 1988; Koutalous & Yau, 1996; Nikonov et al. 1998). Calcium, however, circulates through a dialysed outer segment at a high rate (∼70 μm s−1) causing free [Ca2+] in darkness (550 nM) to be turned over ∼140 times per second (Rispoli et al. 1993; Gray-Keller & Detwiler, 1994). This suggests that if cGMP and Ca2+ are independent messengers then they should have substantially different decay lengths (∼7 μm for cGMP and 0.2 μm for Ca2+ using the above parameter values).
This does not agree with our measurements; a possible explanation for the discrepancy is that in functionally intact rods cGMP and Ca2+ are not independent second messengers. They instead influence each other's concentration through the enzyme cascade that underlies phototransduction. Changes in one messenger cause changes in the other, which in turn feed back negatively to counteract the initial changes in the first messenger. For example, a decrease in [cGMP] closes CNG channels, causing a fall in [Ca2+], which increases cGMP synthesis (counteracting the initial decrease in [cGMP]) leading in turn to an increase in Ca2 influx and so forth. Under these conditions changes in the concentrations of cGMP and Ca2+ are tightly coupled and their decay lengths will be much more similar than those for the uncoupled case (see Appendix for a mathematical treatment). If the coupling is tight enough the decay lengths become almost equal and can be represented by a single combined decay length (λ2ndmsg), which is dominated by the messenger with the slowest turnover rate, in this case cGMP, such that:
| (3) |
where q represents the influence of Ca2+ on cGMP turnover rate and is given by [Ca2+]2/(K0.52+[Ca2+]2), with [Ca2+] being the concentration of Ca2+ in darkness and K0.5 = 200 nM being the [Ca2+]i that half-maximally activates guanylyl cyclase (Koch & Stryer, 1988). In the resting dark state q ≈ 1, and for DcGMP = 60 μm2 s−1 the decay length for changes in [cGMP] and [Ca2+] would be ∼3.0 μm. This in reasonable agreement with the measured mean values of 3.8 and 3.2 μm for the spread of cGMP and Ca2+, respectively.
A testable prediction of eqn (3) is that steady background illumination will decrease λ2ndmsg by increasing cGMP turnover. Although the increase in the rate of cGMP hydrolysis by steady light activation will be counteracted by the activation of guanylyl cyclase in response to the drop in [Ca2+], it will not be fully compensated for because light can increase PDE activity to a greater extent than lowered [Ca2+] can increase guanylyl cyclase activity. Hence one would expect that uniform background illumination would reduce λ2ndmsg, resulting in a decrease in the spatial spread of the single photon response. It should be possible to test this prediction in future experiments.
Single photon response
Information about the spatial spread of the second messenger signals allows speculation about what changes in their local concentrations occur during the single photon response. This provides a new measure of the unitary event and allows the change in cGMP that is expected biochemically from the activation of a single Rh* to be compared with the observed electrical response.
In Gecko rods, as in other vertebrates, photo-activation of a single Rh* reduces the circulating dark current by ∼1 % (Rispoli et al. 1993). The fractional change in current density near the activated disc is much larger, however, because the change in [cGMP] evoked by a single photoisomerization is localized and does not spread over the entire outer segment. With a second messenger decay length of 3.5 μm, the cGMP signal would be confined to 7 μm or about one-tenth of the total ROS, making the local reduction in current during a unitary response 10 times larger, or ∼10 %. Since the fractional change in dark current for a small perturbation is about 3 times larger than the fractional change in [cGMP], a consequence of the Hill coefficient of the channels being ∼3, a 10 % change in current would be caused by a change in local free [cGMP] of only about 3 %.
This can be compared to the fractional change in [cGMP] that one might expect solely on the basis of the biochemical properties of the transduction cascade. It is roughly estimated that during 1 s of activity, a single Rh* will excite about 103 G proteins which in turn activate the same number of PDE molecules. The 103 light-activated PDE molecules with a catalytic rate of ∼50 μm−1 s−1 (Stryer, 1991) and 5 μm substrate concentration, will hydrolyse ∼2 × 10⁵ cGMP molecules in 1 s. Since there are about 3 × 10⁵ cGMP molecules in the affected region, i.e. one-tenth of the ROS, this represents about a 70 % decrease in local [cGMP]. The size of this fractional change is reduced, however, by two other processes. One is cGMP resynthesis by guanylyl cyclase, which is stimulated by the local decrease in [Ca2+]. The other is diffusion of cGMP into the depleted zone, which can be estimated using Fick's Law (Fick, 1855):
| (4) |
where η is the number of cGMP molecules diffusing into the depleted region per second, A is the ROS cross-sectional area perpendicular to the direction of diffusion, and Δ[cGMP]ss/λcGMP is the concentration gradient, i.e. the steady-state change in [cGMP] over the distance λcGMP. This indicates that the cGMP hydrolysis triggered by a single Rh*, i.e. 2 × 10⁵ cGMP s−1, can be balanced by diffusive influx resulting from as little as a 7 % fractional change in [cGMP]. The local fractional change in [cGMP] would be expected to be even smaller than 7 %, due to Ca2+-stimulated resynthesis of cGMP by guanylyl cyclase. Thus, the electrical measurement and the biochemical estimate of the single photon response are in general agreement.
A fractional reduction of [cGMP] of < 7 % would not result in the closure of all the channels in a finite ring of outer segment membrane as postulated in the total occlusion model of Lamb et al. (1981). This point is also strongly supported by our observation that cell-attached responses evoked by two-photon stimulation centred on the recorded patch were graded with stimulus intensity instead of all-or-none responses as would be expected in the case of total occlusion.
Spread of adaptation
One of the goals of our work was to estimate the decay length of the adaptation signal by looking at the spatial spread of adaptational changes in the flash response. These measurements suggested that the effects of adaptation spread further than the changes in [cGMP] and [Ca2+]. While this is consistent with results reported by Lamb et al. (1981), the interpretation needs to be carefully considered. There are a number of factors that could affect the apparent spread of changes in the electrical response. For example, the change in whole-cell current that is recorded in response to the test flash is a spatial integral which is affected by the spread of both local excitation and adaptation signals, as well as by the effective width of the small spot stimulus. There are also questions about how the flash responses should be scaled to account for response compression due to the local change in circulating current that is caused by the adapting step. For these reasons our measure of the decay length for the spatial spread of adaptation must be considered an upper estimate and does not exclude the possibility that Ca2+ is the messenger of adaptation.
Acknowledgments
We are very thankful to Professor T. D. Lamb and Dr Fred Rieke for many useful discussions and comments on our manuscript. This work was supported by a grant (P.B.D.) from the National Institutes of Health (EY02048), the W. M. Keck Foundation (P.B.D.) and Lucent Technologies.
APPENDIX
The spatial spread of light-evoked changes in cGMP and Ca2+ can be quantitatively understood by considering the kinetics of the underlying enzymatic activities that influence their concentrations (Kawamura & Murakami, 1986; Hodgkin & Nunn, 1988; Pugh & Lamb, 1993; Koutalous & Yau, 1996; Nikonov et al. 1998). The transduction cascade that is triggered by the photo-isomerization of rhodopsin can be divided into two parts; one that takes place on the disc membrane and involves the activation of PDE by transducin and another that takes place in the cytoplasm where the hydrolysis of cGMP results in closure of CNG channels and leads to a fall in [Ca2+]. Since the first set of events is confined to the membrane, the spatial distribution of active enzyme is restricted to the illuminated discs and under the conditions of our experiments localized to the area of two-photon excitation (≤ 1 μm spot). Thus, the spatial spread of cGMP and Ca2+ results from their cytoplasmic diffusion and can be represented by the following partial differential equations (Carslaw & Jaeger, 1959; Hodgkin & Nunn, 1988; Pugh & Lamb, 1993; Koutalous & Yau, 1996; Nikonov et al. 1998).
Starting with cGMP, which is hydrolysed by PDE and synthesized by guanylyl cyclase (GC):
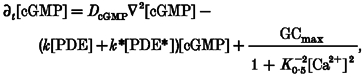 |
(A1) |
where DcGMP≈ 60 μm2 s−1 is the diffusion coefficient for cGMP (Koutalos et al. 1995a,b), ▿2 is a Laplacian operator, k and k* are the catalytic rates for dark- and light-activated PDE having values of ∼0.05 μm−1 s−1 and ∼1000k, respectively (Stryer, 1991), and [PDE]≈ 20 μm (Dumke et al. 1994). The last term describes the Ca2+ dependence of cGMP synthesis by guanylyl cyclase, where GCmax is the maximum cyclase activity in zero Ca2+ (∼10-60 μm cGMP s−1; Koutalous & Yau, 1996), and K0.5≈ 0.2 μm represents the [Ca2+] for half-maximal guanylyl cyclase activity with a Hill coefficient of 2 (Koch & Stryer, 1988; Dizhoor et al. 1994; Gorczyca et al. 1994).
Cytoplasmic [Ca2+] depends on the influx of Ca2+ through CNG channels, efflux by Na+-Ca2+, K+ exchange and association with as yet unidentified buffer(s), whose existence is evident from the fact that the cytoplasmic concentration of free Ca2+ is 300-500 times smaller than the total concentration (Lagnado et al. 1992; Gray-Keller & Detwiler, 1994). [Ca2+] is described by:
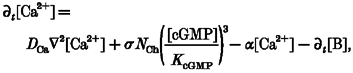 |
(A2) |
where DCa is the diffusion coefficient for Ca2+, which is likely to be in the order of ∼5-10 μm2 s−1 (Kushmeric & Podolski, 1969; Gabso et al. 1997; Koutalous & Nakatani, 1999), σ is the calcium current per CNG channel divided by Faraday's constant, ∼6 × 10⁻²¹ mol s−1 (Gray-Keller & Detwiler, 1994), while the number of channels per unit outer segment volume is NCh≈ 106 pl−1 and the probability of the channels being open is approximately ([cGMP]/KcGMP)3 provided [cGMP] << KcGMP, the half-activation constant (Kawamura & Murakami, 1986; Hodgkin & Nunn, 1988), which is about 25 μm, with [cGMP] in the dark being ∼5 μm (Rispoli et al. 1993). The exchanger runs at a rate α that turns over the free Ca2+ pool at ∼140 s−1 (Gray-Keller & Detwiler, 1994) and B is a buffer that obeys:
| (A3) |
where [BT] is the total buffer concentration, DB is the buffer diffusion coefficient, and kB and k’B are association and dissociation rates, respectively. Since little is known about Ca2+ buffering in ROS the purpose of eqn (A3) is to express the present ignorance while retaining the long time scale, > 1 s, that is evident in the dynamics of Ca2+ decay in saturating light (Rispoli et al. 1993; Gray-Keller & Detwiler, 1994). The slow component in the decline of [Ca2+] should not be confused with the rapid ‘on-rate’ for Ca2+ changes given that the exchanger rate (α) is > 100 s−1, which, although slower than the ∼103 s−1 rates characteristic of PDE activation and cGMP hydrolysis, is still fast on the 1 s time scale of the flash response.
In the dark the uniform steady state is established with:
| (A4a) |
| (A4b) |
Local illumination perturbs this equilibrium through a time-dependent ‘source’ term, k*[PDE*]=p(z, t), sharply localized in space at longitudinal position z = 0 where the light stimulus is applied. For simplicity, we shall neglect the effect of [Ca2+] on the first stage (i.e. Rh* to PDE*) (Lagnado & Baylor, 1994; Gray-Keller & Detwiler, 1996; Koutalos & Yau, 1996) and assume that:
represents the rise and decay of the PDE activity spatially localized near position z = 0 along the rod axis (L being in the order of the size of the photoexcited spot, ∼1 μm). The exact form of the PDE activity time course will turn out to be immaterial for the determination of the second messenger response decay length. For sufficiently weak stimuli, I, the response can be studied by linearizing eqns (A1)–(A3) about the steady state. Since the characteristic time for diffusion across the ROS is quite short (in the order of 4 μm2/103μm2 s−1 = 0.016 s) it is fair to assume that the only relevant spatial variation is along the cell axis. Defining the rescaled fields: x≡ ([cGMP]ss - [cGMP])/[cGMP]ss and y≡ ([Ca2+]ss - [Ca2+])/[Ca2+]ss, we write the linearized equations:
| (A5a) |
where
and:
| (A5b) |
where b(z, t) = ([B(z, t)] - [B]ss)/[Ca2+]ss is the normalized deviation of the buffer concentration from its steady state:
Although, for the sake of completeness, we retained the buffer fluctuations in eqn (A5b), we shall later argue that on the fast time scales which we consider, the effect of the buffer can be neglected in the leading order approximation (see below). We shall therefore ignore it in the qualitative discussion of eqns (A5a) and (A5b).
It can be observed that eqns (A5a) and (A5b) contain two natural length scales, √(DcGMP/r) and √(DCa/α), which would describe the intrinsic dynamics of cGMP and Ca2+, respectively, in the absence of coupling between the two messengers. Each of these length scales simply corresponds to the distance that the perturbation of the messenger in question would spread over in the characteristic time set by its relaxation back to the steady state (i.e. r−1, α−1). The cGMP diffusion length would be considerably longer than that of Ca2+ because r << α, and may be expected to control the spatial decay of the disturbance in the coupled case. The effect of the coupling is to correlate local changes in the concentration of the two messengers defining specific linear combinations of the two fields as independent ‘modes’ of fluctuation. These modes have exponentially localized spatial profiles with decay lengths that are intermediate between those of the uncoupled messengers and relax back to the steady state with characteristic times intermediate between r−1 and α−1. The time and length constants of the two (three if the buffer dynamics is included) modes can be found directly and explicitly by solving eqns (A5a) and (A5b); however, in our case, because r << α, the response to local perturbation (i.e. PDE activity) is dominated by a single mode which we analyse next. Note that the linearized eqns (A5a) and (A5b) provide a correct description of the response far away from the ‘source’ of the perturbation (z = 0 in our notation) quite independently from the magnitude of the local perturbation. This is because the response dies off exponentially with distance.
The disparity between the relaxation times for Ca2+ and cGMP can be used to solve eqns (A5a) and (A5b) approximately. The approximation is based on the condition that Ca2+ relaxation is fast enough to allow it to follow the changes in [cGMP] very closely. This would be the case provided α >> r and the buffer is weak, such that kB[BT] << α, which is the case in Gecko rods where the concentration of low affinity buffer is ∼15 μm and kB is < 1 μm−1 s−1 (Gray-Keller & Detwiler, 1994). To exhibit this mathematically we can rewrite eqn (A5b) as:
| (A6) |
The second term on the right-hand side may be shown to be smaller than the first by a factor in the order of r/α, implying that in the leading order we have y(z, t) ≈ 3x(z, t), which allows eqns (A5a) and (A5b) to be reduced to a single equation for x(z, t):
| (A7) |
from which can we read off the new characteristic length scale λ2ndmsg = √(DcGMP/r(1 + 6q)). The latter is smaller than the characteristic length of cGMP would have been in the absence of Ca2+ feedback by a factor of √(1 + 6q). This is a consequence of the reduction of the effective cGMP relaxation time by the factor 1 + 6q due to the fast Ca2+ feedback. Note that this feedback also reduces the ‘static gain’ of the cGMP response to changes in PDE* by the same factor.
Equation (A7) can be readily solved exactly, but it is more instructive to consider an approximation corresponding to the limit when p(z, t) varies slowly on the time scale of cGMP relaxation, 1/r(1 + 6q) ≈ 0.1 s:
| (A8) |
In the dark-adapted state, q =[Ca2+]ss2/(K0.52+[Ca2+]ss2≈ 1, resulting in the characteristic decay length λ2ndmsg = √(DcGMP/r(1 + 6q)) ≈ 3 μm. Since the perturbation of Ca2+ follows that of cGMP, the same exponential decay dominates the Ca2+ response in agreement with experimental results. The above analysis applies to any background intensity, provided that the steady-state cGMP hydrolysis rate r is taken to be rdark+k*[PDE*]ss. The consequent increase in r will in part be counteracted by the Ca2+ feedback via the reduction of q, which follows the drop of [Ca2+]ss.
We note that in agreement with the experimental results, eqn (A8) exhibits no temporal dispersion, i.e. while the overall amplitude of the response decays exponentially, the time dependence follows that of p(t). This lack of dispersion is approximate and holds only to the extent that the ∼1 s time scale of the pulse is slower than the characteristic time of the cytoplasmic response 1/r(1 + 6q) ≈ 0.15 s; hence we expect dispersive effects in the order of ∼15 %. This is within the experimental error due to the noisiness and temporal variability of the responses recorded from the cell-attached patch (Fig. 3B). The correction for dispersion can easily be found from eqn (A7) and the leading one has a form of z-dependent delay: Δt = z/√(DcGMPr(1 + 6q)), which is ∼0.05 s μm−1.
References
- Bastian BL, Fain G. Light adaptation in toad rods: requirement for an internal messenger which is not calcium. The Journal of Physiology. 1979;297:493–520. doi: 10.1113/jphysiol.1979.sp013053. [DOI] [PMC free article] [PubMed] [Google Scholar]
- Bodoia RD, Detwiler PB. Patch-clamp recordings of the light-sensitive dark noise in retinal rods from the lizard and frog. The Journal of Physiology. 1985;367:183–216. doi: 10.1113/jphysiol.1985.sp015820. [DOI] [PMC free article] [PubMed] [Google Scholar]
- Carslaw HS, Jaeger JC. Conduction of Heat in Solids. 2. Oxford: Clarendon Press; 1959. [Google Scholar]
- Cornwall MC, Fein A, MacNichol EF., Jr Cellular mechanisms that underlie bleaching and background adaptation. Journal of General Physiology. 1990;96:345–372. doi: 10.1085/jgp.96.2.345. [DOI] [PMC free article] [PubMed] [Google Scholar]
- Dizhoor AM, Lowe DG, Olshevskaya EV, Laura RP, Hurley JB. The human photoreceptor membrane guanylyl cyclase, RetGC, is present in outer segments and is regulated by Ca2+ and a soluble activator. Neuron. 1994;12:1345–1352. doi: 10.1016/0896-6273(94)90449-9. [DOI] [PubMed] [Google Scholar]
- Donner KO, Hemilä S. Excitation and adaptation in the vertebrate photoreceptor. Medical Biology. 1978;56:52–63. [PubMed] [Google Scholar]
- Dumke CL, Arshavsky VY, Calvert PD, Bownds MD, Pugh EN. Rod outer segment structure influences the apparent kinetic parameters of cyclic GMP phosphodiesterase. Journal of General Physiology. 1994;103:1071–1098. doi: 10.1085/jgp.103.6.1071. [DOI] [PMC free article] [PubMed] [Google Scholar]
- Fick A. Ueber Diffusion. Annals of Physical Chemistry. 1855;94:59–86. [Google Scholar]
- Gabso M, Neher E, Spira ME. Low mobility of the Ca2+ buffers in axons of cultured Aplysia neurons. Neuron. 1997;18:473–481. doi: 10.1016/s0896-6273(00)81247-7. [DOI] [PubMed] [Google Scholar]
- Göppert-Mayer M. Ueber Elementarakte mit zwei Quantenspruengen. Annals of Physics. 1931;9:273–285. [Google Scholar]
- Gorczyca WA, Gray-Keller MP, Detwiler PB, Palczewski K. Purification and physiological evaluation of a guanylate cyclase activating protein from retinal rods. Proceedings of the National Academy of Sciences of the USA. 1994;91:4014–4018. doi: 10.1073/pnas.91.9.4014. [DOI] [PMC free article] [PubMed] [Google Scholar]
- Gray P, Attwell D. Kinetics of light-sensitive channels in vertebrate photoreceptors. Proceedings of the Royal Society. 1985;223:379–388. doi: 10.1098/rspb.1985.0007. B. [DOI] [PubMed] [Google Scholar]
- Gray-Keller MP, Detwiler PB. The calcium feedback signal in the phototransduction cascade of vertebrate rods. Neuron. 1994;13:849–861. doi: 10.1016/0896-6273(94)90251-8. [DOI] [PubMed] [Google Scholar]
- Gray-Keller MP, Detwiler PB. Ca2+ dependence of dark- and light-adapted flash responses in rod photoreceptors. Neuron. 1996;17:323–331. doi: 10.1016/s0896-6273(00)80163-4. [DOI] [PubMed] [Google Scholar]
- Hagins WA, Penn RD, Yoshikami S. Dark current and photocurrent in retinal rods. Biophysical Journal. 1970;10:380–412. doi: 10.1016/S0006-3495(70)86308-1. [DOI] [PMC free article] [PubMed] [Google Scholar]
- Hemilä S, Reuter T. Longitudinal spread of adaptation in the rods of the frog's retina. The Journal of Physiology. 1981;310:501–528. doi: 10.1113/jphysiol.1981.sp013564. [DOI] [PMC free article] [PubMed] [Google Scholar]
- Hodgkin AL, Nunn BJ. Control of light-sensitive current in salamander rods. The Journal of Physiology. 1988;403:439–471. doi: 10.1113/jphysiol.1988.sp017258. [DOI] [PMC free article] [PubMed] [Google Scholar]
- Jacobs MH. Diffusion Processes. New York: Springer-Verlag; 1967. [Google Scholar]
- Kawamura S, Murakami M. In situ cGMP phosphodiesterase and photoreceptor potential in Gecko rods. Journal of General Physiology. 1986;87:737–759. doi: 10.1085/jgp.87.5.737. [DOI] [PMC free article] [PubMed] [Google Scholar]
- Koch K-W, Stryer L. Highly cooperative feedback control of retinal rod guanylate cyclase by calcium ions. Nature. 1988;334:64–66. doi: 10.1038/334064a0. [DOI] [PubMed] [Google Scholar]
- Koutalos Y, Brown RL, Karpen JW, Yau K-W. Diffusion coefficient of the cyclic GMP analog 8-(fluoreceinyl)thioguanosine 3′, 5′ cyclic monophosphate in salamander rod outer segment. Biophysical Journal. 1995a;69:2163–2167. doi: 10.1016/S0006-3495(95)80090-1. [DOI] [PMC free article] [PubMed] [Google Scholar]
- Koutalos Y, Nakatani K. Calcium diffusion coefficient in salamander rod outer segments. Biophysical Journal. 1999;76:A242. doi: 10.1016/S0006-3495(02)75435-0. [DOI] [PMC free article] [PubMed] [Google Scholar]
- Koutalos Y, Nakatani K, Yau K-W. Cyclic GMP diffusion coefficients in rod photoreceptor outer segments. Biophysical Journal. 1995b;68:373–382. doi: 10.1016/S0006-3495(95)80198-0. [DOI] [PMC free article] [PubMed] [Google Scholar]
- Koutalos Y, Yau K-W. Regulation of sensitivity in vertebrate rod photoreceptors by calcium. Trends in Neurosciences. 1996;19:73–81. doi: 10.1016/0166-2236(96)89624-x. [DOI] [PubMed] [Google Scholar]
- Kushmerick MJ, Podolski RJ. Ionic mobility in muscle cells. Science. 1969;166:1297–1298. doi: 10.1126/science.166.3910.1297. [DOI] [PubMed] [Google Scholar]
- Lagnado L, Baylor DA. Calcium controls light-triggered formation of catalytically active rhodopsin. Nature. 1994;367:273–277. doi: 10.1038/367273a0. [DOI] [PubMed] [Google Scholar]
- Lagnado L, Cervetto L, McNaughton PA. Calcium homeostasis in the outer segments of retinal rods from tiger salamander. The Journal of Physiology. 1992;455:111–142. doi: 10.1113/jphysiol.1992.sp019293. [DOI] [PMC free article] [PubMed] [Google Scholar]
- Lamb TD, McNaughton PA, Yau K-W. Spatial spread of activation and background desensitization in toad rod outer segments. The Journal of Physiology. 1981;319:463–496. doi: 10.1113/jphysiol.1981.sp013921. [DOI] [PMC free article] [PubMed] [Google Scholar]
- Matthews G. Spread of the light response along the rod outer segment: an estimate from patch-clamp recordings. Vision Research. 1986;26:535–541. doi: 10.1016/0042-6989(86)90002-7. [DOI] [PubMed] [Google Scholar]
- Matthews HR, Murphy RLW, Fain GL, Lamb TD. Photoreceptor light adaptation is mediated by cytoplasmic Ca concentration. Nature. 1988;334:67–69. doi: 10.1038/334067a0. [DOI] [PubMed] [Google Scholar]
- Nakatani K, Yau K-W. Calcium and light adaptation in retinal rods and cones. Nature. 1988;334:69–71. doi: 10.1038/334069a0. [DOI] [PubMed] [Google Scholar]
- Nikonov S, Engheta N, Pugh EN., Jr Kinetics of recovery of the dark-adapted salamander rod photoresponse. Journal of General Physiology. 1998;111:7–37. doi: 10.1085/jgp.111.1.7. [DOI] [PMC free article] [PubMed] [Google Scholar]
- Pugh EN, Jr, Lamb TD. Amplification and kinetics of the activation steps in phototransduction. Biochimica et Biophysica Acta. 1993;114:111–149. doi: 10.1016/0005-2728(93)90038-h. [DOI] [PubMed] [Google Scholar]
- Rispoli G, Sather WA, Detwiler PB. Visual transduction in dialysed detached rod outer segments from lizard retina. The Journal of Physiology. 1993;465:513–537. doi: 10.1113/jphysiol.1993.sp019691. [DOI] [PMC free article] [PubMed] [Google Scholar]
- Sather WA. Seattle, Washington: University of Washington; 1988. Phototransduction in detached rod outer segments. PhD Thesis. [Google Scholar]
- Stiles WS. Transactions of the Optical Convention of the Worshipful Company of Spectacle Makers. London: Spectacle Maker's Company; 1948. The physical interpretation of the spectral sensitivity curve of the eye; pp. 97–107. [Google Scholar]
- Stryer L. Visual excitation and recovery. Journal of Biological Chemistry. 1991;266:10711–10714. [PubMed] [Google Scholar]