

Abstract
The inhibitory neurotransmitter glycine can elicit depolarizing responses in immature neurones. We investigated the changes in glycine responses and their ionic mechanism in developing neurones of the rat lateral superior olive (LSO), an auditory brainstem nucleus involved in sound localization.
Whole-cell and gramicidin perforated-patch recordings were performed from visually identified LSO neurones in brain slices and glycine was pressure applied for 3–100 ms to the soma. Glycine-evoked currents were reversibly blocked by strychnine. They were mostly monophasic, but biphasic responses occurred in ∼30% of P8-11 neurones in perforated-patch recordings.
In whole-cell recordings from P2-11 neurones, the reversal potential of glycine-evoked currents (EGly) was determined by the transmembranous Cl− gradient and corresponded closely to the Nernst potential for Cl−, regardless of age. This indicates that Cl− is the principle ion permeating glycine receptors, but is also consistent with a low relative (10–20%) permeability for HCO3−. The Cl− gradient also determined the polarity and amplitude of glycine-evoked membrane potential changes.
Leaving the native intracellular [Cl−] undisturbed with gramicidin perforated-patch recordings, we found a highly significant, age-dependent change of EGly from −46.8 ± 1.8 mV (P1-4, n = 28) to −67.6 ± 3.3 mV (P5-8, n = 10) to −82.2 ± 4.1 mV (P9–11, n = 18). The majority of P1–4 neurones were depolarized by glycine (∼80%) and spikes were evoked in ∼30%. In contrast, P9–11 neurones were hyperpolarized.
In perforated-patch recordings, EGly was influenced by the voltage protocol and the glycine application interval; it could be shifted in the positive and negative direction. For a given application interval, these shifts were always larger in P1–4 than in P8–11 neurones, pointing to less effective Cl− regulation mechanisms in younger neurones.
Furosemide (frusemide), a blocker of cation-Cl− cotransporters, reversibly shifted EGly in the negative direction in P2–4 neurones, yet in the positive direction in P8–10 neurones, suggesting the blockade of net inward and net outward Cl− transporters, respectively.
Taken together, age-dependent changes in active Cl− regulation are likely to cause the developmental shift from depolarizing to hyperpolarizing glycine responses. A high intracellular [Cl−] is generated in neonatal LSO neurones which decreases during maturation.
The mechanisms underlying the development and maturation of inhibitory synapses in the central nervous system (CNS) are still poorly understood. This is mainly due to the fact that inhibitory neurones are mostly interneurones which are diffusely distributed within a brain region. In the adult CNS, fast synaptic inhibition is mediated by the release of GABA or glycine and subsequent activation of GABAA receptors (GABAARs) or glycine receptors (GlyRs). These receptors are ion channels permeable to Cl− and, to a much lesser extent, to other anions such as bicarbonate (HCO3−) (Bormann et al. 1987). A flux of Cl− into neurones causes a hyperpolarization of the membrane potential and, hence, inhibition of neuronal activity. However, GABA and glycine depolarize neurones in many CNS areas during embryonic and neonatal development, e.g. in the hippocampus (Ben-Ari et al. 1989; Cherubini et al. 1990), cerebral cortex (Luhmann & Prince, 1991; Lo Turco et al. 1995), hypothalamus (Chen et al. 1996), brainstem (Kandler & Friauf, 1995b; Singer et al. 1998) and spinal cord (Wu et al. 1992; Reichling et al. 1994). The depolarizing action of GABA and glycine can be excitatory, i.e. generate spike activity and induce Ca2+ influx, probably via the opening of voltage-gated Ca2+ channels (VGCCs) (Reichling et al. 1994; Leinekugel et al. 1995; Obrietan & van den Pol, 1995; Owens et al. 1996; Flint et al. 1998). It has been suggested that the transiently depolarizing action of inhibitory transmitters and the resulting influx of Ca2+ may play a role in inhibitory synapse maturation and plasticity, similar to the situation seen at excitatory synapses (McLean et al. 1996; Ben-Ari et al. 1997). There is evidence that depolarizing GABAA responses in developing neurones are caused by an efflux of Cl− which is attributable to a high internal Cl− concentration ([Cl−]i), and it has been suggested that the high [Cl−]i is generated by an active inward Cl− transport involving transporter molecules (Rohrbough & Spitzer, 1996; Owens et al. 1996).
We use the lateral superior olive (LSO), a nucleus within the mammalian auditory brainstem, as a model system to study the development of glycinergic synapses. The LSO is a binaural nucleus that contributes to sound localization by processing interaural intensity differences (for review see Helfert et al. 1991). Adult LSO neurones receive excitatory, glutamatergic input from the ipsilateral ear via the ventral cochlear nucleus and inhibitory, glycinergic input from the contralateral ear via the medial nucleus of the trapezoid body (MNTB). The LSO is of particular interest for studying the development of inhibitory connections, because the input from the MNTB is exclusively inhibitory and tonotopically ordered (for review see Helfert et al. 1991). During development, there is a refinement of the MNTB- LSO projection which appears to be activity dependent and involves pruning of the afferent axon terminals of MNTB neurones (Sanes & Siverls, 1991; Sanes & Takacs, 1993) as well as of the postsynaptic dendritic trees of LSO neurones (Sanes & Chokshi, 1992; Sanes et al. 1992; Rietzel & Friauf, 1998). In the rat, glycinergic afferents reach their targets within the LSO on embryonic day (E) 18 (Kandler & Friauf, 1993), i.e. 4 days before birth, but the onset of hearing is not until postnatal day (P) 12. Glycinergic transmission from the MNTB to the LSO starts at E18 and is depolarizing until the end of the first postnatal week, after which it becomes hyperpolarizing (Kandler & Friauf, 1995b). A depolarizing action of glycine has also been demonstrated in perforated-patch recordings from the rat LSO using long bath applications of glycine (Backus et al. 1998). However, no difference was found in glycine-evoked responses between the first and the second postnatal week, but a new, HCO3−-dependent biphasic response type was described. In gerbils, where auditory development appears to follow a similar time course to that in rats, depolarizing glycinergic transmission from MNTB to LSO was not described initially (Sanes, 1993), but recent data from whole-cell patch-clamp recordings suggest that GABAergic and glycinergic postsynaptic currents in the medial, but not the lateral, part of the LSO have reversal potentials more positive than the resting membrane potential (Vm) during the first two postnatal weeks (Kotak et al. 1998). Thus, the developmental changes in glycine action in the LSO are still controversially discussed.
Here, we studied the development and ionic mechanisms of glycine-evoked currents of LSO neurones in brain slices from neonatal rats employing the patch-clamp technique. We found that the transmembranous Cl− gradient of developing neurones determines the polarity of their glycine response. In gramicidin perforated-patch recordings with intact [Cl−]i (Abe et al. 1994; Kyrozis & Reichling, 1995), a negative shift in the reversal potential of glycine-evoked responses (EGly) occurs. Accordingly, many neonatal neurones were depolarized by glycine, changing to hyperpolarization in the second postnatal week. LSO neurones actively regulate their [Cl−]i in an age-dependent manner using furosemide-sensitive Cl− transporters: in neonatal neurones, inward Cl− transport generates a high [Cl−]i whereas in older neurones, outward Cl− transport keeps [Cl−]i low. Some of these data have been presented in abstract form (Ehrlich et al. 1998).
METHODS
Brain slice preparation
Young Sprague-Dawley rats (P1-11) were used. Animals were housed in our facility and treated in compliance with the current German animal protection law. All protocols were approved by the local animal care and use committee (RP Darmstadt, Germany). Rat pups were killed by decapitation and their brains were dissected in a chilled (4°C) solution containing (mm): NaHCO3, 25; KCl, 2.5; NaH2PO4, 1.25; MgCl2, 1; CaCl2, 2; D-glucose, 260; sodium pyruvate, 2; myo-inositol, 3; kynurenic acid, 1 (continuously bubbled with 95 % O2-5 % CO2, pH 7.4). Coronal sections (300 μm) of the auditory brainstem were obtained using a VT-1000 vibratome (Leica, Bensheim, Germany). Slices were transferred to extracellular solution containing (mm): NaCl, 125; NaHCO3, 25; KCl, 2.5; NaH2PO4, 1.25; MgCl2, 1; CaCl2, 2; D-glucose, 10; sodium pyruvate, 2; myo-inositol, 3; ascorbic acid, 0.4 (continuously bubbled with 95 % O2-5 % CO2, pH 7.4), incubated at 36°C for 60 min, and stored at room temperature (20-25°C) until recording.
Electrophysiological recording
For whole-cell recordings, patch pipettes were pulled from filamented borosilicate glass capillaries (GB150F-8P, Science Products, Hofheim, Germany) on a horizontal puller (P-87, Sutter Instruments, Novato, CA, USA) and had resistances of 4–8 MΩ when filled with intracellular solution. We used pipette solutions with four different Cl− concentrations ([Cl−]p). One solution (132 mm Cl−) contained (mm): KCl, 130; Hepes, 10; EGTA, 5; MgCl2, 1; Na2ATP, 2; and Na2GTP, 0.3 (pH 7.2 with KOH). In two other solutions (32 or 12 mm Cl−), 130 mm KCl was substituted by 100 mm potassium gluconate with 30 mm KCl, and by 120 mm potassium gluconate with 10 mm KCl, respectively. The fourth solution (4.2 mm Cl−) contained (mm): potassium gluconate, 135; Hepes, 10; EGTA, 1; MgCl2, 2; CaCl2, 0.1; and Na2ATP, 2 (pH 7.2 with KOH). For perforated-patch recordings, patch pipettes were pulled from unfilamented borosilicate glass capillaries (GB150-8P, Science Products), frontfilled with gramicidin-free pipette solution (132 mm Cl−) for 45-60 s and then backfilled with the same solution that additionally contained 30-80 μg ml−1 gramicidin. A stock solution of gramicidin (10 mg ml−1) was prepared in dimethyl sulfoxide (DMSO) and was then diluted such that the pipette solution never contained more than 0.8 % DMSO.
Slices were transferred to a recording chamber and continually perfused with extracellular solution at room temperature and a rate of 3–4 ml min−1. LSO neurones were visualized with DIC-infrared optics using a ×40, 0.75 NA water-immersion objective on an Axioscope FS microscope (Zeiss, Germany) equipped with a video camera system (Hamamatsu, Japan). For whole-cell recordings, a gigaseal was established and the membrane patch ruptured to gain low resistance access to the cell (series resistance: 17 ± 1 MΩ). For gramicidin perforated-patch recordings, the progress of perforation was monitored after formation of a gigaseal until the series resistance had stabilized to ≤30 MΩ (after 10-30 min). Recordings were made with an Axopatch-1D amplifier (Axon Instruments, Foster City, CA, USA) and signals were filtered at 1–10 kHz using the amplifier's 4-pole Bessel filter. Data were digitized at 2–5 times the filter frequency via a Digidata 1200 interface (Axon Instruments) and stored on a personal computer using pCLAMP software (Axon Instruments). Series resistance compensation was set to 70-80 % with a lag of 80-100 μs.
Drugs and drug application
Kynurenic acid, EGTA, Na2ATP and Na2GTP were obtained from Fluka (Neu-Ulm, Germany). Ascorbic acid, potassium gluconate, strychnine, glycine, gramicidin and furosemide were purchased from Sigma (Deisenhofen, Germany) and tetrodotoxin (TTX) was from RBI Biotrend (Cologne, Germany). All other chemicals were obtained from Merck (Darmstadt, Germany). Stock solutions of glycine and strychnine were stored at −20°C and diluted to working concentrations in extracellular solution before use. Furosemide (1 mm) was directly dissolved in extracellular solution before use.
Glycine (1 mm) was pressure applied via a wider-tip (opening diameter μ2-5 μm) patch pipette mounted on a multi-channel Picospritzer (General Valve Corp., Fairfield, NJ, USA). The application pipette was positioned over the soma of the recorded neurone. Glycine was applied at a low pressure (μ3 p.s.i.) to avoid movement of the tissue. The duration of the application pulses (3–100 ms, mostly ≤30 ms) was adjusted so that a well-measurable current response was evoked. All other drugs were applied via the bath.
Voltage protocols
The holding potential (Vh) was −70 mV between voltage steps and different experimental protocols. To determine EGly, we used three voltage protocols (‘random’, ‘up’, and ‘down’) that differed in the order in which the voltage steps were given. In the ‘random’ protocol, voltage steps were applied in randomized order, in the ‘up’ protocol in ascending order and in the ‘down’ protocol in descending order. In all protocols, voltage steps lasted 2–3 s and glycine was applied 500 ms after the onset of the step, when fast voltage-activated currents are negligible. Step voltages (Vs) ranged between −90 and +20 mV in whole-cell recordings and between −100 and −10 mV in perforated-patch recordings. The interval between the voltage steps was varied between 5 and 50 s. Long intervals (30 and 50 s) were used in young neurones (≤P4) to avoid shifts in EGly and to unambiguously determine EGly, shorter intervals (5 and 10 s) were used in experiments in which the susceptibility of neurones to shifts in EGly was investigated.
Data analysis
Data analysis was performed using Igor (WaveMetrics Inc., Lake Oswego, OR, USA) or Origin (Microcal Inc., Northampton, MA, USA) software packages. Current amplitudes (I) were measured as the difference between mean holding current and mean maximally evoked current in two time windows (5–8 ms duration), one positioned before the pulse and the second positioned at the peak response. To generate current-voltage relations (I-V relations), Vs values were corrected for the voltage errors due to incomplete series resistance compensation. However, when experimental protocols are described, uncorrected Vs values are given. We did not correct for liquid junction potentials (LJPs) for the following reasons. In whole-cell recordings, we applied high positive pressure to the pipette while penetrating the slice and found that the buildup of the LJP was very slow, i.e. much slower than the time needed for seal formation. Secondly, the Vm of LSO neurones measured with four different pipette solutions (132 mm Cl−: −59.4 ± 1.7 mV; 32 mm Cl−: −57.5 ± 1.3 mV; 12 mm Cl−: −58 ± 1.0 mV; 4.2 mm Cl−: −57.8 ± 2.5 mV) did not differ from each other (ANOVA, P = 0.8) and were comparable to Vm values obtained in sharp electrode recordings (Kandler & Friauf, 1995a), where LJP problems do not exist. In perforated-patch recordings, with little or no positive pressure on the pipette, the LJP amounted to μ3 mV and was therefore neglected. I-V relations were well fitted by a linear regression in most cases, and EGly was determined as the voltage at zero current of the regression line or the extrapolation of this line. In a few cases, EGly was determined by interpolation of the data points in the I-V relation. Grouped data are given as means ±s.e.m., and n is the number of cells. The current and voltage traces shown in the figures represent single events; likewise, values in the I-V relations represent single measurements. Statistical analysis between experimental groups was performed using either Student's two-tailed t test or analysis of variance (ANOVA). If applicable, Tukey's honestly significant difference (HSD) post hoc test was used in combination with ANOVA. The P values are given for each test, and significant differences are marked in the figures; *P≤ 0.05, **P≤ 0.01, ***P≤ 0.001.
RESULTS
Characterization of glycine-evoked currents in LSO neurones
We investigated the properties and development of glycine-evoked responses in LSO neurones of rats between P1 and P11. We applied glycine focally to the soma, because here the membrane potential and the intracellular milieu can be better controlled through the patch pipette than at more distant locations. Glycine applications were short in an attempt to mimic synaptic actions. Glycine responses were most probably generated by the recorded neurone rather than by network activity, because they were not altered by bath application of 1 μm TTX (n = 2, not shown) and they readily disappeared when the application pipette was moved away from the recorded cell. In whole-cell recordings with a pipette chloride concentration ([Cl−]p) of 132 or 32 mm, glycine-evoked currents were reversibly blocked by bath application of 0.5 μm strychnine (98.7 ± 0.7 % block, n = 3, Fig. 1A) or 2 μm strychnine (95.3 ± 1.5 % block, n = 2).
Figure 1. Characterization of glycine-evoked currents in LSO neurones.
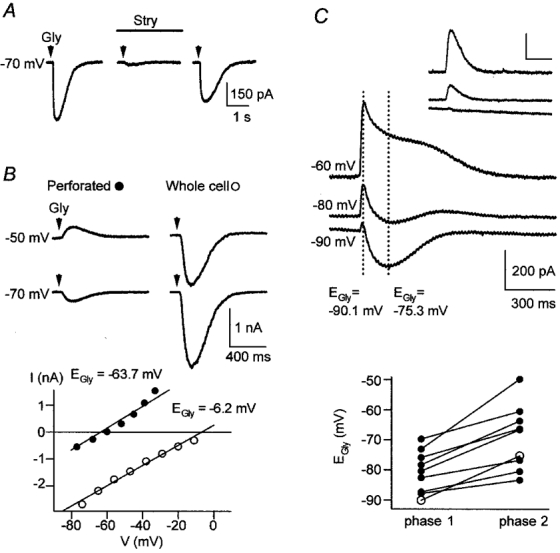
A, glycine-evoked currents were reversibly blocked by bath application of strychnine. Glycine-evoked currents obtained in a whole-cell recording of a P3 neurone with 32 mm[Cl−]p and Vs =−70 mV before, during and after application of 0.5 μm strychnine. The glycine response recovered to 68 % of control after 20 min washout. B, EGly depended on the recording configuration. The upper panel shows glycine-evoked currents recorded in a P7 neurone in gramicidin perforated-patch configuration (left) and, after membrane rupture, in whole-cell configuration (right), at Vs =−50 and −70 mV. The corresponding I-V relations in the lower panel illustrate that EGly changed from −63.7 mV in perforated-patch recording (•, Vs =−80 to −20 mV, ‘up’ protocol) to −6.2 mV in the subsequent whole-cell recording (○, Vs =−80 to −10 mV, ‘up’ protocol). During whole-cell recording, the [Cl−] in the pipette and bath solution were about equimolar (132 vs. 133.5 mm). C, biphasic glycine-evoked currents were seen in perforated-patch recordings of some P8-11 neurones. The upper panel shows biphasic currents recorded from a P10 neurone at Vs =−90, −80 and −60 mV; glycine was applied for 20 ms. The same neurone displayed monophasic currents in response to briefer applications (5 ms, inset). Scale bars are identical in the main panel and inset. Dotted lines mark the time when current amplitudes were measured to determine EGly of phase 1 (−90.1 mV) and phase 2 (−75.3 mV). The lower panel shows a summary of all 9 neurones displaying biphasic glycine responses; ○, results from the neurone shown in the upper panel. EGly of phase 1 was always more negative than that of phase 2 (−80.6 ± 2.3 vs.−69.2 ± 3.6 mV).
When perforated-patch recordings were compared with whole-cell recordings obtained from the same neurone, the importance of [Cl−]i in determining the size, polarity and reversal potential of glycine responses was demonstrated. This is shown in Fig. 1B, where a P7 neurone was initially recorded in perforated-patch configuration and EGly was −63.7 mV. When the membrane was ruptured underneath the patch, EGly changed very rapidly to −6.2 mV, close to the reversal potential for Cl− (ECl) predicted by the Nernst equation (ECl =−0.3 mV for 132 mm[Cl−]p and 133.5 mm external [Cl−]). Similar results were obtained in all 21 neurones tested where EGly changed to −2.7 ± 1.4 mV after membrane rupture. Because of this rapid change, it was easy to discriminate between a perforated-patch recording and an unwanted whole-cell recording occurring through a spontaneous membrane rupture.
Monophasic currents comprised the majority of glycine-evoked responses (see e.g. Figs 1A and B, 2A and B, and 4A-C). They were observed in all whole-cell recordings regardless of age (n = 44), all perforated-patch recordings between P1 and P7 (n = 39) and most of the perforated-patch recordings between P8 and P11 (n = 22 of 31). Additionally, we found biphasic glycine-evoked currents in about a third of perforated-patch recordings in P8-11 neurones (n = 9 of 31, Fig. 1C), consisting of an early and a later phase (phase 1 and phase 2) that had a different EGly. Reducing the duration of the glycine application by a factor of four, e.g. from 20 to 5 ms, resulted in monophasic currents (Fig. 1C, inset) that had the same EGly as phase 1 of the biphasic currents (n = 2). Phase 1 always reversed at a more negative potential than phase 2 (−80.6 ± 2.3 and −69.2 ± 3.6 mV, respectively, n = 9, Fig. 1C). Biphasic glycine responses appeared to consist of a fast, initial phase with a similar EGly and, possibly, the same ionic basis as monophasic responses, and a second phase ‘blending’ into the first. We did not investigate the ionic mechanisms of biphasic responses (see Discussion for a short account on biphasic responses), yet concentrated on monophasic responses in the following.
Figure 2. EGly corresponds closely to the Nernst potential for Cl−.
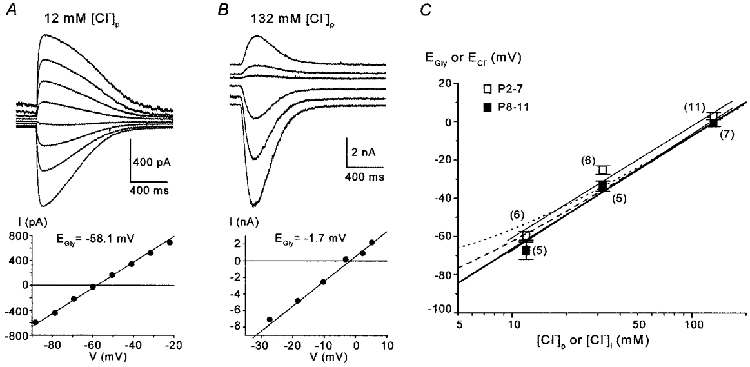
Glycine-evoked currents were recorded in whole-cell configuration with 12, 32 or 132 mm[Cl−]p. EGly was determined and compared with ECl values predicted by the Nernst equation. A and B, the upper panels show glycine-evoked currents recorded in a P10 and a P9 neurone with 12 and 132 mm[Cl−]p, respectively. The lower panels depict the corresponding I-V relations, with EGly amounting to −58.1 and −1.7 mV. Vs =−90 to −20 mV (‘up’ protocol) in A and Vs =−60 to +20 mV (‘random’ protocol) in B. C, semilogarithmic plot of EGly±s.e.m.versus[Cl−]p; pooled data from two age groups are shown (P2-7, □, and P8-11, ▪, n in parentheses). In P2-7 neurones, EGly was 3.1 ± 1.9, −25.3 ± 2.2 and −59.6 ± 2.3 mV for 132, 32 and 12 mm[Cl−]p, respectively. The slope of the linear fit to these data points (upper thin line) was +58.4 mV per 10-fold increase in [Cl−]i. In P8-11 neurones, EGly was −0.1 ± 2.4, −33.7 ± 2.7 and −67.5 ± 4.6 mV for 132, 32 and 12 mm[Cl−]p, respectively. The slope of the linear fit to these data points (lower thin line) was +60.9 mV per 10-fold increase in [Cl−]i. These data for both age groups agree well with values predicted by the Nernst equation for Cl− (thick line). Dashed and dotted curves represent the mixed ion reversal potentials calculated from the Goldman-Hodgkin-Katz equation using relative HCO3− permeabilities that are 11 and 33 % of the Cl− permeability, respectively.
Figure 4. EGly changes during development.

EGly was determined from LSO neurones of different ages recorded in gramicidin perforated-patch configuration. A-C, the upper panels show examples of glycine-evoked currents obtained at different step potentials in a P3, a P7 and a P10 neurone. The lower panels depict the corresponding I-V relations, where EGly amounted to −38.4 mV (P3), −62.4 mV (P7) and −79.7 mV (P10). The current families and I-V relations shown here were obtained with the ‘up’ voltage protocol. In all cases, care was taken to unambiguously determine EGly (see Methods for details). Vs =−70 to −20 mV in A, −80 to −20 mV in B and −90 to −40 mV in C. D, EGly values from LSO neurones (n = 57, P1-11) were plotted against age; open circles mark results from the three neurones shown in A-C. An age-related negative shift of EGly was seen. E, grouped data show a highly significant shift of EGly from −46.8 ± 1.8 mV at P1-4 (n = 28) to −67.6 ± 3.3 mV at P5-8 (n = 10) to −82.2 ± 4.1 mV at P9-11 (n = 18, ▪, ANOVA, P < 0.001). A parallel shift in Vm was not observed (□); a significant difference was found only between P1-4 and P9-11 (ANOVA and Tukey's HSD post hoc test, P < 0.05). Average Vm values were −58.3 ± 0.8 mV at P1-4 (n = 24), −63.0 ± 2.4 mV at P5-8 (n = 9) and −62.7 ± 1.4 mV at P9-11 (n = 15).
EGly is determined by the transmembranous Cl− gradient and corresponds closely to the Nernst potential for Cl−
Depolarizing GABA and glycine responses in neurones have been attributed to a number of mechanisms, e.g. an increase in the conductance to anions such as HCO3− (Staley et al. 1995; Perkins & Wong, 1996; Backus et al. 1998) or to cations (Andersen et al. 1980). Because it was suggested that a high [Cl−]i is responsible for GABA-induced depolarizations in immature neurones (Rohrbough & Spitzer, 1996; Owens et al. 1996), we investigated the role of Cl− in glycine-evoked responses during the first and second post-natal week, when a change from glycinergic depolarization to hyperpolarization occurs in the LSO (Kandler & Friauf, 1995b). In whole-cell recordings, we biased the [Cl−]i to that of the pipette, using three different [Cl−]p of 12, 32 and 132 mm, while the external [Cl−] was always 133.5 mm. Results of such experiments are illustrated in Fig. 2A and B, demonstrating that two neurones at about the same age, yet recorded with different [Cl−]p, displayed a different EGly. As shown in Fig. 2C, EGly determined from neurones in the first (P2-7) and the second (P8-11) postnatal week depended on the [Cl−]p. Linear fits to the data yielded a change of +58.4 and +60.9 mV per 10-fold increase in [Cl−]p for P2-7 and P8-11 neurones, respectively. These values correspond well to the values for ECl predicted by the Nernst equation (at 25°C, +59.2 mV change per 10-fold increase in [Cl−]p). However, EGly in whole-cell recordings from younger neurones was slightly more positive than ECl. Taking a HCO3− permeability of GlyRs into account, we also calculated mixed reversal potentials on the basis of the Goldman-Hodgkin-Katz equation. We assumed HCO3− permeabilities of 11 % (Bormann et. al, 1987) and 33 % (arbitrarily chosen) relative to that of Cl− (Fig. 2C; dashed and dotted curve, respectively). The external [HCO3−] was 25 mm and the [HCO3−]i, as set to a constant level by the intracellular pH, was calculated to be 17.7 mm. From this, we estimate that the experimentally obtained EGly values are also consistent with a relative HCO3− permeability of GlyRs in the range of 10-20 %. Taken together, our results support the hypothesis that Cl− is the principle ion mediating glycine responses in LSO neurones, and that the Cl− permeability of GlyRs is barely, if at all, altered during development.
Polarity and amplitude of glycine responses are determined by [Cl−]i
To elucidate the physiological relevance of differences in [Cl−]i, we recorded glycine-evoked membrane potential changes while controlling the [Cl−]i via the pipette. For all [Cl−]p tested, neurones responded to glycine application as expected from the calculated values for ECl (and from the measured values for EGly). Glycine strongly depolarized neurones recorded with 132 mm[Cl−]p, and spike activity occurred on top of the depolarization in all neurones tested (n = 7, P2-9). This spike activity ranged from three spikes generated within 30 ms to 17 spikes generated within 560 ms (Fig. 3A). All neurones recorded with 32 mm[Cl−]p showed a less pronounced depolarization (n = 9, P3-11), and in four of these, 1–3 spikes were triggered (P3-8, Fig. 3B). When 12 mm[Cl−]p was used, neurones were slightly depolarized (n = 2 of 9), showed no response (n = 3 of 9) or were slightly hyperpolarized (n = 4 of 9, P3-9, Fig. 3C). When the [Cl−]p was reduced further to 4.2 mm, glycine hyperpolarized all neurones tested (n = 4, P2-3, Fig. 3D). The results show that the polarity and the amplitude of glycine responses are determined by the [Cl−]i. They also suggest that, under physiological conditions, glycine may excite neurones by inducing spikes when ECl is above spike threshold.
Figure 3. [Cl−]i determines the polarity and amplitude of glycine responses.
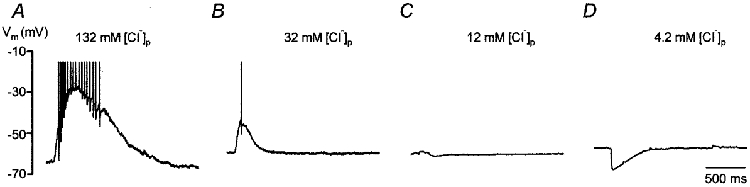
Examples of glycine-evoked membrane potential changes observed in four neurones recorded in whole-cell configuration with different [Cl−]p. A, a P9 neurone recorded with 132 mm[Cl−]p had a calculated EGly of −0.3 mV; it was strongly depolarized and a train of 17 spikes was evoked within 560 ms. B, a P8 neurone recorded with 32 mm[Cl−]p had a calculated EGly of −36.7 mV; it was less depolarized than the neurone shown in A and a single spike was evoked. C, a P3 neurone recorded with 12 mm[Cl−]p had a calculated EGly of −61.9 mV; it showed a very small hyperpolarization. D, a P3 neurone recorded with 4.2 mm[Cl−]p had a calculated EGly of −88.9 mV; it was hyperpolarized. Spikes in A and B are truncated. Same time scale for A-D.
Perforated-patch recordings reveal a negative shift of EGly between P1 and P11
Previous studies have yielded controversial results concerning whether, when and where in the LSO a shift from depolarizing to hyperpolarizing glycine action occurs (Sanes, 1993; Kandler & Friauf, 1995b; Backus et al. 1998; Kotak et al. 1998). The controversy may be due to different experimental approaches. Since our whole-cell recordings demonstrated the importance of [Cl−]i in determining properties of glycine-evoked currents, we had to record from LSO neurones with intact [Cl−]i to correctly assess their EGly. We therefore used the gramicidin perforated-patch technique and characterized age-dependent changes in EGly. Since we had observed that short application intervals led to shifts in EGly (cf. Figs 6 and 7), sufficiently long application intervals were chosen to avoid this problem (see Methods). Three examples of glycine-evoked currents recorded from a total of 57 cells are shown in the upper panels of Fig. 4A-C. In early postnatal neurones (P1-4, Fig. 4A), EGly was generally more positive than at the turn of the first to the second postnatal week (P5-8, Fig. 4B) and it became even more negative in older neurones (P9-11, Fig. 4C). A plot of EGly against animal age illustrates the negative shift of EGly during development (Fig. 4D). The negative shift of EGly from −46.8 ± 1.8 mV at P1-4 (n = 28) to −67.6 ± 3.3 mV at P5-8 (n = 10) and to −82.2 ± 4.1 mV at P9-11 (n = 18) was highly significant (ANOVA, P < 0.001, Fig. 4E). A parallel and equally large shift in Vm was not seen. Values for Vm ranged from −58.3 ± 0.8 mV (P1-4, n = 24) to −63.0 ± 2.4 mV (P5-8, n = 9) to −62.7 ± 1.4 mV (P9-11, n = 15); a significant difference was found only between P1-4 and P9-11 (ANOVA and Tukey HSD post hoc test, P < 0.05). These results suggest that the relatively positive values for EGly in young neurones, compared to older neurones, are due to a higher [Cl−]i and that [Cl−]i decreases during development. Furthermore, the shift from an EGly that is more positive than Vm (at P1-4) to an EGly that is more negative than Vm (at P9-11) indicates that [Cl−]i is actively and differentially regulated throughout development (otherwise EGly should be equal to Vm, independent of age).
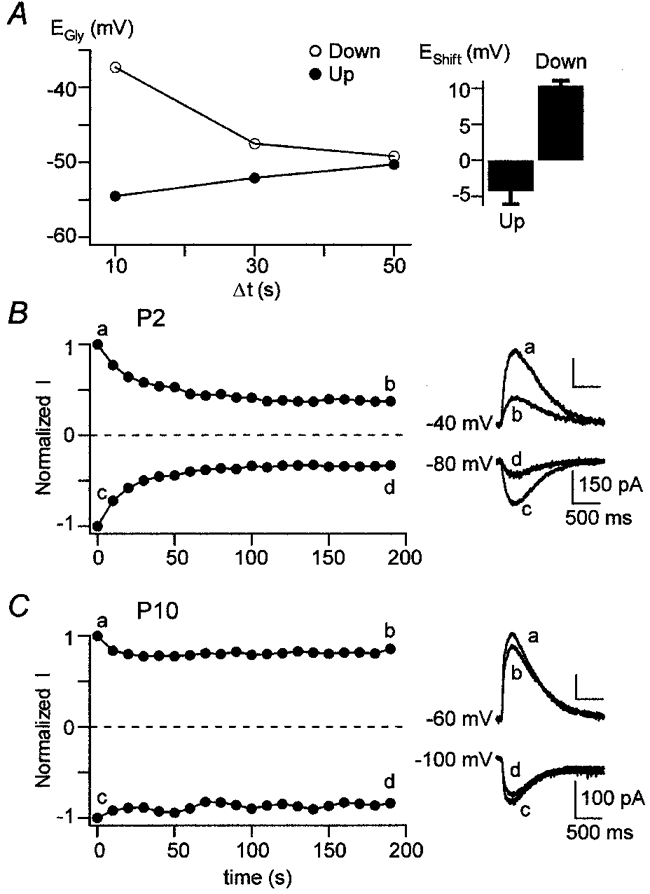
Figure 6. EGly is influenced by voltage protocol and application interval.

Comparison of EGly determined in perforated-patch recordings with ‘up’ and ‘down’ protocols and various Δt values (see Methods for details). A and B, examples of glycine-evoked currents in a P2 and a P8 neurone (upper panels) and the resulting EGly (lower panels) obtained with an ‘up’ protocol (•), followed by a ‘down’ protocol (○), for Δt = 10 s. In the P2 neurone, EDiff =EGly(up) - EGly(down) was 24.2 mV, whereas in the P8 neurone, EDiff amounted to only 4.0 mV. Vs =−90 to −30 mV in A and −90 to −20 mV in B. C, group data show that EDiff was significantly larger in P1-4 than in P8-11 neurones (14.1 ± 1.7 mV, n = 17 vs. 3.8 ± 1.8 mV, n = 12; Student's t test, P < 0.01). D, plot of EDiff as a function of Δt demonstrates that shorter intervals increased whereas longer intervals decreased EDiff in both P1-4 (□) and P8-11 (▪) neurones (n in parentheses). For a given Δt, EDiff was always greater in P1-4 neurones than in P8-11 neurones.
Figure 7. EGly can be shifted in the positive and negative direction by voltage protocols.
A, EGly(up) and EGly(down) deviate from the ‘real’EGly. The left panel shows an example of a P2 neurone where EGly(up) (•) and EGly(down) (○) are plotted for different Δt values (perforated-patch recording). For Δt = 50 s, EGly(up) and EGly(down) were almost identical (−50.3 and −49.2 mV, respectively) and the arithmetic mean was taken to represent ‘real’EGly (−49.8 mV). For shorter Δt values, EGly(up) shifted in the negative direction and EGly(down) in the positive direction when compared to ‘real’EGly. The right panel shows that the average deviation (EShift) for Δt = 10 s amounted to −4.3 ± 1.8 mV for the ‘up’ and +10.3 ± 0.7 mV for the ‘down’ protocol in all 12 P1-4 neurones investigated. B and C, ‘fading’, a reduction of glycine-evoked current amplitudes in response to repetitive glycine application, was prominent at P1-4, but not at P10 (perforated-patch recordings). The right panels show currents evoked by the first and the last of 20 repetitive glycine applications (Δt = 10 s) at a Vs that was either ≈20 mV positive to ‘real’EGly (top traces) or ≈20 mV negative to ‘real’EGly (bottom traces). The left panels depict the time course and magnitude of the reduction of normalized current amplitudes (Normalized I). The P2 neurone shown in B had a ‘real’EGly of −59.0 mV; the glycine-evoked current amplitudes decreased by 62 % at Vs =−40 mV and by 66 % at Vs =−80 mV. The P10 neurone shown in C had a ‘real’EGly of −80.0 mV, the current amplitude decreased by 19 % at Vs =−60 mV and by 14 % at Vs =−100 mV.
In P1-4 neurones, we found quite variable values for EGly, ranging from −21.0 to −68.0 mV (Fig. 4D). To investigate whether this variability was due to regional differences of EGly along the tonotopic axis of the LSO (cf. Kotak et al. 1998), we compared EGly values from P1-4 neurones in the medial (−46.1 ± 4.8 mV, n = 5), central (−45.6 ± 4.7 mV, n = 6) and lateral part (−55.3 ± 5.3 mV, n = 6) and found no significant difference (ANOVA, P = 0.32). However, when comparing two to three neurones in the same slice, EGly was indeed 10-20 mV more negative in the more lateral parts of the LSO in 4 of 6 slices investigated. Nonetheless, with the variability of EGly and the small number of cells investigated in each subregion, we have no conclusive evidence for a regional gradient of EGly in the rat LSO.
Glycine depolarizes the majority of P1-4 neurones and can be excitatory
To examine how the developmental shift in EGly affects the membrane potential of LSO neurones in response to glycine application, we performed voltage recordings in the gramicidin perforated-patch configuration. We especially wanted to see whether glycine can excite early postnatal neurones, i.e. elicit spike activity. Even though the average EGly was well above Vm in P1-4 neurones, some neurones had a very positive EGly, and a few others showed an EGly close to, or even below, −60 mV (Fig. 4D). We found this diversity being reflected in the neurones’ voltage responses: the vast majority of P1-4 neurones (n = 14 of 18) were depolarized by glycine. In some cases (n = 5 of 18), a train of 2–10 spikes was generated within 50-530 ms on top of a μ15-20 mV depolarization (Fig. 5Aa). In other cases (n = 9 of 18), the depolarization was below spike threshold (μ10 mV, Fig. 5Ab). Few of these P1-4 neurones (n = 4 of 18) showed no voltage change or a small hyperpolarization (μ5 mV) following glycine application (Fig. 5Ac). LSO neurones at P5-8 responded with a slight depolarization (μ5 mV, n = 1 of 5, not shown), with no change in membrane potential (n = 2 of 5, Fig. 5B a) or with a hyperpolarization of μ10 mV (n = 2 of 5, Fig. 5B b). In P9-11 neurones, glycine consistently induced a hyperpolarization of μ15 mV (n = 3, Fig. 5C). These results show that glycine-evoked responses in the LSO are transiently depolarizing during early postnatal development, and they may even be excitatory. Hyperpolarizing responses occur mainly in the second postnatal week, as expected from the age-dependent changes in EGly determined in voltage-clamp recordings.
Figure 5. Glycine responses change from depolarizing to hyperpolarizing during development.
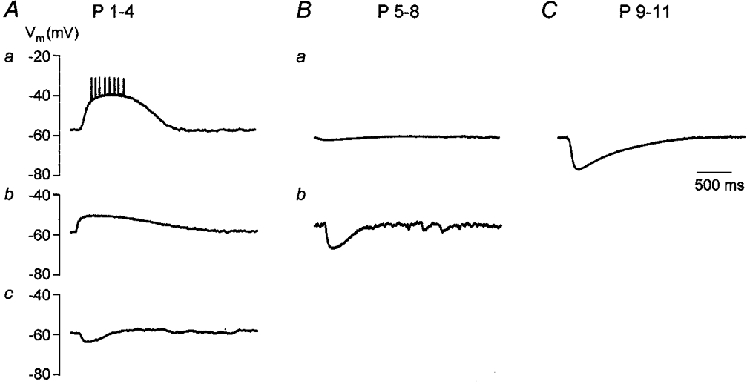
Examples of glycine-evoked membrane potential changes recorded in gramicidin perforated-patch configuration in six LSO neurones of different age. A, P1-4 neurones exhibited diverse glycine responses, but most cells were depolarized. a, in a P3 neurone, a depolarization was evoked, giving rise to a train of 8 spikes within 530 ms (spikes are truncated). b, a P2 neurone was depolarized, but no spikes occurred. c, a P4 neurone was slightly hyperpolarized. B, the majority of P5-8 neurones showed no voltage change or a hyperpolarization. a, a P6 neurone showed almost no response. b, a P8 neurone was clearly hyperpolarized. C, P9-11 neurones were strongly hyperpolarized, as illustrated for a P10 neurone. Same time scale in A-C.
EGly can be shifted in the positive and negative direction depending on voltage protocol and application interval
During development, patterned repetitive synaptic activity has been demonstrated in several neuronal systems (for review see Katz & Shatz, 1996). It is conceivable that repetitive activity of Cl− conductances can lead to short-term alterations of [Cl−]i, and thus to changes in Cl−-mediated responses. Indeed, repetitive activation of GABAARs with brief pulses or single activation with a prolonged pulse results in a ‘fading’ of the activated currents due to a shift in ECl and in GABA reversal potential (EGABA); this shift in EGABA is frequency dependent (Huguenard & Alger, 1986; Akaike et al. 1987). These experiments showed that Cl− regulation mechanisms can be challenged and the neuronal Cl− gradient can be manipulated by GABA-evoked activity. To assess whether the same holds for Cl− fluxes through activated GlyRs in LSO neurones, we varied the voltage protocol and glycine application interval (Δt) and investigated whether shifts in EGly occurred. ‘Up’ and ‘down’ voltage protocols were applied and Δt was varied; an ‘up’ protocol was immediately followed by a ‘down’ protocol. In P1-4 neurones with Δt = 10 s, EGly determined with the ‘down’ protocol (EGly(down)) was considerably more positive than EGly determined with the ‘up’ protocol (EGly(up)). In contrast, this effect was much smaller in P8-11 neurones. Examples of our observations are illustrated for a P2 and a P8 neurone in Fig. 6A and B, respectively. We calculated EDiff =EGly(down) - EGly(up) to use it as a measure for shifts in EGly. Group data showed that EDiff was significantly greater in P1-4 than in P8-11 neurones (14.1 ± 1.7 mV, n = 17 vs. 3.8 ± 1.8 mV, n = 12; Student's t test, P < 0.01; Fig. 6C). What could be the reason for the observed effects? We think that Cl− regulation mechanisms are not effective enough to maintain a constant [Cl−]i when Δt is as short as 10 s. As a consequence, EGly(up) and EGly(down) should deviate from the ‘real’ value for EGly in that EGly(up) is more negative and EGly(down) is more positive than the ‘real’EGly. We assume that EGly(up) is generated by Cl− depletion, i.e. an efflux of Cl− during the voltage steps more negative than ECl, which is sufficient to result in a considerable reduction of [Cl−]i and, consequently, in a negative shift of ECl. Likewise, EGly(down) is generated by Cl− loading, i.e. an influx of Cl− during the voltage steps more positive than ECl which results in an increase in [Cl−]i and, thus, a positive shift of ECl. Finally, the finding that EDiff is larger in P1-4 than in P8-11 neurones may reflect less efficient Cl− regulation mechanisms in the younger group. One way to test these ideas is to vary Δt in the ‘up’ and ‘down’ protocol: an increase in Δt should result in a smaller EDiff, whereas a larger EDiff should be observed when Δt is decreased. We analysed P1-4 and P8-11 neurones and found that EDiff indeed depended on Δt in both groups (Fig. 6D). In the younger group, Δt had to be increased to 50 s to yield a small EDiff of 3.5 ± 1.6 mV (n = 5). However, when Δt was decreased to 5 s, EDiff increased to 20.3 ± 2.3 mV (n = 9). In the older group, EDiff was negligible for Δt = 20 s (1.1 ± 1.2 mV, n = 3) but increased to 13.7 ± 3.2 mV when Δt was decreased to 5 s (n = 7). For a given Δt, EDiff was always larger in the younger than in the older group. These results demonstrate that EGly can be shifted in both a frequency-dependent and an age-dependent manner.
In a next step, we determined how much EGly(up) and EGly(down) deviated from the ‘real’EGly in P1-4 neurones when Δt = 10 s. Values for the deviation will be referred to as EShift in the following. An example for a P2 neurone is shown in the left panel of Fig. 7A. Almost identical values for EGly(up) and EGly(down) were found for Δt = 50 s, and the arithmetic mean was therefore taken as the ‘real’EGly. However, when Δt = 10 s, EGly(up) was more negative and EGly(down) was more positive than the ‘real’EGly, resulting in an EShift of −4.8 and +12.4 mV, respectively. When the analysis included all 12 P1-4 neurones tested, the average EShift was −4.3 ± 1.8 mV for EGly(up) and +10.3 ± 0.7 mV for EGly(down) (Fig. 7A, right panel). The results demonstrate that EGly is shifted in the positive and negative direction in a frequency-dependent manner by glycine-evoked activity.
Further evidence that positive and negative shifts of EGly occur in an age-dependent manner was obtained in another series of experiments: glycine was applied repetitively (20 pulses with Δt = 10 s) at a Vs that was 20 mV more negative than the ‘real’EGly. After a waiting period of about 2 min, another 20 pulses were applied at a Vs that was 20 mV more positive than the ‘real’EGly. In both cases, a reduction of successive amplitudes of glycine-evoked currents (‘fading’) was observed in P1-4 neurones (Fig. 7B), amounting to 58 ± 6 % in inward and 60 ± 6 % in outward currents (n = 6). This demonstrates that EGly was shifted in the positive and negative direction. The ‘fading’ effect was larger for Δt = 5, as it amounted to 79 ± 10 % for inward currents and 83 ± 3 % for outward currents (n = 3, not shown), demonstrating frequency dependence. In two P10 neurones, in which Δt was 10 s, the ‘fading’ of glycine-evoked inward and outward currents amounted to 10 ± 4 % and 26 ± 6 %, respectively (Fig. 7C). Thus, the ‘fading’ effect was much smaller in P10 than in P1-4 neurones, again indicating age dependence.
Furosemide shifts EGly in the negative direction in young neurones yet in the positive direction in older neurones
Aside from the above experiments, we used a second approach to challenge Cl− regulation mechanisms. We pharmacologically blocked Cl− transporter molecules to assess their contribution in the homeostasis of [Cl−]i and in shaping glycine responses in LSO neurones. The loop diuretic furosemide is a blocker of most known members of the cation-chloride cotransporter superfamily, including the electroneutral Na+-K+-2Cl− and K+-Cl− cotransporters (for review see Haas & Forbush, 1998). Furosemide has been shown to perturb Cl− outward transport mechanisms in mature neurones (Misgeld et al. 1986; Thompson et al. 1988; Zhang et al. 1991) and to block Cl− inward transport mechanisms in immature neurones (Owens et al. 1996). In perforated-patch recordings, we first determined the ‘real’EGly under control conditions (subsequently called control EGly) by adjusting Δt to avoid shifts in EGly due to Cl− loading or depletion (see above). Subsequently, 1 mm furosemide was applied to the bath solution and changes in EGly were monitored; only neurones with reversible furosemide effects were included in the analysis. Furosemide caused a shift of the control EGly towards more negative values in P2-4 neurones. This is illustrated for a P4 neurone in Fig. 8A, where the shift occurring within 35 min amounted to −19.5 mV (from −48.5 to −68.0 mV). In contrast, a shift of the control EGly towards more positive values was observed in P8-10 neurones, as illustrated in Fig. 8B for a P10 neurone, where the shift occurring within 15 min amounted to +24.1 mV (from −88.6 to −64.5 mV). Data from 10 neurones are summarized in Fig. 8C, where the control EGly (filled circles) and the EGly under furosemide (open circles) are plotted and the corresponding values are connected by an arrow that indicates the direction and magnitude of the shift for each neurone. In P2-4 neurones, the control EGly was more positive than −60 mV and always shifted in the negative direction towards Vh =−70 mV (n = 5). In contrast, in P8-10 neurones, the initial EGly was more negative than −60 mV and always shifted in the positive direction towards, or even positive to, Vh =−70 mV (n = 5). In addition to shifting EGly, a second and independent effect of furosemide was to block the GlyR conductance directly (cf. Kumamoto & Murata, 1997). This can be seen as a reversible reduction of the slope of the I-V relation in young and older neurones (Fig. 8A and B, lower panels). We quantified this effect by comparing the slopes of the I-V relations before and during furosemide application and found a decrease of the GlyR conductance to 50 ± 6 and 66 ± 7 % of control values in P2-4 and P8-10 neurones, respectively (n = 5 in each group). The block of GlyRs was not significantly different in the younger and the older group (t test, P = 0.10). In summary, the observed, furosemide-induced shifts in EGly suggest the presence of net inward Cl− transport mechanisms in young LSO neurones (P2-4), yet of net outward Cl− transport mechanisms in older neurones (P8-10). This allows these neurones to generate a high [Cl−]i or a low [Cl−]i as a prerequisite for the depolarizing and hyperpolarizing action of glycine, respectively.
Figure 8. Furosemide causes a shift of EGly in the negative direction in young neurones, yet in the positive direction in older neurones.

Bath application of 1 mm furosemide caused shifts in EGly in perforated-patch recordings. A, example of glycine-evoked currents in a P4 neurone before (Control) and during application of furosemide for 35 min (Furosemide). EGly shifted from −48.5 mV (•) to −68.0 mV (○; lower panel). B, example of glycine-evoked currents in a P10 neurone before (Control) and during application of furosemide for 15 min (Furosemide). EGly shifted from −88.6 mV (•) to −64.5 mV (○; lower panel). The slope of the I-V relation was reduced in both the P4 and the P10 neurone to 44 and 58 % of control, respectively (lower panels in A and B). Vs =−70 to −20 mV in A, and −90 to −40 mV in B. C, summary of furosemide effects: the control EGly (•) is compared to EGly after furosemide (○) and the corresponding values are connected by an arrow that illustrates the direction and magnitude of the furosemide-induced shift. In P2-4 neurones, the control EGly was between −46.4 and −59.7 mV and furosemide always induced a shift in the negative direction (average: −15.9 ± 3.2 mV, n = 5), indicative of the blockade of a net inward Cl− transport mechanism. In P8-10 neurones, the control EGly was between −64.4 and −88.6 mV and furosemide always induced a shift in the positive direction (average: +28.4 ± 4.8 mV, n = 5), indicative of the blockade of a net outward Cl− transport mechanism. The dotted line marks Vh =−70 mV.
DISCUSSION
Three major results emerge from this study. First, by studying glycine-evoked responses during the development of the rat LSO, we found that glycine is generally depolarizing and may be excitatory during the first week, yet it is hyperpolarizing thereafter. Second, concentrating on the cellular mechanisms underlying the changes of glycine action, we found that, independent of age, glycine-evoked responses are mainly carried by Cl− (>80 %). This means that glycinergic depolarizations in immature neurones are most likely to be mediated by Cl− efflux while hyperpolarizations in older neurones are mediated by Cl− influx. Finally, we present evidence that an age-dependent and furosemide-sensitive active regulation of [Cl−]i underlies the changes in glycine action. The shift from depolarizing to hyperpolarizing action and its time course are consistent with our previous results obtained with sharp electrode recordings (Kandler & Friauf, 1995b), yet here we present the first evidence for the ionic basis and for active cellular regulation mechanisms.
Ionic basis of glycine-evoked responses in the LSO
In whole-cell recordings, the EGly of somatic glycine-evoked currents corresponded well to the ECl set by the experimental conditions. Although the values for EGly in both young and older neurones (P2-7 vs. P8-11) deviated slightly from those predicted by the Nernst equation, the slope of the linear regression was almost identical to that of the Nernst relation in both groups. This would not be the case if there were a prominent permeability of the GlyRs to other ions, e.g. anions such as HCO3−, or cations such as Na+. The deviation of a mixed ion reversal potential from the ECl is always larger for low [Cl−]i. For example, when [Cl−]i is 12 mm and the HCO3− permeability is 33 % of the Cl− permeability, the mixed ion reversal potential is μ9 mV more positive than ECl (Fig. 2C). Because this deviation becomes smaller for lower HCO3− permeabilities (e.g. 11 %, Bormann et al. 1987), we cannot exclude the possibility that a HCO3− flux occurs through GlyRs under our experimental conditions. However, especially for young neurones with high [Cl−]i, it is extremely unlikely that other ions than Cl− contributed significantly to monophasic currents through GlyRs and EGly. This implies that the glycine-evoked depolarizations were mediated by an efflux of Cl−. In fact, our whole-cell recordings showed that depolarizations consistently occurred when ECl > Vm. Our results are in line with other studies demonstrating that Cl− efflux is primarily responsible for GABAAR-mediated depolarizations in immature neurones (Rohrbough & Spitzer, 1996; Owens et al. 1996).
Interestingly, a considerable contribution of HCO3− ions to both GABA- and glycine-evoked responses has been reported in several studies (Staley et al. 1995; Perkins & Wong, 1996; Backus et al. 1998). However, in contrast to the above-mentioned monophasic and Cl−-mediated GABA and glycine responses, the responses were biphasic with an early hyperpolarizing and a late and long-lasting depolarizing component. Moreover, they were evoked by high-frequency stimulation or long applications of agonists and were thought to be mediated by the collapse of the opposing concentration gradients of Cl− and HCO3− (Staley et al. 1995; Backus et al. 1998). Occasionally, we also found glycine responses with two phases, but we did not investigate their ionic basis, which would have required additional ion substitution experiments. Thus, it remains unclear whether and how HCO3− participated in the generation of these responses. Nevertheless, it is probable that the first phase was predominantly mediated by Cl−, because its EGly equalled that seen in the monophasic responses. Although biphasic glycine responses in LSO neurones have been described by Backus et al. (1998) and in the present study, we think that these responses differ from each other in the following aspects: (1) long bath applications vs. short focal applications were used, (2) responses lasted for minutes vs. seconds, and (3) during the second phase of the response, EGly was more positive vs. more negative than Vm. Taken together, we conclude that the monophasic responses, following short glycine applications, represent the predominant response type in LSO neurones and are generated predominantly by Cl− flux while prolonged glycine applications may result in biphasic responses to which both Cl− and HCO3− contribute.
Age-dependent changes in glycine responses and EGly
We observed an age-dependent change from depolarizing to hyperpolarizing glycine action between P5 and P8, which was accompanied by a corresponding negative shift in EGly. The data were obtained with gramicidin perforated-patch recordings and correspond well to our previous finding with sharp electrode recordings that a change in the polarity of the glycinergic transmission from MNTB to LSO occurs around the end of the first postnatal week (Kandler & Friauf, 1995b). In addition, we observed a variability of EGly and a diversity of glycine-evoked membrane potential changes among P1-4 neurones that was not clearly attributable to a medial to lateral gradient of EGly in the LSO. Since the rat LSO is not composed of a uniform population of neurones (Rietzel & Friauf, 1998), we rather think that some neurone types express more mature properties than others, e.g. regarding their complement of ion channels or ion transporter molecules. While in the neonatal gerbil LSO, sharp electrode recordings demonstrated hyperpolarizing PSPs already at P0 (Sanes, 1993), whole-cell patch-clamp recordings revealed that glycinergic PSCs reverse at Vm in the lateral part, yet positive to Vm in the medial part (Kotak et al. 1998). It is not clear why regional differences were seen in these whole-cell recordings which, most probably, disturb the native [Cl−]i through a dialysis of the cellular content and bias the ECl. Together, the above results indicate that there may be species-specific regional and temporal differences in LSO development.
The depolarizing action of glycine in immature neurones appears to be a general principle, because it has also been demonstrated in other regions of the CNS. It has been observed in the spinal cord (Wu et al. 1992), the brainstem (Kandler & Friauf, 1995b; Backus et al. 1998; Singer et al. 1998), the hippocampus (Ito & Cherubini, 1991) and the cerebral cortex (Flint et al. 1998). Furthermore, a change from depolarizing to hyperpolarizing action of glycine and GABA appears to be a general principle as well. In rats, this change happens earlier in caudal than in more rostral parts of the CNS: around P0 in the spinal cord (Wu et al. 1992), after P3 in the brainstem (Singer et al. 1998), and from P7 to the middle of the second postnatal week in the cerebellum (Brickley et al. 1996), the hippocampus (Ben-Ari et al. 1989), and the cerebral cortex (Owens et al. 1996). The change in the LSO between P5 and P8 fits well into this general scheme (Kandler & Friauf, 1995b; present study).
Active regulation of [Cl−]i as a mechanism for changes in glycine action
Our data suggest that the prerequisite for depolarizing and hyperpolarizing glycine responses is the generation of an EGly > Vm and an EGly < Vm, respectively, caused by the differential activity of Cl− transporter molecules. Based on the Nernst equation and the mean values for EGly (−46.8 mV at P1-4; −82.2 mV at P8-11), we calculate that [Cl−]i in LSO neurones is reduced from μ22 to μ5 mm during this period. If the Cl− distribution were not actively regulated, EGly would equal Vm, and [Cl−]i would hence amount to μ13 mm.
In order to interfere with the active Cl− transport mechanisms, we used furosemide as a pharmacological blocker, even though this has two problems. First, furosemide non-competitively blocks GABAARs and GlyRs (Kumamoto & Murata, 1997). Our approach, however, to compare the I-V relations before, during and after washout of furosemide allowed us to discriminate between a block of GlyRs, seen as a decrease in the slope of the I-V relation, and the shift in EGly, seen as a slow and gradual shift of the I-V relation along the X-axis. The mean furosemide-induced block of GlyRs (50 % at P2-4, 44 % at P8-10) in our study is consistent with an IC50 for furosemide of about 1 mm reported by Kumamoto & Murata (1997) in cultured septal neurones. The second problem associated with furosemide is that it inhibits most members of the cation- Cl− cotransporter superfamily and more specific blockers are not available at present (Haas & Forbush, 1998). Therefore, furosemide cannot be used to distinguish between specific transporter molecules, but it may be applied to determine the net direction of Cl− transport in a given neurone. In neonatal LSO neurones (P2-4), the furosemide-induced shift of EGly in the negative direction towards Vh most probably results from a block of a net inward Cl− transport, leading to a passive distribution of Cl−. In contrast, in older neurones (P8-10) the shift of EGly in the positive direction towards or above Vh most probably results from the block of a net outward Cl− transport. These data are consistent with previous reports on furosemide-induced shifts of EGly and EGABA in immature and mature neurones (Misgeld et al. 1986; Thompson et al. 1988; Owens et al. 1996; Kakazu et al. 1998). Furthermore, our finding that EGly shifted to values more positive than Vh indicates the presence of inward Cl− transport mechanisms which were not completely blocked by furosemide.
Recently, it was shown that the expression of two members of the cation-Cl− cotransporter superfamily is developmentally regulated in the nervous system. One of them, the Na+-K+-2Cl− cotransporter BSC2, mediates inward Cl− transport and is strongly expressed during the first postnatal week in neurones of the hippocampus, cerebral cortex, cerebellum and brainstem, while it diminishes from P14 to adulthood (Plotkin et al. 1997). The second member, the neurone-specific K+-Cl− cotransporter KCC2, is thought to serve as the major Cl− extrusion mechanism in the adult CNS (Payne et al. 1996); its expression is upregulated during postnatal development of the hippocampus (Rivera et al. 1999). Conclusive evidence for a role of KCC2 in participating in the age-dependent change from depolarizing to hyperpolarizing GABA action in the hippocampus was obtained by blocking KCC2 expression with antisense mRNA (Rivera et al. 1999). When these experiments were performed at a time when GABA responses were already hyperpolarizing, responses became slightly depolarizing in 25 % of the treated neurones, indicating that Cl− did not become passively distributed. We assume that this finding and our observation of a furosemide-induced shift of EGly to values more positive than Vh are similar phenomena, suggesting that various inward and outward Cl− transporters are present in a given neurone and that their relative activity determines the net Cl− transport. It will be interesting to see whether BSC2 and KCC2 show a complementary temporal expression pattern in the LSO which would make them good candidates for participating in the Cl− regulation that underlies the change in glycine responses.
Glycine-induced activity-dependent shifts in ECl
Not only the up- and downregulation of functional Cl− transporter molecules results in changes of EGly, but short-term shifts in EGly can also be induced in an activity-dependent manner. When we applied glycine repetitively at sufficiently short time intervals, EGly was shifted in the positive and negative directions (depending on whether inward or outward Cl− currents were activated, cf. Figs 6 and 7). These shifts were probably due to Cl− loading or Cl− depletion of neurones. Our observations are consistent with, and extend, our previous finding of shifts in EGly due to intracellular Cl− accumulation during prolonged GlyR activation in combination with depolarizing steps (Backus et al. 1998). Similar shifts in ECl and EGABA have been seen in adult neurones following brief repetitive, or a single prolonged, activation of GABAARs (Huguenard & Alger, 1986; Akaike et al. 1987). Thus, a strong activation of Cl− flux through GABAARs and GlyRs can lead to considerable changes of [Cl−]i that cannot be counteracted immediately by Cl− transporters, resulting in short-term shifts in ECl (and consequently EGABA and EGly). It is unclear whether short-term shifts in ECl occur in LSO neurones under natural stimulation conditions. However, spontaneous spike activity has been described in the vertebrate auditory system prior to the onset of hearing (for review see Friauf & Lohmann, 1999). Although being of relatively low frequency (1 Hz), it is sustained and occurs in rhythmic bursts and may therefore be sufficient to induce shifts in ECl.
Other studies have linked short-term changes in a neurone's ECl to the activation of voltage-dependent, inwardly rectifying Cl− currents (Staley, 1994; Staley et al. 1996). These currents are mediated by ClC-2 channels and activated at membrane potentials negative to ECl. Their activity causes shifts of ECl towards the given Vh, or shifts of Vm towards a more positive ECl when the neurone is loaded with high [Cl−] via the patch pipette. For several reasons, we think that a significant contribution of ClC-2 channels to the short-term shifts in EGly can be ruled out in LSO neurones. First, in whole-cell recordings with a high [Cl−]p, we did not see any changes of Vm in the positive direction. Second, in perforated-patch recordings from young neurones, where EGly > Vm, we did not see spontaneous changes of EGly in the negative direction. Third, we observed shifts in EGly in the positive and negative directions and not exclusively in the negative direction when Vh < EGly. Finally, under normal conditions, i.e. with undisturbed intracellular milieu, ClC-2 activity is downregulated (Staley, 1994). Therefore, we may not have seen ClC-2 channel activity in our perforated-patch recordings.
In the LSO, short-term shifts in EGly were larger in neonatal (P1-4) than in older animals, and considerable shifts were seen at a stimulation frequency as low as 0.1 Hz in the neonatal group (based on the Nernst equation, shifts in EGly from −50 mV to −40 or to −55 mV correspond to changes in [Cl−]i from μ19 mm to μ28 and to μ16 mm, respectively). The age dependency of the shifts can be explained by compromised Cl− transport mechanisms and/or the small volume of the younger neurones, both of which providing favourable conditions for larger changes in [Cl−]i. The resulting changes in the amplitude of glycine-evoked responses may be viewed as a short-term, activity-dependent modulation of glycinergic transmission. Taken together, our data suggest that Cl− transporter molecules participate in the homeostasis of [Cl−]i in the LSO, but Cl− regulation can be put out of action by strong activation of GlyRs, particularly in immature neurones.
Possible physiological relevance of glycinergic depolarization
The fact that glycine depolarizes neonatal LSO neurones and can induce spikes is consistent with the action of GABA and glycine on immature neurones described in other CNS regions. The depolarizing action of GABA and glycine can activate VGCCs, resulting in increases of [Ca2+]i (Reichling et al. 1994; Leinekugel et al. 1995; Obrietan & van den Pol, 1995; Lo Turco et al. 1995; Flint et al. 1998). Such increases may be involved in mediating the trophic effects of GABA on neuronal precursors and immature neurones and play a role in synapse maturation and plasticity (for reviews see Cherubini et al. 1991; Ben-Ari et al. 1997). For example, activity-dependent plasticity at GABAergic synapses in neonatal hippocampus was observed only if GABAergic PSPs were depolarizing (McLean et al. 1996). In light of the above observations, it is possible that glycinergic depolarization may play a similar role in mediating trophic and plastic events during LSO development. VGCCs are present in neonatal rat LSO neurones (Schmanns & Friauf, 1994), and glycine application can cause rises in [Ca2+]i in neonatal gerbil and rat LSO neurones (Brückner et al. 1998; Kullmann & Kandler, 1999). That calcium plays a critical role in the neonatal LSO was shown in organotypic cultures, where KCl-induced Ca2+ influx via L-type Ca2+ channels is necessary for the survival of LSO neurones and the maintenance of the MNTB-LSO projection (Lohmann et al. 1998). In vivo, the activation of VGCCs may be achieved by spontaneous activity originating in the cochlea before hearing onset. Spontaneous activity of cochlear origin has been identified in embryonic chickens (Lippe, 1994), but at present, it is unknown whether it occurs in the LSO of neonatal rats and how glycinergic and glutamatergic inputs may contribute to this activity.
In summary, glycinergic depolarizations in neonatal LSO neurones may provide a basis for activity-dependent plasticity, such as synaptic gain changes and remodelling of synaptic connections. The fact that neonatal neurones are more sensitive to shifts in EGly may render glycinergic inputs more susceptible to short-term modifications than later on when Cl− regulation is more efficient to maintain a relatively constant [Cl−]i.
Note added in proof
After the submission of this paper, Y. Kakazu, N. Akaike, S. Komiyama & J. Nabekura have published a related study in which Cl− regulation mechanisms were addressed in acutely isolated, dissociated LSO neurones (Journal of Neuroscience19, 2843-2851 (1999)). The results of both studies are very similar in that they indicate that developmental changes of Cl− transporters alter the [Cl−]i and are responsible for the shift from depolarizing to hyperpolarizing glycine action.
Acknowledgments
Many thanks to Harald Vitten and Dr Karl Kandler for valuable comments on the manuscript. This work was supported by grants from the Deutsche Forschungsgemeinschaft (SFB 269, B5, to E.F.), the Weill-Stiftung, Frankfurt (to I.E.), and the Graduiertenkolleg ‘Neuronal Plasticity’, University of Frankfurt (to I.E.).
References
- Abe Y, Furukawa K, Itoyama Y, Akaike N. Glycine response in acutely dissociated ventromedial hypothalamic neuron of the rat: New approach with gramicidin perforated patch-clamp technique. Journal of Neurophysiology. 1994;72:1530–1537. doi: 10.1152/jn.1994.72.4.1530. [DOI] [PubMed] [Google Scholar]
- Akaike N, Inomata N, Tokutomi N. Contribution of chloride shifts to the fade of GABA-gated currents in frog dorsal root ganglion cells. The Journal of Physiology. 1987;391:219–234. doi: 10.1113/jphysiol.1987.sp016735. [DOI] [PMC free article] [PubMed] [Google Scholar]
- Andersen P, Dingledine R, Gierstad L, Langmoen IA, Laursen AM. Two different responses of hippocampal pyramidal cells to application of gamma-amino butyric acid. The Journal of Physiology. 1980;305:279–296. doi: 10.1113/jphysiol.1980.sp013363. [DOI] [PMC free article] [PubMed] [Google Scholar]
- Backus KH, Deitmer JW, Friauf E. Glycine-activated currents are changed by coincident membrane depolarization in developing rat auditory brainstem neurones. The Journal of Physiology. 1998;507:783–794. doi: 10.1111/j.1469-7793.1998.783bs.x. [DOI] [PMC free article] [PubMed] [Google Scholar]
- Ben-Ari Y, Cherubini E, Corradetti R, Galarsa J-L. Giant synaptic potentials in immature rat CA3 hippocampal neurones. The Journal of Physiology. 1989;416:303–325. doi: 10.1113/jphysiol.1989.sp017762. [DOI] [PMC free article] [PubMed] [Google Scholar]
- Ben-Ari Y, Khazipov R, Leinekugel X, Caillard O, Gaiarsa JL. GABA A, NMDA and AMPA receptors: a developmentally regulated ‘ménage à trois’. Trends in Neurosciences. 1997;20:532–529. doi: 10.1016/s0166-2236(97)01147-8. [DOI] [PubMed] [Google Scholar]
- Bormann J, Hamill OP, Sakmann B. Mechanism of anion permeation through channels gated by glycine and gamma-aminobutyric acid in mouse cultured spinal neurones. The Journal of Physiology. 1987;385:243–286. doi: 10.1113/jphysiol.1987.sp016493. [DOI] [PMC free article] [PubMed] [Google Scholar]
- Brickley SG, Cull-Candy SG, Farrant M. Development of a tonic form of synaptic inhibition in rat cerebellar granule cells resulting from persistent activation of GABAA receptors. The Journal of Physiology. 1996;497:753–759. doi: 10.1113/jphysiol.1996.sp021806. [DOI] [PMC free article] [PubMed] [Google Scholar]
- Brückner S, Michel S, Rübsamen R. Effect of amino acid transmitters on the intracellular calcium concentration of SOC neurons during early postnatal development. Association for Research in Otolaryngology Abstracts. 1998;21:32. abstract. [Google Scholar]
- Chen G, Trombley PQ, van den Pol AN. Excitatory actions of GABA in developing rat hypothalamic neurones. The Journal of Physiology. 1996;494:451–464. doi: 10.1113/jphysiol.1996.sp021505. [DOI] [PMC free article] [PubMed] [Google Scholar]
- Cherubini E, Gaiarsa JL, Ben-Ari Y. GABA: an excitatory transmitter in early postnatal life. Trends in Neurosciences. 1991;14:515–519. doi: 10.1016/0166-2236(91)90003-d. [DOI] [PubMed] [Google Scholar]
- Cherubini E, Rovira C, Gaiarsa JL, Corradetti R, Ben-Ari Y. GABA mediated excitation in immature rat CA3 hippocampal neurons. International Journal of Developmental Neuroscience. 1990;8:481–490. doi: 10.1016/0736-5748(90)90080-l. [DOI] [PubMed] [Google Scholar]
- Ehrlich I, Löhrke S, Friauf E. Ontogenetic shift from depolarizing to hyperpolarizing glycine responses in rat auditory neurons is probably due to differential Cl− regulation. European Journal of Neuroscience. 1998;10(suppl.):278. abstract. [Google Scholar]
- Flint AC, Liu XL, Kriegstein AR. Nonsynaptic glycine receptor activation during early neocortical development. Neuron. 1998;20:43–53. doi: 10.1016/s0896-6273(00)80433-x. [DOI] [PubMed] [Google Scholar]
- Friauf E, Lohmann C. Development of auditory brainstem circuitry. Activity-dependent and activity-independent processes. Cell and Tissue Research. 1999 doi: 10.1007/s004410051346. in the Press. [DOI] [PubMed] [Google Scholar]
- Haas M, Forbush B. The Na-K-Cl cotransporters. Journal of Bioenergetics and Biomembranes. 1998;30:161–172. doi: 10.1023/a:1020521308985. [DOI] [PubMed] [Google Scholar]
- Helfert RH, Snead CR, Altschuler RA. The ascending auditory pathways. In: Altschuler RA, Bobbin RP, Clopton BM, Hoffman DW, editors. Neurobiology of Hearing: The Central Auditory System. New York: Raven Press; 1991. pp. 1–25. [Google Scholar]
- Huguenard JR, Alger BE. Whole-cell voltage-clamp study of the fading of GABA-activated currents in acutely dissociated hippocampal neurons. Journal of Neurophysiology. 1986;56:1–18. doi: 10.1152/jn.1986.56.1.1. [DOI] [PubMed] [Google Scholar]
- Ito S, Cherubini E. Strychnine-sensitive glycine responses of neonatal rat hippocampal neurones. The Journal of Physiology. 1991;440:67–83. doi: 10.1113/jphysiol.1991.sp018696. [DOI] [PMC free article] [PubMed] [Google Scholar]
- Kakazu Y, Nabekura J, Akaike N. Regulation of intracellular Cl− by different cation chloride cotransporters in developing lateral superior olive neurons. Society for Neuroscience Abstracts. 1998;24:1635. doi: 10.1523/JNEUROSCI.19-08-02843.1999. abstract. [DOI] [PMC free article] [PubMed] [Google Scholar]
- Kandler K, Friauf E. Pre- and postnatal development of efferent connections of the cochlear nucleus in the rat. Journal of Comparative Neurology. 1993;328:161–184. doi: 10.1002/cne.903280202. [DOI] [PubMed] [Google Scholar]
- Kandler K, Friauf E. Development of electrical membrane properties and discharge characteristics of superior olivary complex neurons in fetal and postnatal rats. European Journal of Neuroscience. 1995a;7:1773–1790. doi: 10.1111/j.1460-9568.1995.tb00697.x. [DOI] [PubMed] [Google Scholar]
- Kandler K, Friauf E. Development of glycinergic and glutamatergic synaptic transmission in the auditory brainstem of perinatal rats. Journal of Neuroscience. 1995b;15:6890–6904. doi: 10.1523/JNEUROSCI.15-10-06890.1995. [DOI] [PMC free article] [PubMed] [Google Scholar]
- Katz LC, Shatz CJ. Synaptic activity and the construction of cortical circuits. Science. 1996;274:1133–1138. doi: 10.1126/science.274.5290.1133. [DOI] [PubMed] [Google Scholar]
- Kotak VC, Korada S, Schwartz IR, Sanes DH. A developmental shift from GABAergic to glycinergic transmission in the central auditory system. Journal of Neuroscience. 1998;18:4646–4655. doi: 10.1523/JNEUROSCI.18-12-04646.1998. [DOI] [PMC free article] [PubMed] [Google Scholar]
- Kullmann PHM, Kandler K. Inhibitory synapses increase intracellular calcium in developing rat auditory neurons. Proceedings of the 1st Göttingen Conference of the German Neuroscience Society. 1999;2:p810. abstract. [Google Scholar]
- Kumamoto E, Murata Y. Action of furosemide on GABA and glycine currents in rat septal cholinergic neurons in culture. Brain Research. 1997;776:246–249. doi: 10.1016/s0006-8993(97)01083-4. [DOI] [PubMed] [Google Scholar]
- Kyrozis A, Reichling DB. Perforated-patch recording with gramicidin avoids artifactual changes in intracellular chloride concentration. Journal of Neuroscience Methods. 1995;57:27–35. doi: 10.1016/0165-0270(94)00116-x. [DOI] [PubMed] [Google Scholar]
- Leinekugel X, Tseeb V, Ben-Ari Y, Bregestovski P. Synaptic GABAA activation induces Ca2+ rise in pyramidal cells and interneurons from rat neonatal hippocampal slices. The Journal of Physiology. 1995;487:319–329. doi: 10.1113/jphysiol.1995.sp020882. [DOI] [PMC free article] [PubMed] [Google Scholar]
- Lippe WR. Rhythmic spontaneous activity in the developing avian auditory system. Journal of Neuroscience. 1994;14:1486–1495. doi: 10.1523/JNEUROSCI.14-03-01486.1994. [DOI] [PMC free article] [PubMed] [Google Scholar]
- Lohmann C, Ilic V, Friauf E. Development of a topographically organized auditory network in slice culture is calcium-dependent. Journal of Neurobiology. 1998;34:97–112. doi: 10.1002/(sici)1097-4695(19980205)34:2<97::aid-neu1>3.0.co;2-6. [DOI] [PubMed] [Google Scholar]
- Lo Turco JJ, Owens DF, Heath MJS, Davis MBE, Kriegstein AR. GABA and glutamate depolarize cortical progenitor cells and inhibit DNA synthesis. Neuron. 1995;15:1287–1298. doi: 10.1016/0896-6273(95)90008-x. [DOI] [PubMed] [Google Scholar]
- Luhmann HJ, Prince DA. Postnatal maturation of the GABAergic system in rat neocortex. Journal of Neurophysiology. 1991;65:247–263. doi: 10.1152/jn.1991.65.2.247. [DOI] [PubMed] [Google Scholar]
- McLean HA, Caillard O, Ben-Ari Y, Gaiarsa JL. Bidirectional plasticity expressed by GABAergic synapses in the neonatal rat hippocampus. The Journal of Physiology. 1996;496:471–477. doi: 10.1113/jphysiol.1996.sp021699. [DOI] [PMC free article] [PubMed] [Google Scholar]
- Misgeld U, Deisz RA, Dodt HU, Lux HD. The role of chloride transport in postsynaptic inhibition of hippocampal neurons. Science. 1986;232:1413–1415. doi: 10.1126/science.2424084. [DOI] [PubMed] [Google Scholar]
- Obrietan K, van den Pol AN. GABA neurotransmission in the hypothalamus: developmental reversal from Ca2+ elevating to depressing. Journal of Neuroscience. 1995;15:5065–5077. doi: 10.1523/JNEUROSCI.15-07-05065.1995. [DOI] [PMC free article] [PubMed] [Google Scholar]
- Owens DF, Boyce LH, Davis MBE, Kriegstein AR. Excitatory GABA responses in embryonic and neonatal cortical slices demonstrated by gramicidin perforated-patch recordings and calcium imaging. Journal of Neuroscience. 1996;16:6414–6423. doi: 10.1523/JNEUROSCI.16-20-06414.1996. [DOI] [PMC free article] [PubMed] [Google Scholar]
- Payne JA, Stevenson TJ, Donaldson LF. Molecular characterization of a putative K-Cl cotransporter in rat brain. A neuronal-specific isoform. Journal of Biological Chemistry. 1996;271:16245–16252. doi: 10.1074/jbc.271.27.16245. [DOI] [PubMed] [Google Scholar]
- Perkins KL, Wong RKS. Ionic basis of the postsynaptic depolarizing GABA response in hippocampal pyramidal cells. Journal of Neurophysiology. 1996;76:3886–3894. doi: 10.1152/jn.1996.76.6.3886. [DOI] [PubMed] [Google Scholar]
- Plotkin MD, Snyder EY, Hebert SC, Delpire E. Expression of the Na-K-2Cl cotransporter is developmentally regulated in postnatal rat brains: A possible mechanism underlying GABA's excitatory role in immature brain. Journal of Neurobiology. 1997;33:781–795. doi: 10.1002/(sici)1097-4695(19971120)33:6<781::aid-neu6>3.0.co;2-5. [DOI] [PubMed] [Google Scholar]
- Reichling DB, Kyrozis A, Wang J, MacDermott AB. Mechanisms of GABA and glycine depolarization-induced calcium transients in rat dorsal horn neurons. The Journal of Physiology. 1994;476:411–421. doi: 10.1113/jphysiol.1994.sp020142. [DOI] [PMC free article] [PubMed] [Google Scholar]
- Rietzel H-J, Friauf E. Neuron types in the rat lateral superior olive and developmental changes in the complexity of their dendritic arbors. Journal of Comparative Neurology. 1998;390:20–40. [PubMed] [Google Scholar]
- Rivera C, Voipio J, Payne JA, Ruusuvuori E, Lahtinen H, Lamsa K, Pirvola U, Saarma M, Kaila K. The K+/Cl− cotransporter KCC2 renders GABA hyperpolarizing during neuronal maturation. Nature. 1999;397:251–255. doi: 10.1038/16697. [DOI] [PubMed] [Google Scholar]
- Rohrbough J, Spitzer NC. Regulation of intracellular Cl− levels by Na+-dependent Cl− cotransport distinguishes depolarizing from hyperpolarizing GABAA receptor-mediated responses in spinal neurons. Journal of Neuroscience. 1996;16:82–91. doi: 10.1523/JNEUROSCI.16-01-00082.1996. [DOI] [PMC free article] [PubMed] [Google Scholar]
- Sanes DH. The development of synaptic function and integration in the central auditory system. Journal of Neuroscience. 1993;13:2627–2637. doi: 10.1523/JNEUROSCI.13-06-02627.1993. [DOI] [PMC free article] [PubMed] [Google Scholar]
- Sanes DH, Chokshi P. Glycinergic transmission influences the development of dendrite shape. NeuroReport. 1992;3:323–326. doi: 10.1097/00001756-199204000-00008. [DOI] [PubMed] [Google Scholar]
- Sanes DH, Markowitz S, Bernstein J, Wardlow J. The influence of inhibitory afferents on the development of postsynaptic dendritic arbors. Journal of Comparative Neurology. 1992;321:637–644. doi: 10.1002/cne.903210410. [DOI] [PubMed] [Google Scholar]
- Sanes DH, Siverls V. Development and specificity of inhibitory terminal arborizations in the central nervous system. Journal of Neurobiology. 1991;8:837–854. doi: 10.1002/neu.480220805. [DOI] [PubMed] [Google Scholar]
- Sanes DH, Takacs C. Activity-dependent refinement of inhibitory connections. European Journal of Neuroscience. 1993;5:570–574. doi: 10.1111/j.1460-9568.1993.tb00522.x. [DOI] [PubMed] [Google Scholar]
- Schmanns H, Friauf E. K+- and transmitter-induced rises in [Ca2+]i in auditory neurones of developing rats. NeuroReport. 1994;5:2321–2324. doi: 10.1097/00001756-199411000-00028. [DOI] [PubMed] [Google Scholar]
- Singer JH, Talley EM, Bayliss DA, Berger AJ. Development of glycinergic synaptic transmission to rat brain stem motoneurons. Journal of Neurophysiology. 1998;80:2608–2620. doi: 10.1152/jn.1998.80.5.2608. [DOI] [PubMed] [Google Scholar]
- Staley KJ. The role of an inwardly rectifying chloride conductance in postsynaptic inhibition. Journal of Neurophysiology. 1994;72:273–284. doi: 10.1152/jn.1994.72.1.273. [DOI] [PubMed] [Google Scholar]
- Staley KJ, Smith R, Schaack J, Wilcox C, Jentsch TJ. Alteration of GABAA receptor function following gene transfer of the ClC-2 chloride channel. Neuron. 1996;17:543–551. doi: 10.1016/s0896-6273(00)80186-5. [DOI] [PubMed] [Google Scholar]
- Staley KJ, Soldo BL, Proctor WR. Ionic mechanisms of neuronal excitation by inhibitory GABAA receptors. Science. 1995;269:977–981. doi: 10.1126/science.7638623. [DOI] [PubMed] [Google Scholar]
- Thompson SM, Deisz RA, Prince DA. Relative contributions of passive equilibrium and active transport to the distribution of chloride in mammalian cortical neurons. Journal of Neurophysiology. 1988;60:105–124. doi: 10.1152/jn.1988.60.1.105. [DOI] [PubMed] [Google Scholar]
- Wu WI, Ziskind-Conhaim L, Sweet MA. Early development of glycine- and GABA-mediated synapses in rat spinal cord. Journal of Neuroscience. 1992;12:3935–3945. doi: 10.1523/JNEUROSCI.12-10-03935.1992. [DOI] [PMC free article] [PubMed] [Google Scholar]
- Zhang L, Spigelman I, Carlen PL. Development of GABA-mediated, chloride-dependent inhibition of CA1 pyramidal neurones of immature rat hippocampal slices. The Journal of Physiology. 1991;444:25–49. doi: 10.1113/jphysiol.1991.sp018864. [DOI] [PMC free article] [PubMed] [Google Scholar]