

Abstract
To determine whether Na+-Ca2+ exchange modulates Ca2+ sparks, we studied enzymatically isolated patch clamped rat ventricular myocytes loaded with the Ca2+-sensitive indicator fluo-3, using confocal microscopy at 20–22 °C. Two-dimensional images of Ca2+ sparks were recorded at 240 Hz using a laser scanning confocal microscope, allowing observation of a large area of the cell (820 μm2) at one time.
At a holding potential of −75 mV, spontaneous sparks were infrequent. Removal of extracellular Na+ for 520 ms, which in the absence of pipette Na+ should block Na+-Ca2+ exchange bidirectionally, was associated with a fourfold increase in spark frequency, without a significant change in cytoplasmic [Ca2+], sarcoplasmic reticulum (SR) Ca2+ content, or spark intensity, size or time course.
These findings are consistent with a model of excitation-contraction coupling in which Na+-Ca2+ exchange locally regulates the resting Ca2+ concentration in the diadic cleft (T-tubule-SR junction), thereby modulating the threshold for triggering Ca2+ sparks.
In cardiac cells, it is commonly accepted that contraction is initiated when a relatively small amount of Ca2+ entering through voltage-dependent L-type Ca2+ channels triggers a much larger release of Ca2+ from the sarcoplasmic reticulum (SR). It has also been proposed that Na+-Ca2+ exchange working in ‘reverse’ (Ca2+-influx) mode may serve as a second source of trigger Ca2+ (LeBlanc & Hume, 1990; Levi et al. 1994; Litwin et al. 1998); however, this latter hypothesis is controversial (Sham et al. 1992, 1995; Adachi-Akahane et al. 1996; Sipido et al. 1997).
The development of laser scanning confocal fluorescence microscopy has led to the identification of spontaneous local Ca2+ transients in ventricular myocytes. These local Ca2+ transients, termed Ca2+ sparks, are thought to reflect the fundamental events of excitation-contraction (E-C) coupling in cardiac cells (Cheng et al. 1993; López-López et al. 1994). The study of Ca2+ spark behaviour has furthered our understanding of the local regulation of E-C coupling. A spark event occurs when Ca2+ stored in the SR is released by one or more ryanodine receptors (RyRs) into a restricted space, the diadic cleft. At the resting potential, only a few spark events are identified, presumably triggered by the infrequent and stochastic openings of sarcolemmal L-type Ca2+ channels as well as the less frequent stochastic openings of RyRs. The whole-cell Ca2+ transient elicited by a strong depolarization is thought to represent the recruitment and summation of large numbers of Ca2+ sparks in response to an increased number of open L-type Ca2+ channels (López-López et al. 1995; Cleemann et al. 1998).
The relationship between the magnitude of the Ca2+ current (ICa) and the extent of Ca2+ released by the SR is known as the gain function (Wier et al. 1994). The role of Na+-Ca2+ exchange as an activator of Ca2+ sparks and a regulator of gain has been uncertain. López-López et al. (1995), for example, have shown that Ca2+ entry via Na+-Ca2+ exchange, elicited by depolarizing to very high membrane potentials, does not trigger sparks. However, they did not examine how Na+-Ca2+ exchange might influence spark frequency, a reflection of gain.
Since the open probability of the RyR has a sigmoidal dependence on [Ca2+] (Györke & Fill, 1993; Copello et al. 1997), it follows that any process that increases the local Ca2+ concentration near the cytoplasmic domain of a RyR should increase its open probability. This translates to an increase in gain since less additional Ca2+ is needed to further increase the open probability of the local RyR(s) to a regenerative threshold. The Na+-Ca2+ exchanger, concentrated in the sarcolemmal membrane of the transverse tubules (Frank et al. 1992), could play an important role in modulating gain by setting the resting Ca2+ level in the diadic cleft. The exchanger could thereby regulate how much incremental Ca2+ entry into the cleft, via Ca2+ channel or RyR opening, is required to reach the threshold for local regenerative Ca2+ release from RyRs in the diad (Litwin et al. 1998).
To determine whether Na+-Ca2+ exchange can influence Ca2+ release at the microdomain level, we examined the consequences of modulating Na+-Ca2+ exchange on Ca2+ spark characteristics in isolated rat ventricular myocytes, using the patch clamp technique in conjunction with 2-D laser scanning confocal microscopy. We find that Na+-Ca2+ exchange can significantly influence Ca2+ spark frequency, without altering the spatial or kinetic characteristics of individual spark events.
METHODS
Patch clamp
Adult Sprague-Dawley rats (200-300 g) were killed with an overdose of sodium pentobarbitone in accordance with the guidelines of the UCLA Office for Protection of Research Subjects. Their hearts were removed and single ventricular myocytes were isolated using collagenase (2 mg ml−1, Type II collagenase; Gibco BRL, Life Technologies, Gaithersburg, MD, USA) and protease (0.166 mg ml−1, Type XIV protease; Sigma) digestion according to the method of Mitra & Morad (1985). The cells were stored in a modified Na+-Tyrode solution, containing (mm): 136 NaCl, 5.4 KCl, 10 Hepes, 1 MgCl2, 1.8 CaCl2, 10 glucose, pH 7.4 with NaOH (temperature 20-22°C). We selected for study only Ca2+-tolerant cells that lacked spontaneous contractions. Patch electrodes were pulled from borosilicate glass (World Precision Instruments, Sarasota, FL, USA, TW150F-3) on a Sutter P-87 horizontal puller (Sutter Instruments, Novato, CA, USA). The electrodes had a tip diameter of 2-3 μm and a resistance of 2-4 MΩ after gentle fire-polishing and when filled with an internal solution containing (mm): 110 CsCl, 20 TEA-Cl, 20 Hepes, 5 MgATP (adenosine 5′-triphosphate), 5 glutathione, 0.2 cAMP, 1 fluo-3, pH 7.2 with CsOH. Cells were loaded with a high concentration (1 mm) of the fluorescent Ca2+ indicator fluo-3 in order to visualize Ca2+ sparks and to buffer cytoplasmic Ca2+. Glutathione was included as an antioxidant to reduce phototoxicity. Na+ was omitted from the patch pipette solution so that Na+-Ca2+ exchange would be inhibited when extracellular Na+ was replaced with Cs+. During experiments, all bath solutions contained 10 μm TTX in order to block Na+ currents. A constant holding potential of -75 mV was maintained throughout the experiments using an Axopatch 200A patch clamp amplifier (Axon Instruments, Foster City, CA, USA) and a Digidata 1200 (Axon Instruments) data acquisition system controlled by pCLAMP 6 software (Axon Instruments). The pCLAMP software was also used to control the timing of laser shutter opening, as well as solution exchanges (see below).
Laser scanning confocal fluorescence imaging
Cells were loaded with the Ca2+ indicator fluo-3 via the patch pipette (see above) and then imaged using a Noran Odyssey XL rapid 2-D laser scanning confocal microscopy system (Noran Instruments, Middleton, WI, USA) attached to a Zeiss Axiovert TV100 inverted microscope fitted with a ×40 water-immersion objective lens (Zeiss C-Apochromat 40/1.2 W Corr). The excitation wavelength of the argon-krypton laser was set to 488 nm, and fluorescence emission wavelengths greater than 510 nm were detected by the photomultiplier of the confocal system. Eighty sequential images were collected at 240 Hz (4 ms per frame). The size of each 2-D frame was 232 pixels × 98 pixels and the pixel size was 0.19 μm × 0.19 μm. To reduce photobleaching of the indicator as well as phototoxicity to the cells, the laser was shuttered electronically and triggered to open by the patch clamp computer only during the 320 ms acquisition period. Fluorescence signals (F) were normalized by dividing them by the average fluorescence intensity at rest (F0). This procedure removes the contribution of non-uniformities in dye concentration within the confocal plane and gives a signal that can be directly related to intracellular Ca2+ concentration (Cheng et al. 1995).
Image analysis
We used a computer-assisted method of identifying and measuring the characteristics of Ca2+ sparks on unfiltered images. In order to be considered a potential ‘spark’, increases in local fluorescence intensity had to meet the following three criteria: (1) the rate of increase in fluo-3 fluorescence over two successive frames had to be greater than twice the standard deviation of the background noise (dF/dtpotentialspark > 2 s.d. dF/dtbackgroundnoise); (2) for areas meeting the first criterion, fluorescence amplitude (F) could not fall more than 30 % in the subsequent frame to remain a candidate; (3) areas satisfying the first two criteria had to also contain at least four contiguous 3 pixel × 3 pixel arrays (overlapping arrays permitted) meeting the first two criteria to remain a candidate. For selected sparks, intensity vs. time was measured from the average of the nine centremost pixels of the spark (a 3 pixel × 3 pixel array). Spark size was expressed in terms of full width at half-maximum intensity (FWHM). Pixels contiguous to the centre of a selected spark, and whose intensity exceeded half of the maximum intensity, were included in this area. These regions were usually smaller than what appeared by eye to be the outer dimension of the spark.
Image presentation
Spark frequency and location can be appreciated more readily in still pictures by preparing a 3-D image stack of 2-D image frames in temporal sequence, beginning with time 0 at the top and progressing to 320 ms at the bottom. Low intensity pixels are rendered semi-translucent and the stack of frames is viewed on end from the top so that all of the frames are superimposed upon each other. In this fashion, all the sparks occurring during the acquisition period can be displayed at once in a 2-D representation. A pseudo-linescan image (‘X vs. time’) can also be constructed from the 3-D image stack by sectioning through the stack at any horizontal line. This facilitates comparison with other investigators who record Ca2+ sparks directly as linescans.
Solution exchange
Bath solution was exchanged using a rapid solution switcher described previously (Goldhaber et al. 1991). The device exchanges the bath solution surrounding the myocyte by 90 % within 200 ms. Solution switches were controlled by the pCLAMP software.
RESULTS
Characteristics of sparks under control conditions
We first characterized Ca2+ sparks under our control experimental conditions using high-speed 2-D confocal microscopy. Figure 1 shows a series of 2-D images at 4 ms intervals that illustrate the onset and decay of a single spontaneous Ca2+ spark. Under resting conditions, with normal external [Na+] and at physiological holding potential (-75 mV), sparks were observed infrequently (1.0 ± 0.2 sparks (100 μm2 s)−1; mean ±s.e.m.) during a 320 ms acquisition period, suggesting a low activity of SR Ca2+-release channels under these conditions. A total of 91 sparks in 13 cells from 11 animals were analysed. Sparks varied in intensity (mean F/F0= 2.63 ± 0.11), size (mean area at FWHM = 3.4 ± 0.2 μm2), and half-time (mean half-time measured at the 3 pixel × 3 pixel array at the spark centre = 8.4 ± 0.5 ms), as well as location (Fig. 2A and C). A stack presentation of a myocyte is illustrated in Fig. 2A. Note that three spontaneous sparks occurred during the 320 ms acquisition period. The three sparks were clearly visible in the 2-D stack whereas only two of the three could be seen in the corresponding pseudo-linescan (Fig. 2B). These data illustrate the dependence of spark detection on linescan position.
Figure 1. High speed 2-D confocal images of a spontaneous Ca2+ spark in an adult rat ventricular myocyte loaded with fluo-3 via the patch pipette.
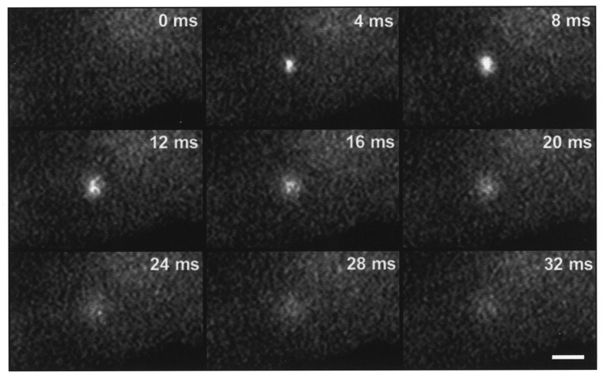
The frame rate is 240 Hz (4 ms per frame) and the holding potential is -75 mV. These images were filtered using a 3 × 3 low-pass smoothing algorithm. Scale bar, 5 μm.
Figure 2. Effect of extracellular Na+ removal on Ca2+ sparks.
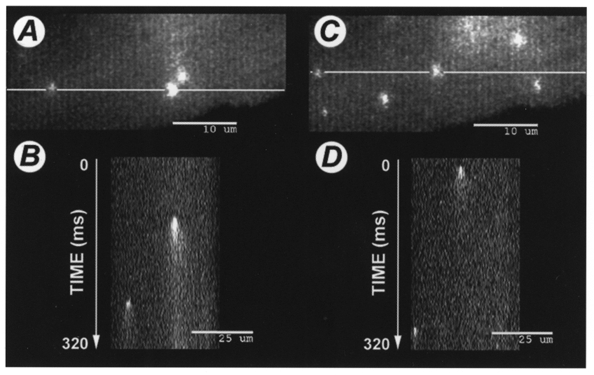
A, stacked image (see Methods for details) of spontaneously occurring Ca2+ sparks during a 320 ms acquisition period in a patch clamped ventricular myocyte loaded with 1 mm fluo-3 via the patch pipette under control conditions, with normal extracellular [Na+]. Note that there are three sparks visible. The white line intersecting two of the sparks indicates where the stack was ‘sectioned’ to produce the corresponding pseudo-linescan image shown below in B (‘X vs. time’). Note that only two of the three sparks revealed in the 2-D stack are found by the linescan. C, stacked image of the same cell, obtained during a 320 ms acquistion period beginning 200 ms after removal of extracellular Na+. Note that there are now six sparks visible on the 2-D stack during this brief exposure to Na+-free solution, whereas only two sparks are visible in D, the corresponding linescan.
Characteristics of sparks following removal of extracellular sodium
To determine the effect of Na+ withdrawal on spark behaviour, extracellular Na+ was removed by substituting Cs+ for Na+ in the bath solution using the rapid solution switcher. The switch was timed so that the solution bathing the cell was completely exchanged 200 ms before acquisition of images began. Perfusion with Na+-free solution continued throughout the duration of image acquisition (another 320 ms, total = 520 ms). Na+-containing control solution was then returned to the bath. Since the cell was dialysed for at least 5 min with a pipette solution containing no Na+, removal of extracellular Na+ is expected to halt or transiently reverse Na+-Ca2+ exchange. Figure 2C shows the effects of extracellular Na+ removal on the same cell illustrated in Fig. 2A. Note that there were now six sparks visible during the 320 ms acquisition period in Fig. 2C, although the corresponding pseudo-linescan shown in Fig. 2D revealed only two of the six sparks. Overall, we found an approximately fourfold increase in spark frequency (from 1.0 ± 0.2 to 4.2 ± 0.8 sparks (100 μm2 s)−1; P < 0.001, Student's paired t test for 14 interventions in 5 cells) during this brief period of Na+-free perfusion (Fig. 3). When Na+ was reapplied the spark frequency returned to baseline (not shown). Na+ could be repeatedly removed and reapplied with similar results.
Figure 3. Spark frequency (in sparks (100 μm2 s)−1) under control conditions and during Na+-free (0 Na) perfusion.
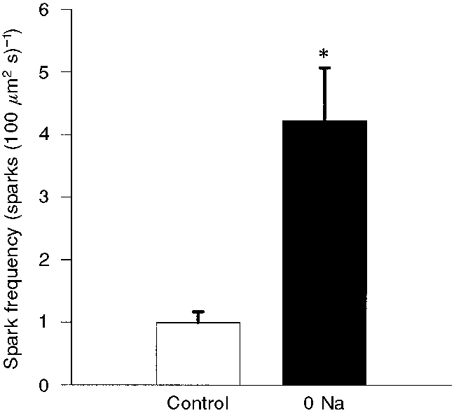
Results are means ±s.e.m. There was a fourfold increase in spark frequency during perfusion with Na+-free solution. *P < 0.001, Student's paired t test.
We also assessed whether Na+-free perfusion altered the intensity, size or time course of the Ca2+ spark. We analysed a total of 91 sparks under control conditions and 151 sparks during perfusion with Na+-free solution. Na+-free perfusion had no significant influence on the size (FWHM) of the sparks (3.4 ± 0.2 μm2 under control conditions and 3.7 ± 0.2 μm2 during Na+-free perfusion, P= 0.38) or their intensity (F/F0: control, 2.63 ± 0.11; Na+ free, 2.45 ± 0.07; P= 0.17; Fig. 4). The half-time for the declining phase of the centremost portion of the Ca2+ spark (a 3 pixel × 3 pixel array) was also unaffected by Na+ removal (8.4 ± 0.5 ms under control conditions, and 8.5 ± 0.3 ms during Na+-free perfusion, P= 0.82; Fig. 5). Likewise, there was no significant difference in the time constant for the declining phase when we considered the spread of the entire spark over an area within a 3 μm radius of the spark centre (31.7 ± 1.64 ms under control conditions vs. 31.0 ± 1.9 ms during Na+-free perfusion, P= 0.79). Thus, brief extracellular Na+ removal significantly increased the frequency of spontaneous Ca2+ sparks without detectably altering their intensity, size or kinetics.
Figure 4. Spark area (in μm2 using the FWHM criteria; A) and peak intensity (F/F0; B) under control conditions and during Na+-free (0 Na) perfusion.
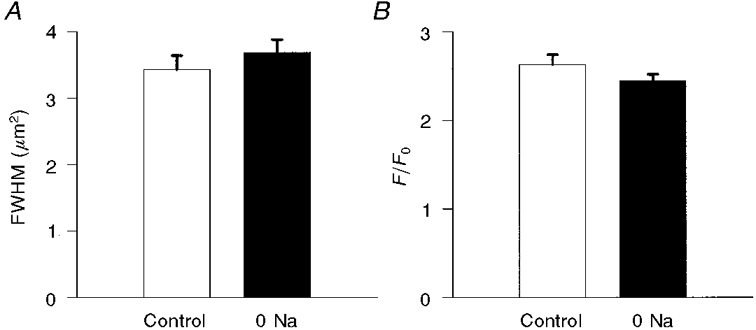
Results are means ±s.e.m. Removal of extracellular Na+ had no significant effect on either parameter.
Figure 5. Time constant for the declining phase of the Ca2+ spark (in ms) under control conditions, and during perfusion with Na+-free solution.
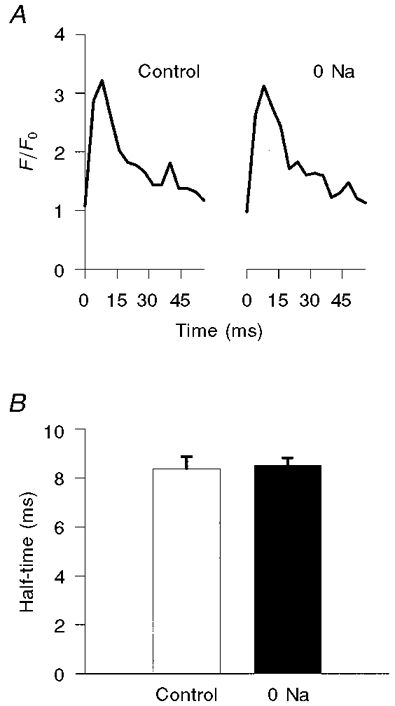
A, representative traces of spark intensity vs. time when measuring only the nine centremost pixels of the spark. The control trace is shown on the left; the trace on the right (0 Na) was obtained during Na+-free perfusion. B, corresponding plots of summary data (means ±s.e.m.).
Effect of Na+ removal on intracellular Ca2+
To determine whether the increase in spark frequency could be explained by an increase in resting bulk cytoplasmic Ca2+ concentration during extracellular Na+ removal, we measured background fluorescence before and after extracellular Na+ removal. During Na+-free perfusion, we found no significant increase in resting fluorescence locally at the sites of the subsequent Ca2+ sparks (pixel intensity 50 ± 3.4 with Na+ present vs. 52 ± 2.2 following removal of extracellular Na+, P= 0.52). Likewise, the resting fluorescence averaged over the entire frame was not significantly increased by Na+ removal (data not shown). Thus, Na+ removal for this brief period did not increase the global cytoplasmic [Ca2+] to a level sufficient to account for the increase in spark frequency that we observed.
Effect of Na+ removal on SR Ca2+ content
SR Ca2+ content may elevate spark frequency (Lukyanenko et al. 1996; Satoh et al. 1997), although this is controversial (Song et al. 1997). To determine whether SR Ca2+ content had increased during Na+-free perfusion, we measured SR Ca2+ content in our preparation before and during removal of external Na+ by applying caffeine (5 mm) to the bath solution surrounding the cell for 750 ms. The observed caffeine-induced increase in cytoplasmic Ca2+ fluorescence was recorded at a frame rate of 30 Hz. Na+ removal had no effect on SR Ca2+ release (control ΔF= 122 ± 8.7 vs. Na+-free ΔF= 121 ± 10.4 arbitrary units, P= 0.81, Student's paired t test in 9 cells from 3 animals; Fig. 6). These results indicate that SR Ca2+ content remained stable during our experimental protocol. Even when 10 mm Na+ was included in the pipette solution to facilitate reverse Na+-Ca2+ exchange, there was still no significant increase in SR Ca2+ release during Na+-free perfusion (data not shown).
Figure 6. Effect of extracellular Na+ removal on SR Ca2+ stores.
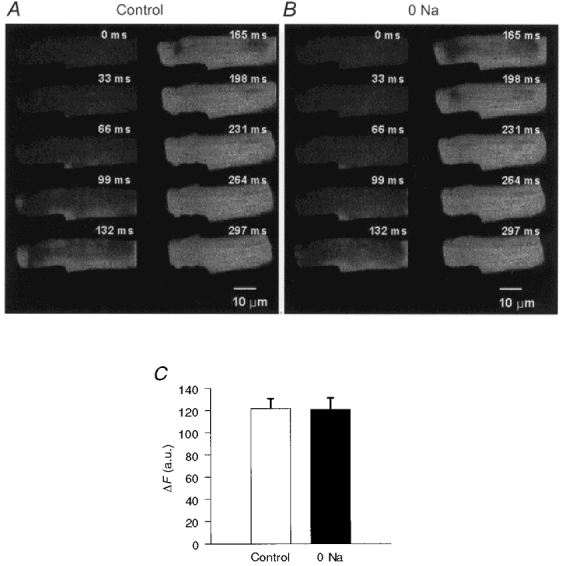
Sequential images of a patch clamped rat ventricular myocyte loaded with fluo-3 obtained at a frame rate of 30 Hz (33 ms per frame) during a 750 ms application of 5 mm caffeine under control conditions (A) or following removal of bath Na+ (0 Na) (B). C, summary data (means ±s.e.m.; n= 9 cells) of the fluorescence change (ΔF), in arbitrary units (a.u.) of pixel intensity, in response to 5 mm caffeine under control conditions and after removal of bath Na+.
DISCUSSION
Our findings indicate that brief removal of extracellular Na+ leads to an increase in Ca2+ spark production, without altering the individual characteristics of the Ca2+ spark. These changes in spark frequency are not due to increases in either bulk cytoplasmic Ca2+ concentration or SR Ca2+ content, and thus strongly support the microdomain hypothesis.
There are three possible explanations for our findings. The first possibility is that Na+ withdrawal leads to transient reverse Na+-Ca2+ exchange, causing Ca2+ entry into a restricted space that is not well buffered by fluo-3. This in turn produces sparks by directly activating RyRs. A second possibility is that reverse exchange does not directly activate sparks, but increases [Ca2+] in the vicinity of the RyRs so that there is a greater probability that a subsequent spontaneous L-type Ca2+ channel opening will produce a spark. The third possibility is that with forward exchange inhibited, either SR Ca2+ leak or a combination of Ca2+ leak and spontaneous L-type Ca2+ channel opening increases the local [Ca2+] in the vicinity of the RyRs, thereby increasing the probability of spark production. Since we have done nothing to change the probability of Ca2+ channel opening, the last two explanations are more or less equivalent.
We believe the third possibility to be the most likely for two reasons. First, the results of López-López et al. (1995) would argue against direct activation of RyRs by reverse exchange. Second, we tried to limit reverse Na+-Ca2+ exchange by excluding Na+ from the pipette solution and dialysing the cell for at least 5-10 min before removing external Na+. However, at the present time we are unable to measure cleft space Ca2+ directly. Thus, we cannot absolutely exclude the possibility that residual Na+ in the cell cytoplasm allowed Ca2+ entry into the cleft via reverse Na+-Ca2+ exchange. We are confident that there was no significant increase in bulk cytoplasmic [Ca2+] due to reverse Na+-Ca2+ exchange, since our system can reliably detect a 15 nm change in cytoplasmic Ca2+. Furthermore, 1 mm fluo-3 in the pipette provided additional cytoplasmic Ca2+ buffering, making it unlikely that a rise in cytoplasmic [Ca2+] was responsible for the increase in spark activity. If reverse Na+-Ca2+ exchange was indeed present, then the ability of Na+-Ca2+ exchange to modulate spark frequency in the face of this increased buffering suggests that the effect of the exchanger is fairly robust. We also saw no increase in SR Ca2+ content that might suggest an increase in spark frequency due to SR Ca2+ loading via reverse Na+-Ca2+ exchange.
López-López et al. (1995) have shown that reverse Na+-Ca2+ exchange cannot trigger Ca2+ sparks directly. Their study specifically tested the ability of reverse Na+-Ca2+ exchange to trigger Ca2+ sparks in the absence of Ca2+ entry through L-type Ca2+ channels (by depolarizing to membrane potentials high enough to produce Ca2+ entry via reverse Na+-Ca2+ exchange, while at the same time eliminating additional Ca2+ entry through L-type Ca2+ channels). Our experimental protocols were designed to modulate Na+-Ca2+ exchange activity without altering L-type Ca2+ channel activity. Membrane voltage was maintained at the resting potential, the extracellular Ca2+ concentration was constant, and we did not apply any agents known to influence Ca2+ channels. Thus our conditions were optimized to demonstrate how Na+-Ca2+ exchange might modulate the effectiveness of Ca2+ channels to induce sparks, i.e. how Na+-Ca2+ exchange might alter the gain of E-C coupling. A similar argument may explain why Gomez et al. (1996) failed to detect a change in spark frequency during inhibition of Na+-Ca2+ exchange using Na+- and Ca2+-free bath solutions. Removal of extracellular Ca2+ would have reduced single channel Ca2+ currents, and therefore the amount of Ca2+ entering the cleft when a Ca2+ channel opened. This would reduce the probability of triggering a spark when L-type Ca2+ channels open, and counteract any increase in spark probability resulting from a rise in cleft space [Ca2+] due to inhibition of Na+-Ca2+ exchange. Another potential drawback of these previous studies was that they used linescan mode rather than rapid 2-D acquisition. As illustrated in Fig. 2, the linescan mode may not be optimally suited for examining changes in spark frequency because of the limited spatial sampling. Our method, using rapid 2-D confocal scanning, enables us to sample an area approximately 100 times larger at high temporal resolution.
Our findings suggest that in a system where SR Ca2+ load and Ca2+ entry through L-type Ca2+ channels are unaltered, Na+-Ca2+ exchange has a significant influence on the frequency of Ca2+ sparks, presumably by setting the Ca2+ concentration in the local vicinity of the RyRs. This influences how much additional Ca2+ is required to reach the threshold for a local all-or-none Ca2+-release event (Lipp & Niggli, 1994). Our results imply that at diastolic membrane potentials, forward Na+-Ca2+ exchange functions to keep the [Ca2+] low in the cleft by removing Ca2+ that leaks out of the SR or that enters during stochastic openings of Ca2+ channels. In the absence of Na+-Ca2+ exchange, Ca2+ accumulates in the cleft and it takes less additional Ca2+ entry through L-type Ca2+ channels to activate RyRs. This is direct experimental evidence supporting the recent argument by Litwin et al. (1998) to explain how Na+-Ca2+ exchange might regulate the gain of Ca2+-induced Ca2+ release in cardiac muscle. They speculate that a local increase in [Ca2+] in the region of the RyR produces a shift along the flat foot of the sigmoidal curve relating Ca2+ concentration to the open probability of the RyR. By raising baseline [Ca2+] close to that at the steep part of the curve, less additional Ca2+ is required (added by the opening of an L-type Ca2+ channel, for example) to trigger RyR opening, in essence, a non-linear summation of triggers.
We conclude that the basal activity of Na+-Ca2+ exchange is an important factor regulating Ca2+ concentration in the diadic cleft, which has important consequences for spark activity and E-C coupling gain.
Acknowledgments
The authors thank Mr Tan Duong, Ms Kien Khuu and Mr Ben Wakamatsu for their invaluable technical assistance. This work was supported by NIH R29 HL51129 (J.I.G.), NIH RO1 HL44880 (J.N.W.), the Maude Cady Guthman Endowment (J.I.G.), the Chizuko Kawata Endowment (J.N.W.) and the Laubisch Endowment for Cardiovascular Research.
References
- Adachi-Akahane S, Cleemann L, Morad M. Cross-signaling between L-type Ca2+ channels and ryanodine receptors in rat ventricular myocytes. Journal of General Physiology. 1996;108:435–454. doi: 10.1085/jgp.108.5.435. [DOI] [PMC free article] [PubMed] [Google Scholar]
- Cheng H, Cannell MB, Lederer WJ. Partial inhibition of Ca2+ current by methoxyverapamil (D600) reveals spatial nonuniformities in [Ca2+]i during excitation-contraction coupling in cardiac myocytes. Circulation Research. 1995;76:236–241. doi: 10.1161/01.res.76.2.236. [DOI] [PubMed] [Google Scholar]
- Cheng H, Lederer WJ, Cannell MB. Calcium sparks - elementary events underlying excitation-contraction coupling in heart muscle. Science. 1993;262:740–744. doi: 10.1126/science.8235594. [DOI] [PubMed] [Google Scholar]
- Cleemann L, Wang W, Morad M. Two-dimensional confocal images of organization, density, and gating of focal Ca2+ release sites in rat cardiac myocytes. Proceedings of the National Academy of Sciences of the USA. 1998;95:10984–10989. doi: 10.1073/pnas.95.18.10984. [DOI] [PMC free article] [PubMed] [Google Scholar]
- Copello JA, Barg S, Onoue H, Fleischer S. Heterogeneity of Ca2+ gating of skeletal muscle and cardiac ryanodine receptors. Biophysical Journal. 1997;73:141–156. doi: 10.1016/S0006-3495(97)78055-X. [DOI] [PMC free article] [PubMed] [Google Scholar]
- Frank JS, Mottino G, Reid D, Molday RS, Philipson KD. Distribution of the Na+-Ca2+ exchange protein in mammalian cardiac myocytes: an immunofluorescence and immunocolloidal gold-labeling study. Journal of Cell Biology. 1992;117:337–345. doi: 10.1083/jcb.117.2.337. [DOI] [PMC free article] [PubMed] [Google Scholar]
- Goldhaber JI, Parker JM, Weiss JN. Mechanisms of excitation-contraction coupling failure during metabolic inhibition in guinea-pig ventricular myocytes. The Journal of Physiology. 1991;443:371–386. doi: 10.1113/jphysiol.1991.sp018838. [DOI] [PMC free article] [PubMed] [Google Scholar]
- Gomez AM, Cheng H, Lederer WJ, Bers DM. Ca2+ diffusion and sarcoplasmic reticulum transport both contribute to [Ca2+]i decline during Ca2+ sparks in rat ventricular myocytes. The Journal of Physiology. 1996;496:575–581. doi: 10.1113/jphysiol.1996.sp021708. [DOI] [PMC free article] [PubMed] [Google Scholar]
- Györke S, Fill M. Ryanodine receptor adaptation - control mechanism of Ca2+-induced Ca2+ release in heart. Science. 1993;260:807–809. doi: 10.1126/science.8387229. [DOI] [PubMed] [Google Scholar]
- LeBlanc N, Hume JR. Sodium current-induced release of calcium from cardiac sarcoplasmic reticulum. Science. 1990;248:372–376. doi: 10.1126/science.2158146. [DOI] [PubMed] [Google Scholar]
- Levi AJ, Spitzer KW, Kohmoto O, Bridge JHB. Depolarization-induced Ca entry via Na-Ca exchange triggers SR release in guinea pig cardiac myocytes. American Journal of Physiology. 1994;266:H1422–1433. doi: 10.1152/ajpheart.1994.266.4.H1422. [DOI] [PubMed] [Google Scholar]
- Lipp P, Niggli E. Sodium current-induced calcium signals in isolated guinea-pig ventricular myocytes. The Journal of Physiology. 1994;474:439–446. doi: 10.1113/jphysiol.1994.sp020035. [DOI] [PMC free article] [PubMed] [Google Scholar]
- Litwin SE, Li J, Bridge JH. Na-Ca exchange and the trigger for sarcoplasmic reticulum Ca release: studies in adult rabbit ventricular myocytes. Biophysical Journal. 1998;75:359–371. doi: 10.1016/S0006-3495(98)77520-4. [DOI] [PMC free article] [PubMed] [Google Scholar]
- López-López JR, Shacklock PS, Balke CW, Wier WG. Local, stochastic release of Ca2+ in voltage-clamped rat heart cells: visualization with confocal microscopy. The Journal of Physiology. 1994;480:21–29. doi: 10.1113/jphysiol.1994.sp020337. [DOI] [PMC free article] [PubMed] [Google Scholar]
- López-López JR, Shacklock PS, Balke CW, Wier WG. Local calcium transients triggered by single L-type calcium channel currents in cardiac cells. Science. 1995;268:1042–1045. doi: 10.1126/science.7754383. [DOI] [PubMed] [Google Scholar]
- Lukyanenko V, Györke I, Györke S. Regulation of calcium release by calcium inside the sarcoplasmic reticulum in ventricular myocytes. Pflügers Archiv. 1996;432:1047–1054. doi: 10.1007/s004240050233. [DOI] [PubMed] [Google Scholar]
- Mitra R, Morad M. A uniform enzymatic method for dissociation of myocytes from hearts and stomachs of vertebrates. American Journal of Physiology. 1985;249:H1056–1060. doi: 10.1152/ajpheart.1985.249.5.H1056. [DOI] [PubMed] [Google Scholar]
- Satoh H, Blatter LA, Bers DM. Effects of [Ca2+]i, SR Ca2+ load, and rest on Ca2+ spark frequency in ventricular myocytes. American Journal of Physiology. 1997;272:H657–668. doi: 10.1152/ajpheart.1997.272.2.H657. [DOI] [PubMed] [Google Scholar]
- Sham JS, Cleemann L, Morad M. Gating of the cardiac Ca2+ release channel: the role of Na+ current and Na+-Ca2+ exchange. Science. 1992;255:850–853. doi: 10.1126/science.1311127. [DOI] [PubMed] [Google Scholar]
- Sham JS, Cleemann L, Morad M. Functional coupling of Ca2+ channels and ryanodine receptors in cardiac myocytes. Proceedings of the National Academy of Sciences of the USA. 1995;92:121–125. doi: 10.1073/pnas.92.1.121. [DOI] [PMC free article] [PubMed] [Google Scholar]
- Sipido KR, Maes M, Van de Werf F. Low efficiency of Ca2+ entry through the Na+-Ca2+ exchanger as trigger for Ca2+ release from the sarcoplasmic reticulum. A comparison between L-type Ca2+ current and reverse-mode Na+-Ca2+ exchange. Circulation Research. 1997;81:1034–1044. doi: 10.1161/01.res.81.6.1034. [DOI] [PubMed] [Google Scholar]
- Song LS, Stern MD, Lakatta EG, Cheng H. Partial depletion of sarcoplasmic reticulum calcium does not prevent calcium sparks in rat ventricular myocytes. The Journal of Physiology. 1997;505:665–675. doi: 10.1111/j.1469-7793.1997.665ba.x. [DOI] [PMC free article] [PubMed] [Google Scholar]
- Wier WG, Egan TM, López-López JR, Balke CW. Local control of excitation-contraction coupling in rat heart cells. The Journal of Physiology. 1994;474:463–471. doi: 10.1113/jphysiol.1994.sp020037. [DOI] [PMC free article] [PubMed] [Google Scholar]