

Abstract
The properties of the calcium sensor for glucose-induced insulin secretion have been studied using cell-permeant Ca2+ buffers with distinct kinetics and affinities. In addition, submembrane cytosolic Ca2+ distribution has been modelled after trains of glucose-induced action potential-like depolarizations.
Slow Ca2+ buffers (around 1 mmol l−1 intracellular concentration) with different affinities (EGTA and Calcium Orange-5N) did not significantly affect glucose-induced insulin release. Modelling showed no effect on cytosolic Ca2+ concentrations at the outermost shell (0.05 μm), their effects being observed in the innermost shells dependent on Ca2+ affinity.
In contrast, fast Ca2+ buffers (around 1 mmol l−1 intracellular concentration) with different affinities (BAPTA and Calcium Green-5N) caused a 50% inhibition of early insulin response and completely blocked the late phase of glucose-induced insulin response, their simulations showing a decrease of [Ca2+]i at both the inner and outermost shells.
These data are consistent with the existence in pancreatic β-cells of a higher affinity Ca2+ sensor than that proposed for neurons. Moreover, these data are consistent with the proposed existence of two distinct pools of granules: (i) ‘primed’ vesicles, colocalized with Ca2+ channels and responsible of the first phase of insulin release; and (ii) ‘reserved pool’ vesicles, not colocalized and responsible for the second phase.
It is well established that changes in the cytoplasmic Ca2+ concentration ([Ca2+]i) in pancreatic β-cells are essential for the regulation of insulin secretion (Ashcroft & Rorsman, 1989). This Ca2+ rise, most probably restricted to the submembrane region (Martin et al. 1997), promotes the fusion of the secretory granules with the plasma membrane. Aside from other effects, Ca2+ should interact with one or more sites located at the exocytotic machinery whose components and role have been recently identified (Kiraly-Borri et al. 1996; Martin et al. 1996; Lang et al. 1997).
In this regard, several components may affect the intensity and kinetics of glucose-induced insulin release. In addition to the affinity and kinetics of the Ca2+ sensor, the existence of a primed granule pool (Eliasson et al. 1997) in conjunction with steep concentration gradients (Martin et al. 1997) and the colocalization of the insulin secretory granule with the voltage-dependent Ca2+ channel (Bokvist et al. 1995) may condition the effect of cell-permeant exogenous Ca2+ buffers. The use of a new generation of Ca2+ buffers with known kinetic and affinity properties allows us to have indirect access to the properties of the secretory machinery.
Recent observations in other endocrine cells have demonstrated: (i) the existence of a latency between [Ca2+]i and exocytosis (Chow et al. 1996; Eliasson et al. 1997); (ii) that secretion is relatively slow and continues for tens of milliseconds after Ca2+ entry through the voltage-dependent Ca2+ channels has ceased (Chow et al. 1996; Klingauf & Neher, 1997); and (iii) that endocrine cells have a higher Ca2+ sensitivity than neurones (Heinemann et al. 1994) and a lower maximum rate of secretion (Chow et al. 1994). All of these properties indicate a faint coupling of Ca2+ channels to the secretory machinery, with exocytosis being triggered by peaks of [Ca2+]i of <10 μmol l−1 at the release sites (Chow et al. 1994). These results contrast with those obtained from neurones (Zucker, 1996). If Ca2+ channels and vesicles are not strictly colocalized, then the amount of Ca2+ that enters during a single action potential may not be sufficient to trigger significant secretion, whereas trains of action potentials would be more effective (Zhou & Misler, 1995).
Pancreatic β-cells are unique in the sense that although they are endowed with the exocytotic and electrical machinery present in other excitable cells, the physiological trigger promoting insulin release is a nutrient that needs to be metabolized to initiate the sequence of events that links ATP-regulated K+ channel closure with insulin release (Ashcroft et al. 1984; Dunne & Petersen, 1991). It is known that in response to nutrient secretagogues, pancreatic β-cells display a series of trains of Ca2+ action potentials with a frequency of 2-6 Hz and a duration of 50-100 ms (Atwater et al. 1978). It is also accepted that: (i) these trains induce [Ca2+] changes beneath the plasma membrane (Martin et al. 1997); (ii) pancreatic β-cells are polarized (Martin et al. 1997); and (iii) Ca2+ channels seem to be strictly colocalized with secretory vesicles (Wiser et al. 1999). Taking into account all these aspects, we have studied the effects of several exogenous Ca2+ chelators on insulin release, in order to determine how cytosolic Ca2+ distribution affects the dynamics of insulin exocytosis in pancreatic β-cells. In addition, we have modelled buffered Ca2+ diffusion in the vicinity of channels and release sites by using trains of depolarizations that resemble the ones induced by stimulatory glucose concentrations.
METHODS
Islet isolation, cell isolation and culture
Islets from adult (8- to 10-week-old) Swiss albino male mice (OF1) killed by cervical dislocation in accordance with national guidelines were isolated as previously described (Lernmark, 1974). Briefly, after pancreas digestion with collagenase (Collagenase A, Boehringer Mannheim) in a stationary bath at 37°C, islets were separated by centrifugation and hand picked under a stereomicroscope. Once isolated, islets were dissociated into single cells in a low-calcium medium as previously described (Martin et al. 1997). Cells were then centrifuged, resuspended in culture medium RPMI 1640 (Sigma) supplemented with 10 % fetal calf serum, penicillin (Sigma; 100 i.u. ml−1), streptomycin (Sigma; 0.1 mg ml−1), and 5.6 mmol l−1 glucose and plated on glass coverslips. Cells were kept at 37°C in a humidified atmosphere of 95 % O2-5 % CO2 and used within 10 h of culture. Cell viability was tested by Trypan Blue exclusion (96 % of the cells excluded Trypan Blue). For intracellular recording experiments, islets were isolated by microdissection as previously described (Sanchez-Andres & Soria, 1991).
Loading of islets and islet cells
Collagenase-isolated islets, microdissected islets and islet cells were incubated for 2 h at 37°C in modified Krebs buffer supplemented with 5.6 mmol l−1 glucose and 3 % bovine serum albumin. The medium was continuously bubbled with 95 % O2-5 % CO2 for a final pH of 7.4. Then, pancreatic islets and islet cells were loaded as previously described (Martin et al. 1997) with EGTA AM, BAPTA AM, Calcium Orange-5N AM, Calcium Green-5N AM, Calcium Green-1 AM, Calcium Green-2 AM, dimethylBAPTA AM, dibromoBAPTA AM and dinitroBAPTA AM (Molecular Probes) by incubation for 1 h at 37°C in the described Krebs buffer with 100 μmol l−1 of these acetoxymethyl (AM) derivatives. Exogenous Ca2+ chelators AM were added as a concentrated stock solution in dimethyl sulphoxide (DMSO) (Sigma; final DMSO concentration 0.3 % v/v). In order to facilitate the solubilization of the Ca2+ chelators in physiological media, the mixture also contained 10 % (w/w) of the non-ionic surfactant polyol pluronic F127 (Molecular Probes). After loading, islets and cells were incubated for 1 h with the modified Krebs buffer mentioned above. The Krebs buffer was kept at 37°C and was constantly gassed with 95 % O2-5 % CO2 for a final pH of 7.4. Finally, Trypan Blue exclusion after cell loading was 95 %.
Determination of intracellular exogenous Ca2+ chelator concentration
For fluorescent exogenous Ca2+ chelators (Calcium Green-1 AM, Calcium Green-2 AM, Calcium Orange-5N AM and Calcium Green-5N AM), 5 × 10⁵ cells were loaded with 100 μmol l−1 of these AM derivatives by incubation for 1 h at 37°C in the described Krebs buffer. Next, cells were centrifuged for 5 min at 800 g, washed three times and sonicated twice in 1 ml of a CaEGTA Krebs buffer (final Ca2+ concentration 100 nm) for 5 s using a sonic dismembrator (Artek System Corp., Farmingdale, NY, USA) at 30 % maximum power. Finally, the suspension was centrifuged for 15 min at 16700 g and the fluorescence emitted by the supernatant was compared to that emitted for calibration curves built with exogenous Ca2+ chelator (sodium salt) solutions, in the same CaEGTA Krebs buffer, at different concentrations (0, 0.1, 1, 10 and 50 μmol l−1). The emitted fluorescence (531 nm for Calcium Green-1, 536 nm for Calcium Green-2, 575 nm for Calcium Orange-5N and 532 nm for Calcium Green-5N) was measured with a spectrofluorometer (model U-2000, Hitachi Ltd, Tokyo) at different excitation wavelengths depending on the exogenous Ca2+ chelator (488 nm for Calcium Green-5N, Calcium Green-1 and Calcium Green-2; 545 nm for Calcium Orange-5N). For non-fluorescent exogenous Ca2+ chelators (BAPTA AM and EGTA AM), a calibration curve of quenching of indo-1 (sodium salt)-emitted fluorescence (excitation wavelength of 360 nm and emission wavelength of 410 nm) was performed at different EGTA and BAPTA concentrations (0, 1, 10, 100 and 1000 μmol l−1) in the same EGTA buffer. Then, 5 × 10⁵ cells were loaded, centrifuged, washed and sonicated in the same manner as that used for fluorescent exogenous Ca2+ chelators. Finally, the quenching values of indo-1-emitted fluorescence elicited by the supernatant were extrapolated to the quenching of the indo-1 calibration curve. Cytosolic chelator concentrations were calculated from the total cell volume (10.45 × 10⁻⁷ l).
Electrophysiology
Membrane potential of the β-cell was recorded as previously described (Sanchez-Andres & Soria, 1991). Microdissected islets were fixed with micropins to the bottom of a 50 μl chamber and perifused at a rate of 0.8 ml min−1 with fresh modified Krebs buffer and constantly gassed with 95 % O2-5 % CO2 for a final pH of 7.4. Different glucose concentrations (3 and 11.1 mmol l−1) were added to the superfusion medium. The test agents reached the chamber with a delay of 3 s. These delays have been corrected for in the figures. Bath temperature was maintained at 36 ± 1°C by heating a stainless steel ring controlled by a thermostat. The temperature of the chamber was continuously monitored with a micro-thermistor. Recordings were made with an Axoclamp 2B amplifier (Axon Instruments). Data acquisition was performed with Axotape version 2.0 (Axon Instruments) and data analysis with MicroCal Origin version 3.7 (MicroCal Software, Northampton, MA, USA).
Insulin measurements
Insulin measurements were performed as previously described (Bolea et al. 1997). For static incubations, islets were incubated in groups of three in 1 ml of fresh modified Krebs buffer with 1 % bovine serum albumin plus the different glucose concentrations (3 and 22.2 mmol l−1) for 30 min at 37°C. For islet perifusion experiments, batches of 10 islets were placed in a 50 μl chamber and perifused at a flow rate of 1 ml min−1 at 37°C with fresh modified Krebs buffer with 1 % bovine serum albumin plus the different glucose concentrations (3 and 22.2 mmol l−1). For islet cell perifusion experiments, 1 × 10⁵ cells were packed into a 1 cm diameter column and sandwiched between two layers of swollen Sephadex G-200 microcarrier beads (Sigma). The column was perifused at a flow rate of 1 ml min−1 at 37°C with fresh modified Krebs buffer with 1 % bovine serum albumin plus the different glucose concentrations (3 and 22.2 mmol l−1). The pancreatic islets and islet cells were first perifused in 3 mmol l−1 glucose for 30 min to reach a state of stable insulin release. The solutions were prewarmed at 37°C and continuously gassed. Throughout the perifusion, effluent was continuously collected at 2 min intervals. The dead time was 2 min and has been corrected for in the figures. Both static incubation and perifused samples were kept at -20°C until insulin determination. Insulin was assayed by radioimmunoassay (RIA) using a kit from Diagnostic Products Corporation (Los Angeles, CA, USA). The RIA included the following steps: addition of anti-porcine insulin guinea-pig serum, incubation for 36 h at 4°C, addition of freshly labelled 125I-labelled-(Tyr A19)-human insulin, incubation for 18 h at 4°C and precipitation of bound insulin by ethanol. Rat insulin provided by the above-mentioned kit was used to prepare the standard curves. Standard curves and samples were run in triplicate.
Statistical analysis
The results were expressed as means ± standard error of the mean (s.e.m.). For comparisons between two groups, Student's unpaired, two-tailed t test was used. *P < 0.001 was considered significant.
RESULTS
Intracellular concentration of exogenous mobile Ca2+ buffers
As demonstrated in Table 1 the estimated concentration of all permeant buffers was between 0.85 and 1.61 mmol l−1. Theoretically, there may exist a limitation upon the maximum concentration of permeant chelator that can be introduced into cells (around 1 mmol l−1, as indicated in Table 1), which may be set by finite intracellular esterase activity, by active extrusion of the compound, and/or by their metabolism into inactive forms.
Table 1.
Intracellular concentrations of exogenous mobile Ca2+ buffers
| Exogenous Ca2+ buffer | Cytosolic concentration (μmol l−1) |
|---|---|
| EGTA | 853 ± 14 |
| BAPTA | 927 ± 36 |
| Calcium Green-1 | 1361 ± 57 |
| Calcium Green-2 | 1612 ± 63 |
| Calcium Green-5N | 1416 ± 73 |
| Calcium Orange-5N | 1280 ± 41 |
Data are means ±s.e.m. All determinations were run in quadruplicate. For fluorescent exogenous Ca2+ chelators 5 × 10⁵ cells were loaded with 100 μmol l−1 of their AM derivative by incubation for 1 h at 37 °C. Then, cells were centrifuged for 5 min at 800 g, washed and sonicated in a CaEGTA buffer. The suspension was then centrifuged for 15 min at 16 700 g and the fluorescence emitted by the supernatant was compared to that emitted for calibration curves built with exogenous Ca2+ chelator solutions, in the same CaEGTA buffer, at different concentrations. For nonfluorescent exogenous Ca2+ chelators a calibration curve was performed at different EGTA and BAPTA concentrations of quenching of indo-1-emitted fluorescence in the same CaEGTA buffer. Then, 5 × 10⁵ cells were loaded, centrifuged, washed and sonicated in the same manner as that used for fluorescent exogenous Ca2+ chelators. Finally, values of quenching indo-1-emitted fluorescence elicited by the supernatant were extrapolated to the quenching of the indo-1 calibration curve. Cytosolic chelator concentrations were calculated from the total cell volume.
Effects of mobile Ca2+ buffers on pancreatic β-cell electrical activity
To test the possible toxicity of these permeant Ca2+ buffers, we studied the effects of prolonged exposure to 100 μmol l−1 BAPTA AM or EGTA AM on glucose-induced electrical activity. Figure 1A shows the typical pattern of electrical activity of a pancreatic β-cell stimulated with 11.1 mmol l−1 glucose. This shows the onset of an oscillatory activity with membrane potential oscillating between silent (hyperpolarized) and active (depolarized) phases with fast spikes (Ca2+ action potential) superimposed upon them. Neither EGTA (Fig. 1B) nor BAPTA (Fig. 1C) significantly modified the 11.1 mmol l−1 glucose-induced oscillatory pattern of electrical activity. In addition, we did not observe any inhibitory effect of EGTA or BAPTA on the fast spikes of Ca2+ action potential. Only a small increase, which was within the normal range for this glucose concentration, in the height of the action potentials was observed when BAPTA was used. This could be attributed to less inactivation of Ca2+ channels due to the presence of BAPTA. In addition, these results also indicate that electrical activity was measured in permeant Ca2+ buffer-loaded β-cells.
Figure 1. Effects of different exogenous Ca2+ chelators on glucose-induced electrical activity.
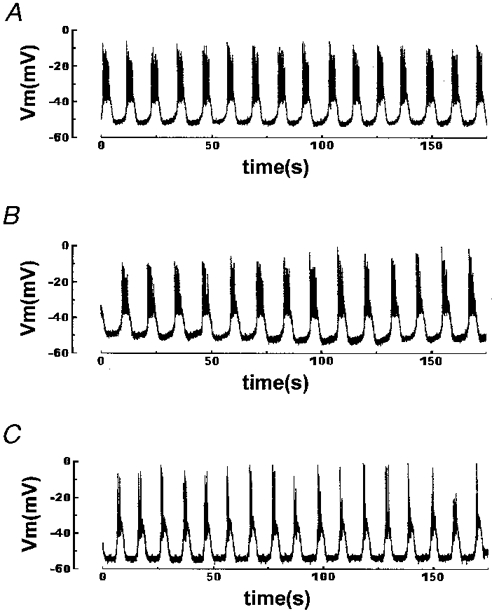
Islets were loaded for 1 h at 37 °C in modified Krebs buffer with 100 μmol l−1 of the different exogenous chelators in AM form. The records show representative examples of the effects of 11.1 mmol l−1 glucose on intracellularly recorded membrane potential of a pancreatic β-cell in an intact islet perifused with Krebs buffer. A, unloaded control islet. B, 100 μmol l−1 EGTA-loaded islet. C, 100 μmol l−1 BAPTA-loaded islet. Results are representative of 4 out of 4 cells.
Nutrient-induced insulin release depends on mobile Ca2+ buffers
We have studied the effects of the forward binding constant of the Ca2+ buffers on 22.2 mmol l−1 glucose-induced insulin release, by loading the islets with diffusible exogenous buffers with different kinetic properties. Figure 2A shows that perifused mouse islets respond to a stepwise increase in glucose concentration with a rapid and transient burst of insulin secretion (first phase) followed by a plateau (second phase) which lasted as long as glucose was present. When 100 μmol l−1 EGTA-loaded islets (a slow buffer with a forward binding rate (Kon) of 1.5 × 10⁶ l mol−1 s−1; Smith & Miller, 1985) were perifused with 22.2 mmol l−1 glucose no significant change in insulin release was observed (Fig. 2B). In addition, loading the islets with Calcium Orange-5N (a relatively slow buffer with a Kon of 1 × 10⁷ l mol−1 s−1; Escobar et al. 1997) did not affect glucose-induced insulin release either, although a small delay in the onset of the first phase was observed (Fig. 2D). Both EGTA and Calcium Orange-5N have a very different Ca2+ affinity. In fact, EGTA Kd is 200-fold less than that of Calcium Orange-5N (0.1 vs. 20 μmol l−1; Smith & Miller, 1985; Escobar et al. 1997). On the other hand, when islets were loaded with 100 μmol l−1 of the very fast mobile exogenous Ca2+ buffers BAPTA (Kon of 4 × 10⁸ l mol−1 s−1; Grynkiewicz et al. 1985) and Calcium Green-5N (Kon of 1.3 × 10⁸ l mol−1 s−1; Escobar et al. 1997) a markedly impaired insulin release was observed (Fig. 2C and E, respectively). As shown in Fig. 2C and E, early insulin response was 50 % inhibited and late phase insulin response was completely abolished. Note that EGTA and BAPTA have a very similar Ca2+ affinity (Kd= 0.1 and 0.4 μmol l−1, respectively; Smith & Miller, 1985; Grynkiewicz et al. 1985). When comparing buffers with the same Ca2+ affinity (Calcium Orange-5N and Calcium Green-5N; Kd= 20 μmol l−1; Smith & Miller, 1985) we observed that only the faster one markedly inhibited both phases of glucose-induced insulin release (Fig. 2D and E). Other fast exogenous Ca2+ buffers such as Calcium Green-1 and Calcium Green-2 (Kon of 1 × 10⁸ l mol−1 s−1; Escobar et al. 1997) elicited the same pattern of inhibition (data not shown). The inhibitory effects of high concentrations of Ca2+ chelators on peripherally located α-cell [Ca2+]i, which could be inhibiting glucagon secretion, which is very important for the insulin response of the islets, can be excluded for two reasons: (i) islet cell perifusion experiments with 100 μmol l−1 EGTA (Fig. 3B) or BAPTA (Fig. 3C) showed the same results as whole-islet studies; and (ii) glucagon-containing α-cell [Ca2+]i oscillations disappeared when islets were exposed to high glucose concentrations (Nadal et al. 1999).
Figure 2. Effects of different exogenous Ca2+ chelators on islet glucose-induced insulin release.
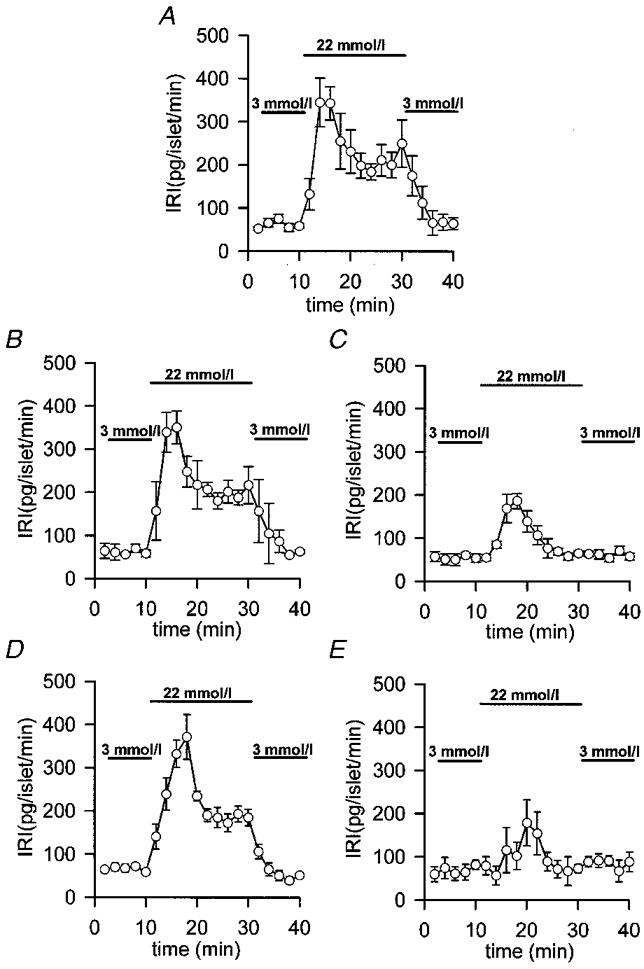
Islets were loaded for 1 h at 37 °C in modified Krebs buffer with 100 μmol l−1 of the different exogenous chelators in AM form. Then, batches of 10 islets were perifused at a flow rate of 1 ml min−1 at 37 °C with fresh modified Krebs buffer supplemented with 1 % bovine serum albumin. After a 30 min stabilization period with 3 mmol l−1 glucose, the islets were perifused for 10 min with 3 mmol l−1 glucose, then for 20 min with 22.2 mmol l−1 glucose and finally for 10 min with 3 mmol l−1 glucose. A, unloaded control islets. B, 100 μmol l−1 EGTA-loaded islets. C, 100 μmol l−1 BAPTA-loaded islets. D, 100 μmol l−1 Calcium Orange-5N-loaded islets. E, 100 μmol l−1 Calcium Green-5N-loaded islets. Insulin was assayed by radioimmunoassay and determinations were run in triplicate (IRI, immunoreactive insulin). Values are expressed as means ±s.e.m. of 7 experiments. Bars represent the addition of the different glucose concentrations.
Figure 3. Effects of different exogenous Ca2+ chelators on isolated islet cell glucose-induced insulin release.
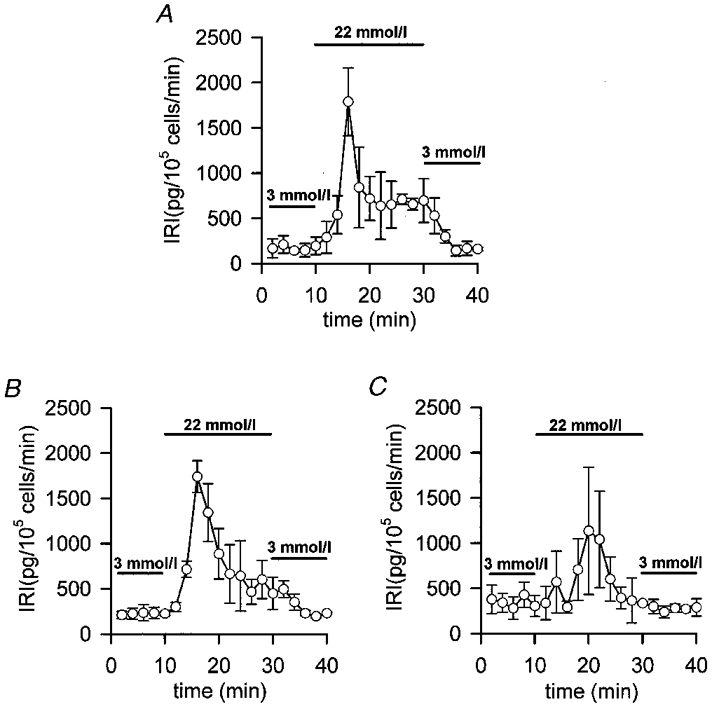
Islet cells were loaded for 1 h at 37 °C in modified Krebs buffer with 100 μmol l−1 of the different exogenous chelators in AM form. Then, 1 × 10⁵ islet cells were perifused at a flow rate of 1 ml min−1 at 37 °C with fresh modified Krebs buffer supplemented with 1 % bovine serum albumin. After a 30 min stabilization period with 3 mmol l−1 glucose, the islet cells were perifused for 10 min with 3 mmol l−1 glucose, then for 20 min with 22.2 mmol l−1 glucose and finally for 10 min with 3 mmol l−1 glucose. A, unloaded control islet cells. B, 100 μmol l−1 EGTA-loaded islet cells. C, 100 μmol l−1 BAPTA-loaded islet cells. Insulin was assayed by radioimmunoassay and determinations were run in triplicate. Values are expressed as means ±s.e.m. of 4 experiments. Bars represent the addition of the different glucose concentrations.
To further investigate the effects of mobile Ca2+ buffers with different calcium affinities on glucose-induced insulin release, the effects of several BAPTA derivatives with different Kd were determined. Table 2 shows that in islet batch incubations basal insulin release (3 mmol l−1 glucose) was not affected by the different BAPTA derivatives after 30 min incubation. On the other hand, three of the four compounds were capable of significantly reducing 22.2 mmol l−1 glucose-induced insulin release (Table 2). DibromoBAPTA (Kd= 3.6 μmol l−1; Tsien, 1980) elicited a higher reduction in insulin release (54 %). The reduced insulin release produced by dimethylBAPTA (Kd= 0.04 μmol l−1; Tsien, 1980) was 43 %, while the reduction produced by BAPTA (Kd= 0.1 μmol l−1) was 47 %. Finally, dinitroBAPTA (Kd= 3 × 10⁴μmol l−1; Pethig et al. 1989) did not reduce glucose-induced insulin release.
Table 2.
Effects of mobile Ca2+ buffers with different calcium affinities on glucose-induced insulin release
| IRI (pg islet−1 (30 min)−1) | ||
|---|---|---|
| 3 mmol l−1 glucose | 22.2 mmol l−1 glucose | |
| Control | 376 ± 38 | 2587 ± 256 |
| BAPTA | 428 ± 47 | 1388 ± 199* |
| DibromoBAPTA | 436 ± 35 | 1209 ± 240* |
| DimethylBAPTA | 331 ± 41 | 1491 ± 118* |
| DinitroBAPTA | 381 ± 53 | 2371 ± 343 |
Islets were loaded for 1 h at 37 °C in modified Krebs buffer with 100 μmol l−1 of the different BAPTA derivatives in AM form. Then, islets were incubated in groups of 3 in 1 ml of modified Krebs buffer with 1% bovine serum albumin plus the different glucose concentrations (3 and 22.2 mmol l−1) for 30 min at 37 °C. Insulin was assayed by radioimmunoassay and determinations were run in triplicate. Values are expressed as means ±s.e.m.
P < 0.001.
Modelling [Ca2+]i signals in pancreatic β-cells loaded with mobile Ca2+ buffers
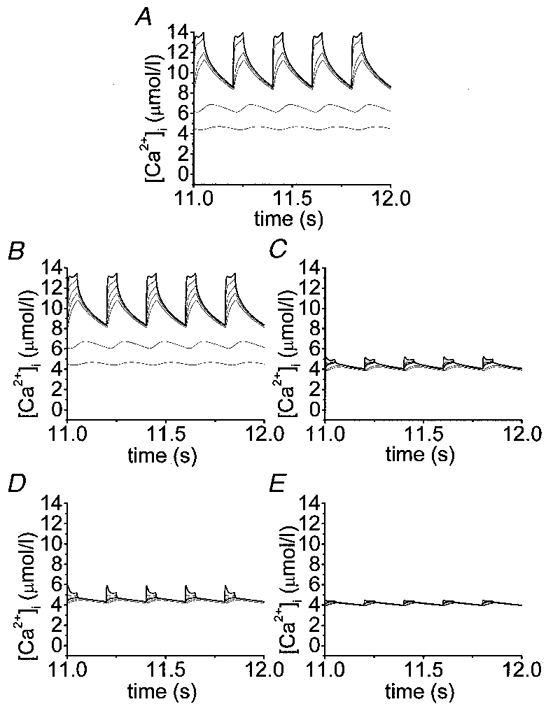
The simulations presented here show the complicated submembrane [Ca2+]i dynamics after a rapid train of short depolarizations. Time courses were plotted of [Ca2+]i for a train of 60 depolarizations (50 ms each separated by 150 ms) at different depths (0.05, 2 and 2.5 μm). Note that after 10 s the cytosolic calcium concentrations reached a steady state in all cases, thus validating the data obtained in the insulin release experiments which were carried out on a different time scale from the model. Figure 4A-E shows that in the absence of exogenous buffers and with different exogenous Ca2+ chelators the [Ca2+]i progressively increases. More and more residual Ca2+ is accumulated in the innermost shells with subsequent potential-like depolarizations until a state of equilibrium is reached. The maximal cytosolic Ca2+ concentrations reached in the outermost shell are different in each case (with endogenous fixed buffer only, 14 μmol l−1, Figs 4A and 5A; with EGTA, 13.7 μmol l−1, Figs 4B and 5B; with BAPTA, 5.2 μmol l−1, Figs 4C and 5C; with Calcium Orange-5N, 5.9 μmol l−1, Figs 4D and 5D; and with Calcium Green-5N, 4.4 μmol l−1, Figs 4E and 5E). After finishing the potential-like depolarizations [Ca2+]i drops to basal levels within a few seconds (data not shown). Running the model we observed that the concentration of fixed endogenous buffer available to bind Ca2+ was always higher than 130 μmol l−1. For Calcium Orange-5N and Calcium Green-5N these concentrations were always higher than 1033 and 1166 μmol l−1, respectively. Finally, EGTA and BAPTA are close to their saturation levels (10 and 70 μmol l−1, respectively). Figure 5B and Figure 6 show that the slow exogenous Ca2+ buffer EGTA did not significantly modify the [Ca2+]i pattern in the different shells and the cytosolic Ca2+ gradient. On the other hand, the fast Ca2+ buffer BAPTA (Fig. 5C) lowered [Ca2+]i more effectively. When we compared the effects of two low-affinity Ca2+ buffers (Kd= 20 μmol l−1) with different Kon, such as Calcium Orange-5N (Fig. 5D) (Kon= 107 l mol−1 s−1) and Calcium Green-5N (Fig. 5E) (Kon= 108 l mol−1 s−1), we observed that whereas Calcium Green-5N (Fig. 5E) (fast buffer) almost completely removed the cytosolic Ca2+ gradient near the cell membrane (see 0.05-0.5 μm shells) (Figure 5E and Figure 6), Calcium Orange-5N (slow buffer) still permitted a significant Ca2+ gradient (Figure 5D and Figure 6).
Figure 4. Effects of exogenous Ca2+ chelators with similar affinity and different forward binding constant on [Ca2+]i.
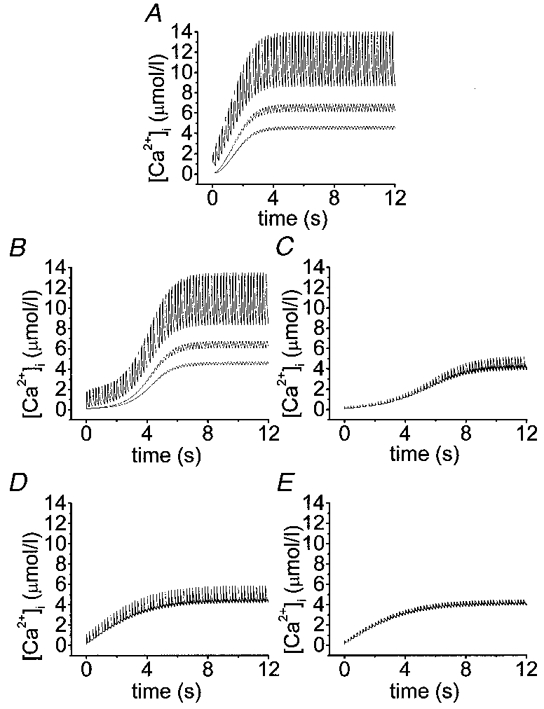
Simulation of time courses of cytosolic Ca2+ transients for a train of 60 potential-like depolarizations (50 ms each separated by 150 ms). Different profiles in each panel correspond to Ca2+ transients at shells positioned 0.05 (outermost), 2.0 and 2.5 μm underneath the membrane. Other parameters are as in Table 1. In addition to the endogenous fixed buffers (A), the effects of 853 μmol l−1 EGTA (B), 927 μmol l−1 BAPTA (C), 1280 μmol l−1 Calcium Orange-5N (D) and 1416 μmol l−1 Calcium Green-5N (E) have been simulated as indicated.
Figure 5. Detailed effects of exogenous Ca2+ chelators with similar affinity and different forward binding constant on [Ca2+]i.
Simulation of time courses of cytosolic Ca2+ transients after reaching the steady state (last 5 pulses of a train of 60 potential-like depolarizations; 50 ms each separated by 150 ms). Different profiles in each panel correspond to Ca2+ transients at shells positioned 0.05 (outermost, represented as bold trace), 0.2, 0.4, 0.6, 0.8, 2.0 and 2.5 μm beneath the membrane. Other parameters are as in Table 1. In addition to the endogenous fixed buffers (A), the effects of 853 μmol l−1 EGTA (B), 927 μmol l−1 BAPTA (C), 1280 μmol l−1 Calcium Orange-5N (D) and 1416 μmol l−1 Calcium Green-5N (E) have been simulated as indicated.
Figure 6. Computer simulation of the effects of exogenous Ca2+ chelators on [Ca2+]i gradients within a β-cell at various distances from the plasma membrane.
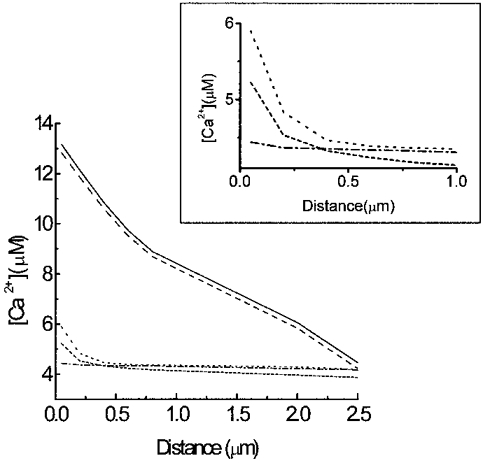
Simulation of cytosolic Ca2+ gradients built during the last Ca2+ transient after a train of 60 potential-like depolarizations. In addition to the endogenous fixed buffer (continuous line), the effects of 853 μmol l−1 EGTA (dashed line), 927 μmol l−1 BAPTA (short-dashed line), 1280 μmol l−1 Calcium Orange-5N (dotted line) and 1416 μmol l−1 Calcium Green-5N (dashed-dotted line) on submembrane [Ca2+]i gradient have been simulated as indicated. Inset, detailed [Ca2+]i gradients in the first micrometre from the plasma membrane.
DISCUSSION
Experiments involving capacitance measurements of exocytosis and photorelease of Ca2+ enabled Eliasson et al. (1997) to estimate the delay between elevation of [Ca2+]i and fusion of the granular membrane with the plasma membrane between <17 and 45 ms in pancreatic β-cells. Such behaviour can be described in other ways if one assumes that before any stimulation a small number of secretory vesicles are already docked very close to the membrane and the rest of them are located at approximately a 300 nm distance. Due to the fact that neuroendocrine cells have significant amounts of endogenous fixed Ca2+ buffers which tend to prolong [Ca2+]i transients, the time course of the Ca2+ and the resulting delay is expected to be highly dependent upon the relative amount of endogenous fixed Ca2+ buffer (Sala & Hernandez-Cruz, 1990). We have therefore tested the effects of increasing mobile Ca2+ buffers on glucose-induced insulin release and modelled their effects on the Ca2+ signal near the plasma membrane.
An estimate of intracellular buffer concentration is required to compare the action of different buffers and predict their probable effects on calcium concentrations and insulin release. Our observations show that pancreatic β-cells have a cytoplasmic chelator accumulation of around 1 mmol l−1, close to the maximum limit of permeant chelator that can be introduced into cells (Tsien, 1981). These data suggest that the approximations used to determine buffer concentrations are reasonable. Another problem is that the insulin release and the [Ca2+]i effects of permeant Ca2+ buffers can be attributable to the hydrolysed AM ester moiety. In addition, other mechanisms of chelator action cannot be excluded. These could include the direct pharmacological effects of the chelators or their by-products and reduction of the resting [Ca2+]i to levels in the order of 10−9 mol l−1. The fact that after Ca2+ buffer loading, glucose-induced electrical activity and insulin release are conserved, even in dinitroBAPTA-loaded islets (a very low Ca2+-affinity buffer), indicates that pancreatic β-cell metabolism, ATP-regulated K+ channels, Ca2+-dependent action potentials and exocytotic machinery are operative in the physiological range. In addition, it suggests that cellular homeostatic mechanisms can maintain resting [Ca2+]i at a ‘set point’ near normal levels despite the presence of high amounts of exogenous calcium buffer.
It has been demonstrated that a step increase in [Ca2+]i elicits a fast ATP-independent component of capacitance increase and a slowly developing ATP-dependent component (Eliasson et al. 1997). It was suggested that these components are the single cell counterparts of the first and second phase of insulin secretion (Grodsky, 1994). This reflects the existence of at least two functionally distinct pools of granules: first, the ‘readily releaseable’ or ‘primed’ pool; second, the ‘reserve’ pool. As observed, whereas fast mobile exogenous Ca2+ buffers completely blocked the second phase and partially affected the first phase, slow mobile exogenous Ca2+ buffers did not modify any phase of glucose-induced insulin release. That is to say, whereas fast Ca2+ buffers completely block the mobilization of granules from the reserve pool into the readily releasable pool, slow buffers did not affect this mobilization. According to the results, fast Ca2+ buffers (BAPTA and Calcium Green-5N) should partially block the exocytosis of granules which have reached the ultimate station before the final Ca2+-dependent step, the primed vesicles (first phase), which should be located in close proximity to Ca2+ channels; and should block the mobilization of the reserve pool of vesicles, not colocalized with Ca2+ channels and placed at approximately a 300 nm distance, as predicted by the model. In the simulations we observed the slow Ca2+ buffer Calcium Orange-5N decreasing [Ca2+]i at innermost shells (farther away than 400 nm), whereas fast buffers (BAPTA and Calcium Green-5N) decreased [Ca2+]i mostly at outer (beyond 50 nm) shells and to the same extent as slow buffers in the innermost shells. Thus, we suggest that the first phase of glucose-induced insulin release is due to exocytosis of a primed pool of secretory granules located in close proximity to Ca2+ channels (around 50 nm), whereas the second phase is due to mobilization of a reserve pool of granules placed at approximately 300 nm from the plasma membrane.
In pancreatic β-cells, it appears that [Ca2+]i at secretory sites reaches 7 μmol l−1 during depolarization (Bokvist et al. 1995) and around 2 μmol l−1 during glucose stimulation (Martin et al. 1997). The model also predicts a [Ca2+]i in the outermost shells not higher than 14 μmol l−1. This apparent difference could be due to an underestimation of [Ca2+]i caused by Ca2+ imaging techniques which do not allow measurements in close proximity to the plasma membrane.
Finally, fast Ca2+ buffers with low affinity, like the BAPTA derivative dinitroBAPTA (Kd= 3 × 10⁴μmol l−1), did not inhibit glucose-induced insulin release. Note that dinitroBAPTA itself reduced transmitter release in the presynaptic terminal of the giant squid synapse by 27 % (Adler et al. 1991). On the other hand, the fast Ca2+ buffer dibromoBAPTA (Kd= 3.6 μmol l−1) was the most efficient at inhibiting glucose-induced insulin release. All these data suggest that the Ca2+ receptor that initiates release does not need to have such a low affinity for Ca2+ as is the case in neurons.
In conclusion, these results provide additional evidence in favour of the existence of two different vesicle types responsible for glucose-induced insulin release: (i) primed vesicles, located very close to the Ca2+ channels and (ii) reserve vesicles, not strictly colocalized with the Ca2+ channels. Due to the fact that the second phase of glucose-induced insulin release may last for longer periods (from minutes to hours), it can be assumed that the speed of secretion is usually not so critical for pancreatic β-cell function. Moreover a low affinity Ca2+ sensor would require very high [Ca2+]i for hours, a condition which is not compatible with cell survival.
Acknowledgments
This research has been partially supported by grants FIS96-1994-01 (B.S.) and FIS96-2012 (J.V.S.A.) from Fondo de Investigaciones Sanitarias de la Seguridad Social. We thank Dr A. Escobar and Dr J. Vergara for their invaluable advice and comments on the manuscript. We also thank Dr F. Sala for his help with the mathematical model. Finally, we are indebted to A. Perez, N. Illera and R. Velasco for their excellent technical assistance. The text was edited by I. R. Ward.
APPENDIX
Computational model
The model takes into account several different species, namely Ca2+ and either of two buffer systems (B1, B2) in both their free and Ca2+-bound forms. The characteristics of B1 were chosen to mimic endogenous fixed buffers (Thomas et al. 1990; Neher & Augustine, 1992). B2 represents an exogenous Ca2+ buffer and its characteristic change depending on buffer characteristics modelled. The partial differential equation describing diffusion for all species can be written as (Crank, 1975):
| (A1) |
where [S] is the concentration of diffusible species, r is the radial distance and Dsis the diffusion coefficient of the diffusible species.
The model is composed of 50 concentric shells of uniform thickness, δ= 50 nm. The diffusional properties of each shell are considered to exist only at the shell interfaces and are represented as a set of rate constants between shell surface limits. Diffusional distance (shell thickness), and diffusion coefficients are taken into account. The result of this assumption is that for the ith of n shells eqn (A1) becomes:
| (A2) |
where [S]i is the concentration of the diffusible species (Ca2+ or a diffusible buffer), di is the effect of the diffusion of the diffusible species, Ds is the diffusion coefficient of the diffusible species, δ is the shell thickness, and Vi is the shell volume. Ai-1 and Ai are, respectively, the surface areas of the outer and inner spherical boundaries of the ith shell. To solve this equation, initial and boundary conditions must be defined. All species are initially assumed to be homogeneously distributed throughout the cell with known total concentrations of each buffer and initial calcium. Given the equilibrium constants (Kd) for the three buffers, the initial concentrations of bound and unbound Ca2+ buffers can be easily calculated according to the mass-action law for each individual case. The boundary conditions specify that diffusion does not occur across the outermost spherical boundary or out of the innermost sphere. Thus, Ai-1 is set to zero for the first (outermost) shell, while Ai is set to zero for the nth (innermost) shell.
The effect of buffering on concentration of the different species (B1, B2 and Ca 2+) is represented by:
| (A3) |
where [C]i is the concentration of free Ca2+, Bi is the effect of the Ca2+ binding, [B]i is the concentration of the unbound buffer, [CB]i is the concentration of bound buffer and finally, koff and kon are, respectively, the reverse and forward rate constant of the binding reaction.
Active extrusion of Ca2+ out of the spherical model from the first shell is defined according to Michaelis-Menten kinetics (Sala & Hernandez-Cruz, 1990). This system is described by the following equation:
| (A4) |
where Ex is the effect of the Ca2+ extrusion, Vmax is the maximal speed of transport, A is the area of the cell, V is the volume of the outermost shell, [C]is the concentration of Ca2+ in the outermost shell and Km is the half-maximal activating concentration. As noted by Sala & Hernandez-Cruz (1990), a steady leakage of calcium into the outermost shell is needed to maintain a fixed [Ca2+]i at rest. This leak is thus constant and defined by eqn (A4) with the exception that the concentration of Ca2+ used equals the initial ‘intracellular’ Ca2+ concentration (0.1 μmol l−1, see Table 1).
The rate of change of free Ca2+ due to influx in the first (outermost) shell is defined by:
| (A5) |
where In is the effect of the inward Ca2+ curent on the first shell, ICa is the inward Ca2+ current, F is Faraday's constant, and V is the volume of the first shell. ICa was fitted to an exponential decay whose values decreased from 250 pA to 41 pA; a similar Ca2+ current was evoked by Bokvist et al. (1995) by a 50 ms depolarization in pancreatic islet cells. In all cases, we used a series of 60 consecutive depolarizations, lasting 50 ms, separated by 150 ms silent phases.
The effect of calcium-transporting ATPase flux into the ER lumen in the last shell (innermost shell) was described by Saleet et al. (1992):
| (A6) |
where ER is the effect of Ca2+ uptake by endoplasmic reticulum, Kpump is the rate constant of ATPase and [C] is the concentration of Ca2+ in the innermost shell.
Finally, the following equations (by combining eqns (2)–(6)) describe the change in the concentration for each diffusible species involved in each shell:
| (A7) |
| (A8) |
| (A9) |
| (A10) |
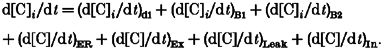 |
(A11) |
The ER term in eqn (A11) take values different from zero only at the innermost shell and the last three terms take a zero value in all shells except in the outermost shell.
Equations (A7)-(A11) were integrated using the first-order Euler algorithm. The simulations were run on a PC-compatible computer with a program written in Labview. The parameters used in the model are indicated in Table 3.
Table 3.
Parameters used for simulations
| Symbol | Definition | Standard value | Comment |
|---|---|---|---|
| Geometry | |||
| R | Cell radius | 5 μm | Cell size of a pancreatic β-cell |
| δ | Shell thickness | 0.05 μm | |
| Calcium | |||
| ICa | Whole-cell current | 250-41 pA | Fitted to an exponential decay whose values decreased from 250 pA to 41 pA, Bokvist et al. (1995) |
| [C]i | Basal calcium concentration | 0.1 μmol l−1 | |
| Ds | Diffusion constant for free Ca2+ in cytoplasm | 2 × 10⁻⁶ cm2 s−1 | Values used by Nowycky & Pinter (1993) |
| Calcium extrusion | |||
| Vmax | Maximum velocity of transport | 2 pmol cm−2 s−1 | Sala & Hernandez-Cruz (1990) |
| Km | Michaelis-Menten constant | 0.83 μmol l−1 | Sala & Hernandez-Cruz (1990) |
| Endoplasmic reticulum | |||
| Kpump | Pump rate into the endoplasmic reticulum | 300 s−1 | Estimated from values used for sarcoplasmic reticulum by Ogawa et al. (1981) |
| Endogenous buffers | |||
| Fixed buffer | |||
| [B2] | Total concentration | 500 μmol l−1 | Nowycky & Pinter (1993) |
| Kd | Dissociation constant | 5 μmol l−1 | Nowycky & Pinter (1993) |
| Kon | Forward binding rate | 1 × 10⁸ l mol−1 s−1 | Nowycky & Pinter (1993) |
| Exogenous buffers | |||
| Ds | Diffusion constant for free and Ca2+-bound buffers in cytoplasm | 2 × 10⁻⁶ cm2 s−1 | Nowycky & Pinter (1993) |
| EGTA | |||
| [B3] | Total concentration | 853 μmol l−1 | Our estimated value |
| Kd | Dissociation constant | 0.1 μmol l−1 | Measured at Molecular Probes |
| Kon | Forward binding rate | 1.5 × 10⁶ l mol−1 s−1 | Smith & Miller (1985) |
| BAPTA | |||
| [B3] | Total concentration | 927 μmol l−1 | Our estimated value |
| Kd | Dissociation constant | 0.4 μmol l−1 | Measured at Molecular Probes |
| Kon | Forward binding rate | 4 × 10⁸ l mol−1 s−1 | Grynkiewicz et al. (1985) |
| Calcium Orange-5N | |||
| [B3] | Total concentration | 1280 μmol l−1 | Our estimated value |
| Kd | Dissociation constant | 20 μmol l−1 | Measured at Molecular Probes |
| Kon | Forward binding rate | 1 × 10⁷ l mol−1 s−1 | Escobar et al. (1997) |
| Calcium Green-5N | |||
| [B3] | Total concentration | 1416 μmol l−1 | Our estimated value |
| Kd | Dissociation constant | 20 μmol l−1 | Measured at Molecular Probes |
| Kon | Forward binding rate | 1.3 × 10⁸ l mol−1 s−1 | Escobar et al. (1997) |
| Time increment | |||
| Δt | 2 μs | ||
References
- Adler EM, Augustine GJ, Duffy SN, Charlton MP. Exogenous intracellular calcium chelators attenuate neurotransmitter release at the squid giant synapse. Journal of Neuroscience. 1991;11:1496–1507. doi: 10.1523/JNEUROSCI.11-06-01496.1991. [DOI] [PMC free article] [PubMed] [Google Scholar]
- Ashcroft FM, Harrison DE, Ashcroft SJH. Glucose induces closure of single potassium channels in isolated rat pancreatic β-cells. Nature. 1984;312:446–448. doi: 10.1038/312446a0. [DOI] [PubMed] [Google Scholar]
- Ashcroft FM, Rorsman P. Electrophysiology of the pancreatic β-cell. Progress in Biophysics and Molecular Biology. 1989;54:87–143. doi: 10.1016/0079-6107(89)90013-8. [DOI] [PubMed] [Google Scholar]
- Atwater I, Ribalet B, Rojas E. Cyclic changes in potential resistance of the β-cell membrane induced by glucose in islets of Langerhans from mouse. The Journal of Physiology. 1978;278:117–139. doi: 10.1113/jphysiol.1978.sp012296. [DOI] [PMC free article] [PubMed] [Google Scholar]
- Bokvist K, Eliasson L, Ämmälä C, Renström E, Rorsman P. Colocalization of L-type Ca2+ channels and insulin-containing secretory granules and its significance for the initiation of exocytosis in mouse pancreatic β-cell. EMBO Journal. 1995;14:50–57. doi: 10.1002/j.1460-2075.1995.tb06974.x. [DOI] [PMC free article] [PubMed] [Google Scholar]
- Bolea S, Pertusa JAG, Martin F, Sanchez-Andres JV, Soria B. Regulation of pancreatic β-cell electrical activity and insulin release by physiological amino acid concentrations. Pflügers Archiv. 1997;433:699–704. doi: 10.1007/s004240050334. [DOI] [PubMed] [Google Scholar]
- Chow RH, Klingauf J, Heinemann C, Zucker RS, Neher E. Mechanisms determining the time course of secretion in neuroendocrine cells. Neuron. 1996;16:369–376. doi: 10.1016/s0896-6273(00)80054-9. [DOI] [PubMed] [Google Scholar]
- Chow RH, Klingauf J, Neher E. Time course of Ca2+ concentration triggering exocytosis in neuroendocrine cells. Proceedings of the National Academy of Sciences of the USA. 1994;91:12765–12769. doi: 10.1073/pnas.91.26.12765. [DOI] [PMC free article] [PubMed] [Google Scholar]
- Crank J. Diffusion in a sphere. In: Crank J, editor. The Mathematics of Difussion. Oxford: Clarendon Press; 1975. pp. 89–103. [Google Scholar]
- Dunne MJ, Petersen OH. Potassium selective ion channels in insulin-secreting cells: physiology, pharmacology and their role in stimulus secretion coupling. Biochimica et Biophysica Acta. 1991;1071:67–82. doi: 10.1016/0304-4157(91)90012-l. [DOI] [PubMed] [Google Scholar]
- Eliasson L, Renström E, Ding WJ, Proks P, Rorsman P. Rapid ATP-dependent priming of secretory granules precedes Ca2+-induced exocytosis in mouse pancreatic β-cells. The Journal of Physiology. 1997;503:399–412. doi: 10.1111/j.1469-7793.1997.399bh.x. [DOI] [PMC free article] [PubMed] [Google Scholar]
- Escobar AL, Velez P, Kim AM, Cifuentes F, Fill M, Vergara JL. Kinetic properties of DM-nitrophen and calcium indicators: rapid and transient response to flash photolysis. Pflügers Archiv. 1997;434:615–631. doi: 10.1007/s004240050444. [DOI] [PubMed] [Google Scholar]
- Grodsky GM. An update on implications of phasic insulin secretion. In: Flatt P, Lenzen S, editors. Frontiers of Insulin Secretion and Pancreatic β-Cell Research. London: Smith-Gordon; 1994. pp. 421–430. [Google Scholar]
- Grynkiewicz G, Poenie M, Tsien RY. A new generation of Ca2+ indicators with greatly improved fluorescence properties. Journal of Biological Chemistry. 1985;260:3340–3350. [PubMed] [Google Scholar]
- Heinemann C, Chow RH, Neher E, Zucker RJ. Kinetics of the secretory response in bovine chromaffin cells following flash photolysis of caged Ca2+ Biophysical Journal. 1994;67:546–557. doi: 10.1016/S0006-3495(94)80744-1. [DOI] [PMC free article] [PubMed] [Google Scholar]
- Kiraly-Borri C, Morgan A, Burgoyne R, Weller U, Wollheim C, Lang J. Soluble N-ethylmaleimide sensitive factor attachment protein and N-ethylmaleimide insensitive factors are required for Ca2+ stimulated exocytosis of insulin. Biochemical Journal. 1996;314:199–223. doi: 10.1042/bj3140199. [DOI] [PMC free article] [PubMed] [Google Scholar]
- Klingauf J, Neher E. Modeling buffered Ca2+ diffusion near the membrane: implications for secretion in neuroendocrine cells. Biophysical Journal. 1997;72:674–690. doi: 10.1016/s0006-3495(97)78704-6. [DOI] [PMC free article] [PubMed] [Google Scholar]
- Lang J, Zhang H, Vaidyanathan VV, Sadoul K, Niemann H, Wollheim CB. Transient expression of botulinum neurotoxin C1 light chain differentially inhibits calcium and glucose induced insulin secretion in clonal β-cells. FEBS Letters. 1997;419:13–17. doi: 10.1016/s0014-5793(97)01411-7. [DOI] [PubMed] [Google Scholar]
- Lenmark A. The preparation of, and studies on, free cell suspensions from mouse pancreatic islets. Diabetologia. 1974;10:431–438. doi: 10.1007/BF01221634. [DOI] [PubMed] [Google Scholar]
- Martin F, Ribas J, Soria B. Cytosolic Ca2+ gradients in pancreatic islet cells stimulated by glucose and carbachol. Biochemical and Biophysical Research Communications. 1997;235:465–468. doi: 10.1006/bbrc.1997.6804. [DOI] [PubMed] [Google Scholar]
- Martin F, Salinas E, Vazquez J, Soria B, Reig JA. Inhibition of insulin release by synthetic peptides shows that the H3 region at the C-terminal domain of syntaxin-1 is crucial for Ca2+-but not for guanosine 5′-[γ-thio]triphosphate-induced secretion. Biochemical Journal. 1996;320:201–205. doi: 10.1042/bj3200201. [DOI] [PMC free article] [PubMed] [Google Scholar]
- Nadal A, Quesada I, Soria B. Homologous and heterologous asynchronicity between identified α, β and δ cells within intact islets of Langerhans. The Journal of Physiology. 1999;517:85–93. doi: 10.1111/j.1469-7793.1999.0085z.x. [DOI] [PMC free article] [PubMed] [Google Scholar]
- Neher E, Augustine GJ. Calcium gradients and buffers in bovine chromaffin cells. The Journal of Physiology. 1992;450:273–301. doi: 10.1113/jphysiol.1992.sp019127. [DOI] [PMC free article] [PubMed] [Google Scholar]
- Nowycky MC, Pinter MJ. Time course of calcium and calcium-bound buffers following calcium influx in a model cell. Biophysical Journal. 1993;64:77–91. doi: 10.1016/S0006-3495(93)81342-0. [DOI] [PMC free article] [PubMed] [Google Scholar]
- Ogawa Y, Kurebayashi N, Irimajiri A, Hanai T. Transient kinetics for calcium uptake by fragment sarcoplasmic reticulum from bullfrog skeletal muscle with reference to the rate of relaxation in living muscle. Advances in Physiological Science. 1981;5:417–435. [Google Scholar]
- Pethig RR, Kuhn M, Payne R, Adler EM, Chen TH, Jaffe LF. On the dissociation constants of BAPTA-type calcium buffers. Cell Calcium. 1989;10:491–498. doi: 10.1016/0143-4160(89)90026-2. [DOI] [PubMed] [Google Scholar]
- Sala F, Hernandez-Cruz A. Calcium diffusion modeling in a spherical neuron. Relevance of buffering properties. Biophysical Journal. 1990;57:313–324. doi: 10.1016/S0006-3495(90)82533-9. [DOI] [PMC free article] [PubMed] [Google Scholar]
- Saleet M, Vajda S, Pasik P, Gillo B. A membrane model for cytosolic calcium oscillations. A study using Xenopus oocytes. Biophysical Journal. 1992;63:235–246. doi: 10.1016/S0006-3495(92)81583-7. [DOI] [PMC free article] [PubMed] [Google Scholar]
- Sanchez-Andres JV, Soria B. Muscarinic inhibition of the pancreatic β-cell. European Journal of Pharmacology. 1991;205:89–91. [PubMed] [Google Scholar]
- Smith GL, Miller DJ. Potentiometric measurements of stoichiometric and apparent affinity constants of EGTA for protons and divalent ions including calcium. Biochimica et Biophysica Acta. 1985;839:287–299. doi: 10.1016/0304-4165(85)90011-x. [DOI] [PubMed] [Google Scholar]
- Thomas P, Surprenant A, Almers W. Cytosolic Ca2+, exocytosis, and endocytosis in single melanotrophs of the rat pituitary. Neuron. 1990;5:723–733. doi: 10.1016/0896-6273(90)90226-6. [DOI] [PubMed] [Google Scholar]
- Tsien RY. New calcium indicators and buffers with high selectivity against magnesium and protons: design, synthesis and properties of prototype structures. Biochemistry. 1980;19:2396–2404. doi: 10.1021/bi00552a018. [DOI] [PubMed] [Google Scholar]
- Tsien RY. A non-disruptive technique for loading calcium buffers and indicators into cells. Nature. 1981;290:527–528. doi: 10.1038/290527a0. [DOI] [PubMed] [Google Scholar]
- Wiser O, Trus M, Hernandez A, Renström E, Barg S, Rorsman P, Atlas D. The voltage sensitive Lc-type Ca2+ channel is functionally coupled to the exocytotic machinery. Proceedings of the National Academy of Sciences of the USA. 1999;96:248–253. doi: 10.1073/pnas.96.1.248. [DOI] [PMC free article] [PubMed] [Google Scholar]
- Zhou Z, Misler S. Action potential-induced quantal secretion of catecholamines from rat adrenal chromaffin cells. Journal of Biological Chemistry. 1995;270:3498–3505. [PubMed] [Google Scholar]
- Zucker RJ. Exocytosis: A molecular and physiological perspective. Neuron. 1996;17:1049–1055. doi: 10.1016/s0896-6273(00)80238-x. [DOI] [PubMed] [Google Scholar]