

Abstract
Glutamate neurotoxicity has been attributed to cellular Ca2+ overload. As mitochondrial depolarisation may represent a pivotal step in the progression to cell death, we have used digital imaging techniques to examine the relationship between cytosolic Ca2+ concentration ([Ca2+]c) and mitochondrial potential (ΔΨm) during glutamate toxicity, and to define the mechanisms underlying mitochondrial dysfunction.
In cells of > 11 days in vitro (DIV), exposure to 50 mM potassium or 100 μM glutamate had different consequences for ΔΨm. KCl caused a small transient loss of ΔΨm but in response to glutamate there was a profound loss of ΔΨm. In cells of 7–10 DIV, glutamate caused only a modest and reversible drop in ΔΨm.
Using fura-2 to measure [Ca2+]c, responses to KCl and glutamate did not appear significantly different. However, use of the low affinity indicator fura-2FF revealed a difference in the [Ca2+]c responses to KCl and glutamate, which clearly correlated with the loss of ΔΨm. Neurons exhibiting a profound mitochondrial depolarisation also showed a large secondary increase in the fura-2FF ratio.
The glutamate-induced loss of ΔΨm was dependent on Ca2+ influx. However, inhibition of nitric oxide synthase (NOS) by L-NAME significantly attenuated the loss of ΔΨm. Furthermore, photolysis of caged NO at levels that had no effect alone promoted a profound mitochondrial depolarisation when combined with high [Ca2+]c, either in response to KCl or to glutamate in cultures at 7–10 DIV.
In cells that showed only modest mitochondrial responses to glutamate, induction of a mitochondrial depolarisation by the addition of NO was followed by a secondary rise in [Ca2+]c. These data suggest that [Ca2+]c and nitric oxide act synergistically to cause mitochondrial dysfunction and impaired [Ca2+]c homeostasis during glutamate toxicity.
During ischaemia the accumulation of glutamate plays a key role in promoting the spread of cell damage particularly into the penumbra of an evolving stroke (Choi & Rothman, 1990). More subtle, insidious forms of excitotoxicity may contribute to pathology in neurodegenerative diseases such as Huntington's disease and Alzheimer's disease (Meldrum & Garthwaite, 1990; Lipton & Rosenberg, 1994).
The high calcium permeability of the NMDA glutamate receptor seems central to this role, as the accumulation of intracellular calcium is clearly pivotal in triggering subsequent cell death (see review by Choi & Rothman, 1990). The downstream events that couple the rise in cytosolic calcium concentration ([Ca2+]c) to cell death are less well defined, and it is clear that a rise in [Ca2+]c alone is insufficient to cause cell death (Tymianski et al. 1994), as not all Ca2+ loads produce pathology. Large sustained elevations of [Ca2+]c can be induced following kainate treatment of spinal neurons (Tymianski et al. 1993) without substantial cell death. The demonstration of a direct causal link between Ca2+ influx and neuronal death has been controversial (Michaels & Rothman, 1990), until Tymianski et al. (1993; see also Sattler et al. 1998) revealed the absence of a predictive relationship between [Ca2+]c and neurotoxicity unless the source and duration of the Ca2+ influx was also taken into account. This has been described in terms of a ‘source specificity’ of calcium-induced neurotoxicity, suggesting that cell fate is determined not only by the absolute Ca2+ load but also by the route of Ca2+ influx. Implicit in this hypothesis is the suggestion that NMDA-induced neurotoxicity results either from some specific attribute of the NMDA receptor-channel complex or from its spatial relationship to other cellular structures.
Nitric oxide synthase (NOS) has emerged as a plausible link between NMDA receptor activation and neurotoxicity. In cerebral cortical cultures NMDA neurotoxicity is dramatically attenuated by inhibitors of NOS (Dawson & Dawson, 1996a), and the use of neuronal NOS (nNOS) inhibitors in models of focal cerebral ischaemia produced dramatic reductions in infarct volume (Dalkara & Moskowitz, 1994). However, the mechanisms of NO toxicity remain uncertain and the involvement of NO has not been demonstrable in some in vitro models (Dawson et al. 1994; Garthwaite & Garthwaite, 1994).
Several recent studies have suggested that mitochondrial dysfunction may represent a key determinant of the outcome of glutamate neurotoxicity (Ankarcrona et al. 1996; Schinder et al. 1996; White & Reynolds, 1996), although the underlying mechanisms remain uncertain. Nevertheless, there are a number of possible mechanisms whereby NO-mediated pathways may modify mitochondrial function (Schweizer & Richter, 1994), supporting a plausible link between NO production and mitochondrial dysfunction. This is further supported by recent observations showing that nNOS-knockout mice are dramatically resistant to mitochondrial neurotoxins (Schulz et al. 1997).
In order to provide a clearer understanding of the mechanisms underlying glutamate-induced mitochondrial dysfunction we have examined the relationship between [Ca2+]c and mitochondrial potential (ΔΨm). More specifically, we have examined the hypothesis that NO serves as a link between glutamate-induced [Ca2+]c overload and mitochondrial dysfunction. Some of this work has been presented in abstract form (Keelan et al. 1998).
METHODS
Tissue culture
Hippocampal neurons were grown in mixed neuronal and glial primary cultures as previously described (Vergun et al. 1999). In brief, rat pups 2–4 days post-partum were killed by cervical dislocation and decapitation, and the hippocampi removed into ice-cold Gey's salt solution (Life Technologies, UK) containing 20 μg ml−1 gentamicin. After mincing the tissue, it was transferred into a Ca2+- and Mg2+-free Hanks' buffered saline solution (HBSS; Life Technologies) containing 0.1 % trypsin for 15 min at 36°C, after which the trypsin was inactivated by washing with normal HBSS. Cells were dissociated by trituration and pelleted in HBSS, resuspended in minimal essential medium (MEM; with Earle's salts; Life Technologies) containing 10 % horse serum (Life Technologies) and plated onto 24 mm sterile circular glass coverslips which had been previously coated with poly-D-lysine.
Cultures were maintained at 36°C in a humidified atmosphere of 5 % CO2 and 95 % air and fed bi-weekly with MEM containing 10 % horse serum. Glial proliferation was restricted by treating cultures on day 3 with 10 μM cytosine arabinoside (Life Technologies) for 24 h. Neurons were grown for a minimum of 7 days before experimental use to ensure sensitivity to excitotoxic treatment. Neurons were easily distinguishable from glial cells: they appeared phase-bright, had smooth rounded somata and distinct processes, and usually lay just above the focal plane of the glial cell layer.
Imaging of [Ca2+]c and ΔΨm
Cells were loaded for 30 min at room temperature with 5 μM fura-2 AM (Molecular Probes) or fura-2FF AM (Texas Fluorescence Lab. Inc.) and 0.005 % pluronic in a standard recording saline containing (mM): 156 NaCl, 3 KCl, 2 MgSO4, 1.25 KH2PO4, 2 CaCl2, 10 glucose and 10 Hepes, pH adjusted to 7.35 with NaOH. For simultaneous measurements of [Ca2+]c and ΔΨm, rhodamine 123 (Rh123, 10 μg ml−1 or 26 μM; Molecular Probes) was added to the culture during the last 15 min of the fura-2 loading period. The cells were then washed extensively. Under these conditions, Rh123 appears to re-equilibrate, resulting in a signal which empirically we have routinely found to give a reproducible signal in response to a wide range of manipulations and in many cell types in line with changes in ΔΨm predicted from chemiosmotic theory. Rh123 loading under these conditions has no effect at all on the [Ca2+]c signals, which were the same in cells loaded with only a calcium indicator and cells loaded with both calcium indicator and Rh123. There was no evidence of toxicity of Rh123 under these conditions. Most fluorescence measurements were made on an inverted epifluorescence microscope using a × 20 fluorite objective lens to view a field of cells. [Ca2+]c and ΔΨm were monitored in single cells using excitation light provided by a xenon arc lamp, the beam passing sequentially through 340, 380 and 490 nm filters (10 nm bandwidth) housed in a computer-controlled filter wheel (Cairn Research Ltd, UK). Sequential excitation of cells at 340 and 380 nm allowed ratiometric measurement of fura-2 fluorescence and excitation at 490 nm allowed measurement of Rh123 fluorescence; data were acquired every 5 s. The images were acquired using a frame transfer 800 × 1200 pixel array (800 × 600 active area), cooled CCD camera and digitised to 12 bit resolution (Digital Pixel Ltd, UK). All imaging data were collected and analysed using Kinetic Imaging software (Liverpool, UK). A computer-controlled shutter kept photodynamic damage of the cells to a minimum by allowing exposure to excitation light only when required for imaging. The rate of image acquisition was varied for different experiments. In addition, the images illustrated in Fig. 1 in Results were captured using a confocal imaging system (model 510; Carl Zeiss, Inc.). The imaging of fura-2 was carried out using the 351 nm UV laser line and the Rh123 imaging used a 488 nm argon laser line.
Figure 1. Measurement of [Ca2+]c and ΔΨm using the fluorescent dyes fura-2FF and Rh123.
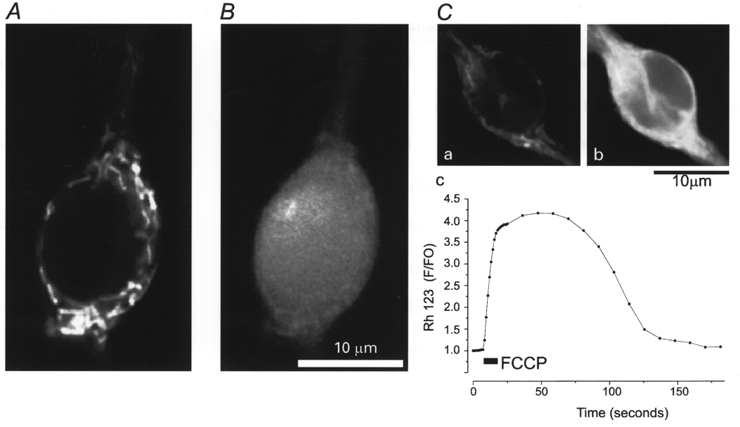
Confocal images of a neuron co-loaded with rhodamine 123 (Rh123) and fura-2FF. A, Rh123 fluorescence was excited using the 488 nm line of an argon laser. Note the discrete mitochondrial localisation of the signal and the absence of signal from the nucleus. B, switching the excitation to the 351 nm line of a UV laser excited only the fura-2FF fluorescence, which shows a uniform cytosolic distribution. C, confocal images of a cell loaded with Rh123 taken before (a) and after (b) addition of 1 μM of the mitochondrial uncoupler FCCP. The uncoupler dissipates ΔΨm completely, allowing redistribution of dye from the mitochondria into the cytosol. The quench of Rh123 fluorescence is relieved, and so mitochondrial depolarisation is signalled by an increase in Rh123 fluorescence (see Methods). Washout of the FCCP is followed after a delay by recovery of the fluorescence signal, as mitochondrial repolarisation promotes reaccumulation of dye and quenches its fluorescence. The time course of the full response is illustrated in Cc.
Some experiments were conducted using a microfluorimetric system as previously described, in order to achieve an improved temporal resolution (Nowicky & Duchen, 1998). In brief, fluorescence was excited using illumination from a 75 W xenon arc lamp focused onto a filter wheel (Cairn Research Ltd) which rotated at 12 Hz, allowing sequential excitation through 10 nm bandpass filters centred at 340, 360, 380 and 490 nm. The signal at 530 ± 5 nm was measured using a photomultiplier tube and signals excited at each wavelength separated using analog circuitry (Cairn Research Ltd). The signals were then digitised to 12 bits and stored to disk for off-line processing.
As the intracellular KD of fura-2 for calcium is almost certainly different from those measured in vitro, and as numerous studies suggest that intracellular calibrations of fura-2 are unreliable (Henke et al. 1996), we have not attempted to calibrate the fura-2 or fura-2FF ratios. Data are therefore presented as the ratio of the signal excited at 340 and 380 nm for fura-2 and fura-2FF. Rh123 is a lipophilic cationic dye which is concentrated into mitochondria where its fluorescence is quenched, presumably due to energy transfer between dye molecules. Upon mitochondrial depolarisation the dye redistributes between compartments, its fluorescence is de-quenched and a rapid increase in fluorescence (F) is observed (Duchen & Biscoe, 1992). Because Rh123 is a single wavelength dye and the signal therefore varies between cells, all Rh123 data have been normalised to the resting intensity (F0) in each cell and data are presented as the normalised ratio in some of the figures shown (F/F0). In all experiments, the maximum Rh123 signal that reflects complete dissipation of the mitochondrial potential was assessed by application of the mitochondrial uncoupler FCCP (1 μM; Sigma) at the end of the experiment. This indicates the dynamic range of the Rh123 signal from ‘rest’ to collapse of mitochondrial potential. Data have therefore also been presented as normalised values between zero representing the baseline fluorescence and unity representing the maximal increase in fluorescence in response to FCCP (F - F0/Fmax). This gives an indication of the relative mitochondrial depolarisation achieved during glutamate exposure.
Experimental procedure
In the majority of experiments, cells were bathed with normal recording saline at room temperature. This was manually changed to specified solutions, allowing bath application of KCl, glutamate, or FCCP as required. When cultures were tested for the effects of N-nitro-L-arginine methyl ester (L-NAME, Tocris, UK), or the protocol demanded the use of glutamate antagonists, all solutions contained these compounds. Cultures were also pre-incubated for 30 min with L-NAME or 10 min with glutamate receptor antagonists where appropriate.
To induce excitotoxicity, glutamate (100 μM) was applied in combination with glycine (10 μM) to allow maximum activation of the NMDA receptor. High-KCl saline was made by isotonic replacement of NaCl, and application of high-KCl saline was conducted in the presence of MK-801 (20 μM, Tocris), CNQX (20 μM; Tocris) and MCPG (1 mM; Tocris) to prevent activation of ionotropic and metabotropic glutamate receptors.
Use of a nitric oxide donor
The caged NO donor potassium nitrosylpentachloruthenate (K2Ru(NO)Cl5; Molecular Probes) was employed as a means of generating exogenous NO (Bettache et al. 1996). These experiments were conducted in a stable bath environment such that normal recording saline was removed and replaced by recording saline containing the freshly prepared NO donor. NO was then generated by photolysis of K2Ru(NO)Cl5 by the UV irradiation used routinely to excite the fura-2. Thus, excessive and potentially phototoxic illumination was avoided. The protocol was developed in an attempt to provide a continual low level of NO production. Initial set-up procedures and application of glutamate were carried out in the dark so that the cells were exposed to glutamate prior to NO generation, thus ensuring that there was no initial change in the NMDA responses incurred by the presence of NO (Manzoni et al. 1992).
Statistics
Data are expressed as means ±s.d. of a population of test neurons, with their matched controls from culture dishes used on the same day as the test dishes. Statistical significance was assessed either by the Mann-Whitney non-parametric test or the Kruskall-Wallis non-parametric ANOVA with Dunn's post hoc test. Correlation was assessed using the non-parametric Spearman Rank test. In every case, the numbers given reflect the numbers of cells studied from an absolute minimum of three separate cultures, with numerous dishes used per culture. Differences were accepted as significant when the two-tailed P value was 0.05 or less.
RESULTS
Simultaneous measurement of cytosolic [Ca2+] and mitochondrial potential
Figure 1 illustrates the distinct spatial localisation and spectral separation of the Rh123 (A) and fura-2FF (B) fluorescence signals in a hippocampal neuron observed using a confocal imaging system. The cells were co-loaded with fura-2FF and Rh123 and images were acquired at wavelengths from 510 to 550 nm. When illuminated using the 488 nm laser line (Fig. 1A), only the mitochondrially localised Rh123 was apparent. Switching the excitation to the 351 nm line of a UV laser (Fig. 1B) revealed only the dispersed cytosolic signal of the fura-2FF fluorescence. The clear spatial separation and distinct excitation spectra with minimal cross-talk makes it possible to co-load cells with the two indicators and to measure changes in [Ca2+]c and ΔΨm effectively simultaneously using a more conventional imaging system simply by switching sequentially between excitation filters at 340 nm, 380 nm (to obtain the fura-2 and fura-2FF ratios) and 490 nm (to excite the Rh123). Similar localisation and spectral separation was seen with the higher affinity calcium indicator fura-2 and Rh123. Figure 1C shows the response of the Rh123 signal to complete dissipation of ΔΨm induced by the addition of the mitochondrial uncoupler FCCP (1 μM). Images were captured just before (Ca) and following (Cb) the addition of FCCP, showing the increase in fluorescence signal that results (Cc).
Simultaneous measurement of [Ca2+]c and ΔΨm using fura-2 and Rh123: lack of correlation between increases in fura-2 ratio and changes in ΔΨm
In hippocampal neurons co-loaded with fura-2 and Rh123, application of 50 mM KCl caused an initial increase in the fura-2 ratio followed by a prolonged and sustained plateau (the fura-2 ratio rose to 3.55 ± 1.38, n = 110 neurons; Fig. 2Aa). These experiments were performed in the presence of glutamate antagonists (20 μM MK-801, 20 μM CNQX and 1 mM MCPG) to prevent any additive affects of endogenous glutamate released by the plasma membrane depolarisation. This pattern of increase in fura-2 ratio was associated with a small mitochondrial depolarisation (Fig. 2Ab) which was transient, despite the depolarisation of the plasma membrane being maintained by KCl. This response was clearly associated with the onset of the [Ca2+]c response, the period of maximal Ca2+ flux. Application of the mitochondrial uncoupler FCCP (1 μM) at the end of each experiment allowed expression of the mitochondrial depolarisation as a function of the complete dissipation of mitochondrial potential. Data are therefore also presented normalised with respect to the baseline Rh123 fluorescence (F0) and the FCCP-induced maximum Rh123 fluorescence (Fmax), so that a resting ΔΨm is represented as zero and complete dissipation of ΔΨm is represented as one. Thus, in response to KCl, the Rh123 signal only increased to 0.04 ± 0.001 (F - F0/Fmax, n = 110 neurons). These data also demonstrate unequivocally that the Rh123 signal could not simply reflect plasma membrane depolarisation, which must have been sustained throughout the period of KCl application (see also below and Duchen, 1992)
Figure 2. Simultaneous measurements of [Ca2+]c and ΔΨm reveal similar responses in terms of fura-2 ratio, but different responses in terms of ΔΨm when challenged with either KCl or glutamate.
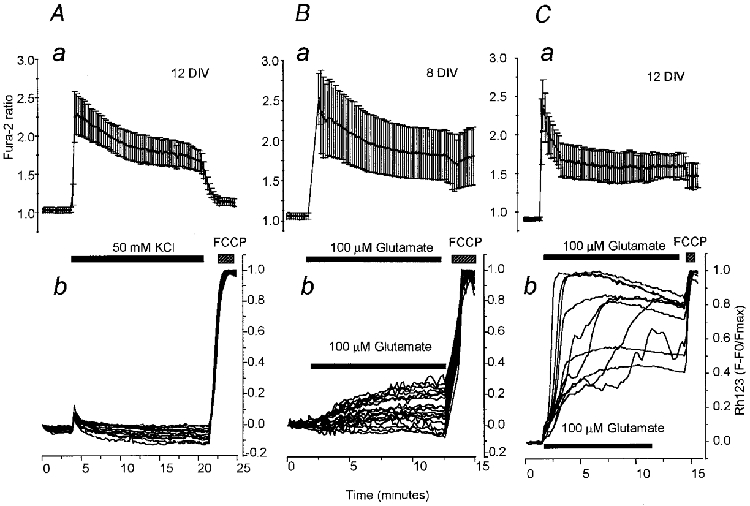
A, simultaneous measurements of fura-2 ratio (a) and normalised Rh123 fluorescence (b) in 14 neurons (12 days in culture, 12 DIV) during prolonged application of 50 mM KCl. The buffer was made by isotonic replacement of NaCl and the addition of the glutamate antagonists MK-801 (20 μM), CNQX (20 μM) and MCPG (1 mM) to prevent the effects of endogenous glutamate. In all these experiments the mitochondrial uncoupler FCCP (1 μM) was applied at the end of the experiment in order to dissipate ΔΨm completely as indicated ( ) and the mean ±s.d. of the fura-2 responses are shown. B, simultaneous measurements of changes in fura-2 ratio (a) and Rh123 fluorescence (b) in 18 neurons at 8 DIV during prolonged exposure to 100 μM glutamate (with 10 μM glycine to facilitate NMDA receptor activation). C, simultaneous measurements of changes in fura-2 ratio (a) and Rh123 fluorescence (b) in 11 neurons at 12 DIVduring prolonged exposure to glutamate as in B. Note the variability in the amplitude and time course of the loss of ΔΨm in individual neurons during glutamate exposure.
We have previously reported (Vergun et al. 1999) that the mitochondrial response of hippocampal neurons in culture to glutamate changes during the period for which the cells are maintained in culture. All cells used had been kept in culture for more than 7 days in vitro (DIV) which ensures the full expression of glutamate receptors and allows the reproducible and routine experimental imposition of a glutamate-induced [Ca2+]c load. Application of 100 μM glutamate produced robust and sustained increases in [Ca2+]c, reflected in a mean increase in the fura-2 ratio to 3.86 ± 1.16 (n = 187 neurons; Fig. 2B a) in cells of 7–10 days in vitro, and this was not significantly different to those seen in cultures that had been kept for longer periods (Fig. 2C a). Nevertheless, in cells that had been in culture for periods of 7–10 DIV, we rarely observed a substantial mitochondrial depolarisation in response to glutamate, which caused a 1.66 ± 0.78-fold increase in the Rh123 signal (F/F0, n = 187 neurons; expressed normalised to the baseline and the FCCP response (F - F0/Fmax) this was 0.25 ± 0.09; Fig. 2Ab). Cells maintained in culture for 11–16 days also exhibited sustained increases in the fura-2 ratio, which rose to 3.74 ± 1.41 (n = 357 neurons; Fig. 2C a) but also showed a dramatically greater mitochondrial depolarisation (P < 0.001; Fig. 2C b). In these cells, application of 100 μM glutamate caused a delayed but profound mitochondrial depolarisation. The mean Rh123 fluorescence in these cells increased 2.95 ± 1.38-fold (F/F0, n = 357 neurons; expressed normalised to both baseline and the FCCP response (F - F0/Fmax) this was 0.79 ± 0.19).
Thus, on average, neurons maintained for more than 10 days in culture showed a profound mitochondrial depolarisation during exposure to glutamate; however, individual neurons exhibited widely varying degrees and rates of mitochondrial depolarisation. In Fig. 3 we have illustrated a typical experiment, showing images of the progression of the Rh123 signal in Fig. 3A, while the time course of the responses of individual neurons in the field data is illustrated in Fig. 3B.
Figure 3. Variability in the amplitude and time course of the mitochondrial response to glutamate exposure in hippocampal neurons.
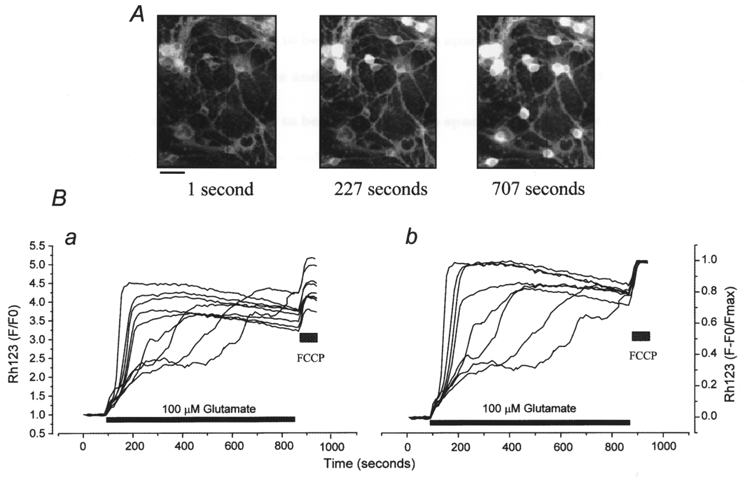
A, images showing changes in Rh123 fluorescence during prolonged exposure to 100 μM glutamate. Scale bar, 20 μm. B, changes in Rh123 signal with time from the data shown above, to show the variability in the time course and amplitude of the mitochondrial response to glutamate in this field of neurons. The signals are shown normalised to the baseline only (a) and to both baseline and the response to 1 μM FCCP (b; F − F0/Fmax), which was applied at the end of the experiment ().
Recent studies have demonstrated that high affinity indicators, such as fura-2, may prove misleading in the measurement of large changes in [Ca2+] associated with activation of NMDA receptors. Thus, Hyrc et al. (1997) compared Ca2+ indicators with different affinities for Ca2+ and found that fura-2 revealed no measurable difference between the apparent elevation in [Ca2+]c evoked with glutamate and that with KCl, while measurements with lower affinity Ca2+ indicators showed that [Ca2+]c elevations evoked by glutamate were considerably greater than those achieved with KCl. We too could not detect any significant difference between [Ca2+]c elevations evoked by glutamate and KCl using fura-2, even though the global fura-2 signal was clearly not saturating (10 μM ionomycin caused a further increase in fura-2 ratio after glutamate exposure; data not shown). We therefore carried out a series of experiments in which cells were co-loaded with the lower affinity dye fura-2FF (KD≡ 35 μM) and Rh123, to clarify whether differences in the [Ca2+]c response might after all account for the differences in mitochondrial responses to KCl and to glutamate.
Simultaneous measurement of ΔΨm and [Ca2+]c using Rh123 and the low affinity calcium indicator fura-2FF
Figure 4Aa shows the calcium dynamics over a 10 min exposure to KCl when using the low affinity calcium indicator fura-2FF to measure [Ca2+]c. Simultaneous measurements of Rh123 are illustrated for these cells in Fig. 4Ab, and show responses that were clearly similar to those described above using simultaneous measurements of fura-2 and Rh123 fluorescence. Thus, there was no significant loss of ΔΨm during KCl application. Glutamate application to young cultures (7–10 DIV) again caused only a modest if progressive increase in Rh123 fluorescence (Fig. 4B b) and neurons kept in culture for longer periods showed a profound collapse of mitochondrial potential (Fig. 4C b). This shows that loading cells with the relatively high affinity indicator fura-2 had not caused sufficient buffering of [Ca2+]c to modify the mitochondrial responses. However, the fura-2FF signals revealed clear differences in the change of [Ca2+]c observed during glutamate exposure in relation to the changes in ΔΨm described. Thus, the fura-2FF signal showed a unique response pattern to glutamate in neurons kept in culture for a longer period, which correlated with the simultaneous loss of mitochondrial potential.
Figure 4. Simultaneous measurements of [Ca2+]c and ΔΨm, using, respectively, the low affinity indicator fura-2FF and Rh123, reveal a large increase in [Ca2+]c seen only in neurons exhibiting loss of ΔΨm.
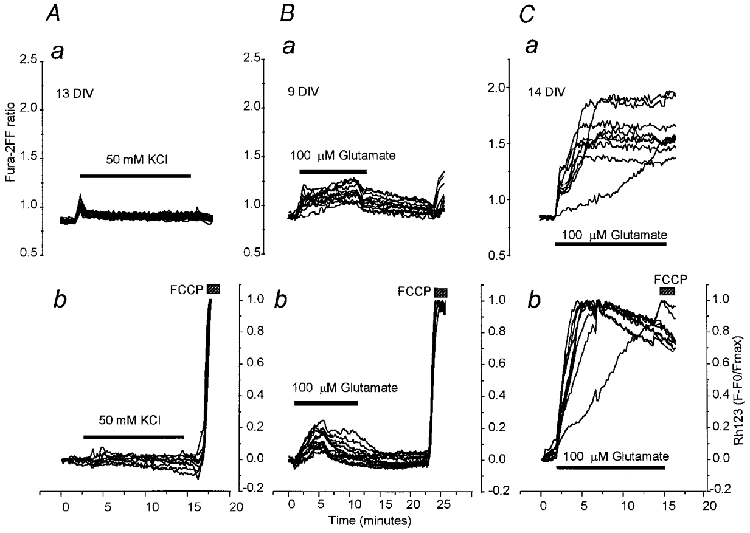
All records show simultaneous measurements of fura-2FF ratio (a) and normalised Rh123 fluorescence (b) from a field of neurons. At the end of each experiment, FCCP (1 μM) was applied in order to obtain the Rh123 signal representing complete collapse of ΔΨm. The Rh123 traces were then normalised between baseline and the peak response to FCCP (F − F0/Fmax). In A are shown measurements made from 19 cells at 13 DIV during prolonged application of 50 mM KCl (as described above; see legend to Fig. 2A), which caused only small transient increases in both fura-2FF ratio and Rh123 fluoresence. The traces in B were obtained from 10 neurons at 9 DIV upon prolonged exposure to 100 μM glutamate (with glycine), which caused a modest, sustained increase in fura-2FF ratio and a gradually progressive but modest mitochondrial depolarisation. Prolonged application of glutamate to cells at 14 DIV (C) had profoundly different effects. An initial rise in [Ca2+]c (a) was associated with a small and slow mitochondrial depolarisation (b). Both signals then gave way to secondary changes − a profound, if variable, collapse of mitochondrial potential and a large secondary increase in [Ca2+]c.
It is also noteworthy that an additional increase in the fura-2FF ratio was frequently seen after application of FCCP to cells which had been exposed to glutamate, but which had not shown a profound mitochondrial depolarisation to glutamate (see Fig. 4B a). This would suggest that FCCP caused Ca2+ release from Ca2+-loaded mitochondria, and that such local Ca2+ release could be detected by fura-2FF in the vicinity of the mitochondria. No such increase in the fura-2FF ratio was apparent during FCCP application to neurons which had been previously challenged with KCl (see Fig. 4Aa), consistent with suggestions that KCl induces a smaller net Ca2+ load than glutamate (Sattler et al. 1998), and therefore is associated with reduced mitochondrial calcium accumulation.
In agreement with Hyrc et al. (1997), we have clearly found a difference in the apparent change in [Ca2+]c reported by a high and a low affinity indicator. Our data also agree with those of Stout & Reynolds (1999) who recently showed that high affinity calcium dyes, such as fura-2, tend to underestimate glutamate-induced changes in [Ca2+]c and also that changes in [Ca2+]c in response to depolarisation or to glutamate could only be differentiated with the use of low affinity calcium indicators. Sattler et al. (1998) reported a difference in the total calcium load induced by 60 min of KCl or glutamate exposure in cortical cultures using an end-point assay of 45Ca2+ measurement, and also showed that the high affinity dye did not reveal such a difference in [Ca2+]c under these conditions.
Correlation between increases in fura-2FF ratio and changes in ΔΨm
Our data show a significant correlation between the maximum [Ca2+]c achieved with agonist application and the maximum loss of ΔΨm, as illustrated in Fig. 5 (Spearman Rank correlation coefficient, r = 0.7696, P < 0.0001, 162 neurons; data pooled from neurons of 7–16 DIV). These pooled data from populations of neurons could suggest that the observed differences in the glutamate-induced loss of ΔΨm between hippocampal neurons cultured for different periods, or in neurons exposed to KCl, can be explained directly by differences in the increase in [Ca2+]c in response to the different protocols. However, a careful study of individual neurons co-loaded with Rh123 and the low affinity dye fura-2FF suggest that the situation may be more complex than at first apparent.
Figure 5. Scatter plot illustrating the correlation between maximum fura-2FF ratio and maximum change in Rh123 signal (normalised to the baseline and the FCCP response, i.e. (F − F0)/Fmax).
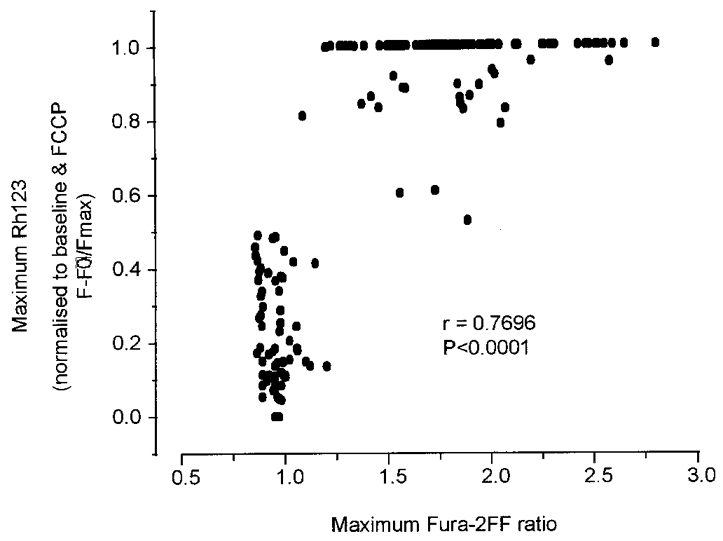
Hippocampal neurons were co-loaded with the two indicators and exposed to either 100 μM glutamate or 50 mM KCl for > 10 min. Pooled data from 162 neurones ranging from 7 to 16 DIV are shown. Spearman Rank coefficient, r = 0.7696 and significance, P < 0.0001 are shown.
Simultaneous measurements of fura-2FF and Rh123 fluorescence in individual neurons revealed that glutamate stimulation caused an initial increase in [Ca2+]c which was only later followed by a secondary increase in [Ca2+]c. The early rise in [Ca2+]c was associated with a slow and small mitochondrial depolarisation. The delayed and profound loss of ΔΨm was seen either prior to or (most often) concurrently with the secondary rise in [Ca2+]c (Fig. 6A). In an attempt to resolve the relative time courses of these two signals, and on the assumption that one variable would consistently precede, and probably drive, the change in the other, experiments were repeated using a microfluorimetric system with high sensitivity and improved temporal resolution (Nowicky & Duchen, 1998). However, even with this improved temporal resolution, no clear temporal separation could consistently be seen between the mitochondrial depolarisation and the secondary [Ca2+]c increase (see Fig. 6B). Note that, in this example, exposure to 50 mM KCl caused a larger increase in peak [Ca2+]c than the exposure to glutamate (it is likely that the initial glutamate response was suppressed due to residual inactivation of voltage-gated Ca2+ channels following their activation by the KCl). Nevertheless, the KCl exposure was associated only with a very small transient mitochondrial depolarisation, while the glutamate exposure caused a dramatic loss of mitochondrial potential. Note also that the fura-2FF ratio at which the mitochondrial depolarisation to glutamate occurred was lower than the peak achieved with KCl which had only a minimal effect on ΔΨm. It is evident that mitochondrial depolarisation is not a simple function of the amplitude of the rise in cytosolic calcium concentration.
Figure 6. Simultaneous measurements of [Ca2+]c and ΔΨm in individual neurons using fura-2FF and Rh123 allow dissociation of the change in [Ca2+]c before and after mitochondrial depolarisation.
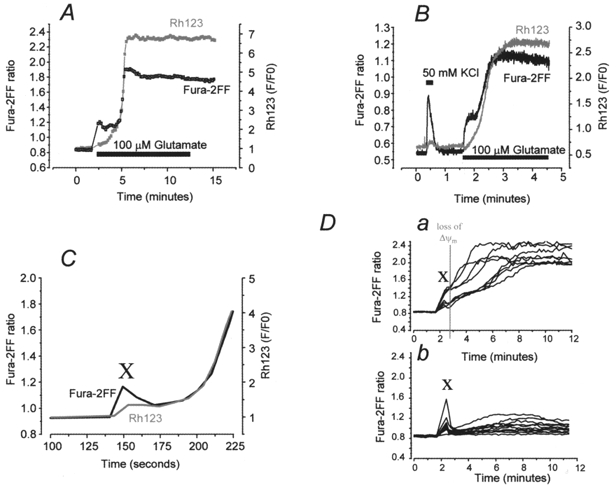
A, trace showing simultaneous measurements of Rh123 (grey line) and fura-2FF (black line) fluorescence in a typical neuron during exposure to 100 μM glutamate. Measurements were taken with a CCD camera, as described in Methods. Note that there was an initial change in fura-2FF ratio on glutamate challenge, which plateaued briefly, and during which the Rh123 fluorescence began to increase. This was followed by a sharp secondary rise in fura-2FF ratio, occurring concurrently with further loss of ΔΨm. B, measurement of Rh123 (grey) and fura-2FF (black) fluorescence changes, in a typical neuron, using a microfluorimetry system for improved temporal resolution. The neuron was initially stimulated with 50 mM KCl, causing a rapid increase in fura-2FF ratio but no increase in Rh123 fluorescence. Application of 100 μM glutamate to the same neuron caused an increase in fura-2FF ratio and an increase in Rh123 fluorescence. During the profound increase in Rh123, a sharp, secondary rise in fura-2FF ratio occurred. C, concentrating on the initial part of the neuronal response to 100 μM glutamate, this example of a typical neuron illustrates that there was an initial [Ca2+]c increase (marked as ‘X’), seen as an increase in fura-2FF ratio, which at a later time point was superseded by a secondary increase in fura-2FF ratio. The initial fura-2FF ratio change occurred prior to loss of ΔΨm, whereas the secondary fura-2FF ratio increase was associated with profound loss of ΔΨm. D, comparison of the initial fura-2FF ratio increase – which occurred prior to mitochondrial depolarisation (indicated as a grey line on trace Da) – between a population of neurones challenged with 100 μM glutamate (Da) and another challenged with 50 mM KCl (Db). The initial fura-2FF ratio increase in both the glutamate- and KCl-treated populations varied, but there is no significant difference between these two populations.
Importantly, simultaneous measurements allowed us to discriminate between an initial change in [Ca2+]c in glutamate-treated neurons prior to mitochondrial depolarisation (marked as ‘X’ on Fig. 6C) and the secondary large [Ca2+]c increase which only occurred with or after (or together with) the loss of ΔΨm. Direct comparison of this initial [Ca2+]c peak (marked as ‘X’ on Fig. 6Da, and taken prior to any mitochondrial depolarisation) with the peak [Ca2+]c in KCl treated or in ‘young’ hippocampal cultures treated with glutamate, where profound loss of ΔΨm did not occur (Fig. 6Db), showed no significant difference between the agonist-evoked [Ca2+]c response if the mitochondrial status was also taken into account. In neurons at > 10 DIV, the glutamate-evoked fura-2FF peak rose from 0.83 ± 0.03 to 0.99 ± 0.06 (93 neurons) compared with the KCl-evoked fura-2FF peak, which rose from 0.85 ± 0.02 to 1.0 ± 0.09 (96 neurons). In younger cultures (7–10 DIV) the glutamate-evoked fura-2FF peak rose from 0.87 ± 0.02 to 1.01 ± 0.15 (87 neurons). This is in agreement with our fura-2 data shown above and suggests that fura-2 is a suitable indicator to monitor the initial [Ca2+]c changes (prior to the onset of mitochondrial depolarisation) during glutamate exposure, during which the response is at the lower end of the dynamic range of the fura-2FF. The lower affinity indicator (fura-2FF) is clearly required to monitor changes in [Ca2+]c as it rises further after this period. This agrees with the hypothesis of Hyrc et al. (1997) who suggested that fura-2 selectively underestimates glutamate-induced Ca2+ because dye molecules in microdomains of the cytosol are saturated and cannot register further Ca2+ increases in these regions.
Glutamate-induced loss of ΔΨm is dependent on Ca2+
Figure 7 illustrates the dependence of the glutamate-induced mitochondrial depolarisation on Ca2+ influx, as no significant depolarisation occurred in response to glutamate exposure in a Ca2+-free recording saline (Rh123 fluorescence normalised to the FCCP response = 0.01 ± < 0.001, n = 69 neurons). This experiment demonstrates the absolute requirement for calcium in generating the mitochondrial response, shows that the response cannot be a consequence of raised intracellular sodium or free radical production alone, and excludes a major role for calcium released from internal stores, for example by activation of metabotropic glutamate receptors. This experiment is also an essential control, confirming that increases in Rh123 fluorescence cannot significantly reflect plasma membrane depolarisation, as pointed out by Nicholls & Budd (1998).
Figure 7. Glutamate-induced loss of ΔΨm is dependent on Ca2+.
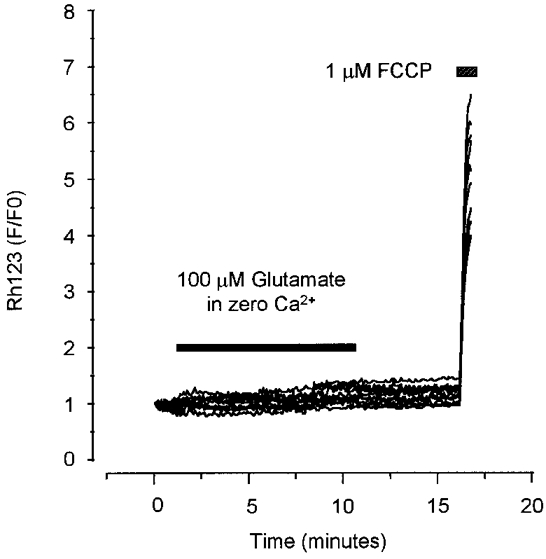
A trace showing the change in Rh123 fluorescence in a typical experiment using 13 neurons from one dish of cells at 12 DIV. 100 μM glutamate (with 10 μM glycine) was applied for 10 min in a Ca2+-free saline (with 50 μM EGTA). FCCP (1 μM) was applied as indicated at the end of the experiment.
The data above show that the glutamate-induced loss of ΔΨm is clearly Ca2+ dependent, but there seemed to be no simple relationship between the initial change in fura-2FF ratio and the consequent loss of ΔΨm, assuming that the early changes in [Ca2+]c define the subsequent events. Furthermore, our simultaneous measurements of [Ca2+]c and ΔΨm in individual neurons showed that the large rise in [Ca2+]c was typically either synchronous with or followed the loss of ΔΨm, and it was difficult to attribute the loss of ΔΨm to changes in [Ca2+]c alone with any confidence. In the light of recent data suggesting a role for NO in glutamate-induced mitochondrial status in cortical neurons (Almeida et al. 1999), we went on to investigate whether NO was involved in this profound loss of ΔΨm in hippocampal neurons, and to explore possible dissociation between changes in [Ca2+]c and ΔΨm.
Glutamate-induced mitochondrial dysfunction involves nitric oxide
Glutamate-induced increased [Ca2+]c is non-toxic in conditions in which the generation of free radicals is limited (Dubinsky et al. 1995). NMDA receptor activation increases the generation of the free radical nitric oxide and other reactive oxygen species (Dawson et al. 1991; Dugan et al. 1995; Dawson & Dawson, 1996b), and inhibitors of NOS significantly decrease glutamate toxicity in rat cultured retinal neurons (Kashii et al. 1996). It thus seemed quite plausible that NO might contribute to the mitochondrial depolarisation that we have described, and so we explored this further in a series of experiments designed to manipulate NO production. Glutamate application to a series of matched controls caused a profound mitochondrial depolarisation as expected (a mean change in Rh123 with respect to the FCCP response of 0.92 ± 0.12, n = 49 neurons; Fig. 8Aa). Pre-incubation of hippocampal neurons with the nitric oxide synthase (NOS) inhibitor L-NAME (100 μM) to suppress NO production dramatically attenuated the profound mitochondrial depolarisation induced by glutamate application (the increase in Rh123 fluorescence normalised to baseline and the FCCP response was 0.52 ± 0.16 (P < 0.001; n = 100 neurons; Fig. 8Ab). Attenuation of the mitochondrial depolarisation by L-NAME was not secondary to a significantly smaller change in the glutamate-induced [Ca2+]c. The initial [Ca2+]c peak, measured most accurately with fura-2, was not significantly different in the presence or absence of the NOS inhibitor (with L-NAME, fura-2 ratio rose to 3.13 ± 1.07; n = 100 neurons; in matched controls, fura-2 ratio rose to 2.93 ± 0.73; n = 69 neurons), and furthermore, inhibition of NOS would be expected to enhance Ca2+ influx as NO reduces the NMDA receptor-activated current (Manzoni et al. 1992). It is evident, comparing a and b in Fig. 8A, that the number of neurons which exhibited a large mitochondrial depolarisation during glutamate application was much decreased in the presence of L-NAME. In this experiment only a few neurons (3/16) still showed a substantial mitochondrial depolarisation, suggesting either that mitochondrial depolarisation was due to an NO-independent mechanism in these cells, or that not all NO production was inhibited in this culture. L-NAME (100 μM) had no effect on either [Ca2+]c or mitochondrial potential when applied on its own as a control. Similar qualitative results were seen with the NOS inhibitor N-monomethyl-L-arginine (L-NMMA) (data not shown).
Figure 8. Glutamate-induced loss of ΔΨm is also dependent on the production of nitric oxide (NO).
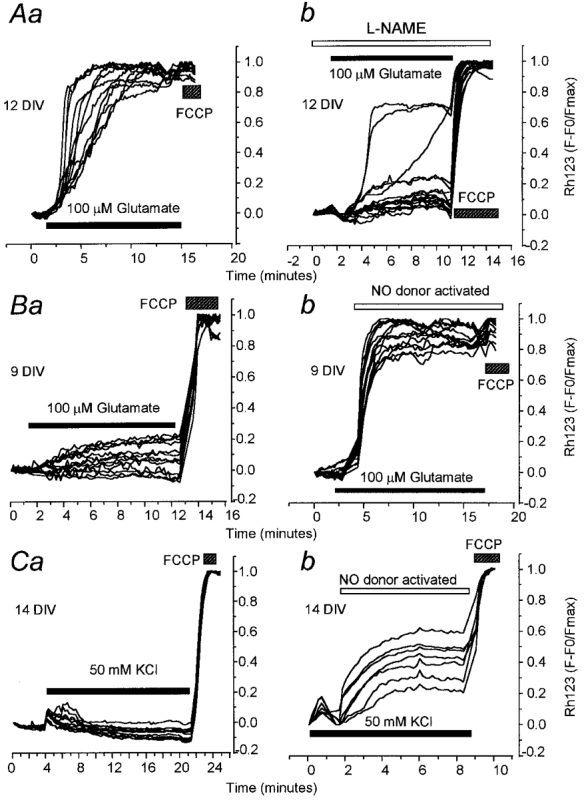
A, glutamate-induced mitochondrial depolarisation can be blocked by inhibition of NOS. In Aa we show a typical control mitochondrial response to application of 100 μM glutamate (with 10 μM glycine) in hippocampal cultures at 12 DIV. The response from 12 neurons in one typical experiment is shown. Rh123 fluorescence is shown normalised to baseline and FCCP response (F − F0/Fmax). Ab, a sister culture was pre-incubated for 30 min with the NOS inhibitor L-NAME (100 μM) before exposure to glutamate (100 μM with 10 μM glycine). Traces are shown to illustrate the responses of 16 neurons, showing a dramatic suppression of the mitochondrial response to glutamate. L-NAME (100 μM) was present throughout the experiment as indicated. In cells of 9 DIV, an innocuous glutamate exposure (100 μM) caused mitochondrial depolarisation if combined with exogenous NO. In Ba we show characteristic mitochondrial responses to glutamate in neurons at 9 DIV, showing a progressive but modest mitochondrial depolarisation. Bb, the NO donor was added to a sister culture together with the glutamate and glycine, and was activated when the UV light was applied to the cells (open bar). Glutamate addition clearly caused a profound mitochondrial depolarisation under these conditions. In Ca, typical mitochondrial responses to KCl for 10 min in cells at 14 DIV are shown. Cb, addition of the NO donor to the culture in solution with the KCl, and activation by UV light (open bar) caused a substantial loss of mitochondrial potential.
The converse experiment was to expose cells to NO in combination with a calcium load through a mechanism that did not otherwise routinely dissipate ΔΨm, e.g. glutamate addition to a culture at 7–10 DIV (Fig. 8B a), or KCl exposure (Fig. 8C a). In the present experiments, exposure to NO was achieved using 500 μM of the caged NO donor nitrosylpentachloruthenate (K2Ru(NO)Cl5) (Bettache et al. 1996), which allows temporal control of the generation of NO, and thus limits the potential for reaction of NO with buffer components. In an attempt to generate a continuous exposure to low levels of NO, the standard illumination routinely used to excite the fura-2 signal was used to photolyse the caged compound. Uncaging the NO alone under these conditions had no effect on [Ca2+]c, but in some cells, caused a very small increase in Rh123 fluorescence, suggesting that the NO generated caused a small mitochondrial depolarisation (the mean change in the fractional increase in Rh123 fluorescence was 1.3 ± 0.2 (F/F0; value expressed normalised to baseline and the response to FCCP (F − F0/Fmax), 0.07 ± 0.02, n = 74 neurons), most probably through a direct inhibition of mitochondrial respiration (Brorson et al. 1999). However, in cells at 7–10 DIV, when 100 μM glutamate failed to cause any consistent or significant mitochondrial depolarisation, addition of 100 μM glutamate with 500 μM of the caged NO donor dramatically enhanced the mitochondrial depolarisation. Thus, in matched controls, the mean increase in the Rh123 fluorescence normalised to baseline and the FCCP response was 0.20 ± 0.09 (n = 162 neurons; Fig. 8B a), while in the presence of the NO donor, the Rh123 fluorescence signal increased to 0.80 ± 0.2 (n = 202 neurons; Fig. 8B b). Similarly, in cells exposed to 50 mM KCl in which a substantial mitochondrial depolarisation was never seen, addition of the caged NO donor (500 μM) caused a dramatic mitochondrial depolarisation. Thus, the mean increase in Rh123 fluorescence to KCl alone (normalised to baseline and the FCCP response) was only 0.06 ± 0.01 (n = 71 neurons; matched controls for the NO donor experiments; Fig. 8C a), while the signal increased to 0.58 ± 0.1 (n = 62 neurons; Fig. 8C b) in the presence of the NO donor.
Experimental controls were conducted with the NO donor present but not activated by UV light, and light-inactivated NO donor was also used to assess the specificity of the response to NO released by the donor. These control conditions did not evoke any mitochondrial depolarisation. To further confirm that the responses were specific to NO, the mitochondrial depolarisation evoked by the NO donor in combination with glutamate was prevented by co-incubation with 100 μM haemoglobin (Hb) which acts as a scavenger for NO. In the presence of Hb, the Rh123 fluorescence increased to 1.6 ± 0.4 (F/F0; value expressed normalised to baseline and the response to FCCP (F − F0/Fmax), 0.25 ± 0.1, n = 42 neurons), confirming that the responses were due to release of NO and not to other photochemical products released on photolysis of the compound.
Thus, on the one hand, the glutamate-dependent loss of mitochondrial potential could be mitigated by inhibition of NOS activity, while, on the other, innocuous stimuli were apparently converted to stimuli that could cause a significant mitochondrial depolarisation through the addition of NO.
In order to help clarify the relationships between the NO- and Ca2+-induced mitochondrial depolarisation and the consequential perturbation of Ca2+ homeostasis (Vergun et al. 1999), the caged NO donor nitrosylpentachloruthenate (K2Ru(NO)Cl5) was used to trigger mitochondrial depolarisation in cells at 7–10 DIV that had exhibited neither a profound mitochondrial depolarisation nor a secondary [Ca2+]c increase. In these cases, addition of the NO donor promoted a collapse of ΔΨm (Fig. 9A) which was only then followed by a secondary rise in [Ca2+]c; the fura-2FF ratio rose from 0.97 ± 0.05 before mitochondrial depolarisation to 1.60 ± 0.26 after mitochondrial depolarisation (n = 70 neurons). This secondary increase in fura-2FF ratio was similar to that routinely seen during the secondary [Ca2+]c increase in cells at 12–16 DIV, where the fura-2FF ratio rose to 1.83 ± 0.37 (n = 98 neurons).
Figure 9. Mitochondrial depolarisation requires the synergistic effects of [Ca2+]c and NO, and leads to a secondary increase in fura-2FF ratio.
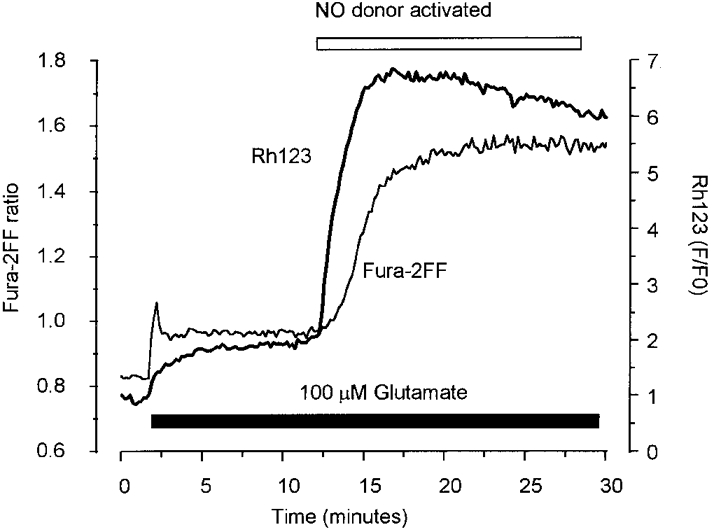
Records showing changes in fura-2FF and Rh123 from a neuron (at 7 DIV) exposed to 100 μM glutamate (and 10 μM glycine) followed by addition of the NO donor potassium nitrosylpentachloruthenate (500 μM; open bar). The addition of the NO in the presence of glutamate caused a large mitochondrial depolarisation which was followed by a secondary large rise in [Ca2+]c. Rh123 fluorescence is shown normalised to baseline (F/F0).
In conclusion, these data strongly suggest that the mitochondrial depolarisation apparent during glutamate toxicity in hippocampal neurons requires both an increased cytosolic Ca2+ and the production of NO. During glutamate exposure, hippocampal neurons initially exhibit a primary increase in [Ca2+]c followed by a secondary [Ca2+]c increase which can only be effectively measured with low affinity Ca2+ indicators. This secondary [Ca2+]c increase is absent in hippocampal neurons which do not exhibit a profound loss of ΔΨm, and the origin of this secondary [Ca2+]c deregulation is the subject of further study.
DISCUSSION
Mitochondrial dysfunction and excitotoxicity in hippocampal neurons
While Ca2+ influx through the NMDA ionotropic glutamate receptor has been unambiguously defined as an essential trigger for glutamate-induced neuronal cell death, the precise mechanisms that couple a rise in [Ca2+]c to cell death have remained controversial. The mitochondrion has increasingly been seen as a central player in the excitotoxic cascade. However, although a glutamate-induced loss of ΔΨm has been considered for some time now to play a role in excitotoxicity (Ankarcrona et al. 1996; Schinder et al. 1996; White & Reynolds, 1996) the mechanism that leads to the collapse of ΔΨm remains ill defined. Our present data show that glutamate-induced mitochondrial depolarisation requires the synergistic action of both Ca2+ and the oxidant NO.
These data provide a basis for formulating a model of excitotoxic cell death in hippocampal neurons which proposes that Ca2+ influx following glutamate receptor activation stimulates production of NO (Strijbos et al. 1996) in concert with substantial mitochondrial Ca2+ uptake (White & Reynolds, 1997; Peng & Greenamyre, 1998). The combination of high mitochondrial Ca2+ and NO production apparently induces mitochondrial depolarisation, which if not rapidly reversed, establishes a progression to cell death. Complete mitochondrial depolarisation would limit further mitochondrial Ca2+ uptake. This could sustain a high [Ca2+]c and thus be harmful to the cell. Alternatively it is conceivable that limiting mitochondrial Ca2+ accumulation would play a part in neuroprotection (Stout et al. 1998). The loss of mitochondrial potential would obviously also limit ATP production. Indeed, these conditions could promote mitochondrial ATP consumption by the reverse mode of the ATP synthase. We have previously shown (Vergun et al. 1999) that the re-establishment of Ca2+ homeostasis in hippocampal neurons is clearly correlated with the degree of mitochondrial depolarisation during glutamate exposure. Thus, in these neurons, which are particularly vulnerable to excitotoxicity (Limbrick et al. 1995), a prolonged, pathological mitochondrial depolarisation induced by Ca2+ and NO may produce a profound energy depletion and a resultant collapse of ionic gradients, ultimately leading to cell death.
The role of NO in mitochondrial dysfunction
Previous studies have suggested a role for NO in acute mitochondrial dysfunction. For example, Brorson et al. (1997) reported that an exogenous NO donor increased the peak amplitude of KCl-induced [Ca2+]c transients and impaired [Ca2+]c removal, and further suggested that mitochondria could be a primary target of NO action in hippocampal neurons. Our own data suggest that NO alone at low concentrations may cause a small mitochondrial depolarisation which would limit mitochondrial Ca2+ uptake and ATP production. Recent work (Brorson et al. 1999) demonstrated that higher (micromolar) concentrations of NO can produce a rapid, reversible depolarisation of mitochondrial membrane potential, confirming that mitochondrial function may be a prime target for the action of NO. The prolonged, pathological loss of ΔΨm during glutamate toxicity would suggest that NO production must be sustained if the mitochondrial dysfunction is truly NO dependent. The observation that cultured striatal neurons exposed for 5 min to NMDA generated NO continuously for up to 16 h is consistent with this hypothesis (Strijbos et al. 1996).
A role for NO in the source-specificity model of excitotoxicity
Our data suggest that the profound mitochondrial depolarisation that follows glutamate exposure depends on both Ca2+ loading and NO production. According to the ‘source-specificity’ hypothesis (see Tymianski et al. 1993; and more recently Sattler et al. 1998) phenomena such as Ca2+-dependent mitochondrial damage are not simply due to excessive mitochondrial Ca2+ accumulation but rather are due to neurotoxic processes triggered by Ca2+ ions before their sequestration. However, it seems that mitochondrial Ca2+ accumulation is itself a prerequisite for excitotoxic neuronal death (Stout et al. 1998). The synergistic action of Ca2+ and NO in producing mitochondrial dysfunction may in part reconcile these conflicting hypotheses, in that mitochondrial Ca2+ accumulation is necessary but the production of NO may also play a major role in defining the toxicity of NMDA-dependent Ca2+ influx. The puzzle remains that similar early increases in [Ca2+]c in response to KCl or glutamate, or, indeed, in response to glutamate in ‘younger’ cultures have such profoundly different effects on the mitochondria. Kiedrowski et al. (1992) reported that the Ca2+ dependence of NO production itself showed a source specificity, in that the ionophore A23187 induced a fourfold greater increase in Ca2+ influx compared to NMDA, and yet the two drugs produced similar increases in NOS activity. Kiedrowski et al. (1992) suggested that NOS may be localised in subcellular compartments where the Ca2+ concentration is regulated by the NMDA receptor. Recently, studies have indicated the co-localisation of glutamate receptor subunits with neuronal NOS (Catania et al. 1995; Weiss et al. 1998). Thus, cytosolic NOS may be spatially localised such that microdomains of high [Ca2+]c resulting from Ca2+ influx through NMDA receptors activate NOS more effectively than similar global increases in [Ca2+]c through alternative pathways. Intriguingly, a Ca2+-dependent mitochondrial NOS (mNOS) has been described in liver mitochondria (Ghafourifar & Richter, 1997), and it is plausible that a mNOS is also present in neurons. Mitochondria appear to accumulate Ca2+ preferentially following NMDA receptor activation than following Ca2+ influx through kainate- or voltage-activated Ca2+ channels (Peng & Greenamyre, 1998), and so it is conceivable that preferential mitochondrial Ca2+ accumulation in response to NMDA would stimulate mNOS more readily than Ca2+ influx through other sources. Indeed, perhaps the source-specificity hypothesis could be more readily explained by an excitotoxic locus located in mitochondria, such that preferential or increased mitochondrial accumulation of Ca2+ channelled through NMDA receptors provokes higher toxicity as a response to increased mNOS activation. Of course these two possible pathways of NO production are not mutually exclusive and glutamate application may well lead to NO production from both cytosolic and mitochondrial compartments.
Developmental changes in the susceptibility to mitochondrial dysfunction
We have exploited differences in glutamate toxicity seen in neuronal cultures at different stages in vitro to clarify the mechanisms involved in glutamate-induced mitochondrial depolarisation. In hippocampal cells kept in culture for shorter periods, glutamate exposure did not precipitate mitochondrial dysfunction. Eimerl & Schramm (1994) reported that NMDA exposure produced similar 45Ca2+ uptake in cerebellar granule cells cultured for 9 and 16 days, but a much lower degree of toxicity in the younger cultures, suggesting the expression of a ‘Ca2+-dependent lethal process’ in the older cultures. Many cellular properties, such as levels of antioxidant enzymes can alter during the course of culture maturation, and this observation supports the notion that toxicity cannot be dependent on Ca2+ alone, but must involve other variables. Our data agree with these findings and further suggest that mitochondrial dysfunction plays a major role in the toxic process which occurs uniquely in the older hippocampal cultures.
These data are all consistent with the documented increase in expression of cytosolic NOS with development, the number of nNOS-positive cells increasing after 7 postnatal days (Matsumoto et al. 1993; Tenório et al. 1995). No developmental study of mNOS has yet been reported. Dawson et al. (1993) found that nNOS was not initially expressed in primary cultures of cortex, caudate and hippocampus, but developed between 14 and 21 days in culture. Dawson & Dawson (1996b) also remarked on the failure of nNOS expression in serum-free cultures, and this observation, alongside reports that higher potassium concentrations (25 mM) frequently used for cultured cerebellar granule cells reduce nNOS expression (Tascedda et al. 1996), may underlie some of the confusion in the literature in this area. Our data suggest that the lack of mitochondrial depolarisation during exposure of younger cultures to glutamate may reflect a lower production of NO in these cells, or a relative insensitivity to NO, possibly due to higher levels of antioxidant enzymes. This was then by-passed experimentally by the addition of exogenous NO, and a combination of glutamate and exogenous NO precipitated a large mitochondrial depolarisation.
NO or peroxynitrite?
Although NO has been implicated in glutamate toxicity for some time, and mitochondrial dysfunction is now accepted as a key determinant of toxicity, the first link between excitotoxicity, NO production and mitochondrial dysfunction was reported only recently (Almeida et al. 1999). However, it has been known for some time that glutamate excitotoxicity involves an increased production of both NO and other reactive oxygen species, including superoxide (Gunasekar et al. 1995). Previous evidence has suggested that the toxicity of NO depends on the presence of the superoxide anion and the formation of peroxynitrite (Lipton & Rosenberg, 1994). It is therefore possible that glutamate toxicity is dependent on the combined increased production of superoxide anions from the mitochondrial respiratory chain (Lafon-Cazal et al. 1993) and an increased production of NO, forming peroxynitrite. This is outside the scope of this present study but is a current focus of this laboratory. This issue is difficult to resolve in intact neurons, because, as recently discussed by Brorson et al. (1999), manipulations to alter superoxide levels are extracellular, but the primary source of superoxide is the mitochondrial respiratory chain, and this is difficult to alter experimentally in isolation from other cellular effects. Brorson & Zhang (1997) did report, however, that the toxicity of an NO donor was not attenuated by concurrent scavenging of superoxide anions during exposure to the donor, and suggested that the initial disruption of Ca2+ homeostasis was dependent on NO itself rather than peroxynitrite. However, in the same study, addition of scavengers of superoxide during a long term recovery period attenuated the NO-induced toxicity, suggesting that superoxide itself or in combination with NO to form peroxynitrite is involved in neurotoxicity after the acute phase of NO-induced [Ca2+]c deregulation. Thus, it is possible that mitochondrial dysfunction is induced by the combined action of Ca2+ and NO during the acute period of glutamate exposure, followed by an increased production of superoxide from the damaged mitochondrial respiratory chain which leads to a later cascade of events culminating in neuronal death. Interestingly, recent evidence suggests that nNOS-positive neurons are enriched in mitochondrial manganese superoxide dismutase and also show decreased susceptibility to excitotoxicity (Gonzalez-Zulueta et al. 1998). Furthermore, work detailed in a recent review (Nicholls & Budd, 1998) seems to suggest that the delayed failure of calcium homeostasis is, at least in part, due to superoxide-dependent damage of neuronal calcium extrusion mechanisms.
Neuronal Ca2+ load and the use of cytosolic calcium indicators
A lack of correlation between the magnitude of stimulation-induced increases in [Ca2+]c and subsequent toxicity has contributed to the controversy over whether it is the absolute calcium load, or the identity of the influx pathway, that is the prime determinant of death. The recent use of low affinity calcium indicators has seemed to help clarify this debate, in that glutamate-evoked changes in [Ca2+]c measured with these indicators appear significantly larger than those evoked by non-toxic KCl and kainate exposure (Stout & Reynolds, 1999).
Direct comparison of data gathered using the high affinity calcium indicator fura-2 with that using the low affinity indicator fura-2FF is helping to clarify the Ca2+ dynamics that occur during glutamate toxicity. We have found here that the initial increase in the fura-2 or fura-2FF ratios is similar in cells exposed to KCl or glutamate (in young or older cultures). However after the onset of mitochondrial depolarisation, the [Ca2+]c measured with fura-2FF is profoundly different in the different groups. This is not in direct disagreement with previous work reporting differences in [Ca2+]c in cells exposed to KCl or glutamate (Stout et al. 1998) because these comparisons were made after 5 min of exposure, and the functional state of the mitochondria was not determined. In our hands, fura-2 was not simply saturating globally during glutamate stimulation (Hyrc et al. 1997) because further increases could be measured during ionomycin application. It seems likely that there are Ca2+ microdomains in which the dye is saturated and where further increases in [Ca2+] are not registered. The use of fura-2FF allows these further increases in [Ca2+]c in specific regions of the cell to be recorded. Our simultaneous measurements of changes in fura-2FF ratio and the loss of ΔΨm help clarify this relationship. The initial [Ca2+]c increases during KCl or glutamate stimulation, which presumably define the subsequent events, can apparently be measured using fura-2. Uniquely in the case of glutamate exposure, a profound mitochondrial depolarisation ensues following the concerted action of Ca2+ and NO, and this could lead to the local release of Ca2+ into the immediate vicinity of the mitochondria. This is only detectable with the low affinity indicator fura-2FF, because in the case of fura-2 the dye molecules surrounding mitochondria are already saturated.
The use of either fura-2 or fura-2FF to measure [Ca2+]c in an attempt to glean information about neuronal calcium loading may still be problematic. Our data show no significant differences between the initial change in ratio of either fura-2 or fura-2FF when comparing the effects of KCl and glutamate. However, application of FCCP caused a further increase in fura-2FF ratio in glutamate-treated neorons but not in KCl-treated neurons. The application of exogenous NO also caused profound mitochondrial depolarisation in the presence of glutamate but a significantly increased but not complete depolarisation in KCl-treated neurons. From these data one could therefore argue that the mitochondrial Ca2+ loading is different between these two stimuli, and this remains to be adequately addressed. Fluorescence studies of mitochondrial [Ca2+] using the indicator of choice, rhod-2, may suffer similar problems of saturation to those using the high affinity cytosolic calcium indicators, because the KD of rhod-2 is only 570 nM (Molecular Probes Handbook, 6th edition). Studies of 45Ca2+ uptake into neurons may also be problematic if used to try to compare degrees of cellular Ca2+ loading between different stimuli over a prolonged time course. Our previous data (Vergun et al. 1999) show that Ca2+ homeostasis is altered over a relatively short time period (less than 10 min) in neurons exhibiting profound mitochondrial depolarisation. 45Ca2+ taken into neurons during glutamate stimulation may not be extruded because of inhibition of efflux mechanisms (Castilho et al. 1998), which correlates with mitochondrial dysfunction, and this could be incorrectly interpreted to reflect a greater degree of Ca2+ accumulation when compared to conditions in which efflux mechanisms are unaffected. Simultaneous measurements of cytosolic and mitochondrial [Ca2+], ΔΨm and Ca2+ efflux mechanisms would help to clarify these issues.
Conclusions
We conclude that glutamate-induced cell death involves a profound mitochondrial depolarisation that appears to require the synergistic action of Ca2+ and NO. Current publications suggest that the depolarisation is mediated by opening of the mitochondrial permeability transition pore (MPTP; Schinder et al. 1996; Crompton et al. 1988; but see Castilho et al. 1998), but work is still in progress in an attempt to provide an unambiguous definition of the fundamental processes involved (see also Duchen, 1999). Whatever the mechanism, neurons exhibiting mitochondrial depolarisation undergo a delayed secondary increase in [Ca2+]c, which can only be adequately detected with low affinity cytosolic calcium indicators, and which progresses to prolonged perturbation of Ca2+ homeostasis (Vergun et al. 1999), and ultimately to cell death.
Acknowledgments
This work has been funded by the Wellcome Trust and the Royal Society. We would like to gratefully acknowledge the work of Ms D. L. Patterson who conducted all of the cell culture. We also thank Mr D. ‘Jake’ Jacobson, Drs Eric Boitier and Mart Mojet and Professors Steve Bolsover and Boris Khodorov for their insightful discussions pertaining to this work, and for critical reading of the manuscript.
References
- Almeida A, Bolaños JP, Medina JM. Nitric oxide mediates glutamate-induced mitochondrial depolarization in rat cortical neurons. Brain Research. 1999;816:580–586. doi: 10.1016/s0006-8993(98)01240-2. [DOI] [PubMed] [Google Scholar]
- Ankarcrona M, Dypbukt JM, Orrenius S, Nicotera P. Calcineurin and mitochondrial function in glutamate-induced neuronal cell death. FEBS Letters. 1996;394:321–324. doi: 10.1016/0014-5793(96)00959-3. [DOI] [PubMed] [Google Scholar]
- Bettache N, Carter T, Corrie J, Ogden D, Trentham D. Methods in Enzymology. Vol. 28. New York: Academic Press; 1996. Photolabile donors of nitric oxide: Ruthenium nitrosyl chlorides as caged nitric oxide; pp. 266–280. [DOI] [PubMed] [Google Scholar]
- Brorson JR, Schumacker PT, Zhang H. Nitric oxide acutely inhibits neuronal energy production. The Committees on Neurobiology and Cell Physiology. Journal of Neuroscience. 1999;19:147–158. doi: 10.1523/JNEUROSCI.19-01-00147.1999. [DOI] [PMC free article] [PubMed] [Google Scholar]
- Brorson JR, Sulit RA, Zhang H. Nitric oxide disrupts Ca2+ homeostasis in hippocampal neurons. Journal of Neurochemistry. 1997;68:95–105. doi: 10.1046/j.1471-4159.1997.68010095.x. [DOI] [PubMed] [Google Scholar]
- Brorson JR, Zhang H. Disrupted [Ca2+]i homeostasis contributes to the toxicity of nitric oxide in cultured hippocampal neurons. Journal of Neurochemistry. 1997;69:1882–1889. doi: 10.1046/j.1471-4159.1997.69051882.x. [DOI] [PubMed] [Google Scholar]
- Castilho RF, Hansson O, Ward MW, Budd SL, Nicholls DG. Mitochondrial control of acute glutamate excitotoxicity in cultured cerebellar granule cells. Journal of Neuroscience. 1998;18:10277–10286. doi: 10.1523/JNEUROSCI.18-24-10277.1998. [DOI] [PMC free article] [PubMed] [Google Scholar]
- Catania MV, Tölle TR, Monyer H. Differential expression of AMPA receptor subunits in NOS-positive neurons of cortex, striatum, and hippocampus. Journal of Neuroscience. 1995;15:7046–7061. doi: 10.1523/JNEUROSCI.15-11-07046.1995. [DOI] [PMC free article] [PubMed] [Google Scholar]
- Choi DW, Rothman SM. The role of glutamate neurotoxicity in hypoxic-ischemic neuronal death. Annual Review of Neuroscience. 1990;13:171–182. doi: 10.1146/annurev.ne.13.030190.001131. [DOI] [PubMed] [Google Scholar]
- Crompton M, Ellinger H, Costi A. Inhibition by cyclosporin A of a Ca2+-dependent pore in heart mitochondria activated by inorganic phosphate and oxidative stress. Biochemical Journal. 1988;255:357–360. [PMC free article] [PubMed] [Google Scholar]
- Dalkara T, Moskowitz MA. The complex role of nitric oxide in the pathophysiology of focal cerebral ischemia. Brain Pathology. 1994;4:49–57. doi: 10.1111/j.1750-3639.1994.tb00810.x. [DOI] [PubMed] [Google Scholar]
- Dawson VL, Dawson TM. Nitric oxide actions in neurochemistry. Neurochemistry International. 1996a;29:97–110. doi: 10.1016/0197-0186(95)00149-2. [DOI] [PubMed] [Google Scholar]
- Dawson VL, Dawson TM. Nitric oxide neurotoxicity. Journal of Chemical Neuroanatomy. 1996b;10:179–190. doi: 10.1016/0891-0618(96)00148-2. [DOI] [PubMed] [Google Scholar]
- Dawson VL, Dawson TM, Bartley DA, Uhl GR, Snyder SH. Mechanisms of nitric oxide-mediated neurotoxicity in primary brain cultures. Journal of Neuroscience. 1993;13:2651–2661. doi: 10.1523/JNEUROSCI.13-06-02651.1993. [DOI] [PMC free article] [PubMed] [Google Scholar]
- Dawson VL, Dawson TM, London ED, Bredt DS, Snyder SH. Nitric oxide mediates glutamate neurotoxicity in primary cortical cultures. Proceedings of the National Academy of Sciences of the USA. 1991;88:6368–6371. doi: 10.1073/pnas.88.14.6368. [DOI] [PMC free article] [PubMed] [Google Scholar]
- Dawson TM, Dawson VL, Snyder SH. Molecular mechanisms of nitric oxide actions in the brain. Annals of the New York Academy of Sciences. 1994;738:76–85. doi: 10.1111/j.1749-6632.1994.tb21792.x. [DOI] [PubMed] [Google Scholar]
- Dubinsky JM, Kristal BS, Elizondo-Fournier M. An obligate role for oxygen in the early stages of glutamate-induced, delayed neuronal death. Journal of Neuroscience. 1995;15:7071–7078. doi: 10.1523/JNEUROSCI.15-11-07071.1995. [DOI] [PMC free article] [PubMed] [Google Scholar]
- Duchen MR. Ca(2+)-dependent changes in the mitochondrial energetics in single dissociated mouse sensory neurons. Biochemical Journal. 1992;283:41–50. doi: 10.1042/bj2830041. [DOI] [PMC free article] [PubMed] [Google Scholar]
- Duchen MR. Contributions of mitochondria to animal physiology: from homeostatic sensor to calcium signalling and cell death. The Journal of Physiology. 1999;516:1–17. doi: 10.1111/j.1469-7793.1999.001aa.x. [DOI] [PMC free article] [PubMed] [Google Scholar]
- Duchen MR, Biscoe TJ. Relative mitochondrial membrane potential and [Ca2+]i in type I cells isolated from the rabbit carotid body. The Journal of Physiology. 1992;450:33–61. doi: 10.1113/jphysiol.1992.sp019115. [DOI] [PMC free article] [PubMed] [Google Scholar]
- Dugan LL, Sensi SL, Canzoniero LM, Handran SD, Rothman SM, Lin TS, Goldberg MP, Choi DW. Mitochondrial production of reactive oxygen species in cortical neurons following exposure to N-methyl-D-aspartate. Journal of Neuroscience. 1995;15:6377–6388. doi: 10.1523/JNEUROSCI.15-10-06377.1995. [DOI] [PMC free article] [PubMed] [Google Scholar]
- Eimerl S, Schramm M. The quantity of calcium that appears to induce neuronal death. Journal of Neurochemistry. 1994;62:1223–1226. doi: 10.1046/j.1471-4159.1994.62031223.x. [DOI] [PubMed] [Google Scholar]
- Garthwaite G, Garthwaite J. Nitric oxide does not mediate acute glutamate neurotoxicity, nor is it neuroprotective, in rat brain slices. Neuropharmacology. 1994;33:1431–1438. doi: 10.1016/0028-3908(94)90046-9. [DOI] [PubMed] [Google Scholar]
- Ghafourifar P, Richter C. Nitric oxide synthase activity in mitochondria. FEBS Letters. 1997;418:291–296. doi: 10.1016/s0014-5793(97)01397-5. [DOI] [PubMed] [Google Scholar]
- Gonzalez-Zulueta M, Ensz LM, Mukhina G, Lebovitz RM, Zwacka RM, Engelhardt JF, Oberley LW, Dawson VL, Dawson TM. Manganese superoxide dismutase protects nNOS neurons from NMDA and nitric oxide-mediated neurotoxicity. Journal of Neuroscience. 1998;18:2040–2055. doi: 10.1523/JNEUROSCI.18-06-02040.1998. [DOI] [PMC free article] [PubMed] [Google Scholar]
- Gunasekar PG, Kanthasamy AG, Borowitz JL, Isom GE. NMDA receptor activation produces a concurrent generation of nitric oxide and reactive oxygen species: implication for cell death. Journal of Neurochemistry. 1995;65:2016–2021. doi: 10.1046/j.1471-4159.1995.65052016.x. [DOI] [PubMed] [Google Scholar]
- Henke W, Cetinsoy C, Jung K, Loening S. Non-hyperbolic calcium calibration curve of fura-2: implications for the reliability of quantitative Ca2+ measurements. Cell Calcium. 1996;20:287–292. doi: 10.1016/s0143-4160(96)90034-2. [DOI] [PubMed] [Google Scholar]
- Hyrc K, Handran SD, Rothman SM, Goldberg MP. Ionized intracellular calcium concentration predicts excitotoxic neuronal death: observations with low-affinity fluorescent calcium indicators. Journal of Neuroscience. 1997;17:6669–6677. doi: 10.1523/JNEUROSCI.17-17-06669.1997. [DOI] [PMC free article] [PubMed] [Google Scholar]
- Kashii S, Mandai M, Kikuchi M, Honda Y, Tamura Y, Kaneda K, Akaike A. Dual actions of nitric oxide in N-methyl-D-aspartate receptor-mediated neurotoxicity in cultured retinal neurons. Brain Research. 1996;711:93–101. doi: 10.1016/0006-8993(95)01330-x. [DOI] [PubMed] [Google Scholar]
- Keelan J, Hersson-Ringskog J, Sioftanos G, Sritharan K, Vergun O, Duchen MR. Nitric oxide contributes to glutamate-induced mitochondrial dysfunction in rat hippocampal neurones in culture. The Journal of Physiology. 1998;511.P:122–123. P. [Google Scholar]
- Kiedrowski L, Costa E, Wroblewski JT. In vitro interaction between cerebellar astrocytes and granule cells: a putative role for nitric oxide. Neuroscience Letters. 1992;135:59–61. doi: 10.1016/0304-3940(92)90135-t. [DOI] [PubMed] [Google Scholar]
- Lafon-Cazal M, Pietri S, Culcasi M, Bockaert J. NMDA-dependent superoxide production and neurotoxicity. Nature. 1993;364:535–537. doi: 10.1038/364535a0. [DOI] [PubMed] [Google Scholar]
- Limbrick DDJ, Churn SB, Sombati S, DeLorenzo RJ. Inability to restore resting intracellular calcium levels as an early indicator of delayed neuronal cell death. Brain Research. 1995;690:145–156. doi: 10.1016/0006-8993(95)00552-2. [DOI] [PubMed] [Google Scholar]
- Lipton SA, Rosenberg PA. Excitatory amino acids as a final common pathway for neurologic disorders. New England Journal of Medicine. 1994;330:613–622. doi: 10.1056/NEJM199403033300907. [DOI] [PubMed] [Google Scholar]
- Manzoni O, Prezeau L, Marin P, Deshager S, Bockaert J, Fagni L. Nitric oxide-induced blockade of NMDA receptors. Neuron. 1992;8:653–662. doi: 10.1016/0896-6273(92)90087-t. [DOI] [PubMed] [Google Scholar]
- Matsumoto T, Pollock JS, Nakane M, Förstermann U. Developmental changes of cytosolic and particulate nitric oxide synthase in rat brain. Brain Research, Developmental Brain Research. 1993;73:199–203. doi: 10.1016/0165-3806(93)90139-2. [DOI] [PubMed] [Google Scholar]
- Meldrum B, Garthwaite J. Excitatory amino acid neurotoxicity and neurodegenerative disease. Trends in Pharmacological Sciences. 1990;11:379–387. doi: 10.1016/0165-6147(90)90184-a. [DOI] [PubMed] [Google Scholar]
- Michaels RL, Rothman SM. Glutamate neurotoxicity in vitro: antagonist pharmacology and intracellular calcium concentrations. Journal of Neuroscience. 1990;10:283–292. doi: 10.1523/JNEUROSCI.10-01-00283.1990. [DOI] [PMC free article] [PubMed] [Google Scholar]
- Nicholls DG, Budd SL. Mitochondria and neuronal glutamate excitotoxicity. Biochimica et Biophysica Acta. 1998;1366:97–112. doi: 10.1016/s0005-2728(98)00123-6. [DOI] [PubMed] [Google Scholar]
- Nowicky AV, Duchen MR. Changes in [Ca2+]i and membrane currents during impaired mitochondrial metabolism in dissociated rat hippocampal neurons. The Journal of Physiology. 1998;507:131–145. doi: 10.1111/j.1469-7793.1998.131bu.x. [DOI] [PMC free article] [PubMed] [Google Scholar]
- Peng TI, Greenamyre JT. Privileged access to mitochondria of calcium influx through N-methyl-D-aspartate receptors. Molecular Pharmacology. 1998;53:974–980. [PubMed] [Google Scholar]
- Sattler R, Charlton MP, Hafner M, Tymianski M. Distinct influx pathways, not calcium load, determine neuronal vulnerability to calcium neurotoxicity. Journal of Neurochemistry. 1998;71:2349–2364. doi: 10.1046/j.1471-4159.1998.71062349.x. [DOI] [PubMed] [Google Scholar]
- Schinder AF, Olson EC, Spitzer NC, Montal M. Mitochondrial dysfunction is a primary event in glutamate neurotoxicity. Journal of Neuroscience. 1996;16:6125–6133. doi: 10.1523/JNEUROSCI.16-19-06125.1996. [DOI] [PMC free article] [PubMed] [Google Scholar]
- Schulz JB, Matthews RT, Klockgether T, Dichgans J, Beal MF. The role of mitochondrial dysfunction and neuronal nitric oxide in animal models of neurodegenerative diseases. Molecular and Cellular Biochemistry. 1997;174:193–197. [PubMed] [Google Scholar]
- Schweizer M, Richter C. Nitric oxide potently and reversibly deenergizes mitochondria at low oxygen tension. Biochemical and Biophysical Research Communications. 1994;204:169–175. doi: 10.1006/bbrc.1994.2441. [DOI] [PubMed] [Google Scholar]
- Stout A, Raphael H, Kanterewicz B, Klann E, Reynolds I. Glutamate-induced neuron death requires mitochondrial calcium uptake. Nature Neuroscience. 1998;1:366–372. doi: 10.1038/1577. [DOI] [PubMed] [Google Scholar]
- Stout A, Reynolds I. High-affinity calcium indicators underestimate increases in intracellular calcium concentrations associated with excitotoxic glutamate stimulations. Neuroscience. 1999;89:91–100. doi: 10.1016/s0306-4522(98)00441-2. [DOI] [PubMed] [Google Scholar]
- Strijbos PJ, Leach MJ, Garthwaite J. Vicious cycle involving Na+ channels, glutamate release, and NMDA receptors mediates delayed neurodegeneration through nitric oxide formation. Journal of Neuroscience. 1996;16:5004–5013. doi: 10.1523/JNEUROSCI.16-16-05004.1996. [DOI] [PMC free article] [PubMed] [Google Scholar]
- Tascedda F, Molteni R, Racagni G, Riva MA. Acute and chronic changes in K(+)-induced depolarization alter NMDA and nNOS gene expression in cultured cerebellar granule cells. Brain Research Molecular Brain Research. 1996;40:171–174. doi: 10.1016/0169-328x(96)00111-8. [DOI] [PubMed] [Google Scholar]
- Tenório F, Giraldi-Guimarães A, Mendez-Otero R. Developmental changes of nitric oxide synthase in the rat superior colliculus. Journal of Neuroscience Research. 1995;42:633–637. doi: 10.1002/jnr.490420505. [DOI] [PubMed] [Google Scholar]
- Tymianski M, Charlton MP, Carlen PL, Tator CH. Source specificity of early calcium neurotoxicity in cultured embryonic spinal neurons. Journal of Neuroscience. 1993;13:2085–2104. doi: 10.1523/JNEUROSCI.13-05-02085.1993. [DOI] [PMC free article] [PubMed] [Google Scholar]
- Tymianski M, Charlton MP, Carlen PL, Tator CH. Properties of neuroprotective cell-permeant Ca2+ chelators: effects on [Ca2+]i and glutamate neurotoxicity in vitro. Journal of Neurophysiology. 1994;72:1973–1992. doi: 10.1152/jn.1994.72.4.1973. [DOI] [PubMed] [Google Scholar]
- Vergun O, Keelan J, Khodorov B, Duchen M. Glutamate-induced mitochondrial depolarization and perturbation of calcium homeostasis in cultured rat hippocampal neurons. The Journal of Physiology. 1999;519:451–466. doi: 10.1111/j.1469-7793.1999.0451m.x. [DOI] [PMC free article] [PubMed] [Google Scholar]
- Weiss SW, Albers DS, Iadarola MJ, Dawson TM, Dawson VL, Standaert DG. NMDAR1 glutamate receptor subunit isoforms in neostriatal, neocortical, and hippocampal nitric oxide synthase neurons. Journal of Neuroscience. 1998;18:1725–1734. doi: 10.1523/JNEUROSCI.18-05-01725.1998. [DOI] [PMC free article] [PubMed] [Google Scholar]
- White RJ, Reynolds IJ. Mitochondrial depolarization in glutamate-stimulated neurons: an early signal specific to excitotoxin exposure. Journal of Neuroscience. 1996;16:5688–5697. doi: 10.1523/JNEUROSCI.16-18-05688.1996. [DOI] [PMC free article] [PubMed] [Google Scholar]
- White RJ, Reynolds IJ. Mitochondria accumulate Ca2+ following intense glutamate stimulation of cultured rat forebrain neurones. The Journal of Physiology. 1997;498:31–47. doi: 10.1113/jphysiol.1997.sp021839. [DOI] [PMC free article] [PubMed] [Google Scholar]