

Abstract
Using RT-PCR, Northern blot analysis, and immunocytochemistry, we confirmed renal expression of proteinase-activated receptor (PAR-2) and demonstrated its presence in native renal epithelial and in cultured M-1 mouse cortical collecting duct (CCD) cells.
We investigated the effects of a PAR-2 activating peptide (AP), corresponding to the tethered ligand that is exposed upon trypsin cleavage, and of trypsin on M-1 cells using patch-clamp, intracellular calcium (fura-2) and transepithelial short-circuit current (ISC) measurements.
In single M-1 cells, addition of AP elicited a concentration-dependent transient increase in the whole-cell conductance. Removal of extracellular Na+ had no effect while removal of Cl− prevented the stimulation of outward currents. The intracellular calcium concentration increased significantly upon application of AP while a Ca2+-free pipette solution completely abolished the electrical response to AP.
In confluent monolayers of M-1 cells, apical application of AP had no effect on ISC whereas subsequent basolateral application elicited a transient increase in ISC. This increase was not due to a stimulation of electrogenic Na+ absorption since the response was preserved in the presence of amiloride.
The ISC response to AP was reduced in the presence of the Cl− channel blocker diphenylamine-2-carboxylic acid on the apical side and abolished in the absence of extracellular Cl−.
Trypsin elicited similar responses to those to AP while application of a peptide (RP) with the reverse amino acid sequence of AP had no effect on whole-cell currents or ISC.
In conclusion, our data suggest that AP or trypsin stimulates Cl− secretion by Ca2+-activated Cl− channels in M-1 CCD cells by activating basolateral PAR-2.
Proteinase-activated receptors (PARs) are a new family of G-protein-coupled membrane receptors for serine proteases (Déry et al. 1998). Proteases cleave within the extracellular N-terminus of PARs, exposing tethered ligand domains that bind and activate the cleaved receptors. Thrombin activates PAR-1, PAR-3 and PAR-4 (Vu et al. 1991; Ishihara et al. 1997; Xu et al. 1998; Kahn et al. 1998), while trypsin and mast cell tryptase activate PAR-2 and possibly PAR-4 (Nystedt et al. 1994; Molino et al. 1997; Xu et al. 1998; Kahn et al. 1998). Synthetic peptides corresponding to the tethered ligands of PARs directly bind and activate the receptors and are useful reagents for investigating receptor functions without the use of proteases, which may have non-specific effects (Vu et al. 1991; Nystedt et al. 1994; Xu et al. 1998; Kahn et al. 1998). PAR-2 is expressed in a wide variety of tissues including the gastrointestinal tract and the kidney (Nystedt et al. 1994). It is found in epithelial cells of various origin and in vascular endothelial cells (Santulli et al. 1995; Böhm et al. 1996b; Hwa et al. 1996; D'Andrea et al. 1998; Nguyen et al. 1999). The proteases that activate PAR-2 in these locations and the physiological function of PAR-2 are still largely unknown (Déry et al. 1998). However, a recent report suggests that in pancreatic duct epithelial cells PAR-2 is involved in the regulation of ion channels and transepithelial ion transport (Nguyen et al. 1999).
Although PAR-2 is expressed in the kidney at very high levels it has not yet been localised to a specific cell type. However, collecting duct, which is responsible for the fine tuning of renal water and electrolyte handling, is a likely target for protease action. The appropriate regulation of the corresponding transport mechanisms is of pivotal importance for the maintenance of overall water and electrolyte balance of the body. Numerous hormones, local mediators and signalling pathways are involved in this regulation and it has been speculated that proteases may also modify collecting duct function. For example, urinary proteases, such as kallikrein and urokinase, have been proposed to have a direct inhibitory effect on the sodium channel (Lewis & Alles, 1986; Lewis & Clausen, 1991) which is the rate-limiting step of sodium re-absorption in the collecting duct. In contrast, aprotinin, a serine protease inhibitor, has been shown to exert an inhibitory effect on the short-circuit current in toad urinary bladder (Orce et al. 1980), cultured A6 Xenopus kidney epithelial cells (Vallet et al. 1997) and in M-1 mouse cortical collecting duct (CCD) cells (Nakhoul et al. 1998). These findings suggest an activating role for serine proteases in the regulation of transepithelial sodium transport. The apparently contradicting results illustrate that the physiological role of renal proteases is still poorly understood. Different types of renal proteases may exist with different intrarenal localisation, signal transduction pathways and cellular effects.
The aim of the present study was to determine the localisation of renal PAR-2 expression and to find evidence for functional PAR-2 in collecting duct cells. As a model system for the mammalian collecting duct we used the M-1 mouse CCD cell line. This cell line is derived from a single microdissected CCD of a mouse transgenic for the early region of simian virus 40 (Stoos et al. 1991) and preserves, under tissue culture conditions, morphological and functional properties typical for CCD principal cells in vivo. In particular, we have demonstrated previously that confluent M-1 cells show amiloride-sensitive electrogenic sodium absorption and express the epithelial sodium channel (ENaC) (Korbmacher et al. 1993; Letz et al. 1995), a hallmark of CCD principal cells. In the present study, we investigated the effects of a PAR-2 activating peptide (AP) and of trypsin on M-1 cells using patch-clamp, intracellular calcium and transepithelial short-circuit current (ISC) measurements. Moreover, we performed immunocytochemistry and RT-PCR experiments using M-1 cells and mouse renal tissue.
Part of this work has been published in abstract form (Letz et al. 1999).
METHODS
Cell culture
The M-1 cell line (ATCC 2038-CRL, American Type Culture Collection, Rockville, MD, USA) was originally obtained from Dr G. Fejes-Tóth (Stoos et al. 1991). Cells were used from passage 21 to 29 and were handled as described previously (Korbmacher et al. 1993; Letz et al. 1995). Cells were maintained in a 5% CO2 atmosphere at 37°C in PC1 culture medium (BioWhittaker, MD, USA), supplemented with 2 mM glutamine, 100 U ml−1 penicillin and 100 μg ml−1 streptomycin. For patch-clamp experiments, cells were seeded onto glass coverslips (Baxter Scientific Products, McGaw Park, IL, USA) and were used as single cells without contact with neighbouring cells 1–2 days after seeding. For transepithelial studies, cells were seeded onto 12 mm diameter Millicell-HA culture plate inserts (Millipore Corporation, Bedford, MA, USA). Cells were grown to confluence and transepithelial voltage (Vte) and resistance (Rte) of the cultures were routinely checked using a EVOM epithelial volt-ohm-meter (World Precision Instruments, Inc., Sarasota, FL, USA). For immunocytochemistry, M-1 cells were grown on Cellagen discs (ICN Biomedical Inc., Aurora, OH, USA).
Patch-clamp technique
The ruptured-patch whole-cell configuration of the patch-clamp technique was used (Hamill et al. 1981) and experimental procedures were essentially as described previously (Meyer & Korbmacher, 1996). The initial bath solution in which gigaohm seals were formed was NaCl bath solution (mM): 140 NaCl, 5 KCl, 1 CaCl2, 1 MgCl2 and 10 Hepes (adjusted to pH 7·5 with NaOH). Low-Cl− bath solution (9 mM Cl−) was obtained by replacing 140 mM Cl− by isethionate or gluconate. Cl−-free solution was obtained by replacing all bath Cl− by gluconate. Na+-free bath solution was obtained by replacing all bath Na+ by N-methyl-D-glucamine (NMDG). All bath solutions contained 5 mM glucose. The pipettes were filled with a 130-KCl pipette solution which contained (mM): 130 KCl, 1 MgCl2, 10 Hepes (adjusted to pH 7·5 with NaOH), 1 EGTA and 0·582 CaCl2 to obtain a free Ca2+ concentration of 10−7 M. In some experiments a 130-NMDG-Cl pipette solution was used, which contained (mM): 130 NMDG-Cl (N-methyl-D-glucamine chloride), 1 MgCl2, 10 Hepes (adjusted to pH 7·5 with Tris), 1 EGTA and 0·582 CaCl2. Ca2+-free solutions were obtained by omitting CaCl2 and adding 1 mM EGTA. All experiments were performed at room temperature. Patch pipettes were pulled from Clark glass capillaries (Clark Electromedical Instruments, Pangbourne, UK) and had a resistance of 3–5 MΩ. Currents were amplified with an EPC-9 patch-clamp amplifier (HEKA Elektronik, Lambrecht, Germany) using an ATARI computer system for data acquisition and analysis. Whole-cell currents were recorded using the voltage-clamp (VC) mode. In the VC mode the cytoplasmic potential corresponds to the pipette potential (VPip). The membrane capacitance (Cm) and series resistance (Rs) were estimated by nulling capacitive transients using the automated EPC-9 compensation circuitry. In 79 measurements, Cm and Rs averaged 12·3 ± 0·8 pF and 32·9 ± 4·0 MΩ, respectively. The Rs compensation circuitry of the EPC-9 was not used in order to avoid the possibility of amplifier oscillations. The reference electrode was a Ag-AgCl pellet bathed in the same solution as that used in the pipette, and connected to the bath via an agar-pipette-solution bridge in the outflow path of the chamber. Liquid junction (LJ) potentials occurring at the bridge-bath junction were measured using a 3 M KCl flowing boundary electrode and ranged from −5 to 4 mV. The VPip settings were corrected accordingly. Positive currents are shown as upward current deflections and correspond to cell membrane outward currents. Data are given as mean values ±s.e.m.P < 0·05 was considered significant (evaluated by the appropriate version of Student's t test).
Intracellular Ca2+ measurements
For fura-2 loading, M-1 cell suspensions were prepared by trypsinisation, centrifugation and resuspension of cells in PC1 medium. Fura-2 was constituted in DMSO (final concentration < 0·01%) and loaded into cells by incubation in PC1 medium containing 5 μM of the acetoxymethyl ester form of the dye (fura-2 AM; Molecular Probes, Eugene, OR, USA) for 30 min at 37°C. Following incubation the cells were centrifuged at 100 g for 10 min. Excess dye was removed by washing cells twice in Ca2+-free solution (see below) and centrifuging as above. Following loading with fura-2, cells were transferred to glass coverslips coated with poly-L-lysine and mounted on an inverted epifluorescence microscope (Diaphot 200; Nikon). All experiments were performed at room temperature to minimise dye leakage. The bath solution contained (mM): 140 NaCl, 5 KCl, 1·5 MgCl2, 1 CaCl2, 10 Hepes and 5 glucose (adjusted to pH 7·4 with NaOH). For Ca2+-free conditions, the CaCl2 was replaced by 1 mM EGTA. Fluorescence of Ca2+-bound and unbound fura-2 was measured by rapidly alternating the excitation wavelength between 340 and 380 nm and measuring the emission signals at 510 nm electronically. Images were digitised and analysed using the Starwise Fluo system (Imstar, Paris, France). This system monitors the fluorescence signal of an individual cell at a frequency of 0·2 Hz. Data are expressed as 340 nm/380 nm fluorescence ratios (R340/380), which were used to estimate the corresponding intracellular concentration ([Ca2+]i) using the equation of Grynkiewicz et al. (1985), as described previously (Urbach et al. 1999).
Transepithelial measurements
The Millicell inserts with confluent M-1 cells were transferred into purpose-built modified Ussing chambers for continuous equivalent ISC current measurements. Ussing chamber experiments were performed using a computer-controlled clamp device (CVC 6; Fiebig, Berlin, Germany) which allows up to six chambers to be operated in parallel. In these Ussing chamber experiments, Rte was evaluated every 10–20 s by measuring the voltage deflections induced by 200 ms symmetrical square current pulses of ± 10 μA cm−2. Open-circuit Vte was also measured and the equivalent ISC was calculated according to Ohm's law. Conventionally, a lumen negative Vte corresponds to a positive ISC, which may be due to electrogenic cation absorption or electrogenic anion secretion or a combination of both. The bath solution was identical on the apical and basolateral side of the epithelial monolayer and contained (mM): 140 Na+, 4 K+, 1 Ca2+, 1 Mg2+, 124 Cl−, 24 HCO3− and 5 glucose. A reservoir connected to each half-chamber contained bath solution which was kept at 37°C by a temperature-controlled water jacket. The solution was continuously re-circulated from the reservoir through the half-chamber using a bubble lift which gassed the solution with 95% O2-5% CO2, maintaining pH at 7·4. The volume of each half-chamber was 1·8 ml; the total volume of circulating solution was 10 ml. Cl−-free solutions were obtained by replacing Cl− by gluconate. Control experiments were performed in which the Cl−-free solution contained 6 mM calcium gluconate to compensate for the calcium chelating effect of gluconate (n = 6). No differences in the electrophysiological responses to AP were detected when cells were exposed to Cl−-free solutions containing either 1 or 6 mM Ca2+. Thus, the results from these experiments were pooled and are reported together. Drugs were added from stock solutions either to the apical or basolateral side of the Ussing chamber. Drugs were washed out by repeated simultaneous removal of 5 ml of solution from both half-chamber reservoirs and re-addition of the same volume of fresh pre-warmed and pre-gassed bath solution. This manoeuvre was repeated at least 10 times, which corresponded to a more than 1000-fold dilution of the added drug and usually appeared to be an efficient washout, as shown by the reversibility of the amiloride effect (see Results).
RT-PCR
Mice (BALB/C) were anaesthetised with sodium pentobarbitone (60 mg kg−1i.p.). Colon and kidney were removed and processed for RNA extraction or immunohistochemistry. All procedures were approved by the committee on animal research, University of California San Francisco. Total RNA was prepared from mouse colon and kidney using RNAzol B (Tel-Test Inc., Friendwood, TX, USA), according to the manufacturer's directions. Total RNA was prepared from confluent M-1 cells as described previously (Letz et al. 1995). RNA from mouse colon, kidney and M-1 cells (1·5 μg) was reverse-transcribed in a reaction mixture (20 μl) containing 1 × PCR buffer (Gibco BRL), 5 mM MgCl2, 1 mM of each dNTP, 2·5 μM random hexamers, 20 units RNase inhibitor (Boehringer Mannheim, Indianapolis, IN, USA), and 50 units MuLV Reverse Transcriptase (Perkin Elmer Cetus Instruments, Emeryville, CA, USA). The reaction continued at 42°C for 30 min, 95°C for 5 min and 4°C for 5 min. Oligonucleotide primers, designed to the published cDNA sequence of mouse PAR-2 (forward primer, 73–93 bp: 5′-ATGCGAAGTCTCAGCCTGGCG-3′; reverse primer, 1272–1253 bp: 5′-TCAGTAGGAGGTTTTAACAC-3′), were chosen to amplify a 1·2 kb fragment. The forward primer was within exon 1 and the reverse primer was within exon 2, with an intervening intron of 10 kb (Nystedt et al. 1995). Thus, genomic contamination would be indicated by the presence of a product of 11·2 kb. Analysis of these primers using BLAST (National Centre for Biotechnology Information, National Institutes of Health, Bethesda, MD, USA) indicated complete specificity for PAR-2. The PCR mixture included template cDNA (20 μl of RT product) in a total volume of 100 μl containing 1 × PCR buffer, 2 mM MgCl2, 50 pmol forward and reverse primer, and 2·5 units Taq DNA polymerase (Gibco BRL). The PCR conditions were: denaturation at 94°C for 5 min, 35 cycles at 94°C for 2 min, 51°C for 2 min and 72°C for 2 min, followed by a final elongation step at 72°C for 10 min. Water was used instead of RNA as a negative control. PCR products were analysed by electrophoresis on a 1% agarose gel with ethidium bromide. The bands were excised from the gel and purified using a Quiaex II Gel Extraction Kit (Qiagen Inc., Chatsworth, CA, USA). DNA was sequenced by the Genome Analysis Core Facility (University of California San Francisco) and sequences were analysed using MacVector (Oxford Molecular, Campbell, CA, USA).
Northern blotting
RNA (20 μg per lane) was fractionated by electrophoresis using a 1% agarose gel in 2·1 M formaldehyde and 1 × POMS buffer (Sigma). RNA was transferred to a GeneScreen Plus nylon membrane (Du Pont NEN Research Products, Boston, MA, USA) and cross-linked by UV irradiation. cDNA probes to mouse PAR-2 of 230 and 1195 bp (50 ng) were labelled with [α32P] dCTP using a Ready-To-Go dCTP kit and purified by a NICK column (Pharmacia LKB Biotechnology, Uppsala, Sweden). Membranes were hybridised with cDNA probes for 16 h at 42°C, washed (2 × SSC (saline-sodium citrate buffer), 0·5% SDS, for three periods of 15 min; 0·1 × SSC, 0·5% SDS, for 15 min), and exposed to Kodak BioMax Film for 48 h at −70°C.
Antibodies and immunohistochemistry
Antibody B5 was raised in rabbits to a fragment of PAR-2 (30GPNSKGR↓SLIGRLDT46P-YGGC, ↓= cleavage site) conjugated to keyhole limpet haemocyanin (Kong et al. 1997), and was a gift of Dr M. Hollenberg, University of Calgary, Canada. Kidneys were taken from adult mice of both sexes (6 mice), fixed in 4% paraformaldehyde in PBS for 48 h at 4°C, and placed in 25% sucrose-PBS solution for 24 h at 4°C. Specimens were embedded in OCT compound (Miles, UK), sectioned at 10 μm and post-fixed in 4% paraformaldehyde-PBS, pH 7·4 for 20 min. Cellagen filters with confluent M-1 cells were fixed in 4% paraformaldehyde-PBS for 20 min at 4°C, embedded in paraffin and 5 μm sections were prepared. Paraffin sections were deparaffinised in xylene and re-hydrated through alcohol. Sections were incubated in PBS containing 5% normal goat serum (NGS), 0·25% bovine serum albumin (BSA) and 0·3% Triton X-100 for 30 min, and incubated with primary antiserum (1:1000-1:4000 dilution) in PBS containing 2% NGS, 0·25% BSA and 0·3% Triton X-100 overnight at 4°C. Sections were preincubated with 3% H2O2-methanol for 30 min to quench endogenous peroxidase, and processed for ABC staining according to the manufacturer's directions (ABC-staining kit, Vector Inc., Burlingame, CA, USA), with diaminobenzidine as substrate. In some cases tissues were counterstained with Haematoxylin. For controls, primary antibodies were (1) preincubated for 24–48 h with the peptide (10–100 μM) used for immunisation, or (2) replaced by non-specific rabbit Ig. Specimens were examined using a Zeiss Axioplan microscope.
Chemicals
Amiloride hydrochloride, trypsin, trypsin inhibitor and kallikrein were obtained from Sigma-Aldrich (Deisenhofen, Germany). Diphenylamine-2-carboxylic acid (DPC) was from Fluka (Neu-Ulm, Germany). Other reagents were from Sigma Chemical Co. (St Louis, MO, USA). Amiloride was made up as a 1 mM stock solution in standard bath solution. A 100 mM stock solution of DPC was prepared in DMSO. Synthetic AP corresponding to the tethered ligand of human PAR-2 was used to specifically bind and activate the receptor: S-L-I-G-K-V-NH2. For control experiments, a reverse peptide (RP) was used in which the amino acid sequence of AP was reversed: V-K-G-I-L-S-NH2. Peptides were synthesised as described previously (Böhm et al. 1996a).
RESULTS
Whole-cell current recordings
Figure 1A shows a continuous whole-cell current trace recorded from a single M-1 cell. The holding potential was repeatedly stepped from 0 mV to +120 or −120 mV for 400 ms. Addition of 20 μM AP elicited a large transient increase in whole-cell inward and outward currents in 30 out of 31 experiments. On average, AP increased the whole-cell conductance from 2·7 ± 1·0 nS to a peak value of 14·2 ± 2·4 nS (n = 30; P≤0·001). Inward currents may be carried either by cation influx or by anion efflux. Conversely, outward currents may be carried either by cation efflux or anion influx. In the experiment shown in Fig. 1A, the impermeant cation NMDG was the main cation in the bath solution. Thus, the stimulated inward current is likely to be carried by Cl− efflux. In low-Cl− or Cl−-free bath solution (Fig. 1A), the stimulatory effect of AP on the outward currents was largely abolished while its effect on the inward currents was preserved (n = 6). These findings indicate that stimulated inward and outward currents are both carried by Cl−. The insets to Fig. 1A show details of the current trace on an expanded time scale. These insets demonstrate that the currents stimulated by AP displayed a pronounced voltage dependence with slow activation during depolarising voltage steps to +120 mV and rapid inactivation upon stepping to −120 mV. As shown previously, this voltage dependence is characteristic for Ca2+-activated Cl− currents present in M-1 cells (Meyer & Korbmacher, 1996). Figure 1A shows an experiment in which the pipette solution was nominally Ca2+ free and contained 1 mM of the calcium chelator EGTA. Under these conditions, AP failed to elicit a stimulatory current response in four out of four similar experiments. This finding indicates that the current response is mediated by a rise in [Ca2+]i and is consistent with the interpretation that AP stimulates Ca2+-activated Cl− channels.
Figure 1. PAR-2 activating peptide (AP) stimulates Ca2+-activated Cl− currents in single M-1 cells.
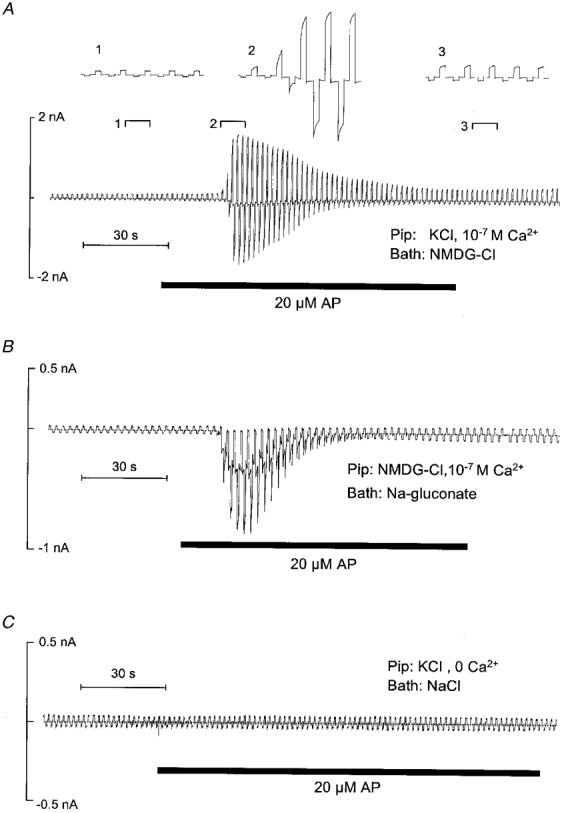
Representative whole-cell current traces that were recorded while the pipette voltage was repeatedly stepped from 0 to ± 120 mV for 400 ms are shown. Application of AP (20 μM) is indicated by bars below the traces. A, effect of AP in the absence of extracellular Na+, which was replaced by 145 mM of the impermeant cation NMDG (Bath: NMDG-Cl). The insets (1, 2, 3) show the indicated portions of the current trace on an expanded time scale. The pipette solution contained 130 mM KCl and had a free Ca2+ concentration of 10−7 M (Pip: KCl, 10−7 M Ca2+). B, effect of AP in the absence of extracellular Cl−, replaced by gluconate (Bath: Na-gluconate). In the pipette solution K+ was replaced by NMDG (Pip: NMDG-Cl, 10−7 M Ca2+). C, effect of AP in the absence of intracellular Ca2+. The 130 mM KCl pipette solution was nominally Ca2+ free and contained 1 mM EGTA (Pip: KCl, 0 Ca2+); the bath solution was standard NaCl bath solution (Bath: NaCl).
As shown in Fig. 2A, application of a peptide (RP) with the reverse amino acid sequence of AP had no effect on the whole-cell current of M-1 cells (n = 11), while subsequent application of AP had the usual stimulatory effect. This suggests that the effect of AP is mediated by a specific interaction of the peptide with PAR-2. The presence of PAR-2 was further confirmed by experiments as shown in Fig. 2A and C. The experiment in Fig. 2A demonstrates that application of 20 μg ml−1 trypsin elicited a similar response to that to AP with an increase in overall whole-cell conductance from 6·4 ± 2·5 nS to a peak value of 18·4 ± 3·7 nS (n = 12; P≤0·001). Furthermore, this experiment demonstrates that trypsin had no effect in the presence of trypsin inhibitor (n = 4). This result indicates that the protease activity of trypsin is needed to mediate its effect, which is consistent with the interpretation that trypsin activates PAR-2. On the other hand, as shown in Fig. 2A, the stimulatory effect of AP was not prevented by trypsin inhibitor (n = 4). This is an expected finding since the interaction and stimulation of PAR-2 by AP should not require the proteolytic cleavage of the receptor. In conclusion, our patch-clamp data suggest that stimulation of PAR-2 receptors by AP or trypsin stimulates Ca2+-activated Cl− channels in M-1 cells.
Figure 2. Specificity of the effects of AP and trypsin on whole-cell currents of single M-1 cells.
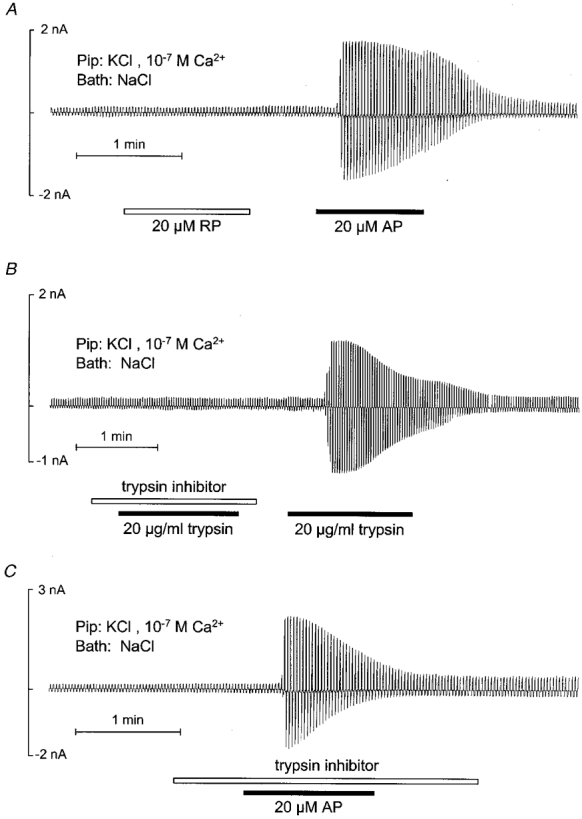
The experimental protocol was similar to that described in the legend to Fig. 1 and drugs were applied as indicated. A, sequential application of reverse peptide (RP) and AP (20 μM). B, effect of trypsin (20 μg ml−1) in the presence and absence of trypsin inhibitor (40 μg ml−1). C, application of AP in the presence of trypsin inhibitor.
Intracellular Ca2+ measurements
To determine whether PAR-2 agonists mobilise Ca2+ we measured [Ca2+]i using fura-2. Figure 3 illustrates a typical [Ca2+]i response of a single M-1 cell upon application of AP. The response was biphasic, with a rapid increase in [Ca2+]i and a slower decline to a sustained plateau. On average, [Ca2+]i increased from 41 ± 11 nM (R340/380, 0·17 ± 0·01) to a peak value of 185 ± 51 nM (R340/380, 0·32 ± 0·06) upon application of 100 μM AP (n = 4; P < 0·05) and from 64 ± 13 nM (R340/380, 0·20 ± 0·02) to 286 ± 37 nM (R340/380, 0·44 ± 0·01) upon application of 200 μM AP (n = 3; P < 0·05). It should be noted that in this series of experiments only seven out of 18 cells analysed responded to the application of AP. This is probably due to poor recovery of cells from receptor desensitisation likely to occur during the trypsinisation procedure preceding fura-2 loading of the cells (see Methods). In the absence of extracellular Ca2+ (with 1 mM EGTA present), a transient peak increase in [Ca2+]i to application of AP was preserved (n = 2), which indicates that at least part of the response is due to Ca2+ release from intracellular stores and is not dependent on influx of extracellular Ca2+.
Figure 3. AP increases intracellular Ca2+ in M-1 cells.
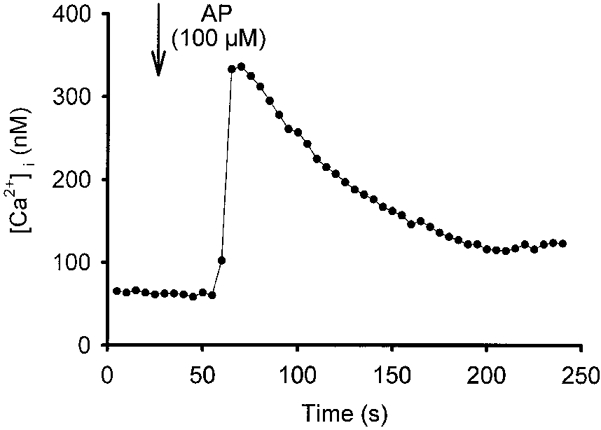
Using fura-2, [Ca2+]i was monitored in a single M-1 cell. AP was added to the bath at the time indicated by the arrow to give a final concentration of 100 μM, and subsequently remained in the bath.
Transepithelial measurements
Transepithelial measurements were performed to investigate whether AP has an effect on electrogenic ion transport and whether it acts from the apical or basolateral side. Confluent monolayers of M-1 cells had a mean Rte of 719 ± 19 Ω cm2 and a lumen negative Vte of −30 ± 1·5 mV. The corresponding equivalent mean ISC was 41·6 ± 1·8 μA cm−2 (n = 40). As shown in Fig. 4A, apical application of 20 μM AP had no effect on ISC (n = 6) whereas subsequent basolateral application of AP elicited a transient increase in ISC. This indicates that AP acts via a basolateral receptor. The mean peak transient current stimulated by basolateral AP was 7·4 ± 1·3 μA cm−2 (n = 6).
Figure 4. Basolateral application of AP transiently stimulates short-circuit current (ISC) in confluent monolayers of M-1 cells.
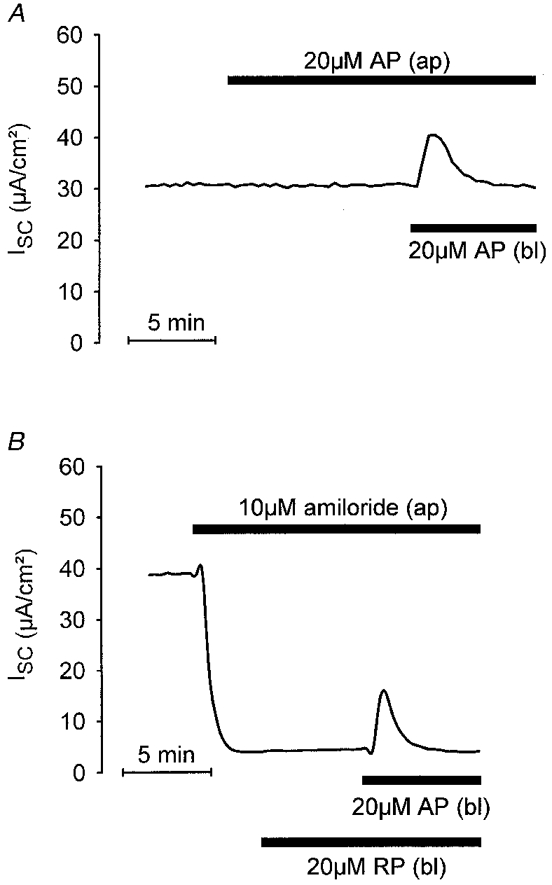
Equivalent ISC was continuously monitored and two traces from representative experiments are shown. Drugs were applied as indicated either to the apical (ap) or to the basolateral (bl) side of the monolayer. A, basolateral but not apical application of 20 μM AP had an effect on ISC. B, the effect of basolateral AP was preserved in the presence of 10 μM apical amiloride; basolateral application of 20 μM RP had no effect.
It has been shown previously that in M-1 cells the basal ISC is almost exclusively due to electrogenic Na+ absorption via epithelial Na+ channels expressed in the apical membrane of M-1 cells (Stoos et al. 1991; Korbmacher et al. 1993; Chalfant et al. 1996). These channels are highly sensitive to amiloride with a Ki of 0·2 μM (Letz et al. 1995). As shown in the experiment illustrated in Fig. 4A, application of apical amiloride (10 μM) largely abolished ISC. However, the stimulatory response to basolateral AP was preserved in the presence of 10 μM and even 100 μM apical amiloride, and averaged 18·5 ± 1·6 μA cm−2 (n = 28) and 12·0 ± 2·4 μA cm−2 (n = 5), respectively. The lack of an inhibitory effect of amiloride indicates that the AP-induced increase in ISC is not mediated by stimulation of electrogenic Na+ absorption. Apical application of AP in the presence of amiloride had no effect (n = 6, data not shown) consistent with a basolateral localisation of the receptor. Basolateral application of RP had no effect, which demonstrates that the effect of AP is specific (n = 4; Fig. 4A).
The ISC increase stimulated by basolateral application of 20 μM AP was paralleled by a concomitant transient decrease in Rte which averaged 209 ± 27 Ω cm2 (n = 39). This suggests that AP stimulates an apical membrane conductance since in tight epithelia such as M-1 cells the transepithelial resistance is usually dominated by the apical resistance.
The concentration dependence of the effect of AP was tested in experiments as shown in Fig. 5A. In parallel experiments using monolayers from the same batch of M-1 cells, different concentrations of AP were applied to the basolateral membrane in the presence of apical amiloride. At a concentration of 0·2 μM AP had no effect while a concentration-dependent effect was observed with 2, 20 and 200 μM AP. Results from similar experiments are summarised in Fig. 5B. Note that after the initial peak increase ISC did not completely return to its baseline level but remained slightly elevated in the continuous presence of AP.
Figure 5. Effect of AP is concentration dependent.
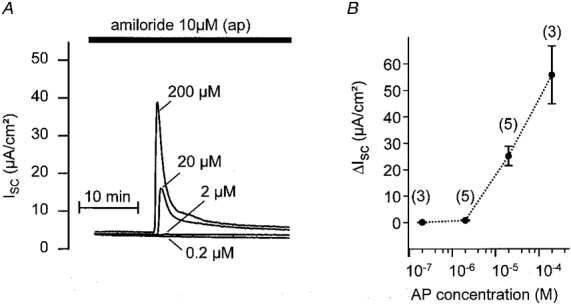
In parallel experiments, M-1 monolayers from the same batch of cells were exposed to different concentrations of basolateral AP in the presence of apical amiloride (10 μM). A, individual ISC traces with the corresponding AP concentrations (0·2, 2, 20 or 200 μM). B, summary of similar experiments to those shown in A with the number of observations given above each data point (mean ±s.e.m.).
To test the possibility that the increase in ISC is due to Cl− secretion via apical Cl− channels, AP was applied basolaterally in the presence or absence of the Cl− channel blocker DPC (1 mM) on the apical side. Parallel experiments were performed on matched M-1 monolayers from the same batch of cells. Two representative recordings with and without apical DPC (1 mM) are shown in Fig. 6A and B, respectively. In these experiments, the mean peak response to basolateral AP was 3·4 ± 0·6 μA cm−2 (n = 5) in the presence of apical DPC, which was significantly smaller than the mean response of 14·5 ± 1·1 μA cm−2 (n = 5) in the absence of DPC (P≤0·001). Thus, apical DPC reduced the response to AP by 76% indicating that stimulation of an apical Cl− channel is involved in this response. This conclusion was further confirmed by experiments performed on cells which were Cl− depleted by incubation in Cl−-free bath solution for 30–40 min prior to the application of AP. As shown in Fig. 7, basolateral application of AP had no effect when applied to cells maintained in the absence of extracellular Cl−. In contrast, after readdition of bath Cl− basolateral application of AP elicited the usual response (Fig. 7), with a peak ISC increase of 9·7 ± 1·7 μA cm−2 (n = 12). Taken together, these findings indicate that AP activates electrogenic Cl− secretion.
Figure 6. Cl− channel blocker inhibits the ISC response to basolateral AP.
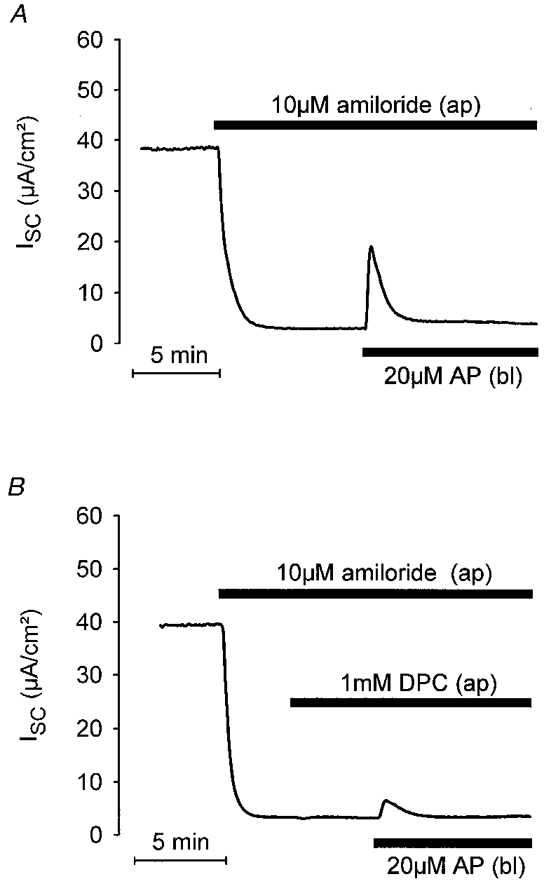
The ISC response to basolateral AP was reduced by the Cl− channel blocker DPC applied to the apical side of M-1 cells. A and B show representative ISC traces from matched M-1 cell monolayers to illustrate the effects of basolateral application of AP in the absence and presence of apical DPC (1 mM), respectively.
Figure 7. Extracellular Cl− removal abolishes the ISC response to basolateral AP.
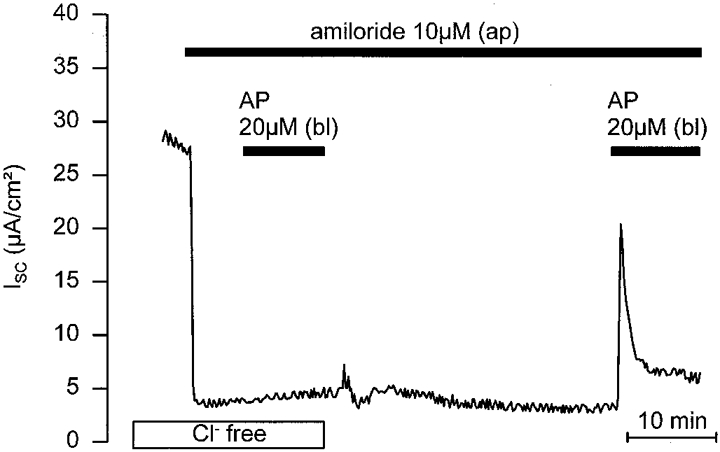
M-1 cells were Cl− depleted by incubation in Cl−-free bath solution for 30–40 min prior to the application of basolateral AP (Cl− replaced by gluconate with 6 mM calcium gluconate included to compensate for the Ca2+ chelating effect of gluconate). In the continuous absence of apical and basolateral Cl− (Cl− free) basolateral application of AP was without effect. Re-exposure of the monolayer to Cl− resulted in a recovery of the AP response.
The experiment shown in Fig. 8A demonstrates that basolateral application of trypsin had a similar effect on ISC to AP. On average, basolateral trypsin (20 μg ml−1) transiently increased ISC by 8·6 ± 1·2 μA cm−2 (n = 9) with a concomitant reduction of Rte by 131 ± 57 Ω cm2 (n = 9). This transient initial reduction of Rte was followed by a partial recovery and a subsequent further slow decline of Rte in the continuous presence of trypsin, consistent with the finding that prolonged exposure to a protease may damage the integrity of tight junctions (Scudamore et al. 1998). Subsequent application of AP had no effect (Fig. 8A). Conversely, an initial application of AP largely abolished the response to trypsin subsequently applied (n = 3; Fig. 8A). These findings suggest that trypsin and AP act via the same basolateral receptor. Interestingly, after washout of AP a second response to AP could be elicited (n = 8). Five to 10 min after washout, a second response to AP reached about 50–70% of the size of the initial response (n = 4) and after a prolonged washout period of 20 or 50 min the AP response had almost fully recovered (n = 2). In contrast, a second application of trypsin failed to elicit a second response even after prolonged periods of washout (> 30 min). This indicates that the receptor mediating the effect desensitises more strongly upon exposure to trypsin than upon exposure to AP. This is consistent with irreversible receptor cleavage by trypsin while activation by AP does not require receptor proteolysis (Déry et al. 1998).
Figure 8. Effect of trypsin on ISC.

Two representative ISC traces are shown. In A, 20 μg ml−1 trypsin was applied to the basolateral side of the M-1 monolayer followed by a basolateral application of 20 μM AP. In B, the sequence of application was reversed.
While PAR-1 and PAR-3 respond to thrombin but not to trypsin, it has been shown that PAR-4 may respond to both thrombin and trypsin. To eliminate the possibility that in M-1 cells PAR-4 is involved in the response to trypsin, we tested the effect of thrombin. Basolateral application of 10 nM thrombin, a concentration known to effectively trigger 45Ca2+ release in Xenopus oocytes expressing cloned mouse PAR-4 (Kahn et al. 1998), did not elicit a significant change in the ISC of M-1 cells while subsequent application of trypsin had the usual effect, increasing ISC by 9·7 ± 1·6 μA cm−2 (n = 6; Fig. 9).
Figure 9. Thrombin has no effect on ISC.
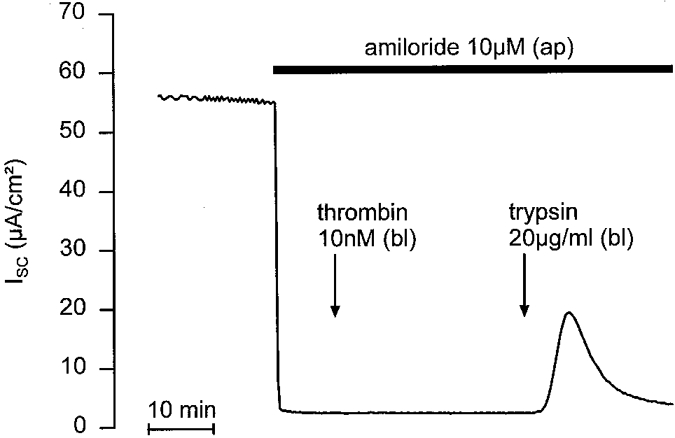
In the continuous presence of apical amiloride (10 μM), basolateral application of thrombin (10 nM) was followed by basolateral application of trypsin (20 μg ml−1) to test the responsiveness of the epithelium.
RT-PCR and Northern blotting
We used RT-PCR with primers specific to mouse PAR-2 cDNA to determine whether PAR-2 was expressed by M-1 cells. A PAR-2 product of the predicted size of 1200 bp was amplified after 35 cycles (Fig. 10A). This product was excised from the gel, sequenced and found to be identical to the published sequence of mouse PAR-2. Larger products were not detected, indicating lack of contamination of genomic DNA. The PCR product from M-1 cells also migrated identically to PCR products that were amplified from mouse colon and kidney, which were used as positive controls. The product was absent from the negative control. We examined expression of PAR-2 mRNA by Northern blotting using two different cDNA probes to mouse PAR-2. A single primary transcript of approximately 3 kb was detected in M-1 cells, as well as in intact kidney and colon, using both probes (Fig. 10A). This transcript was of the predicted size for mouse PAR-2 mRNA, and is different from the size of mRNA encoding PAR-1 (3·5 kb), PAR-3 (2·8 and 1·8 kb) and PAR-4 (4 kb). Together, the results of the RT-PCR and Northern hybridisation indicate that M-1 cells express PAR-2 mRNA. All experiments were performed at least 3 times.
Figure 10. RT-PCR and Northern blot evidence for PAR-2 expression in M-1 CCD cells.
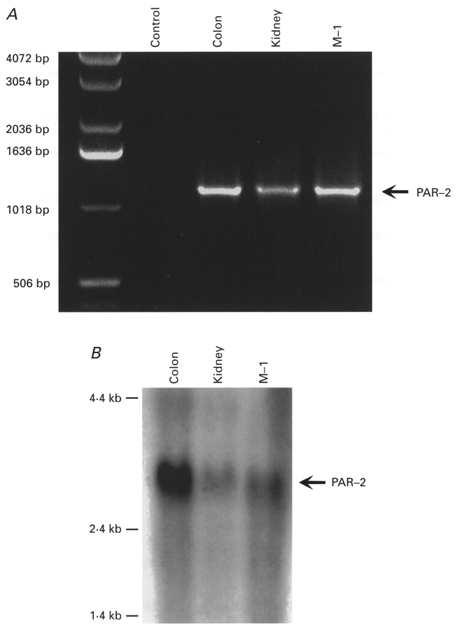
A, agarose gel electrophoresis of products from RT-PCR reactions performed with primers based on mouse PAR-2 and using RNA from M-1 cells, mouse kidney and colon. Products of the predicted size of 1200 bp were detected except in the negative control in which water was used instead of RNA. B, Northern blot analysis using a cDNA probe to mouse PAR-2 and RNA isolated from M-1 cells, mouse kidney and colon. A primary transcript of the predicted size of approximately 3 kb was detected in M-1 cells, as well as in intact kidney and colon.
Localisation of PAR-2 in mouse kidney and in M-1 mouse CCD cells
We used immunohistochemistry to localise PAR-2 protein in the kidney and in M-1 cells. Intensive immunoreactivity for PAR-2 was observed in epithelial cells of the renal cortex. Examination under high magnification indicated PAR-2 immunoreactivity in the cytosol of most epithelial cells (Fig. 11A and C, arrows). Occasionally, immunoreactive PAR-2 was also detected in the basal region of the cell (Fig. 11A, arrowheads). The glomerulus was negative for PAR-2 except for the podocyte layer. In the medulla, only weak staining was found in epithelial cells in comparison to epithelial cells of the cortex. Ducts of Bellini in the renal papilla showed weak to moderate immunostaining for PAR-2 (not shown). Vascular smooth muscle cells and endothelial cells of the kidney were strongly stained for PAR-2 in the cortex, medulla and the pelvis wall (not shown). Cells were also stained with an antibody to CD31 (not shown), which confirms that endothelial cells are positive for PAR-2. Staining for PAR-2 was abolished when the antibodies were preincubated with peptides that were used for immunisation, which confirms their specificity (Fig. 11A). Staining experiments were repeated at least 3 times.
Figure 11. Localisation of immunoreactive PAR-2 in mouse kidney and M-1 cells by immunoperoxidase staining.
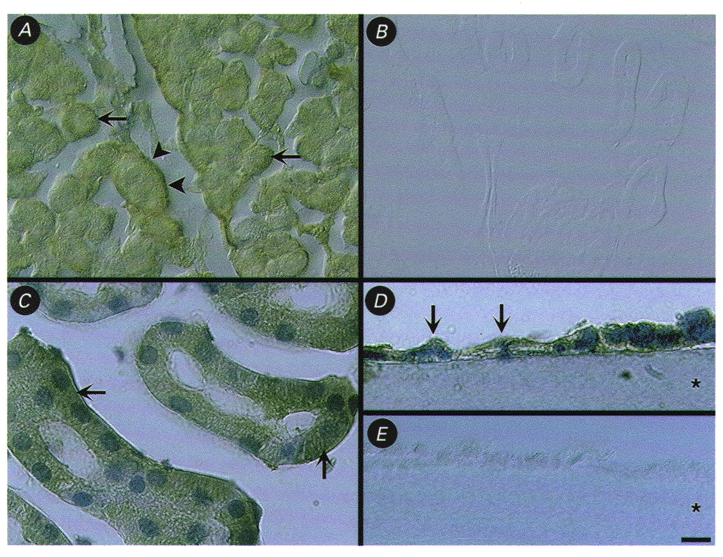
A and C, localisation of PAR-2 immunoreactivity in intracellular locations (arrows) and in the basal region (arrowheads) of epithelial cells of the renal cortex. D, localisation of PAR-2 immunoreactivity (arrows) in cultured M-1 CCD cells grown on Cellagen filter. B and E, control staining of renal cortex (B) and M-1 cells (E) with PAR-2 antibody pre-absorbed with the peptide used for immunisation. Images in A and B were taken using Nomarski optics. Specimens in C and D were counterstained with Haematoxylin. The asterisks in D and E indicate the filter. Scale bar = 25 μm in A and B, 10 μm in C, 5 μm in D and E.
We also detected PAR-2 immunoreactivity in monolayers of cultured M-1 mouse CCD cells. PAR-2 staining was observed in intracellular locations, but it was not possible to unequivocally detect PAR-2 at either the basolateral or apical membranes (Fig. 11A). Preabsorption controls on filter-grown monolayers were also negative for PAR-2 (Fig. 11A).
DISCUSSION
Functional PAR-2 in the basolateral membrane of CCD cells
The major finding of this study is that functional PAR-2 is expressed in the basolateral membrane of renal CCD cells. This conclusion is based on several observations. Firstly, we detected PAR-2 mRNA in native kidney and in cultured M-1 CCD cells by RT-PCR and Northern blot analysis. Secondly, we demonstrated the presence of immunoreactive PAR-2 in native renal epithelial and cultured M-1 CCD cells. Thirdly, trypsin or AP corresponding to the tethered ligand of PAR-2 induced a rise in [Ca2+]i and an activation of Ca2+-activated Cl− channels in M-1 CCD cells. Finally, in confluent monolayers of M-1 cells grown on filters, under conditions that permit polarised growth and formation of tight junctions, basolateral, but not apical, application of trypsin or AP induced a transient increase in ISC indicating that the functional receptor is localised in the basolateral membrane. A contribution of PAR-1 or PAR-3 to the response is unlikely since these thrombin receptors are almost completely unresponsive to trypsin (Ishihara et al. 1997). In contrast, the recently cloned receptor PAR-4 may be activated by both thrombin and trypsin. However, Northern blot analyses have demonstrated either very low (Kahn et al. 1998) or no expression (Xu et al. 1998) of PAR-4 in the kidney. Moreover, the finding that thrombin had no effect on ISC of M-1 cells confirms our conclusion that the response to trypsin or AP is likely to be mediated solely by basolateral PAR-2 known to be abundantly expressed in native renal tissue (Nystedt et al. 1994).
Activation of PAR-2 stimulates Cl− secretion
The other main finding of this study is that activation of PAR-2 stimulates Cl− secretion in confluent M-1 CCD cells, indicating a possible role of these receptors in the regulation of transepithelial ion transport. The stimulatory response to basolateral AP was largely reduced by the Cl− channel blocker DPC applied to the apical membrane, and was abolished by extracellular Cl− removal. These findings indicate that the increase in ISC induced by AP is caused by electrogenic Cl− secretion via apical Cl− channels. This interpretation is consistent with our patch-clamp data which suggest that the underlying channels are Ca2+-activated Cl− channels known to be expressed in M-1 CCD cells (Meyer & Korbmacher, 1996). Thus, our findings suggest that Ca2+-activated Cl− channels may serve as apical Cl− exit pathways mediating Cl− secretion in the CCD, as previously described for a variety of epithelia. Indeed, our findings are in excellent agreement with those of a recent study using well-differentiated non-transformed dog pancreatic duct epithelial cells (Nguyen et al. 1999). In these cells trypsin, or PAR-2 AP, elicits an increase in [Ca2+]i and stimulates 125I efflux indicating activation of Ca2+-activated Cl− channels. Moreover, transepithelial measurements demonstrated that PAR-2 is localised to the basolateral membrane of the pancreatic duct epithelial cells and mediates a Cl− secretory short-circuit current response, consistent with our findings in M-1 cells. In addition, 86Rb+ efflux studies and transepithelial measurements on apically permeabilised pancreatic duct cells provided evidence for a concomitantly activated basolateral K+ conductance. This is a plausible synergism and our data do not rule out the possibility that in M-1 cells activation of basolateral K+ channels may also contribute to the PAR-2-mediated Cl− secretory response by increasing the driving force for apical Cl− exit. Another recent study in stripped rat jejunum also reports a stimulation of Cl− secretion upon serosal application of either trypsin or PAR-2 activating peptides. Based on peptide structure-activity data, the authors concluded that the receptor involved in mediating the response in jejunum may be a novel PAR subtype which is very similar, but not identical, to PAR-2 (Vergnolle et al. 1998). However, such a receptor has not yet been identified at the molecular level whereas PAR-2 is known to be expressed in enterocytes (Kong et al. 1997). To our knowledge, the present study in M-1 CCD cells is the first report suggesting that a proteinase-activated receptor may be involved in the regulation of renal tubular transport by mediating stimulation of Cl− secretion. While amiloride-sensitive Na+ absorption and K+ secretion are the predominant transport features of CCD principal cells, there is considerable evidence that various types of apical Cl− channels are present in these cells which - under favourable transepithelial electrochemical gradients - may mediate Cl− secretion (Christine et al. 1991; Superdock et al. 1993; Ling et al. 1994; Letz & Korbmacher, 1997). Indeed, it has been found that the intracellular Cl− activity for rabbit CCD principal cells is significantly elevated above electrochemical equilibrium (Sauer et al. 1989; Simmons, 1993), favouring Cl− secretion. Furthermore, active Cl− secretion has been demonstrated in microdissected, microperfused rabbit CCD cells after the animals were fed a K+-rich diet (Wingo, 1990). However, the possible involvement of apical Cl− channels in Cl− secretion and the physiological relevance of the Cl− secretory capacity of the CCD cells are unclear at present (Schlatter et al. 1990; Simmons, 1993).
Activation of PAR-2 and intracellular signalling mechanism
Synthetic peptides corresponding to its tethered ligand domain have previously been shown to activate PAR-2 in transfected cell lines without the need for receptor cleavage (Nystedt et al. 1994; Böhm et al. 1996a). These peptides also mimic the effects of trypsin in cell lines that naturally express PAR-2, such as epithelial cells (enterocytes, keratinocytes), endothelial cells, myocytes, T-cell lines, neutrophils and various tumour cell lines (Déry et al. 1998). Our finding that the synthetic peptide AP but not RP elicited a response indicates that the effect of AP was specific. This result is consistent with the observed effect of trypsin which typically cleaves PAR-2, exposing its tethered ligand that binds and activates the cleaved receptor (Déry et al. 1998). The lack of its effect in the presence of trypsin inhibitor confirms that proteolysis mediates the trypsin effect. Receptors for soluble ligands usually recycle after internalisation whereas PARs, when irreversibly activated by proteolytic cleavage, are internalised and degraded in lysosomes. Thus, an irreversible receptor proteolysis by trypsin is consistent with our finding that after trypsin washout cells remained unresponsive to a second application whereas the response to AP could be elicited a second time.
For PAR-1, the signal transduction pathways have been studied extensively (Déry et al. 1998). In contrast, relatively little is known about mechanisms of signal transduction that couple to PAR-2, PAR-3 and PAR-4. Agonists of PAR-2 stimulate generation of inositol trisphosphate and mobilisation of intracellular Ca2+ in numerous cell types. Therefore, it is likely that PAR-2 couples to Gαq or Gαo and activates phospholipase C-β. In addition, agonists of PAR-2 may activate phospholipase A2, cyclo-oxygenase 1, protein kinase C, mitogen-activated protein (MAP) kinases, and the protein-Tyr phosphatase SHP2 (Déry et al. 1998). Using the Ca2+-sensitive probe fura-2 we demonstrated that PAR-2 agonists increase [Ca2+]i in M-1 CCD cells. The observed response is in good agreement with previous reports from other cell types (Déry et al. 1998), including pancreatic duct epithelial cells (Nguyen et al. 1999).
Physiological role of PAR-2 in the renal cortical collecting duct
Trypsin activates PAR-2 in M-1 CCD cells but it is unlikely that trypsin is the physiological protease that stimulates PAR-2 in the native kidney. However, other enzymes with trypsin-like selectivity have been shown to cleave and activate PAR-2, notably mast cell tryptase (Corvera et al. 1997; Molino et al. 1997; Déry et al. 1998). The full array of proteases that may trigger PAR-2 in various tissues remains to be clarified. Nevertheless, it is conceivable that an as yet unidentified renal protease may activate basolateral PAR-2 in renal epithelial cells by an autocrine or paracrine mechanism. It has long been known that mammalian urine contains kallikrein, a serine proteinase of renal origin with unknown physiological role (for references see Orce et al. 1980). However, it has been reported that kallikrein and urokinase, another proteolytic enzyme present in the urine, have no effect on PAR-2 (Molino et al. 1997). Thus, it is unlikely that these proteases are physiological activators of PAR-2.
Recently, an epithelial serine protease has been cloned (CAP-1) that activates the amiloride-sensitive sodium channel (ENaC) when coexpressed in Xenopus laevis oocytes (Vallet et al. 1997). The effect of CAP-1 is thought to be mediated through proteolysis of a protein that is either a constitutive part of the channel itself or closely associated with it (Chraibi et al. 1998). Alternatively, the protease may act indirectly via a receptor-mediated mechanism involving intracellular signalling pathways. However, our findings suggest that in CCD cells PAR-2 is not involved in protease-mediated stimulation of sodium absorption via ENaC since the ISC response elicited by trypsin or AP is preserved in the presence of amiloride. Moreover, the basolateral localisation of PAR-2 argues against the possibility of its activation by a mammalian homologue of CAP-1, which is believed to act from the luminal side.
Various renal proteases seem to play an important role during tubulogenesis (Sakurai & Nigam, 1998) and may be active during certain renal disease states and tubular regeneration. Conversely, proteases may also play a role in renal cell death (Schnellmann & Williams, 1998). Interestingly, elevated levels of protease activity have been found in urine from renal failure patients (Lee et al. 1994). Proteases may be secreted by renal epithelial cells not only into the tubular lumen but may also reach PAR-2 receptors localised on the basolateral membrane in an autocrine or paracrine fashion. Furthermore, trypsin-like proteases may also be secreted by vascular and interstitial cells and could possibly reach and cleave basolateral PAR-2 in CCD cells. Moreover, mast cells producing mast cell tryptase may be present in renal tissue during inflammatory kidney disease and may mediate PAR-2 stimulation under pathophysiological conditions. The transient Cl− secretory response observed in the present study may not be the only effect of PAR-2 activation in the tubules in vivo. In fact, one may argue that the Cl− secretory response is not a very specific response since other stimuli that will increase intracellular calcium are likely to have a similar stimulatory effect on Cl− secretion. Indeed, preliminary experiments performed in our laboratory suggest that ATP, through purinergic receptors and an increase in [Ca2+]i, also activates Cl− secretion in M-1 cells via Ca2+-activated Cl− channels (Cuffe et al. 1999). Additional PAR-2 effects mediated via complex signal transduction pathways and cellular effectors may occur on a much slower time scale than the increase in [Ca2+]i and the Cl− secretory response. Indeed, it has been suggested that PAR-2 is involved in inflammation (Nystedt et al. 1996) and may regulate cellular growth and proliferation (Déry et al. 1998). Clearly, the role of the renal PAR-2 receptor, its physiological stimulus and effects, require further investigation.
In summary, we have provided molecular and functional evidence for the presence of PAR-2 in renal collecting duct cells. In conjunction with our patch-clamp data and [Ca2+]i measurements, our transepithelial data indicate that activation of basolateral PAR-2 stimulates electrogenic Cl− secretion probably via Ca2+-activated apical Cl− channels.
Acknowledgments
We thank Professor B. J. Harvey for his kind support and permission to perform the intracellular calcium measurements in his laboratory. We thank A. Fromm and Professor M. Fromm for their help and advice to set up the equipment for the transepithelial measurements. We also thank U. Fink, I. Doering-Hirsch and P. Cordery for expert technical assistance. This work was supported by a grant from the Wellcome Trust (C.K.), NIH grants DK39957, DK43207, NS21710 (N.W.B.), a fellowship grant from the Deutscher Akademischer Austauschdienst (M.B.), and a fellowship grant from the National Kidney Research Fund (M.A.H.).
References
- Böhm SK, Khitin LM, Grady EF, Aponte G, Payan DG, Bunnett NW. Mechanisms of desensitization and resensitization of proteinase-activated receptor-2. Journal of Biological Chemistry. 1996a;271:22003–22016. doi: 10.1074/jbc.271.36.22003. [DOI] [PubMed] [Google Scholar]
- Böhm SK, Kong W, Brömme D, Smeekens SP, Anderson DC, Connolly A, Kahn M, Nelken NA, Coughlin SR, Payan DG, Bunnett NW. Molecular cloning, expression and potential functions of the human proteinase-activated receptor-2. Biochemical Journal. 1996b;314:1009–1016. doi: 10.1042/bj3141009. [DOI] [PMC free article] [PubMed] [Google Scholar]
- Chalfant ML, Peterson-Yantorno K, O'Brien TG, Civan MM. Regulation of epithelial Na+ channels from M-1 cortical collecting duct cells. American Journal of Physiology. 1996;271:F861–870. doi: 10.1152/ajprenal.1996.271.4.F861. [DOI] [PubMed] [Google Scholar]
- Chraibi A, Vallet V, Firsov D, Hess SK, Horisberger J-D. Protease modulation of the activity of the epithelial sodium channel expressed in Xenopus oocytes. Journal of General Physiology. 1998;111:127–138. doi: 10.1085/jgp.111.1.127. [DOI] [PMC free article] [PubMed] [Google Scholar]
- Christine CW, Laskowski FH, Gitter AH, Beyenbach KW, Gross P, Frömter E. Anion channels in the apical membrane of collecting duct principal cells in culture. Cellular Physiology and Biochemistry. 1991;1:76–88. doi: 10.1159/000173349. [DOI] [PubMed] [Google Scholar]
- Corvera CU, Déry O, McConalogue K, Böhm SK, Khitin LM, Caughey GH, Payan DG, Bunnett NW. Mast cell tryptase regulates rat colonic myocytes through proteinase-activated receptor 2. Journal of Clinical Investigation. 1997;100:1383–1393. doi: 10.1172/JCI119658. [DOI] [PMC free article] [PubMed] [Google Scholar]
- Cuffe JE, Higgins MA, Korbmacher C. Extracellular ATP elicits a Cl− secretory response in M-1 mouse cortical collecting duct cells. The Journal of Physiology. 1999;517:90–91. PP. [Google Scholar]
- D'Andrea MR, Derian CK, Leturcq D, Baker SM, Brunmark A, Ling P, Darrow AL, Santulli RJ, Brass LF, Andrade-Gordon P. Characterization of protease-activated receptor-2 immunoreactivity in normal human tissues. Journal of Histochemistry and Cytochemistry. 1998;46:157–164. doi: 10.1177/002215549804600204. [DOI] [PubMed] [Google Scholar]
- Déry O, Corvera CU, Steinhoff M, Bunnett NW. Proteinase-activated receptors: novel mechanisms of signaling by serine proteases. American Journal of Physiology. 1998;274:C1429–1452. doi: 10.1152/ajpcell.1998.274.6.C1429. [DOI] [PubMed] [Google Scholar]
- Grynkiewicz G, Poenie M, Tsien RY. A new generation of Ca2+ indicators with greatly improved fluorescence properties. Journal of Biological Chemistry. 1985;260:3440–3450. [PubMed] [Google Scholar]
- Hamill OP, Marty A, Neher E, Sakmann B, Sigworth FJ. Improved patch-clamp techniques for high-resolution current recording from cells and cell-free membrane patches. Pflügers Archiv. 1981;391:85–100. doi: 10.1007/BF00656997. [DOI] [PubMed] [Google Scholar]
- Hwa JJ, Ghibaudi L, Williams P, Chintala M, Zhang R, Chatterjee M, Sybertz E. Evidence for the presence of a proteinase-activated receptor distinct from the thrombin receptor in vascular endothelial cells. Circulation Research. 1996;78:581–588. doi: 10.1161/01.res.78.4.581. [DOI] [PubMed] [Google Scholar]
- Ishihara H, Connolly AJ, Zeng D, Kahn ML, Zheng YW, Timmons C, Tram T, Coughlin SR. Protease-activated receptor 3 is a second thrombin receptor in humans. Nature. 1997;386:502–506. doi: 10.1038/386502a0. [DOI] [PubMed] [Google Scholar]
- Kahn ML, Zheng YW, Huang W, Bigornia V, Zeng D, Moff S, Farese RV, Jr, Tam C, Coughlin SR. A dual thrombin receptor system for platelet activation. Nature. 1998;394:690–694. doi: 10.1038/29325. [DOI] [PubMed] [Google Scholar]
- Kong W, McConalogue K, Khitin LM, Hollenberg MD, Payan DG, Böhm SK, Bunnett NW. Luminal trypsin may regulate enterocytes through proteinase-activated receptor 2. Proceedings of the National Academy of Sciences of the USA. 1997;94:8884–8889. doi: 10.1073/pnas.94.16.8884. [DOI] [PMC free article] [PubMed] [Google Scholar]
- Korbmacher C, Segal AS, Fejes-Tóth G, Giebisch G, Boulpaep EL. Whole-cell currents in single and confluent M-1 mouse cortical collecting duct cells. Journal of General Physiology. 1993;102:761–793. doi: 10.1085/jgp.102.4.761. [DOI] [PMC free article] [PubMed] [Google Scholar]
- Lee D-Y, Park SK, Yorgin PD, Cohen P, Oh Y, Rosenfeld RG. Alteration in insulin-like growth factor-binding proteins (IGFBPs) and IGFBP-3 protease activity in serum and urine from acute and chronic renal failure. Journal of Clinical Endocrinology and Metabolism. 1994;79:1376–1382. doi: 10.1210/jcem.79.5.7525635. [DOI] [PubMed] [Google Scholar]
- Letz B, Ackermann A, Canessa CM, Rossier BC, Korbmacher C. Amiloride-sensitive sodium channels in confluent M-1 mouse cortical collecting duct cells. Journal of Membrane Biology. 1995;148:127–141. doi: 10.1007/BF00207269. [DOI] [PubMed] [Google Scholar]
- Letz B, Bertog M, Bunnett NW, Frömter E, Korbmacher C. M-1 mouse cortical collecting duct cells express a basolateral proteinase-activated receptor (PAR-2) Pflügers Archiv. 1999;437:R71. suppl. 5. [Google Scholar]
- Letz B, Korbmacher C. cAMP stimulates CFTR-like Cl− channels and inhibits amiloride-sensitive Na+ channels in mouse CCD cells. American Journal of Physiology. 1997;272:C657–666. doi: 10.1152/ajpcell.1997.272.2.C657. [DOI] [PubMed] [Google Scholar]
- Lewis SA, Alles WP. Urinary kallikrein: A physiological regulator of epithelial Na+ absorption. Proceedings of the National Academy of Sciences of the USA. 1986;83:5345–5348. doi: 10.1073/pnas.83.14.5345. [DOI] [PMC free article] [PubMed] [Google Scholar]
- Lewis SA, Clausen C. Urinary proteases degrade epithelial sodium channels. Journal of Membrane Biology. 1991;122:77–88. doi: 10.1007/BF01872741. [DOI] [PubMed] [Google Scholar]
- Ling BN, Kokko KE, Eaton DC. Prostaglandin E2 activates clusters of apical Cl− channels in principal cells via cyclic adenosine monophosphate-dependent pathway. Journal of Clinical Investigation. 1994;93:829–837. doi: 10.1172/JCI117037. [DOI] [PMC free article] [PubMed] [Google Scholar]
- Meyer K, Korbmacher C. Cell swelling activates ATP-dependent voltage-gated chloride channels in M-1 mouse cortical collecting duct cells. Journal of General Physiology. 1996;108:177–193. doi: 10.1085/jgp.108.3.177. [DOI] [PMC free article] [PubMed] [Google Scholar]
- Molino M, Barnathan ES, Numerof R, Clark J, Dreyer M, Cumashi A, Hoxie JA, Schechter N, Woolkalis M, Brass LF. Interaction of mast cell tryptase with thrombin receptors and PAR-2. Journal of Biological Chemistry. 1997;272:4043–4049. doi: 10.1074/jbc.272.7.4043. [DOI] [PubMed] [Google Scholar]
- Nakhoul NL, Hering-Smith KS, Gambala CT, Hamm LL. Regulation of sodium transport in M-1 cells. American Journal of Physiology. 1998;275:F998–1007. doi: 10.1152/ajprenal.1998.275.6.F998. [DOI] [PubMed] [Google Scholar]
- Nguyen DT, Moody MW, Steinhoff M, Okolo C, Koh D-S, Bunnett NW. Trypsin activates pancreatic duct epithelial cell ion channels through proteinase-activated receptor-2. Journal of Clinical Investigation. 1999;103:261–269. doi: 10.1172/JCI2539. [DOI] [PMC free article] [PubMed] [Google Scholar]
- Nystedt S, Emilsson K, Wahlestedt C, Sundelin J. Molecular cloning of a potential proteinase activated receptor. Proceedings of the National Academy of Sciences of the USA. 1994;91:9208–9212. doi: 10.1073/pnas.91.20.9208. [DOI] [PMC free article] [PubMed] [Google Scholar]
- Nystedt S, Larsson A-K, Åberg H, Sundelin J. The mouse proteinase-activated receptor-2 cDNA and gene. Journal of Biological Chemistry. 1995;270:5950–5955. doi: 10.1074/jbc.270.11.5950. [DOI] [PubMed] [Google Scholar]
- Nystedt S, Ramakrishnan V, Sundelin J. The proteinase-activated receptor 2 is induced by inflammatory mediators in human endothelial cells. Journal of Biological Chemistry. 1996;271:14910–14915. doi: 10.1074/jbc.271.25.14910. [DOI] [PubMed] [Google Scholar]
- Orce GG, Castillo GA, Margolius HS. Inhibition of short-circuit current in toad urinary bladder by inhibitors of glandular kallikrein. American Journal of Physiology. 1980;239:F459–465. doi: 10.1152/ajprenal.1980.239.5.F459. [DOI] [PubMed] [Google Scholar]
- Sakurai H, Nigam SK. In vitro branching tubulogenesis: Implications for developmental and cystic disorders, nephron number, renal repair, and nephron engineering. Kidney International. 1998;54:14–26. doi: 10.1046/j.1523-1755.1998.00969.x. [DOI] [PubMed] [Google Scholar]
- Santulli RJ, Derian CK, Darrow AL, Tomko KA, Eckardt AJ, Seiberg M, Scarborough RM, Andrade-Gordon P. Evidence for the presence of a protease-activated receptor distinct from the thrombin receptor in human keratinocytes. Proceedings of the National Academy of Sciences of the USA. 1995;92:9151–9155. doi: 10.1073/pnas.92.20.9151. [DOI] [PMC free article] [PubMed] [Google Scholar]
- Sauer M, Dörge A, Thurau K, Beck F-X. Effect of ouabain on electrolyte concentrations in principal and intercalated cells of the isolated perfused cortical collecting duct. Pflügers Archiv. 1989;413:651–655. doi: 10.1007/BF00581816. [DOI] [PubMed] [Google Scholar]
- Schlatter E, Greger R, Schafer JA. Principal cells of cortical collecting ducts of the rat are not a route of transepithelial Cl− transport. Pflügers Archiv. 1990;417:317–323. doi: 10.1007/BF00370998. [DOI] [PubMed] [Google Scholar]
- Schnellmann RG, Williams SW. Proteases in renal cell death: calpains mediate cell death produced by diverse toxicants. Renal Failure. 1998;20:679–686. doi: 10.3109/08860229809045162. [DOI] [PubMed] [Google Scholar]
- Scudamore CL, Jepson MA, Hirst BH, Miller HRP. The rat mucosal mast cell chymase, RMCP-II, alters epithelial cell monolayer permeability in association with altered distribution of the tight junction proteins ZO-1 and occludin. European Journal of Cell Biology. 1998;75:321–330. doi: 10.1016/s0171-9335(98)80065-4. [DOI] [PubMed] [Google Scholar]
- Simmons NL. Renal epithelial Cl− secretion. Experimental Physiology. 1993;78:117–137. doi: 10.1113/expphysiol.1993.sp003674. [DOI] [PubMed] [Google Scholar]
- Stoos BA, Náray-Fejes-Tóth A, Carretero OA, Ito S, Fejes-Tóth G. Characterization of a mouse cortical collecting duct cell line. Kidney International. 1991;39:1168–1175. doi: 10.1038/ki.1991.148. [DOI] [PubMed] [Google Scholar]
- Superdock KR, Snyders DJ, Breyer MD. ATP-inhibitable Cl− channel in apical membranes of cultured rabbit cortical collecting duct cells. American Journal of Physiology. 1993;265:C957–965. doi: 10.1152/ajpcell.1993.265.4.C957. [DOI] [PubMed] [Google Scholar]
- Urbach V, Leguen I, O'Kelly I, Harvey BJ. Mechanosensitive calcium entry and mobilization in renal A6 cells. Journal of Membrane Biology. 1999;168:29–37. doi: 10.1007/s002329900495. [DOI] [PubMed] [Google Scholar]
- Vallet V, Chraibi A, Gaeggeler H-P, Horisberger J-D, Rossier BC. An epithelial serine protease activates the amiloride-sensitive sodium channel. Nature. 1997;389:607–610. doi: 10.1038/39329. [DOI] [PubMed] [Google Scholar]
- Vergnolle N, Macnaughton WK, Al-Ani B, Saifeddine M, Wallace JL, Hollenberg MD. Proteinase-activated receptor 2 (PAR2)-activating peptides: identification of a receptor distinct from PAR2 that regulates intestinal transport. Proceedings of the National Academy of Sciences of the USA. 1998;95:7766–7771. doi: 10.1073/pnas.95.13.7766. [DOI] [PMC free article] [PubMed] [Google Scholar]
- Vu T-K H, Hung DT, Wheaton VI, Coughlin SR. Molecular cloning of a functional thrombin receptor reveals a novel proteolytic mechanism of receptor activation. Cell. 1991;64:1057–1068. doi: 10.1016/0092-8674(91)90261-v. [DOI] [PubMed] [Google Scholar]
- Wingo CS. Active and passive chloride transport by the rabbit cortical collecting duct. American Journal of Physiology. 1990;258:F1388–1393. doi: 10.1152/ajprenal.1990.258.5.F1388. [DOI] [PubMed] [Google Scholar]
- Xu WF, Andersen H, Whitmore TE, Presnell SR, Yee DP, Ching A, Gilbert T, Davie EW, Foster DC. Cloning and characterization of human protease-activated receptor 4. Proceedings of the National Academy of Sciences of the USA. 1998;95:6642–6646. doi: 10.1073/pnas.95.12.6642. [DOI] [PMC free article] [PubMed] [Google Scholar]