

Abstract
Dual whole-cell recordings were made from pairs of synaptically coupled excitatory neurones in the ‘barrel field’ in layer (L) 4 in slices of young (postnatal day 12–15) rat somatosensory cortex. The majority of interconnected excitatory neurones were spiny stellate cells with an asymmetrical dendritic arborisation largely confined to a single barrel. The remainder were star pyramidal cells with a prominent apical dendrite terminating in L2/3 without forming a tuft.
Excitatory synaptic connections were examined between 131 pairs of spiny L4 neurones. Single presynaptic action potentials evoked unitary EPSPs with a peak amplitude of 1·59 ± 1·51 mV (mean ± s.d.), a latency of 0·92 ± 0·35 ms, a rise time of 1·53 ± 0·46 ms and a decay time constant of 17·8 ± 6·3 ms.
At 34–36 °C, the coefficient of variation (c.v.) of the unitary EPSP amplitude was 0·37 ± 0·16 and the percentage of failures to evoke an EPSP was 5·3 ± 7·8%. The c.v. and failure rate decreased with increasing amplitude of the unitary EPSP.
Postsynaptic glutamate receptors in spiny L4 neurones were of the AMPA and NMDA type. At −60 mV in the presence of 1 mM Mg2+, NMDA receptors contributed 39·3 ± 12·5% to the EPSP integral. In Mg2+-free solution, the NMDA receptor/AMPA receptor ratio of the EPSC was 0·86 ± 0·64.
The number of putative synaptic contacts established by the projection neurone with the target neurone varied between two and five with a mean of 3·4 ± 1·0 (n = 11). Synaptic contacts were exclusively found in the barrel in which the cell pair was located and were preferentially located on secondary to quarternary dendritic branches. Their mean geometric distance from the soma was 68·8 ± 37·4 μm (range, 33·4-168·0 μm). The number of synaptic contacts and mean EPSP amplitude showed no significant correlation.
The results suggest that in L4 of the barrel cortex synaptic transmission between spiny neurones is largely restricted to a single barrel. The connections are very reliable, probably due to a high release probability, and have a high efficacy because of the compact structure of the dendrites and axons of spiny neurones. Intrabarrel connections thus function to amplify and distribute the afferent thalamic activity in the vertical directions of a cortical column.
In rodents, whisker-related patterns of neuronal architecture are present at the level of the brainstem trigeminal nuclei, the ventrobasal thalamus and the somatosensory cortex. In 1970, Woolsey & van der Loos described neuronal clusters in layer (L) 4 of the mouse somatosensory cortex that mirror the topography of the whisker pad on the animal's muzzle. These cell clusters were named ‘barrels’ and it is now established that each cortical barrel represents a principal whisker on the contralateral side of the face in a one-to-one relationship (Woolsey & van der Loos, 1970; Welker, 1976; Wallace, 1987; Agmon & Connors, 1991; for a review see Jones & Diamond, 1995). The columnar organisation and receptive field properties of these neurones appear to be comparatively simple. This should facilitate elucidation of cortical signal flow at the cellular level.
Afferent nerve fibres from the thalamic ‘relay nuclei’ terminate in L4 of the sensory cortices (Hubel & Wiesel, 1962; Killackey, 1973; Jensen & Killackey, 1987; Lu & Lin, 1993; for reviews see Ebner & Armstrong-James, 1990; Jones & Diamond, 1995). The primary targets of thalamic afferents are excitatory spiny neurones, the majority being spiny stellate cells while a smaller fraction appears to be made up of star pyramidal cells (Lund, 1984; Ahmed et al. 1994; Hirsch, 1995; Stratford et al. 1996). The first step of intracortical signal processing takes place between synaptically coupled spiny neurones in L4; from there, information is relayed to supragranular laminae (Armstrong-James et al. 1992). The main aim of the present study was to investigate the physiological and morphological factors responsible for fast excitatory synaptic transmission within L4 of the barrel cortex. We used dual whole-cell voltage recordings and morphological reconstruction of biocytin-filled spiny neurones to determine the functional properties of EPSPs and the number and dendritic location of synaptic contacts. The results suggest that synapses of spiny L4 neurones are functionally different from other neocortical synapses (Thomson & West, 1993; Thomson et al. 1996; Markram et al. 1997; for a review see Thomson & Deuchars, 1997). Connected neurones were confined to a single barrel and synaptic contacts were established exclusively within the barrel. In comparison to other cortical connections, unitary EPSPs had a low variability and failure rate and, on occasion, were sufficiently large to evoke action potentials (APs) in the target neurone. These properties render synaptically connected spiny stellate and star pyramidal neurones of the barrel cortex well suited to amplify and subsequently distribute incoming thalamic signals within the cortical column.
Preliminary data from this study have been presented in abstract form (Feldmeyer & Egger, 1998).
METHODS
Preparation
Wistar rats (12–15 days old) were anaesthetised with halothane, decapitated, and slices of somatosensory cortex were cut in cold extracellular solution using a vibrating microslicer (DTK-1000, Dosaka Co. Ltd, Kyoto, Japan). The method described by Agmon & Connors (1991) was used with minor modifications necessary for rat brain. The brain was removed from the skull and placed on a ramp with a 10 deg slope with the anterior face downhill. The midline was adjusted so that it was parallel to the walls of the ramp. Subsequently, a vertical cut at an angle of 50 deg was made. The tissue rostral to the cut was discarded and the brain was glued with the cut face downwards onto the chilled stage of the slicer. All experimental procedures were carried out according to the animal welfare guidelines of the Max-Planck Society.
Three to four slices about 800–1000 μm thick were cut and discarded and the remaining tissue was sliced at slow speed and high vibration frequency into 350- to 400-μm-thick slices. Slices were collected with a soft brush, incubated at 35°C in extracellular solution for 30–60 min and subsequently maintained at room temperature (21–23°C) before recording. Under the microscope, the barrel field was clearly visible (Fig. 1A) in five to six slices, and these were used for electrophysiological recordings and biocytin labelling.
Figure 1. Structure of rat barrel cortex.
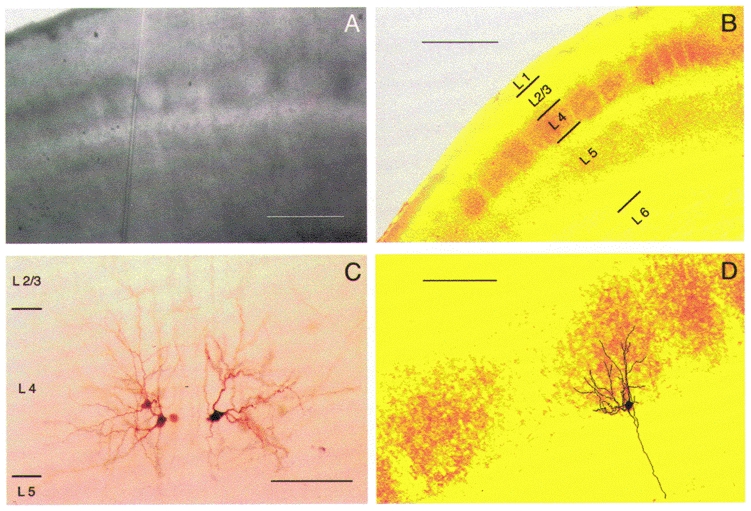
A, living, unstained thalamocortical slice. The barrel field in L4 of rat somatosensory cortex is shown under DIC. The dark borders are clusters of cell somata, while the bright hollows contain primarily dendrites and axon collaterals. B, cytochrome c oxidase stain of a fixed barrel cortex slice. The staining is shown in false colours (yellow/orange) to enhance the contrast. Scale bars in A and B are 500 μm. C, three spiny stellate neurones located at the border between two barrels. The two neurones on the left are from the same barrel and are synaptically coupled; the spiny stellate cell on the right is located in the adjacent barrel. Dendrites of spiny stellate neurones had an asymmetrical orientation and were confined to the barrel in which their somata were located. D, spiny stellate neurone in a cytochrome oxidase-stained barrel. Same section as shown in B. Scale bars in C and D are 100 μm.
Solutions
Slices were continuously superfused with an extracellular solution containing (mM): 125 NaCl, 2·5 KCl, 25 glucose, 25 NaHCO3, 1·25 NaH2PO4, 2 CaCl2 and 1 MgCl2 bubbled with 95% O2 and 5% CO2. 6-Cyano-7-nitroquinoxaline-2,3-dione (CNQX, 10 μM) and D-2-amino-5-phosphonopentanoic acid (D-AP5, 50 μM; both from Tocris Neuramin, Bristol, UK) were added to the perfusate for pharmacological characterisation of EPSPs.
The pipette (intracellular) solution contained (mM): 105 potassium gluconate, 30 KCl, 10 Hepes, 10 phosphocreatine, 4 MgATP and 0·3 GTP (adjusted to pH 7·3 with KOH). The osmolarity of this solution was 300 mosmol l−1. Biocytin (2–5 mg ml−1; Sigma) was routinely added to the internal solution and cells were filled during 1–3 h of recording.
Identification of synaptically connected neurones in the barrel cortex
Slices were placed in the recording chamber under an upright microscope (Axioskop, Carl Zeiss, Göttingen, Germany) fitted with × 2·5 Plan/0·075 NA and × 40 W/0·80 NA objectives, with the pial surface pointing forward and the hippocampus to the right. The barrel field was visualised at low magnification under brightfield illumination and could be identified in L4 as small dark bands with evenly spaced, light ‘hollows’ (Fig. 1A). Barrel structures were present in five to six slices but a continuous band of barrels was visible only in two to three slices just above the fimbria-fornix and the lateral ventricle (cf. Fig. 2A in Agmon & Connors, 1991). In a cytochrome c oxidase stain, these hollows were equivalent to the darker regions indicating a high metabolic activity (Fig. 1A). Individual L4 neurones were identified at × 40 magnification using infrared-differential interference contrast (IR-DIC) microscopy as described previously (Dodt & Zieglgänsberger, 1990; Stuart et al. 1993). The somata of L4 neurones in the barrel field tended to be more concentrated in the dark edges of a barrel (Fig. 1A) as compared to the lighter hollows. In addition, neurones appeared to be organised in clusters with dendrites being confined to a single barrel (Fig. 1A and D).
Figure 2. Analysis of EPSP recordings.
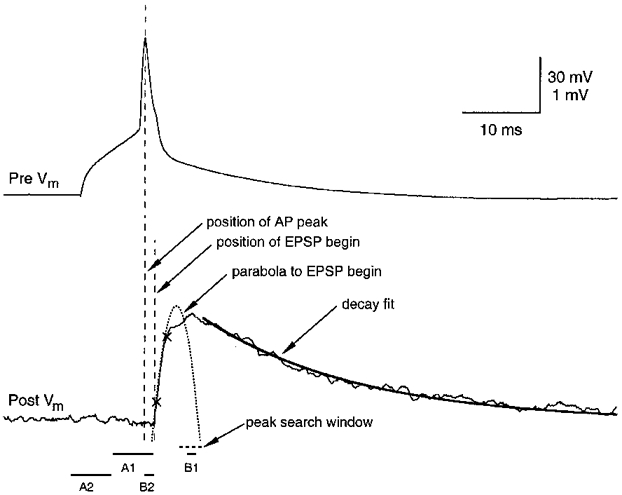
Analysis of amplitude, noise, rise time, decay time and latency of EPSPs. A single presynaptic AP (top) and postsynaptic response (bottom) recorded in a spiny stellate cell pair are shown. Vm, membrane potential. Upper and lower voltage calibrations refer to pre- and postsynaptic recordings, respectively. The two crosses mark 20 and 80% of the peak EPSP amplitude between which the rise time was calculated. The EPSP decay was fitted with an exponential function to the falling phase of the EPSP (thick line). The latency was defined as the interval between the peak of the presynaptic AP and the onset of the EPSP (dashed vertical lines). The onset of the EPSP was obtained from a parabolic fit of the EPSP rising phase to the baseline. The windows selected for the measurement of the noise-contaminated EPSP amplitude and the baseline noise are denoted A1, B1 and A2, B2, respectively (see text for details).
Electrophysiological recordings
Whole-cell voltage recordings from postsynaptic neurones were made using patch pipettes (4–8 MΩ) pulled from thick borosilicate glass capillaries (outer diameter, 2·0 mm; inner diameter, 0·5 mm). Synaptic connections were looked for in the ‘loose-seal’ configuration using a ‘searching’ patch pipette of ∼6–10 MΩ resistance. After establishing a loose seal on a potential presynaptic cell, the command potential was set to about −60 mV in current clamp mode. Subsequently, a 10 ms current pulse was applied to elicit an AP. If an AP was elicited, this was in most cases visible as a small deflection on the voltage trace. When this loose-seal stimulation resulted in coincident EPSPs in the postsynaptic neurone, the searching pipette was withdrawn. The presynaptic cell was then re-patched with a new ‘recording’ pipette (4–8 MΩ, filled with biocytin-containing intracellular solution, and APs were elicited in the whole-cell (current clamp) mode. Pipettes with resistances lower than 4 MΩ were found to lead to the destruction of the relatively small spiny L4 neurones (soma diameter about 15 μm).
Somatic whole-cell recordings were made both at room temperature (21–23°C) and at 34–36°C. Signals were amplified using either an Axopatch 200A in combination with an Axoclamp-2B (Axon Instruments) or an EPC9-2 (HEKA Elektronik, Lambrecht, Germany). Recordings were filtered at 2–5 kHz, digitised at 5–10 kHz using an ITC-16 interface (Instrutech, Great Neck, NY, USA) or a CED 1401+ interface (CED, Cambridge, UK) using the program Pulse (version 8.21, HEKA Elektronik) and stored on the hard disk of a Macintosh or PC computer for off-line analysis (Igor, Wavemetrics, Lake Oswego, OR, USA).
Data analysis
Whole-cell recordings from spiny stellate cells resulted in low baseline noise recordings (80–250 μV peak to peak). In this work, noise is defined as the standard deviation (s.d.) of noise histograms constructed for individual experiments in a way similar to that described by Sayer et al. (1989). First, the EPSP peak amplitude was determined: a baseline region A1 of 5 ms just preceding the EPSP was selected and used for calculation of the mean baseline amplitude, VA1; within a ‘peak search window’ of 2–5 ms (Fig. 2) the maximum voltage, VB1, was detected, and calculated as a mean over 0·5–1 ms (window B1). From this, the EPSP peak amplitude, Vpeak, was determined by subtracting VA1 from VB1. Peak EPSP amplitudes were used to construct amplitude distributions such as those shown in Fig 7 and Fig 8. The baseline noise was obtained by selecting a second baseline region, A2, and amplitude window, B2, identical in duration to A1 and B1, respectively, and separated by the same interval. The mean voltages in windows A2 and B2 were calculated for each response, and noise amplitudes, Vnoise, were obtained after subtraction of VA2 from VB2. These values were then used to construct noise histograms, the s.d. of which is given as background noise of the recordings. The coefficient of variation (c.v.; s.d./mean) of EPSP amplitudes was corrected for baseline noise by subtracting the variance of the baseline noise from the variance of the EPSP peak amplitude (including failures). Failures were defined as events with amplitudes less than 1·5 × noise and/or latencies larger than 2·5 × the mean latency.
Figure 7. Reliability of synaptic connections between spiny stellate cells.
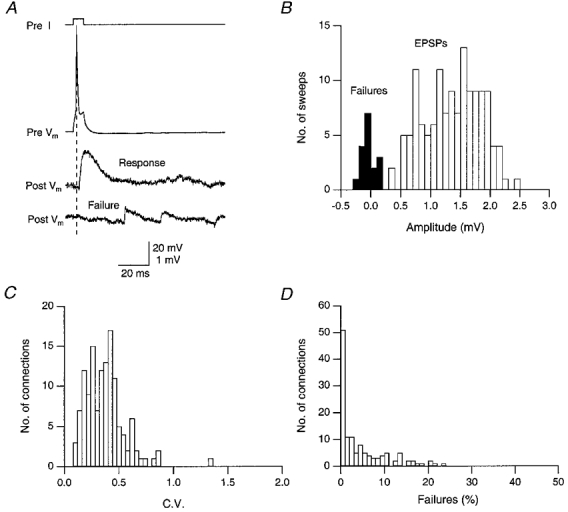
A, examples of success and failure of a presynaptic AP (top trace) to elicit an EPSP. A single response and a failure are shown in the middle and bottom traces. The trace labelled Pre I shows the time course of the current injected via the presynaptic recording pipette to elicit an AP. Upper and lower voltage calibration refer to pre- and postsynaptic recordings, respectively. B, histogram of failures (▪) and EPSP peak amplitudes (□); the failure rate in this experiment was 8·6%. Same cell pair as in A. C, distribution of the c.v. of unitary EPSPs in 131 connections measured at near-physiological temperature (34–36 °C). D, histogram showing the failure rate (%) in morphologically identified spiny stellate cell pairs. The failure rate was determined from 50–400 trials for each connection.
Figure 8. Decrease of failure rate and c.v. with increasing EPSP amplitude.
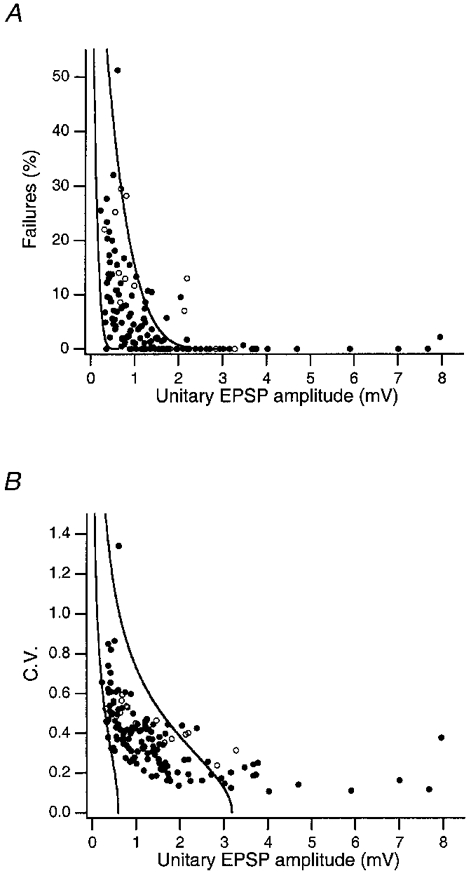
A, percentage of failures plotted as a function of the unitary EPSP peak amplitude in L4 spiny cell connections. B, c.v. plotted as a function of the unitary EPSP peak amplitude in L4 spiny cell connections. Data are from synaptic connections recorded at near-physiological temperature (34–36 °C, n = 131; •) and from those at room temperature (n = 20; ○). The two continuous lines in A and B are fits to the data obtained at 34–36 °C and represent the predictions of binomial release statistics for the percentage of failures as a function of EPSP amplitude with n = 4 and qs = 0·15 mV (right) and qs = 0·8 mV (left) as pr increases from 0·08 to 0·6 (right-hand lines) and from 0·05 to 1·0 (left-hand lines). The pr values refer to the two endpoints of each curve.
The latency of the EPSP was defined as the time interval between the peak AP amplitude and the onset of the EPSP. The latter was determined from the intercept of a parabolic fit to the rising phase of the EPSP and the baseline immediately before the event (Fig. 2). Since spiny stellate cells are both geometrically and electrotonically more compact than for example pyramidal neurones (Mainen & Sejnowski, 1996), recordings in which the latency was 2·5 × that of the mean value were excluded from our statistics. Recordings with a long latency often displayed a high failure rate (> 50%) and a high c.v. (> 0·5) indicating that they may have resulted from disynaptic connections. The EPSP rise times were determined as the mean time to rise from 20 to 80% of the peak amplitude as determined from 45–350 trials (failures excluded). Decay time constants were obtained from single exponential fits to the decay phase of both individual and averaged responses. For individual EPSPs, the decay time constants were only determined from trials uncontaminated by spontaneous activity. To average responses prior to calculation of decay time constants, individual recordings were aligned to minimise effects of latency jitter and trials with a high spontaneous activity were excluded from the response average. Decay time constants obtained from averaged responses differed only marginally from mean values obtained from individual EPSPs (15·5 vs. 17·5 ms).
Histological procedures
Following recording, slices were fixed at 4°C for at least 24 h in 100 mM phosphate-buffered solution (PBS, pH 7·4), containing either 4% paraformaldehyde or 1% paraformaldehyde and 2·5% glutaraldehyde. Slices containing biocytin-filled neurones were processed using a modified protocol described previously (Lübke et al. 1996; Markram et al. 1997). In brief, after incubation of the slices in avidin-biotinylated horseradish peroxidase (ABC-Elite, Camon, Wiesbaden, Germany) reactions were elicited using 3,3-diaminobenzidine as a chromogen under visual control until dendritic and axonal arbors were clearly visible (usually after 2–4 min). Slices were then mounted on slides, embedded in Moviol (Hoechst AG, Frankfurt, Germany) and enclosed with a coverslip. In some slices, cytochrome oxidase staining according to Wong-Riley (1979) was used to visualise the cortical layering and the barrel structure.
Morphological reconstructions of biocytin-filled synaptically coupled neurones
Biocytin-labelled pairs of neurones were examined under the light microscope at high magnification to identify putative synaptic contacts. Only pairs for which a complete physiological analysis was made and which displayed no obvious truncation of dendritic and axonal profiles were used for quantitative morphological analysis. Representative pairs were photographed at low magnification to document dendritic and axonal arborisation; potential synaptic contacts were identified as a close apposition of a synaptic bouton and the postsynaptic dendrite in the same focal plane at × 1200 magnification (Fig 11B–E and Fig 12B–E). In previous studies (Lübke et al. 1996; Markram et al. 1997), we were able to demonstrate that our light microscopic prediction of the number of synaptic contacts was confirmed at the electron microscopic level with a high degee of accuracy (> 80%). Subsequently, neurones were drawn with the aid of a camera lucida attached to an Olympus BX50 microscope (Olympus, Hamburg, Germany) at a final magnification of × 720. Alternatively, biocytin-labelled neurones were reconstructed with Neurolucida software (Microbrightfield, Colchester, VT, USA) using a Zeiss Axioplan microscope at a magnification of × 400 or × 1000. The reconstructions provided the basis for the quantitative morphological analysis of the following parameters: (1) location of the somata within the slice, (2) span of the dendritic field and (3) number and dendritic location of putative synaptic and autaptic contacts. Corrections for shrinkage were not performed.
Figure 11. Uni-directionally connected pair of spiny stellate neurones.
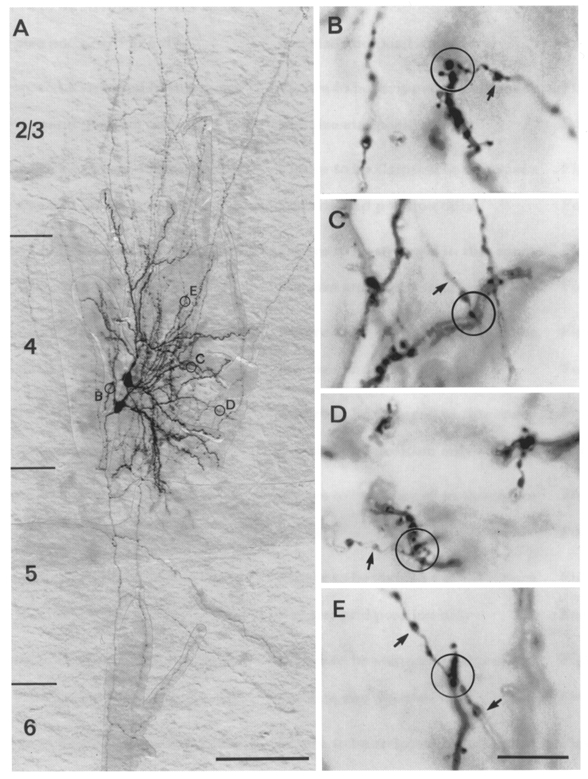
A, low magnification of a light microscopic image of a synaptically coupled cell pair filled with biocytin. The dendritic arbor is confined to L4 whereas the axonal arbors span the cortex from L1 to the white matter with extensive arborisation in L2/3 and L4. B–E, putative synaptic contacts established by the upper neurone with the bottom neurone in the encircled areas in A shown at higher magnification. Arrows mark the en passant axons. In B, an en passant synaptic contact established on a secondary dendrite close to the soma is shown while C–E represent synaptic contacts established with tertiary dendrites at different distances from the soma. Scale bar in A, 100 μm; B–E, 10 μm.
Figure 12. Uni-directionally coupled pair of star pyramidal neurones in L4.
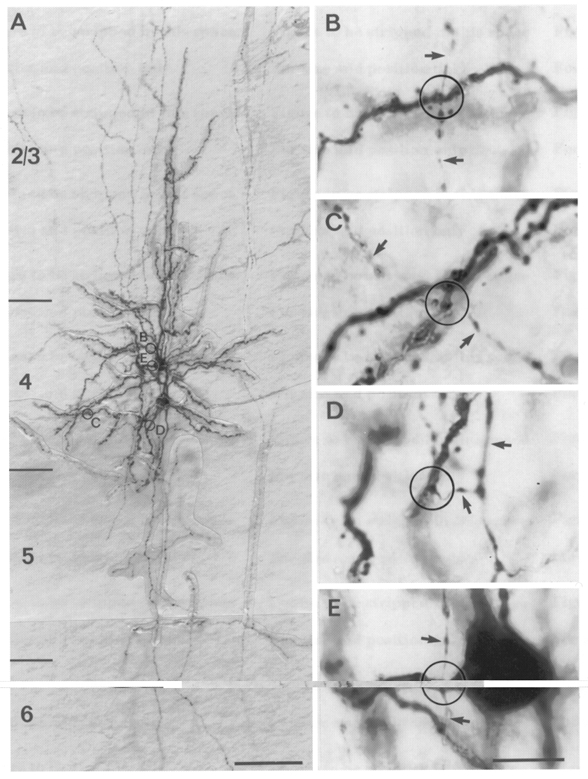
A, low magnification of a light microscopic image of a synaptically coupled cell pair filled with biocytin. In contrast to spiny stellate cells, these neurones possess a prominent, thick apical dendrite terminating in L2/3. The axons span the cortical L1 to L6. B–D, putative synaptic contacts established by the upper neurone with the bottom neurone in the encircled areas in A shown at higher magnification. Arrows mark the en passant axons. B, en passant synaptic contact established on an apical oblique dendrite; C and D, synaptic contacts on basal dendrites at different distances from the soma. E, autaptic contact on a primary dendrite close to the soma of the presynaptic neurone. Scale bar in A, 100 μm; B–E, 10 μm.
For all data, means ±s.d. are given. For comparison of data sets, Student's t test was used.
RESULTS
Whole-cell voltage recordings were combined with biocytin labelling in 131 pairs of synaptically connected excitatory neurones in L4. All cell pairs were located in the barrel field of the somatosensory cortex (Fig. 1). Spiny stellate cells and star pyramidal cells displaying good staining of both the axonal and dendritic arbor were selected for quantitative morphological analysis.
Physiological and morphological identification of cell types
Neurones were classified as excitatory or inhibitory on the basis of their AP discharge pattern. When stimulated with a 0·3- to 1-s-long depolarising current step, excitatory neurones responded initially with a high frequency of APs that adapted to lower, sustained frequencies (Fig. 3A and B); this firing pattern was termed ‘regular spiking’ according to criteria established previously (McCormick et al. 1985; Chagnac-Amitai & Connors, 1989). Intrinsically bursting neurones have been described for L4 of the visual cortex (Hirsch, 1995) but such neurones were not found in the barrel cortex of juvenile animals. The extent of after-hyperpolarisation and frequency adaptation varied between individual excitatory neurones so that further classification based on the firing pattern was not possible.
Figure 3. Morphology and AP firing pattern of spiny L4 neurones.
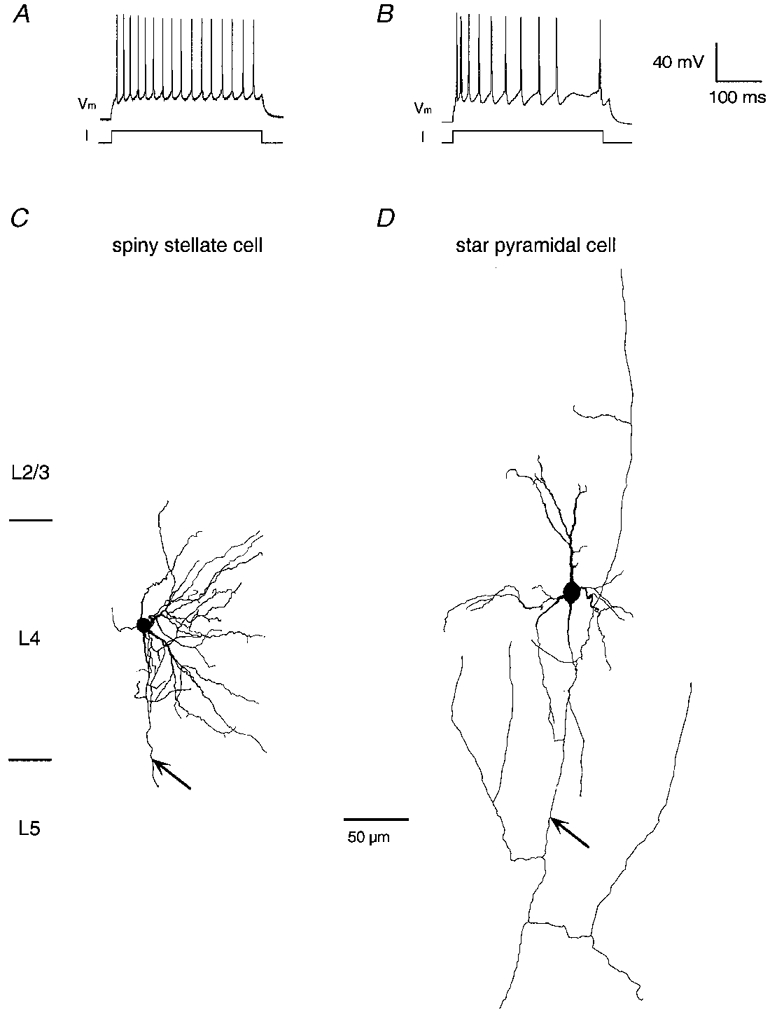
A and B, AP firing pattern of a spiny stellate cell (A) and a star pyramidal neurone (B) in L4 of the barrel field. To elicit APs a 300 ms-long current pulse (I; 100–400 pA) was injected into the cell. Spiny stellate cells and star pyramidal neurones displayed a regular spiking pattern with a variable extent of after-hyperpolarisation and spike adaptation (cf. A and B). C and D, reconstructions of a spiny stellate cell (C) and a star pyramidal neurone (D) in L4 of the barrel field at low magnification; axons are not shown in their entirety. While spiny stellate cell dendrites were confined to L4, star pyramidal neurones had a short, untufted apical dendrite that terminated in L2/3. Axons are marked by arrows.
The input resistance of regular spiking neurones classified as spiny stellate cells (see below) was 28·3 ± 7·5 MΩ, and that of star pyramidal cells was 28·1 ± 8·3 MΩ. This low input resistance may be due to the presence of gap junction coupling between spiny L4 neurones and fusiform interneurones (L. Venance, H. Monyer & D. Feldmeyer, unpublished observations). The respective resting membrane potentials were −68·2 ± 3·3 and −68·5 ± 3·2 mV.
Inhibitory neurones in L4 displayed a fast spiking pattern, with little adaptation during the train and high maximum firing frequencies (not shown) as described for GABAergic interneurones (McCormick et al. 1985; Connors & Gutnick, 1990). The AP duration was markedly shorter (∼0·5 ms) than in excitatory neurones (∼1 ms); the after-hyperpolarisation was steeper and more pronounced. However, the firing pattern of interneurones was variable, most probably due to the presence of several types of interneurones in L4.
According to morphological criteria, two classes of excitatory neurones (Fig. 3A and D) were observed. Cell identification in the acute slice was often difficult because of a high cell density and a compact dendritic and axonal plexus in the granular layer (L4), in particular when neurones were located deep within the slice (50–100 μm).
The majority of L4 neurones (∼70%) resembled those described as spiny stellate cells (Fig 1C and D and Fig 3C) with small spherical cell bodies (∼10–15 μm in diameter). Remarkably, spiny stellate cells in the barrel cortex have a dendritic arbor with an asymmetrical orientation (Fig 1C and D and Fig 3C; c.f. Woolsey et al. 1975; Harris & Woolsey, 1981; Simons & Woolsey, 1984) in contrast to those of the visual cortex, which display a characteristic multipolar, radially symmetrical dendritic field (LeVay, 1973; Lund, 1984; Martin & Whitteridge, 1984). However, at borders between ocular dominance columns asymmetries in the dendritic field of spiny stellate cells have been observed in both cat and monkey visual cortex (Katz et al. 1989; Kossel et al. 1995). A second subpopulation (∼15%) of L4 neurones was identified as star pyramidal cells (Fig. 3A) as described for the visual cortex (Lund, 1984) and for the rat barrel cortex (Simons & Woolsey, 1984). In contrast to spiny stellate cells these neurones have a prominent apical dendrite, occasionally visible under IR-DIC optics, extending to the lower to middle L2/3 generally without forming a dendritic tuft. Between these two cell types, a continuum in the dendritic morphology was observed (see also Lund, 1984).
The remaining neurones could be classified as GABAergic interneurones. These neurones were, however, very heterogeneous with respect to their dendritic arborisation and axonal projections.
Whole-cell voltage recording, in combination with signal averaging, allowed reliable detection of a synaptic connection between L4 spiny cells. In 70% of the cell pairs the synaptic connection was uni-directional (Fig. 4A), while in 30% it was bi-directional (Fig. 4A), i.e. both neurones were pre- as well as postsynaptic. Bi-directional synaptic connections were apparently more common in cell clusters, although this was not examined in detail.
Figure 4. Uni- and bi-directional connection between pairs of spiny stellate neurones.
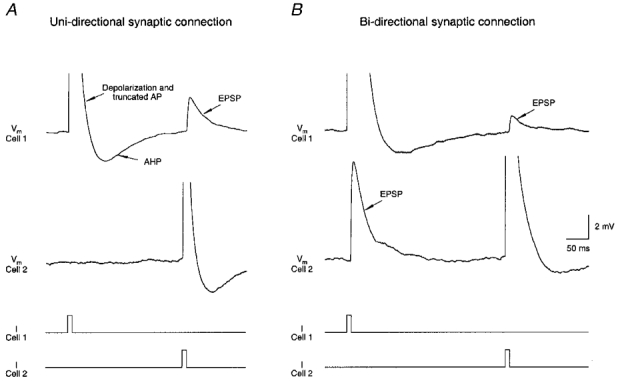
Simultaneous voltage recordings from a pair of synaptically coupled spiny stellate cells. Traces were obtained at 34–36 °C and represent means of 50 records. A, uni-directional connection: an AP in cell 1 fails to elicit an EPSP in cell 2 while an AP in cell 2 results in an EPSP in cell 1. B, bi-directional connection: an AP evoked in either cell 1 or cell 2 elicits an EPSP in the other cell. Traces labelled I show the time course of the current injected via the recording pipette; Vm, membrane potential; AHP, after-hyperpolarisation.
Functional properties of intrabarrel synapses
Latency of unitary EPSPs
Figure 5A illustrates the time course of APs evoked by current injection in the soma of a presynaptic spiny stellate cell (upper trace), which elicited unitary EPSPs in a postsynaptic spiny stellate cell (lower traces) with a latency in the range 0·3-1·5 ms (34–36°C). Successive APs evoked unitary EPSPs with variable amplitudes and latencies. In each individual synaptic connection, the latency of a unitary EPSP could vary up to 3-fold during consecutive trials. The latency histogram has a single peak (Fig. 5A), and a weak albeit not significant negative correlation of latency and EPSP amplitude was observed (Fig. 5A). For the four types of L4 connections (Table 1) significant differences in the mean latencies were not observed (P > 0·15).
Figure 5. Latency fluctuation of unitary EPSPs in a spiny stellate cell.
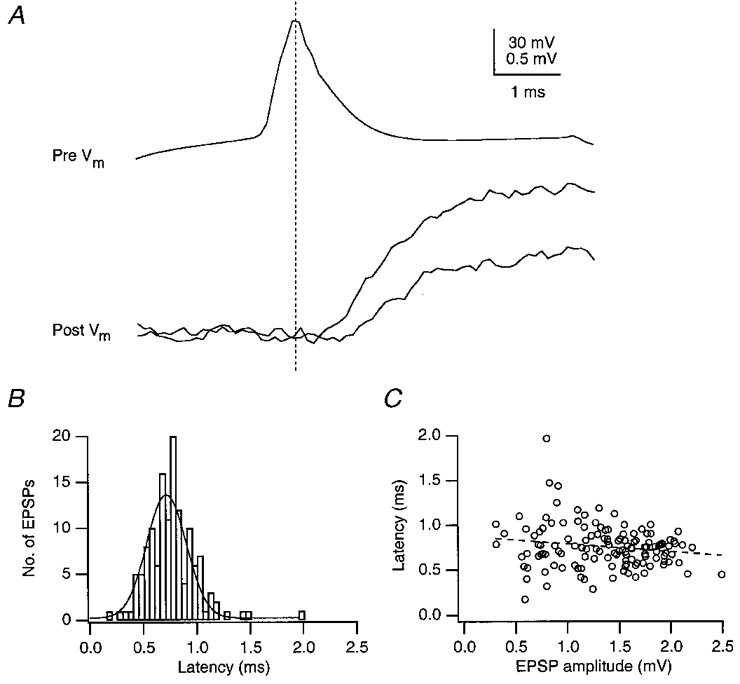
A, presynaptic AP (top trace) and unitary EPSPs (bottom traces) recorded from a pair of spiny stellate cells. The EPSP recording shows small fluctuations in latency, measured between the peak of the presynaptic AP and the beginning of the EPSP. Upper and lower voltage calibration refer to pre- and postsynaptic recordings, respectively. B, distribution of latencies of unitary EPSPs. C, plot of latency against peak EPSP amplitude showing a weak inverse relationship, which was statistically not significant. Correlation coefficient is −0·17 and slope is −0·09 ms mV−1 (at 34–36 °C).
Table 1.
Kinetic parameters of EPSPs in different L4 neurone connections
| Spiny stellate → spiny stellate | Star pyramidal → spiny stellate | Spiny stellate → star pyramidal | Star pyramidal → star pyramidal | Pooled data (34–36 °C) | Pooled data (21–23 °C) | |
|---|---|---|---|---|---|---|
| Unitary EPSP | 1.67 ± 1.70 | 1.45 ± 1.13 | 1.35 ± 0.89 | 1.36 ± 0.43 | 1.59 ± 1.51 | 1.36 ± 0.87 |
| amplitude (mV) | (n = 94) | (n = 15) | (n = 12) | (n = 10) | (n = 131) | (n = 20) |
| c.v. | 0.37 ± 0.16 | 0.38 ± 0.19 | 0.36 ± 0.16 | 0.41 ± 0.35 | 0.37 ± 0.18 | 0.56 ± 0.23 |
| Failure rate (%) | 5.4 ± 6.9 | 5.1 ± 6.3 | 4.0 ± 7.0 | 7.2 ± 16.0 | 5.3 ± 7.8 | 9.4 ± 10.7 |
| 20–80% rise time (ms) | 1.51 ± 0.40 | 1.59 ± 0.52 | 1.62 ± 0.53 | 1.66 ± 0.83 | 1.53 ± 0.46 | 3.01 ± 1.00 |
| Latency (ms) | 0.93 ± 0.34 | 0.88 ± 0.34 | 0.75 ± 0.29 | 1.00 ± 0.46 | 0.92 ± 0.35 | 2.55 ± 0.51 |
| Decay time | 17.7 ± 5.4 | 17.4 ± 11.0 | 19.3 ± 7.5 | 16.8 ± 2.2 | 17.8 ± 6.3 | 47.3 ± 26.3 |
| (monoexponential) (ms) | (n = 63) | (n = 11) | (n = 8) | (n = 6) | (n = 88) | (n = 11) |
Kinetic parameters of EPSPs recorded in morphologically identified L4 neurones in rat barrel cortex. For spiny stellate cells, uni- and bi-directional synaptic connections have been grouped together. Values are means ± s.d.; the number of analysed cells is given in parentheses. No significant differences (P > 0.1) between the four types of synaptically connected pairs of spiny L4 neurones were found. For pooled data, values obtained at 34–36 °C and 21–23 °C are compared in the last two columns. Latency, rise and decay times and c.v. obtained at room temperature were significantly different (P < 0.02) from the corresponding values at 34–36 °C. This was not the case for the EPSP amplitude and the failure rate.
EPSP time course
Spiny stellate cells and star pyramidal cells are characterised by a high frequency of spontaneous EPSPs which was not observed in pyramidal neurones of either L2/3 or L5 under otherwise identical experimental conditions (data not shown; cf. Markram et al. 1997). Although this high spontaneous activity did not impair a reliable detection of synaptic connections, it did prevent in some cells the analysis of evoked unitary EPSPs. In particular, the EPSP decay was superimposed with spontaneous EPSPs or large variations in the resting potential. To obtain reliable estimates of the decay time constant only uncontaminated records were selected for analysis.
For synaptically connected spiny stellate cell pairs, recordings were made both in the near physiological temperature range (34–36°C) and at room temperature (21–23°C) to allow a comparison with other studies performed at different temperatures.
Figure 6A and B shows a presynaptic AP and EPSP in spiny stellate cells recorded at 34–36°C on different time scales. The data shown in Fig. 6A indicate that rise and decay times of EPSPs in spiny L4 neurones were significantly shorter than those observed in L5 pyramidal neurones (Table 1; cf. Markram et al. 1997). The unitary EPSP amplitude appeared to be little affected by changes in the temperature (1·45 ± 0·84 mV at 21–23°C vs. 1·55 ± 1·53 mV at 34–36°C) whereas at 34–36°C (n = 131 cell pairs), the latency between the peak of the AP and the onset of the EPSP, and the EPSP rise and decay times were about 2- to 3-fold faster than at 21–23°C (n = 20; Fig. 6A). The data are summarised in Table 1 (cf. the last two columns).
Figure 6. Time course and amplitude of EPSPs in excitatory L4 neurones of the barrel cortex.
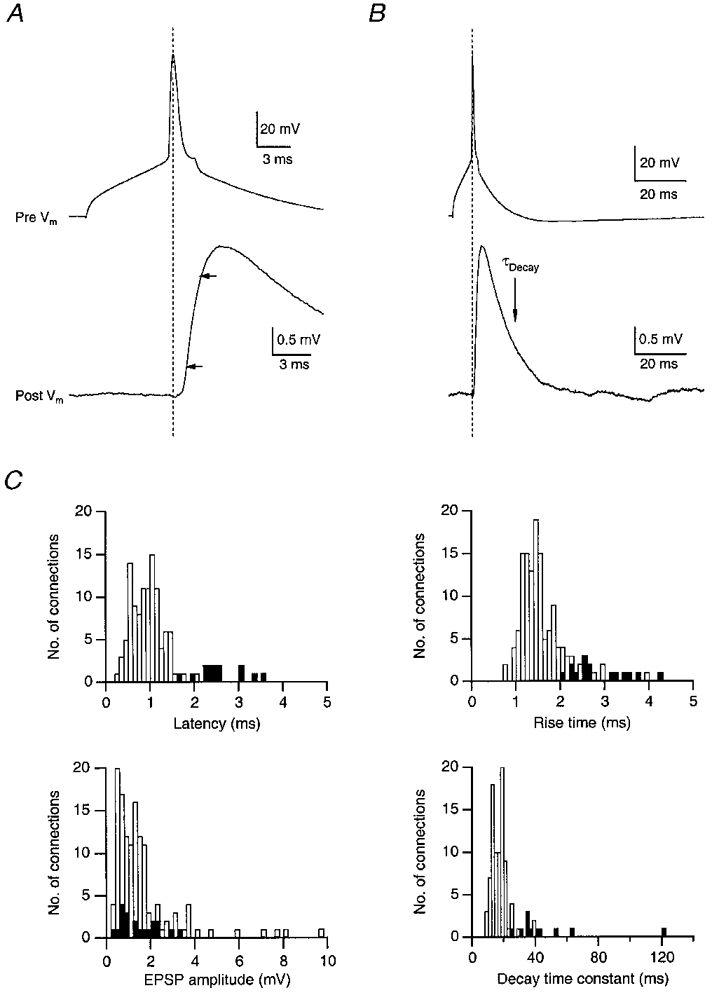
A and B, time course of EPSP rise (A; arrows mark 20 and 80% of peak amplitude) and decay (B) at 35 °C (same recording). Traces represent means of 20 unitary EPSPs. C, histograms of EPSP latency, 20–80% rise time, unitary EPSP amplitude and decay time constant in excitatory L4 neurones. Data from spiny stellate and star pyramidal neurones were pooled. Decay times were obtained by fitting a single exponential to the decay of the mean unitary EPSP. □, recordings at 34–36 °C; ▪, recordings at room temperature (21–23 °C). The mean latency of unitary EPSPs was 2·55 ± 0·51 and 0·92 ± 0·35 ms, the mean rise time 3·01 ± 1·00 and 1·53 ± 0·46 ms, and the mean decay time 47·3 ± 26·3 and 17·8 ± 6·3 ms at room temperature and 34–36 °C, respectively.
Reliability of synaptic transmission at excitatory L4 connections
The low background noise of the recordings (50–250 μV; s.d. of noise histograms) permitted the reliable detection of the success or failure of the presynaptic AP to evoke an EPSP, despite the high spontaneous PSP activity in L4 neurones (Fig. 7A and B). Transmission between most pairs of spiny L4 neurones was highly reliable (Fig. 7A and D) with 34% of the connections showing no failures at all (less than 0·5%). At 34–36°C the mean failure rate was as low as 5·3 ± 7·8% with a median of 2·1% and at room temperature this value increased to only 11·5 ± 2·8% (median, 11·6%; Fig. 8A) suggesting that the release probability is relatively high at these synaptic contacts. Despite the low percentage of failures, the peak amplitude of unitary EPSPs fluctuated randomly around a mean value in consecutive trials. In 131 pairs of spiny L4 neurones the c.v. ranged from 0·11 to 1·34, with a mean of 0·37 ± 0·18 (median, 0·36). This value was increased to 0·61 ± 0·23 at room temperature (n = 20), with a minimum of 0·24 and a maximum of 1·00 (Fig. 7A).
Most EPSP amplitude distributions obtained from spiny stellate cell pairs were not Gaussian as seen from the skewness, S, of these distributions:
where ΔVi is the peak amplitude of the ith trial, ΔV is the mean peak amplitude and n is the number of trials. The cubic root of the skewness,  S, ranged between −0·26 and +0·72 mV in different experiments or from −0·02 to +0·37 when normalised to peak EPSP amplitude. The mean skewness was 0·05 ± 0·10 mV (0·06 ± 0·10 for normalised value). In a few pairs of spiny L4 neurones, unitary EPSP amplitude distributions displayed multiple peaks; this was, however, not generally the case.
The relationships between the unitary EPSP amplitude and the percentage of failures and c.v. are illustrated in Fig. 8. While the percentage of failures was relatively high (up to 51%) when the unitary EPSP was small (< 1·0 mV) it decreased sharply for larger EPSP amplitudes. Similarly, the c.v. was inversely related to the amplitude of the unitary EPSP, a relationship that appeared to be more prominent when recordings were made at room temperature. In binomial models of synaptic transmission these relationships are to be expected when the unitary EPSP amplitude is primarily determined by the release probability (pr).
Fits of the data obtained at physiological temperature according to a simple binomial model with c.v. =√[(1 - pr)/nbpr] and pr =ΔV/nbqs, and fixed values for the number of release sites, nb, and the quantal EPSP amplitude at the soma, qs, were not satisfactory, because best fits excluded all amplitudes larger than 2 mV. To obtain limits for nb and qs, we assumed that nb was 4 (i.e. close to the mean number of putative synaptic contacts found in morphological reconstructions, see below). The two limiting curves in Fig. 8A and B were calculated for qs = 0·15 and 0·8 mV. All unitary EPSP amplitudes within a range from 0·2 to 2·0 mV fell between the two fitted curves, suggesting that at least for these ranges of unitary and quantal EPSP amplitudes, pr may vary almost 20-fold (from 0·05 to 1·0). However, all data points for unitary EPSPs larger than 2 mV fell outside this range. A possible explanation may be that the number of release sites per putative synaptic contact is larger than one in these connections. In addition, a deviation from the binomial model of transmitter release may be observed because of the relatively large contribution of the NMDA receptor (NMDAR) component (see below); with larger EPSPs, the NMDAR component will be more dominant but also highly variable, since the degree of relief from Mg2+ block is voltage dependent. This may lead to extra variance and thus to an overestimation of the c.v. in connections with large unitary EPSPs.
It is noteworthy that the range of failure rates and c.v. values was clearly smaller than that observed in unitary EPSPs of L5 pyramidal neurone pairs although the mean amplitudes were not very different (Markram et al. 1997). Even at room temperature, the mean failure rate and c.v. of spiny L4 connections were smaller than those observed in L5 pyramidal neurone connections at 32–34°C, indicating that synaptic transmission in spiny L4 connections is of a higher reliability.
Unitary EPSPs in spiny L4 neurones can elicit APs
In 11 pairs of spiny L4 neurones, the mean peak amplitude of the unitary EPSP exceeded 3·6 mV, three times the median EPSP amplitude (1·2 mV). In some of these connections, the unitary EPSP was sufficiently depolarising to evoke APs in the postsynaptic cell either following a single presynaptic AP (Fig. 9A) or during bursts of APs (Fig. 9A). In addition, seven potential disynaptic connections were observed. In five of these, the mean latency of the EPSPs exceeded 1·9 ms, more than twice that observed in other spiny L4 connections; two other cell pairs showed large EPSPs (15 and 19 mV on average) with distinct multiple peaks of which only the first could have arisen from a monosynaptic connection. Some of these potential disynaptic connections also had a high c.v. and/or failure rate. Application of low concentrations of CNQX (1 μM), which resulted in only partial block of the EPSP amplitude in monosynaptic connections, caused a complete (100%) failure of the presynaptic AP to elicit EPSPs. This indicates that the EPSP did not result from direct presynaptic activation. The low concentration of CNQX may have reduced the EPSP amplitude below the AP threshold so that synaptic transmission via the disynaptic connection was blocked.
Figure 9. Suprathreshold unitary EPSPs in spiny L4 neurones.
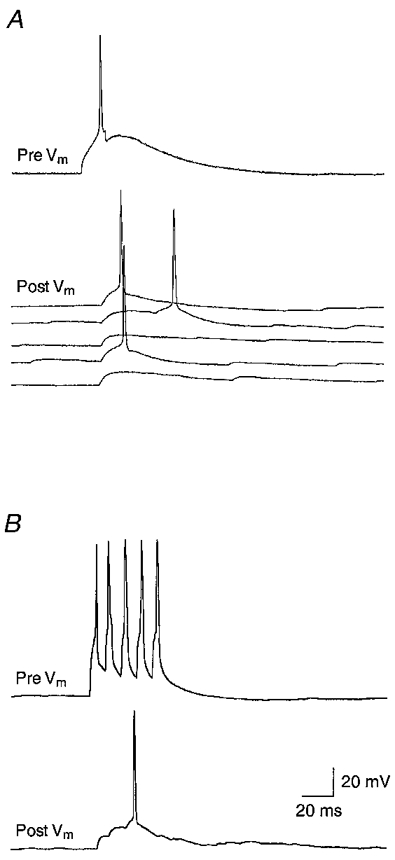
A, spiny stellate cell pair in which the presynaptic AP evoked suprathreshold EPSPs in the postsynaptic cell (Vm =−61 mV). Five representative, consecutive responses are shown. The latency of the postsynaptic AP had a considerable jitter, depending on the amplitude of the unitary EPSP. B, AP generation in a postsynaptic neurone (Vm =−65 mV) by a high-frequency (100 Hz) burst of APs in the presynaptic cell. Calibration bars in B also apply to A.
Relative contribution of NMDA receptors to unitary EPSPs at spiny L4 synapses
Unitary EPSPs in spiny L4 neurones are mediated by both AMPA- and NMDA-type glutamate receptors as the respective antagonists reduce the EPSP amplitude. The relative contribution of NMDARs to the EPSP amplitude was examined by blocking the AMPA receptor (AMPAR) component with CNQX (10 μM) in the extracellular solution, but without added glycine. Between 30 and 100 EPSPs were recorded in control solution and only neurones with sufficiently large EPSPs (> 0·5 mV) were selected. The somatic membrane potential of the postsynaptic cells was held at −60 mV. After the addition of CNQX, 30–300 sweeps were averaged to obtain a mean waveform of the NMDAR-mediated component of the EPSP (Fig. 10A). With 1 mM extracellular Mg2+, unitary EPSPs were reduced to 27·0 ± 9·9% of their amplitude (n = 20). The relative size of the NMDAR-mediated EPSP varied between experiments from a minimum value of 13·7% to a maximum value of 47·9%. In 17 connections the background synaptic activity was sufficiently low to allow a measurement of the EPSP integral before and after CNQX application. At −60 mV, this integral was reduced to 39·3 ± 12·5% in the presence of the AMPAR antagonist (Fig. 10A). At −50 mV, the relative contribution of the NMDAR-mediated component increased to 36·1 ± 12·1% of the EPSP amplitude and 42·8 ± 2·4% of the EPSP integral.
Figure 10. NMDAR/AMPAR ratio of unitary EPSPs and EPSCs in spiny L4 neurones.
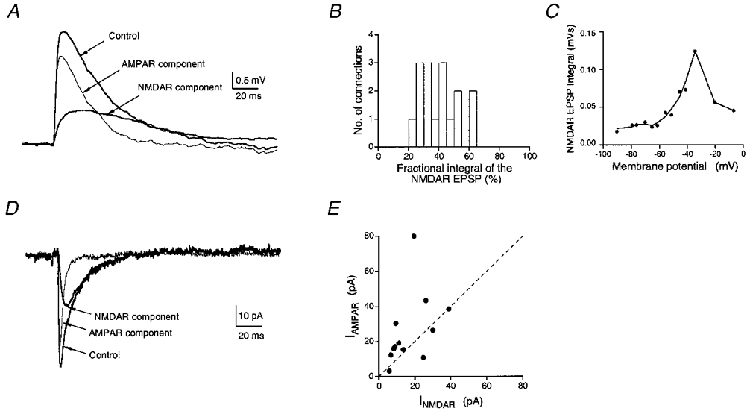
A, unitary EPSPs measured in a spiny stellate cell before (Control) and after the addition of 10 μM CNQX to the bath solution to isolate the NMDAR-mediated component. Traces are means of 50 sweeps. The membrane potential was set to −60 mV during the recording. The thin line represents the EPSP component mediated by AMPARs obtained by subtraction of the EPSP in CNQX-containing saline from that in control saline. B, histogram of the fractional NMDAR-mediated EPSP integral (n = 17) at −60 mV recorded in the presence of CNQX. The mean integral of the NMDAR-dependent EPSP was 39·3 ± 12·5% of that in the absence of the AMPAR antagonist. C, voltage dependence of the NMDAR-mediated EPSP integral measured between −90 and −10 mV. D, unitary EPSCs measured in a spiny stellate cell before (Control) and after addition of 10 μM CNQX to the bath solution to isolate the NMDAR-mediated component. The postsynaptic neurone was held at a membrane potential of −60 mV. The thin line represents the AMPAR-mediated component of the EPSC and was obtained by subtracting the peak current in the presence of CNQX from that in its absence. E, ratio of peak AMPAR current vs. peak NMDAR current plotted for 12 cell pairs at −60 mV. The dashed line represents unity, i.e. when the peak AMPAR current is equal to the NMDAR current.
To measure the voltage dependence of the NMDAR-mediated unitary EPSP, QX314 (2·5-5·0 mM) was added to the pipette solution to block AP initiation. Both the peak amplitude and the integral of the unitary NMDAR-mediated EPSP displayed a characteristic shape reflecting the voltage-dependent Mg2+ block of NMDAR channels (Fig. 10A). At around −40 mV both the peak amplitude and the integral of the NMDAR-mediated component were maximal, but NMDAR-mediated EPSPs were even detectable at −100 mV. The decay time course of the NMDAR-mediated EPSP had a pronounced voltage dependence (not shown). At potentials close to the firing threshold, Na+ channels might also contribute to the lengthening of the EPSP decay, in particular when the EPSP amplitude is large. However, this point was not investigated in detail. Thus, the increase in the relative EPSP amplitude as well as the change in the decay kinetics following relief of the Mg2+ block make it likely that postsynaptic NMDARs contribute significantly to the synaptic initiation of APs at these synaptic connections.
NMDAR- and AMPAR-mediated currents
To estimate the relative density of AMPAR and NMDAR channels in the postsynaptic membrane we determined the relative size of the two current components in nominally Mg2+-free extracellular solution. Unitary EPSCs were measured at −60 mV and averaged before and after the addition of CNQX (10 μM). At the end of the experiment, D-AP5 (50 μM) was added to the external solution to demonstrate that the remaining EPSCs resulted solely from NMDAR activation; in all cases, a complete block was achieved. The peak unitary EPSC amplitude in the absence of any antagonist was on average 36·8 ± 25·3 pA (n = 11). Figure 10A illustrates the relatively large NMDAR component of unitary EPSCs in a spiny stellate cell connection. Its relative contribution to the peak EPSC amplitude varied considerably (between 21 and 87%) and was on average 46 ± 18%. The mean NMDAR/AMPAR current ratio (Fig. 10A) was 0·86 ± 0·64 and thus larger than that observed at other cortical synapses (e.g. Stern et al. 1992). It has to be kept in mind, however, that because of the distance of synaptic contacts from the soma and the small diameter of the dendrites the AMPAR-mediated current component is an underestimate due to dendritic filtering.
Morphology of synaptically coupled cells within a barrel
Out of 131 physiologically characterised and biocytin-filled cell pairs, 10 were selected for quantitative analysis of the number and dendritic location of synaptic contacts. Of these, eight connections were between spiny stellate cells and two were between star pyramidal neurones; one pair of spiny stellate cells was reciprocally connected.
Spiny stellate cells
All spiny stellate cells examined had an asymmetrical orientation of their dendrites (Fig 1C and D, Fig 3C, Fig 11C and Fig 13) in contrast to the majority of those in the visual cortex, which show characteristic multipolar, radially symmetrical dendritic fields (LeVay, 1973; Lund, 1984; Martin & Whitteridge, 1984). Even dendrites of neurones located at the very edges of a barrel were not seen to extend into adjacent barrels (Fig. 1A) and thus these neurones were similar to the class Ia and Ib neurones described by Woolsey et al. (1975) for mouse SmI cortex. This asymmetrical orientation of the dendritic domain is due to its confinement to single barrels (Woolsey et al. 1975; Harris & Woolsey, 1981).
Figure 13. Reconstruction of a pair of reciprocally connected spiny stellate cells.
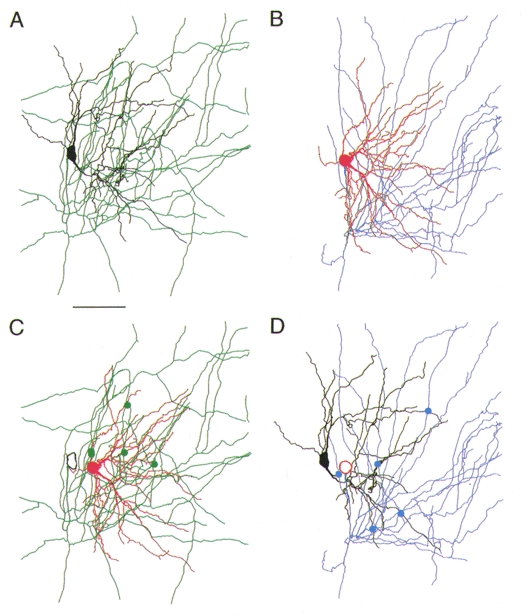
Computer-assisted three-dimensional reconstruction of a pair of reciprocally coupled L4 spiny stellate neurones. The axon of the black spiny stellate cell is drawn in green (A), the axon of the red spiny stellate cell is drawn in blue (B). Putative synaptic contacts by the green axon with the dendrites of the red neurone are marked by green dots (C); contacts established by the blue axon with the dendrites of the black neurone are marked by blue dots (D). Scale bar, 50 μm. The centres of the somata of the two neurones were 19 μm apart in the horizontal direction and 7 μm apart in the vertical direction.
Two spiny stellate neurones that were uni-directionally coupled are shown in Fig. 11A at low magnification. Their putative synaptic contacts at different dendritic locations are illustrated at higher magnification in Fig. 11B–E. Both the somata and their dendritic domains were confined to L4 with only a few dendrites terminating in L2/3. Their axons spanned all cortical layers with ascending collaterals often terminating at the border between L2/3 and L1 while descending collaterals ended in the white matter. The density of the axonal collaterals was highest in L4 and the lower part of L2/3 (Fig. 11A). At the level of L4, axons appeared to be confined to a single barrel.
Contacts made by the projecting neurone on the target neurone were exclusively found on dendrites within L4. They were distributed over the entire dendritic arbor but preferentially established on tertiary dendritic branches (approximately 30%). Most contacts were relatively close to the soma; however, a few were located at more distal portions of the dendrite (up to 160 μm from the soma). The majority (70%) of putative synaptic contacts were established on dendritic spines and the remainder were found on dendritic shafts.
Star pyramidal neurones
Two coupled star pyramidal neurones are shown in Fig. 12A at low magnification. Three putative synaptic contacts (Fig. 12B–D) and one of two putative autaptic contacts (Fig. 12A) are depicted at higher magnification. As in spiny stellate cells, the somata of connected star pyramidal neurones as well as their dendritic arbor were located exclusively in L4 (Fig 11C and Fig 12C) with the exception of a prominent apical dendrite that extended to L2/3.
The axons of star pyramidal neurones also spanned all cortical layers (L1-6) with only a few horizontal collaterals in L5 and L6 and a much higher density in L4 and L2/3. Putative synaptic contacts were established only on dendritic segments confined to L4. Most contacts were on basal dendrites but a few were also found on apical oblique dendrites (Fig. 12A).
In addition, synaptic contacts established by the axon with its own dendrites, so-called autapses, were found on both spiny stellate and star pyramidal neurones (Fig. 12A). These autapses occurred on either the pre- or the postsynaptic neurone within a coupled pair (number of autaptic contacts per neurone, 0·5 ± 0·7; minimum, 0; maximum, 2; Table 2) with a distribution similar to that of synaptic contacts (cf. Lübke et al. 1996).
Table 2.
Number and distance from soma of synaptic and autaptic contacts
| Synaptic | Autaptic | |||||
|---|---|---|---|---|---|---|
| Pair no. | Type of connection | No. of contacts | Mean distance (μm) | s.d. (μm) | No. of contacts | Distance (μm) |
| 100697A | Star pyramidal pair | 3 | 67.9 | 26.0 | 0 | — |
| 170697B | Star pyramidal pair | 3 | 53.2 | 21.5 | 2 | 5.3, 47.8 |
| 210297A | Spiny stellate pair | 3 | 33.4 | 19.5 | 1 | 35.9 |
| 110797A | Spiny stellate pair | 4 | 82.6 | 36.7 | 2 | 47.0, 76.3 |
| 180797A | Spiny stellate pair | 3 | 126.6 | 37.4 | 2 | 8.3, 67.8 |
| 180897D | Spiny stellate pair | 2 | 38.9 | — | 0 | — |
| 111197B | Spiny stellate pair | 2 | 46.5 | — | 0 | — |
| P0311B | Spiny stellate pair | 4 | 35.5 | 22.2 | 1 | 54.6 |
| P1126B | Spiny stellate pair | 5 | 42.6 | 32.2 | 1 | 106.3 |
| P1126Br | Spiny stellate pair | 5 | 76.1 | 36.6 | 0 | — |
| P80818A | Spiny stellate pair | 3 | 74.8 | 19.8 | 0 | — |
| n | 11 pairs | 42* | — | 20 cells | 9* | |
| Mean | 3.4 | 69.1 | — | 0.5 | 51.0 | |
| s.d. | 1.0 | 41.2 | — | 0.7 | 32.2 | |
| s.e.m. | 0.3 | 6.4 | — | 0.2 | 10.7 | |
Mean obtained from individual values. Putative synaptic and autaptic contacts were identified visually for two star pyramidal and eight spiny stellate cell pairs.
Distribution of synaptic contacts
The dendritic location of synaptic contacts was measured from geometric dendrograms constructed from camera lucida drawings of dendritic and axonal arbors. Figure 13A and B shows a reconstruction of a bi-directionally coupled pair of spiny stellate cells. In Fig. 13A and D only axonal arbors of the projecting cell and dendritic arbors of the target cell are illustrated together with the location of putative synaptic contacts (green dots and blue dots, respectively). The corresponding geometric dendrograms (Fig. 14) illustrate the short distance of putative synaptic contacts from the soma. On both cells five potential contacts were identified. The mean amplitudes of the unitary EPSPs in the two cells, however, were very different (3·7 and 0·7 mV). The geometric dendrograms also illustrate that synapses were located on primary to sexternary branches of the dendrites at distances of 12 to 122 μm from the soma. Synaptic contacts were only formed by proximal axon collaterals (up to 100 μm from the soma) of the spiny stellate cell axons. In the spiny stellate cell that had EPSPs with a large mean amplitude, contacts were on average closer to the soma (42 vs. 76 μm).
Figure 14. Geometric dendrogram of the pair of reciprocally connected neurones.
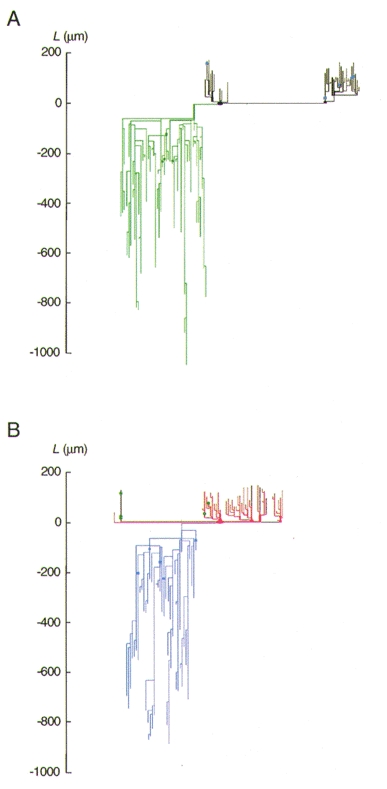
A and B, geometric dendrogram of the cell pair shown in Fig. 13. Dendrites are pointing upwards in this figure, the axons and their collaterals downwards. A, dendritic and axonal arbor of the black cell in Fig. 13. B, dendritic and axonal arbor of the red cell in Fig. 13. The colour coding of dendritic and axonal branches and the labelling of potential synaptic contacts is the same as that in Fig. 13. Note that boutons on axonal arbors and contacts on dendritic arbors are close (within 260 μm) to the somata.
From the geometric dendrogram, individual and mean electrotonic distances for synaptic contacts of these two reciprocally connected neurones were calculated. The electrotonic distance of a synaptic contact from the soma is the sum of electrotonic lengths Xj =Lj/λj leading to the location of the contact, where Lj is the geometric length of the dendritic segment j and λj =√(Rmaj/2Ri) is the dendritic space constant. Rm (specific membrane resistance) was obtained from current-voltage relationships in 23 spiny L4 neurones and calculated to be 20·6 ± 6·3 kΩ cm2, and aj is the mean radius of the segment as measured during the anatomical reconstruction of the cell. As Ri (specific internal resistance) for spiny L4 neurones is not known, it was assumed to be 120 Ω cm (cf. Stuart & Spruston, 1998; Thurbon et al. 1998). The mean electrotonic distances for the neurone with large and small postsynaptic EPSPs were 0·09L/λ and 0·21L/λ, respectively.
Relationship between functional properties and morphology
Between two and five synaptic contacts were established by the projecting neurone onto the target neurone (3·4 ± 1·0; Table 2, Fig. 15A inset). The mean geometric distance of these contacts from the soma was 69·1 ± 41·2 μm (minimum, 33·4 μm; maximum, 168·0 μm; Fig. 15A). Hence, in postnatal day 12–15 rat spiny L4 neurones the number as well as the distance of synaptic contacts from the soma was smaller than that found for neighbouring synaptically coupled L5 pyramidal neurones (cf. Table 3 and Fig. 7 in Markram et al. 1997).
Figure 15. Location of synaptic contacts on dendrites.
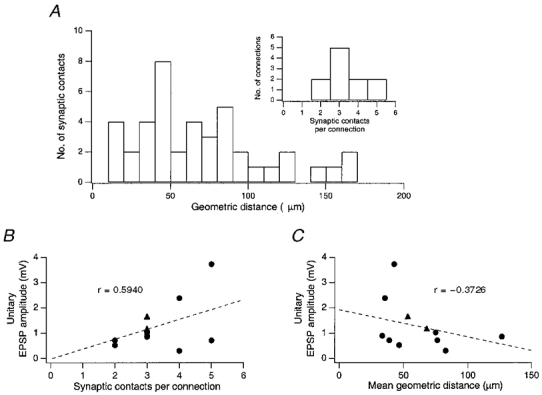
A, histogram of geometric distances from the soma of visually (i.e. on the light microscopic level) identified putative synaptic contacts in 10 pairs of spiny L4 neurones. Inset, distribution of the number of synaptic contacts per connection. B, relationship between unitary EPSP amplitude and the number of synaptic contacts per connection. The correlation coefficient, r, obtained for B was 0·59 and the slope was 0·44 mV per contact. The regression line was forced through zero. C, relationship between unitary EPSP amplitude and the mean geometric distance from the soma of synaptic contacts in a connection. The correlation coefficient was 0·37 and the slope was −0·013 mV μm−1. For both graphs, the correlation was not statistically significant.
The mean EPSP amplitude showed only a weak positive correlation with the number of synaptic contacts per connection and a weak inverse correlation with their mean geometric distance (Fig. 15A and C). As suggested for L5 pyramidal neurones (Markram et al. 1997), the large differences in the mean amplitude of unitary EPSPs between different L4 connections may therefore be determined to a significant degree by differences in the functional properties of the projecting and the target cell, rather than by differences in their morphology.
DISCUSSION
In sensory cortices, L4 constitutes the main target region for specific thalamic afferents and is the layer in which cortical processing of sensory information begins (Mountcastle, 1957; Mountcastle & Powell, 1959; Hubel & Wiesel, 1962; Lund, 1984; Jensen & Killackey, 1987; Douglas & Martin, 1991). Thus, L4 neurones act as the main cortical ‘receiver’ elements for thalamic input although there is also a collateral input to neurones at the border of L5 and L6. The present study suggests that apart from functioning as a relay, the network of spiny stellate neurones in L4 serves as a feed-forward amplifier for the stream of thalamic signals that are distributed via the axon collaterals throughout a cortical column.
Connectivity of spiny stellate neurones in L4 of the barrel cortex
An important determinant of the network properties of neuronal microcircuits is the connectivity between individual neurones. For calculating the degree of connectivity between spiny neurones, i.e. the percentage of cells to which a spiny stellate cell is connected, some caveats have to be taken into account: (1) the probability of finding connected pairs in a slice preparation is not identical to the actual degree of connectivity; (2) dual recordings were biased with respect to those regions within a barrel where neurones were clustered (5–15 cells); (3) the spatial distribution of neurones was non-uniform, being more dense at the sides of the barrel than in the hollows (Simons & Woolsey, 1984); and (4) the orientation of the dendritic field was asymmetric. For these reasons, the degree of connectivity calculated here can only be an estimate.
Morphological analysis of the axonal arbor of spiny stellate cells indicates that the number of boutons per spiny cell axon within L4 is approximately 600 (J. Lübke, V. Egger, B. Sakmann & D. Feldmeyer, unpublished observations) of which about 90% are assumed to contact other spiny L4 neurones. On average, a connection between two spiny L4 neurones has 3·4 boutons and a spiny stellate cell is therefore connected to ∼160 other spiny stellate cells in the same barrel. The volume of a single barrel is about 0·025 mm3 (assuming a thickness of L4 of ∼200 μm and a width of ∼300 μm; cf. Simons & Woolsey, 1984) and the number of neurones in a barrel is about 2000 (data for mouse barrel cortex; Lee & Woolsey, 1975; Pasternak & Woolsey, 1975). If the distribution of neurones in a single barrel were uniform, the density of neurones would be 80 000 mm−3. A spiny stellate cell has a roughly cylindrical axonal field with a cross-section of ∼250 μm in diameter. Hence the volume of the axonal field of a spiny cell is ∼0·01 mm3 and it contains about 800 spiny L4 neurones. Based on these numbers, the connectivity of a spiny L4 neurone in a single barrel is about 20% of the neurones within the reach of its axon.
Another experimental estimate of the connectivity is the fraction of bi-directional synaptic connections, found to be 31% in the cell pairs tested (n = 94). The difference between the value calculated from morphological measurements (∼20%) and the experimentally obtained value (31%) may be due to the non-homogeneous distribution of neurones in a barrel. Nevertheless, both estimates indicate that the connectivity of spiny L4 neurones within a barrel is high. A comparable degree of connectivity was estimated for the connections between neighbouring pyramidal neurones in L5 (Markram et al. 1997). This estimate was, however, derived from the probability of finding of connected cell pairs, which is subject to experimental bias since only connections between adjacent neurones with soma distances of not more than ∼50 μm were tested.
Functional implications of the ‘reliable’ excitatory synaptic transmission between L4 neurones
In accordance with Golgi studies of mouse and rat barrel cortex, the majority of dendritic branches of synaptically coupled spiny neurones were confined to a single barrel and the dendritic field of most neurones was markedly asymmetric, being oriented towards the centre of a barrel (Woolsey et al. 1975; Harris & Woolsey, 1981; Simons & Woolsey, 1984). This asymmetry was seen most clearly for the dendritic domains of spiny stellate cells located at the border between adjacent barrels (Fig. 1A) which were of opposite polarity and confined to the barrel in which the somata were located. This is in accordance with the suggestion that the asymmetrical orientation of spiny L4 cell dendrites may maximise the contact with the segregated incoming thalamocortical fibre tracts (Killackey, 1973; Woolsey & Dierker, 1978).
The majority of synaptic contacts were located close to the soma, preferentially on tertiary dendrites, approximately 60 μm distal from the soma. Together with the short axonal distance between the soma and synaptic boutons this implies that, at the level of L4, intracortical processing of sensory signals mostly occurs between neurones within a single barrel, at least at this developmental stage.
The morphological data correlate well with the short latency of unitary EPSPs (< 1 ms) in connections of spiny L4 neurones. Synaptic transmission between these neurones has a low failure rate (5·7%) and a comparatively low c.v. (0·37), making the spread of excitation in L4 substantially faster and more reliable than in other cortical laminae (Thomson & West, 1993; Thomson et al. 1996; Stratford et al. 1996; Markram et al. 1997; Thomson & Bannister, 1998). The rapid synaptic transmission between spiny L4 neurones could be an essential pre-condition for amplification of afferent signals arriving from thalamic relay nuclei.
In about 10% of all coupled L4 neurones, the mean EPSP amplitude was 3-fold larger than the median (1·2 mV); in some of these cell pairs, unitary EPSPs were sufficiently depolarising to elicit APs in the target neurone. Thus, the excitatory activity of spiny L4 neurones is very high - as also suggested by the high frequency of spontaneous synaptic events and the high metabolic rate of L4 neurones in a deoxyglucose-labelling study by McCasland & Hibbard (1997). The main function of excitatory L4 neurones may be to mediate reliably a strong feed-forward excitation of thalamic signals within L4 and to L2/3. This amplification function could be further enhanced by the putative autaptic contacts identified in spiny L4 neurones (Table 2 and Fig. 12A) provided that they are functional. Thus, the present results provide the cellular basis for the view that suprathreshold excitation, following stimulation of a single principal whisker, is confined to a single barrel in L4 and spreads horizontally only in L2/3 (McCasland & Woolsey, 1988; Kleinfeld & Delaney, 1996; Woolsey et al. 1996; but see Moore & Nelson, 1998, for subthreshold synaptic potentials).
NMDAR-mediated component of EPSPs in spiny L4 neurones
Unitary EPSPs in spiny L4 neurones have a relatively large NMDAR-mediated component (39% of the voltage integral at −60 mV), in contrast to L5 pyramidal neurones (17% at −60 mV). The voltage dependence of the NMDAR-mediated EPSP is similar to that of NMDAR channels with high Mg2+ sensitivity, suggesting that the NMDAR current is mainly carried by receptors containing NR-2A or NR-2B subunits (Monyer et al. 1994). The larger NMDAR component is likely to be a result of a higher proportion of postsynaptic NMDAR channels in spiny L4 connections. It could support the initiation of APs since the relief of Mg2+ block at more depolarised membrane potentials will result in a strong supralinear amplification of the EPSP amplitude. Thereby, the large NMDAR-mediated component could contribute to the function of spiny L4 neurones as cortical amplifiers.
Recently, Fleidervish et al. (1998) reported that in mouse barrel cortex synaptic transmission between spiny neurones is largely if not exclusively mediated by NMDAR channels with a low Mg2+ sensitivity as observed for mature cerebellar granule cells (Takahashi et al. 1996). This is at variance with the results of the present study on rat. A possible explanation for this difference may be the fact that Fleidervish et al. (1998) studied older animals; however, in postnatal day 21 rats unitary EPSPs also have a prominent AMPAR-mediated component (D. Feldmeyer, V. Egger & B. Sakmann, unpublished results). Nevertheless, the NMDAR-mediated component of unitary EPSCs was almost one-half of the total EPSC amplitude, larger than that observed at other cortical synapses (e.g. Stern et al. 1992).
Comparison with other synaptic connections in the neocortex
Quantative data relating morphological and functional determinants of the efficacy of synaptic connections in the neocortex are only available for pairs of pyramidal neurones in infragranular L5 and L6 (Deuchars et al. 1994; Markram et al. 1997). For L5 pyramidal neurones the number of synaptic contacts was on average 5 (2–8 contacts per connection) and 5·5 (4–8 contacts per connection), respectively, higher than that for spiny L4 neurones (3·4; 2–5 contacts per connection). Despite the smaller mean number of contacts, the mean unitary EPSP amplitude (1·6 vs. 1·3 mV) and the range of amplitudes (0·3-9·6 vs. 0·15-5·5 mV) were larger, which is at least in part due to the electrotonically more compact structure of spiny L4 neurones. In both L5 pyramidal neurone and L4 spiny cell connections, the number of potential synaptic contacts and the mean EPSP amplitude were not strongly correlated (Markram et al. 1997; this study). In one pair of bi-directionally coupled spiny stellate cells the mean amplitude of unitary EPSPs differed more than 5-fold while the number of putative synaptic contacts was the same (Table 2, Fig. 15). Unitary EPSPs in L5 pyramidal neurones had a much longer latency (1·7 vs. 0·9 ms in spiny L4 neurones) and this difference can be primarily accounted for by the shorter axonal pathway from the soma to the synaptic boutons. However, the difference in the c.v. may at least in part result from the use of AP5 in the study by Stratford et al. (1996). This reduces extra variance due to the NMDA component of the EPSP.
A comparison between the major cortical ‘input’ and ‘output’ neurones suggests that synaptic transmission of spiny L4 connections is more reliable than that of L5 pyramidal- and of L6 pyramidal-L4 spiny stellate neurone connections (Stratford et al. 1996; Markram et al. 1997), as seen in a comparatively low failure rate (5·7 vs. 14%) and c.v. (0·37 vs. 0·52 or 0·69, respectively). A lower c.v. was observed in connections between spiny stellate cells of adult cat visual cortex (0·22; Stratford et al. 1996). It is not clear whether these differences could be due to the different developmental stages and/or the animal species or whether synaptic transmission in L4 of the visual cortex is even more reliable than that in the somatosensory cortex.
Taken together, the functional properties of L4 synaptic connections suggest that they are well suited for amplifying and distributing subcortical inputs to target cells in other cortical layers, in particular to those in L2/3 (Stratford et al. 1996). This contrasts with L5 pyramidal neurones, which collect signals from different cortical layers and connect ensembles of neurones via their long horizontal axons (Markram et al. 1997). The L5 pyramidal neurones are major cortical output neurones that project to other cortical as well as subcortical areas. Thus, L5 pyramidal neurones associate synaptic activity from different layers (Larkum et al. 1999) and distribute their activity intracortically over a wide range (1–4 mm) of the cortex across several columns while L4 spiny neurones are essential for reliable and fast relay and amplification of sensory input within the restricted range of their axon (field span, ∼0·2 mm).
Acknowledgments
We thank Professor Bernard Katz and Dr R. Angus Silver for comments on the manuscript and Mrs Marlies Kaiser for expert technical assistance. V.E. was supported by the Graduate Programme for Cellular and Molecular Neurobiology at the University of Heidelberg.
References
- Agmon A, Connors BW. Thalamocortical responses of mouse somatosensory (barrel) cortex in vitro. Neuroscience. 1991;41:365–380. doi: 10.1016/0306-4522(91)90333-j. [DOI] [PubMed] [Google Scholar]
- Ahmed B, Anderson JC, Douglas RJ, Martin KAC, Nelson JC. Polyneuronal innervation of spiny stellate neurons in cat visual cortex. Journal of Comparative Neurology. 1994;341:39–49. doi: 10.1002/cne.903410105. [DOI] [PubMed] [Google Scholar]
- Armstrong-James M, Fox K, Das-Gupta A. Flow of excitation within rat barrel cortex on striking a single vibrissa. Journal of Neurophysiology. 1992;68:1345–1358. doi: 10.1152/jn.1992.68.4.1345. [DOI] [PubMed] [Google Scholar]
- Chagnac-Amitai Y, Connors BW. Synchronized excitation and inhibition driven by intrinsically bursting neurones in the neocortex. Journal of Neurophysiology. 1989;62:1149–1162. doi: 10.1152/jn.1989.62.5.1149. [DOI] [PubMed] [Google Scholar]
- Connors BW, Gutnick MJ. Intrinsic firing patterns of diverse neocortical neurons. Trends in Neurosciences. 1990;13:99–104. doi: 10.1016/0166-2236(90)90185-d. [DOI] [PubMed] [Google Scholar]
- Deuchars J, West DC, Thomson AM. Relationships between morphology and physiology of pyramid-pyramid single axon connections in rat neocortex in vitro. The Journal of Physiology. 1994;478:423–435. doi: 10.1113/jphysiol.1994.sp020262. [DOI] [PMC free article] [PubMed] [Google Scholar]
- Dodt H-U, Zieglgänsberger W. Visualizing unstained neurons in living brain slices by infrared-DIC-videomicroscopy. Brain Research. 1990;573:333–336. doi: 10.1016/0006-8993(90)90380-t. [DOI] [PubMed] [Google Scholar]
- Douglas RJ, Martin KAC. A functional microcircuit for cat visual cortex. The Journal of Physiology. 1991;440:735–769. doi: 10.1113/jphysiol.1991.sp018733. [DOI] [PMC free article] [PubMed] [Google Scholar]
- Ebner FF, Armstrong-James MA. Intracortical processes regulating the integration of sensory information. Progress in Brain Research. 1990;86:129–141. doi: 10.1016/s0079-6123(08)63172-6. [DOI] [PubMed] [Google Scholar]
- Feldmeyer D, Egger V. Intracortical synaptic connections in the ‘barrel field’ of rat somatosensory cortex. The Journal of Physiology. 1998;509.P:161–162. doi: 10.1111/j.1469-7793.1999.00169.x. P. [DOI] [PMC free article] [PubMed] [Google Scholar]
- Fleidervish IA, Binshtok AM, Gutnick MJ. Functionally distinct NMDA receptors mediate horizontal connectivity within layer 4 of mouse barrel cortex. Neuron. 1998;21:1055–1065. doi: 10.1016/s0896-6273(00)80623-6. [DOI] [PubMed] [Google Scholar]
- Harris RM, Woolsey TA. Dendritic plasticity in mouse barrel cortex following postnatal vibrissa follicle damage. Journal of Comparative Neurology. 1981;196:357–376. doi: 10.1002/cne.901960302. [DOI] [PubMed] [Google Scholar]
- Hirsch JA. Synaptic integration in layer IV of the ferret striate cortex. The Journal of Physiology. 1995;483:183–199. doi: 10.1113/jphysiol.1995.sp020577. [DOI] [PMC free article] [PubMed] [Google Scholar]
- Hubel DH, Wiesel TN. Receptive fields, binocular interaction and functional architecture in the cat's visual cortex. The Journal of Physiology. 1962;160:106–154. doi: 10.1113/jphysiol.1962.sp006837. [DOI] [PMC free article] [PubMed] [Google Scholar]
- Jensen KF, Killackey HP. Terminals arbors of axons projecting to the somatosensory cortex of the adult rat. I. The normal morphology of specific thalamocortical afferents. Journal of Neuroscience. 1987;7:3529–3543. doi: 10.1523/JNEUROSCI.07-11-03529.1987. [DOI] [PMC free article] [PubMed] [Google Scholar]
- Jones EG, Diamond IT. The Barrel Cortex of Rodents. New York: Plenum Press; 1995. [Google Scholar]
- Katz LC, Gilbert CD, Wiesel TN. Local circuits and ocular dominance columns in monkey striate cortex. Journal of Neuroscience. 1989;9:1389–1399. doi: 10.1523/JNEUROSCI.09-04-01389.1989. [DOI] [PMC free article] [PubMed] [Google Scholar]
- Killackey HP. Anatomical evidence for cortical subdivisions based on vertically discrete thalamic projections from the ventral posterior nucleus to cortical barrels in the rat. Brain Research. 1973;51:326–331. doi: 10.1016/0006-8993(73)90383-1. [DOI] [PubMed] [Google Scholar]
- Kleinfeld D, Delaney KR. Distributed representation of vibrissa movement in the upper layers of somatosensory cortex revealed with voltage-sensitive dyes. Journal of Comparative Neurology. 1996;375:89–108. doi: 10.1002/(SICI)1096-9861(19961104)375:1<89::AID-CNE6>3.0.CO;2-K. [DOI] [PubMed] [Google Scholar]
- Kossel A, Löwel S, Bolz J. Relationships between dendritic fields and functional architecture in striate cortex of normal and visually deprived cats. Journal of Neuroscience. 1995;15:3913–3926. doi: 10.1523/JNEUROSCI.15-05-03913.1995. [DOI] [PMC free article] [PubMed] [Google Scholar]
- Larkum ME, Zhu JJ, Sakmann B. A novel cellular mechanism for coupling inputs arriving at different cortical layers. Nature. 1999;398:338–341. doi: 10.1038/18686. [DOI] [PubMed] [Google Scholar]
- Lee KJ, Woolsey TA. A proportional relationship between peripheral innervation density and cortical neuron number in the somatosensory system of the mouse. Brain Research. 1975;99:349–353. doi: 10.1016/0006-8993(75)90035-9. [DOI] [PubMed] [Google Scholar]
- LeVay S. Synaptic patterns in the visual cortex of the cat and monkey. Electron microscopy of Golgi preparations. Journal of Comparative Neurology. 1973;150:53–86. doi: 10.1002/cne.901500104. [DOI] [PubMed] [Google Scholar]
- Lu SM, Lin RC. Thalamic afferents of the rat barrel cortex: a light- and electron-microscopic study using Phaseolus vulgaris leucoagglutinin as an anterograde tracer. Somatosensory and Motor Research. 1993;10:1–16. doi: 10.3109/08990229309028819. [DOI] [PubMed] [Google Scholar]
- Lübke J, Markram H, Frotscher M, Sakmann B. Frequency and dendritic distribution of autapses established by layer 5 pyramidal neurons in the developing rat neocortex: comparison with synaptic innervation of adjacent neurons of the same class. Journal of Neuroscience. 1996;16:3209–3218. doi: 10.1523/JNEUROSCI.16-10-03209.1996. [DOI] [PMC free article] [PubMed] [Google Scholar]
- Lund JS. Spiny stellate neurons. In: Jones EG, Peters A, editors. The Cerebral Cortex. Vol. 1. New York: Plenum Press; 1984. pp. 255–308. chap. 7. [Google Scholar]
- McCasland JS, Hibbard LS. GABAergic neurons in barrel cortex show strong, whisker-dependent metabolic activation during normal behavior. Journal of Neuroscience. 1997;17:5509–5555. doi: 10.1523/JNEUROSCI.17-14-05509.1997. [DOI] [PMC free article] [PubMed] [Google Scholar]
- McCasland JS, Woolsey TA. High resolution 2-deoxyglucose mapping of functional cortical columns in mouse barrel cortex. Journal of Comparative Neurology. 1988;278:555–569. doi: 10.1002/cne.902780407. [DOI] [PubMed] [Google Scholar]
- McCormick DA, Connors BW, Lighthall JW, Prince DA. Comparative electrophysiology of pyramidal and sparsely spiny stellate neurones of the neocortex. Journal of Neurophysiology. 1985;54:782–806. doi: 10.1152/jn.1985.54.4.782. [DOI] [PubMed] [Google Scholar]
- Mainen ZF, Sejnowski TJ. Influence of dendritic structure on firing pattern in model neocortical neurons. Nature. 1996;382:363–366. doi: 10.1038/382363a0. [DOI] [PubMed] [Google Scholar]
- Markram H, Lübke J, Frotscher M, Roth A, Sakmann B. Physiology and anatomy of synaptic connections between thick-tufted pyramidal neurones in the developing rat neocortex. The Journal of Physiology. 1997;500:409–440. doi: 10.1113/jphysiol.1997.sp022031. [DOI] [PMC free article] [PubMed] [Google Scholar]
- Martin KAC, Whitteridge D. Form, function and intracortical projections of spiny neurones in the striate visual cortex of the cat. The Journal of Physiology. 1984;353:463–504. doi: 10.1113/jphysiol.1984.sp015347. [DOI] [PMC free article] [PubMed] [Google Scholar]
- Monyer H, Burnashev N, Laurie DJ, Sakmann B, Seeburg PH. Developmental and regional expression in the rat brain and functional properties of four NMDA receptors. Neuron. 1994;12:529–540. doi: 10.1016/0896-6273(94)90210-0. [DOI] [PubMed] [Google Scholar]
- Moore CI, Nelson SB. Spatio-temporal subthreshold receptive fields in the vibrissa representation of rat primary somatosensory cortex. Journal of Neurophysiology. 1998;80:2882–2892. doi: 10.1152/jn.1998.80.6.2882. [DOI] [PubMed] [Google Scholar]
- Mountcastle VB. Modality and topographic properties of single neurons of cat's somatosensory cortex. Journal of Neurophysiology. 1957;20:408–434. doi: 10.1152/jn.1957.20.4.408. [DOI] [PubMed] [Google Scholar]
- Mountcastle VB, Powell PS. Neural mechanisms subserving cutaneous sensibility, with special reference to the role of afferent inhibition in sensory perception and discrimination. Bulletin of Johns Hopkins Hospital. 1959;105:201–232. [PubMed] [Google Scholar]
- Pasternak JR, Woolsey TA. The number, size and distribution of neurons in lamina IV of the mouse SmI neocortex. Journal of Comparative Neurology. 1975;160:291–306. doi: 10.1002/cne.901600303. [DOI] [PubMed] [Google Scholar]
- Sayer RJ, Redman SJ, Andersen P. Amplitude fluctuation in small EPSPs recorded from CA1 pyramidal cells in the guinea pig hippocampal slice. Journal of Neuroscience. 1989;9:840–850. doi: 10.1523/JNEUROSCI.09-03-00840.1989. [DOI] [PMC free article] [PubMed] [Google Scholar]
- Simons DJ, Woolsey TA. Morphology of Golgi-Cox impregnated barrel neurons in rat Sm1 cortex. Journal of Comparative Neurology. 1984;230:119–132. doi: 10.1002/cne.902300111. [DOI] [PubMed] [Google Scholar]
- Stern P, Edwards FA, Sakmann B. Fast and slow components of unitary EPSCs on stellate cells elicited by focal stimulation in slices of rat visual cortex. The Journal of Physiology. 1992;449:247–278. doi: 10.1113/jphysiol.1992.sp019085. [DOI] [PMC free article] [PubMed] [Google Scholar]
- Stratford KJ, Tarczy-Hornoch K, Martin KAC, Bannister NJ, Jack JJ. Excitatory synaptic inputs to spiny stellate cells in cat visual cortex. Nature. 1996;382:258–261. doi: 10.1038/382258a0. [DOI] [PubMed] [Google Scholar]
- Stuart GJ, Dodt H-U, Sakmann B. Patch-clamp recordings from the soma and dendrites of neurons in brain slices using infrared video microscopy. Pflügers Archiv. 1993;423:511–518. doi: 10.1007/BF00374949. [DOI] [PubMed] [Google Scholar]
- Stuart GJ, Spruston N. Determinants of voltage attentuation in neocortical pyramidal neuron dendrites. Journal of Neuroscience. 1998;18:3501–3510. doi: 10.1523/JNEUROSCI.18-10-03501.1998. [DOI] [PMC free article] [PubMed] [Google Scholar]
- Takahashi T, Feldmeyer D, Suzuki N, Onodera K, Cull-Candy SG, Sakimura K, Mishina M. Functional correlation of NMDA receptor subunit expression with the properties of single-channel and synaptic currents in the developing cerebellum. Journal of Neuroscience. 1996;16:4376–4382. doi: 10.1523/JNEUROSCI.16-14-04376.1996. [DOI] [PMC free article] [PubMed] [Google Scholar]
- Thomson AM, Bannister AP. Postsynaptic pyramidal target selection by descending layer III pyramidal axons - dual intracellular recordings and biocytin filling in slices of rat neocortex. Neuroscience. 1998;84:669–683. doi: 10.1016/s0306-4522(97)00557-5. [DOI] [PubMed] [Google Scholar]
- Thomson AM, Deuchars J. Synaptic interactions in neocortical local circuits: dual intracellular recordings in vitro. Cerebral Cortex. 1997;7:510–522. doi: 10.1093/cercor/7.6.510. [DOI] [PubMed] [Google Scholar]
- Thomson AM, Deuchars J, West DC. Neocortical local synaptic circuitry revealed with dual intracellular recordings and biocytin-filling. Journal de Physiologie. 1996;90:211–215. doi: 10.1016/s0928-4257(97)81425-8. [DOI] [PubMed] [Google Scholar]
- Thomson AM, West DC. Fluctuations in pyramid-pyramid excitatory postsynaptic potentials modified by presynaptic firing pattern and postsynaptic membrane potentials using paired recordings in rat neocortex. Neuroscience. 1993;54:329–346. doi: 10.1016/0306-4522(93)90256-f. [DOI] [PubMed] [Google Scholar]
- Thurbon D, Lüscher H-R, Hofstetter T, Redman SJ. Passive electrical properties of ventral horn neurons in rat spinal cord slices. Journal of Neurophysiology. 1998;79:2485–2502. U9ff. doi: 10.1152/jn.1998.79.5.2485. correction in vol. 80. [DOI] [PubMed] [Google Scholar]
- Wallace MN. Histochemical demonstration of sensory maps in the rat and mouse cerebellar cortex. Brain Research. 1987;418:178–182. doi: 10.1016/0006-8993(87)90977-2. [DOI] [PubMed] [Google Scholar]
- Welker C. Receptive fields of barrels in the somatosensory neocortex of the rat. Journal of Comparative Neurology. 1976;166:173–190. doi: 10.1002/cne.901660205. [DOI] [PubMed] [Google Scholar]
- Woolsey TA, Dierker ML. Computer assisted recording of anatomical data. In: Robertson RT, editor. Neuroanatomical Research Techniques. New York: Academic Press; 1978. pp. 47–85. [Google Scholar]
- Woolsey TA, Dierker ML, Wann DF. Mouse SmI cortex: Qualitative and quantitative classification of Golgi-impregnated barrel neurons. Proceedings of the National Academy of Sciences of the USA. 1975;72:2165–2169. doi: 10.1073/pnas.72.6.2165. [DOI] [PMC free article] [PubMed] [Google Scholar]
- Woolsey TA, Rovainen CM, Cox SB, Henegar MH, Liang GE, Liu D, Moskalenko YE, Sui J, Wei L. Neuronal units linked to microvascular modules in cerebral cortex: response elements for imaging the brain. Cerebral Cortex. 1996;6:647–660. doi: 10.1093/cercor/6.5.647. [DOI] [PubMed] [Google Scholar]
- Woolsey TA, van der Loos H. The description of a cortical field composed of discrete cytoarchitectonic units. Brain Research. 1970;17:205–242. doi: 10.1016/0006-8993(70)90079-x. [DOI] [PubMed] [Google Scholar]
- Wong-Riley M. Changes in the visual system of monocularly sutured or enucleated cats demonstrable with cytochrome oxidase. Brain Research. 1979;171:11–28. doi: 10.1016/0006-8993(79)90728-5. [DOI] [PubMed] [Google Scholar]