

Abstract
A new form of synaptic depression of excitatory synaptic transmission was observed when making voltage-clamp recordings from large presynaptic terminals, the calyces of Held and postsynaptic cells, the principal cells of the medial nucleus of the trapezoid body (MNTB), in slices of the rat auditory brainstem.
A short (100 ms) depolarization of the postsynaptic cell to 0 mV reduced the amplitude of the EPSCs by 35 ± 5% (n = 7), measured at 10 ms following the depolarization. Recovery occurred within 0·5 s.
The reduction of the EPSCs was most probably due to reduced presynaptic calcium influx, since postsynaptic depolarization reduced presynaptic calcium or barium currents. Conversely, presynaptic depolarization also reduced postsynaptic calcium or barium influx, under conditions where transmitter release was minimal.
The calcium currents and the postsynaptic depolarization-induced suppression of synaptic transmission recovered with a similar time course, suggesting that this form of synaptic depression was, most probably, due to depletion of Ca2+ in the synaptic cleft.
We conclude that when the Ca2+ influx into the pre- or postsynaptic cell is large, extracellular Ca2+ is depleted. Under these conditions, the Ca2+ concentration in the synaptic cleft is a sensitive indicator of the level of synaptic activity. However, the synaptic cleft is less sensitive to Ca2+ depletion than predicted from its estimated volume.
The concentration of Ca2+ in the extracellular volume of the brain may decrease under both physiological and pathophysiological conditions (Nicholson et al. 1978; Heinemann et al. 1986). It is conceivable that this may also happen in the synaptic cleft, where the pre- and the postsynaptic side of a synapse have to compete for the available calcium ions (Krnjevic et al. 1980; Smith, 1992; Vassilev et al. 1997; Egelman & Montague, 1998; Rusakov et al. 1998). When Ca2+ influx into the pre- or the postsynaptic part is large, the concentration of Ca2+ in the synaptic cleft may drop, leading to a reduction in the amount of Ca2+ available for evoking transmitter release. Here we investigated the possible contribution of extracellular Ca2+ depletion to a reduction in presynaptic calcium currents and transmitter release.
We studied this question in the MNTB, which contains a synapse of which both the pre- and the postsynaptic part can be voltage clamped in whole-cell recordings (Borst et al. 1995; Borst & Sakmann, 1998a), making it possible to directly correlate Ca2+ influx with release. Each principal cell in the MNTB is innervated by a giant terminal, called the calyx of Held. The MNTB is part of an auditory pathway that is involved in the localization of sound (Oertel, 1997). Synaptic transmission is mediated by both AMPA- and NMDA-type glutamate receptors (Forsythe & Barnes-Davies, 1993). In young (postnatal day 9) rodents, this synapse shows strong synaptic depression at physiological extracellular Ca2+ concentrations (Barnes-Davies & Forsythe, 1995; Borst et al. 1995; von Gersdorff et al. 1997; Wang & Kaczmarek, 1998). Many different mechanisms have been proposed to underlie synaptic depression. The most generally accepted one is depletion of the releasable (also called the immediately releasable or readily releasable) pool of vesicles (Neher, 1998). Indeed, when Ca2+ influx into the postsynaptic cell is minimized, synaptic depression in the MNTB is probably largely due to vesicle depletion (von Gersdorff et al. 1997; Wang & Kaczmarek, 1998; Wu & Borst, 1999). Nevertheless, apart from vesicle depletion, a presynaptic mechanism that could also contribute to synaptic depression is a change in the calcium influx. The waveform of the action potential becomes smaller and broader during high frequency trains (Borst et al. 1995). By itself, this change leads to a larger Ca2+ influx per action potential and larger release, arguing against a contribution of a change in the shape of action potentials in synaptic depression (Borst & Sakmann, 1999). Still, the possibility that a reduction in presynaptic Ca2+ influx contributes to synaptic depression has not yet been completely resolved. The calyceal calcium currents decrease during prolonged depolarizations (Borst et al. 1995). Evidence has been presented that the calyceal calcium channels inactivate in a Ca2+-dependent manner (Forsythe et al. 1998). Although extensive short-term synaptic depression can be induced in the absence of clear changes in the Ca2+ influx (Borst & Sakmann, 1998b; Wang & Kaczmarek, 1998), nevertheless a reduction of the Ca2+ influx may contribute to synaptic depression under certain conditions (Forsythe et al. 1998).
Previously, synaptic depression in the MNTB has been studied under conditions where Ca2+ influx into the postsynaptic cell was small, during voltage-clamp recordings at negative holding potentials. Although the AMPA-type glutamate receptors in the MNTB are calcium permeable (Geiger et al. 1995; Bollmann et al. 1998), their contribution to the total postsynaptic Ca2+ influx during synaptic transmission is not large. Most of the Ca2+ enters the postsynaptic cells via voltage-dependent calcium channels, but there is also a sizable contribution from NMDA-type glutamate receptors (Bollmann et al. 1998). During a presynaptic action potential, approximately 1 pC of Ca2+ enters the presynaptic terminal (Borst & Sakmann, 1996; Helmchen et al. 1997). The total Ca2+ influx into the postsynaptic cell during an afferently evoked postsynaptic action potential is 2–3 times larger than into the presynaptic terminal (Bollmann et al. 1998). Because of its small volume, the total Ca2+ content of the synaptic cleft could be as small as 7 pC (see Discussion). This situation is schematically illustrated in Fig. 1. If this estimate of the Ca2+ content of the synaptic cleft were true, the contribution of extracellular Ca2+ depletion to short-term synaptic depression could be considerable. To study the possible contribution of Ca2+ depletion to short-term synaptic depression, we used experimental conditions under which Ca2+ influx into the postsynaptic cell was very large. By controlling separately the Ca2+ influx into the pre- and the postsynaptic side of this synapse, we observed a novel form of synaptic depression of excitatory transmission, which was due to depletion of Ca2+ in the synaptic cleft. A much larger influx was needed, though, than predicted by the simple calculation made above.
Figure 1. Schematic view of pre- and postsynaptic calcium influx during synaptic transmission in the MNTB.
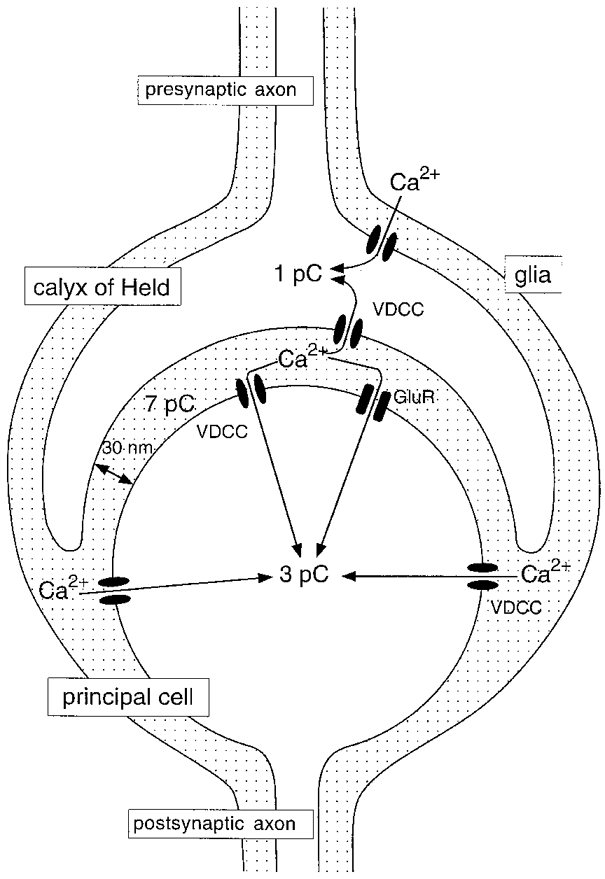
The dotted area represents the extracellular volume. Ca2+ influx is given as charge entry per action potential.
METHODS
Pre- and postsynaptic voltage-clamp recording and measurements of the presynaptic volume-averaged intracellular Ca2+ concentration ([Ca2+]i) were done as described previously (Borst & Sakmann, 1998b).
Eight- to ten-day-old Wistar rats were decapitated without prior anaesthesia, in accordance with national guidelines. Parasagittal slices (200 μm) were cut with a vibratome in ice-cold saline, containing (mM): 125 NaCl, 2·5 KCl, 3 MgCl2, 0·1 CaCl2, 25 dextrose, 1·25 NaH2PO4, 0·4 ascorbic acid, 3 myo-inositol, 2 sodium pyruvate and 25 NaHCO3. Slices were equilibrated for 30 min at 37°C in the same solution, except that the Ca2+ and Mg2+ concentrations were 2 and 1 mM, respectively. Afterwards, slices were kept at room temperature (22–24°C). The calcium current was pharmacologically isolated with a solution containing (mM): 105 NaCl, 20 TEA-Cl (Fluka, Buchs, Switzerland), 0·1 3,4-diaminopyridine (Sigma), 2·5 KCl, 1 MgCl2, 2 CaCl2, 25 dextrose, 1·25 NaH2PO4, 0·4 ascorbic acid, 3 myo-inositol, 2 sodium pyruvate, 0·001 tetrodotoxin (TTX; Research Biochemicals International), 0·05 D-2-amino-5-phosphonovalerate (D-APV; Tocris Neuramin, Bristol, UK) and 25 NaHCO3, pH 7·4 when bubbled with 95% O2, 5% CO2. In some experiments Ba2+ (2 mM) replaced Ca2+ as the charge carrier.
Presynaptic pipettes (4–6 MΩ) were filled with a solution containing (mM): 125 caesium gluconate, 20 CsCl, 10 phosphocreatine disodium salt, 4 MgATP, 0·3 GTP, 0·05 or 1 fura-2 (Molecular Probes) and 10 Hepes (pH 7·2 with CsOH). Postsynaptic pipettes (2·5-3·5 MΩ) were filled with (mM): 125 potassium gluconate, 20 KCl, 10 phosphocreatine disodium salt, 4 MgATP, 0·3 GTP, 0·5 EGTA and 10 Hepes (pH 7·2 with KOH). In the experiments in which the postsynaptic cell was depolarized, 10 mM BAPTA was used instead of 0·5 mM EGTA, Cs+ replaced the K+ and the caesium gluconate concentration was reduced to 100 mM.
Simultaneous pre- and postsynaptic whole-cell recordings were made with two Axopatch 200A amplifiers (Axon Instruments). Presynaptic and postsynaptic series resistance (typically 15 and 8 MΩ, respectively) were compensated to 90% (lag < 8 μs, prediction when applicable 60%). Holding potential was −80 mV when Ca2+ was the charge carrier; with Ba2+ it was −90 or −100 mV. Potentials were corrected for a liquid junction potential of −11 mV. Subtraction of passive responses was with the P/5 or the P/-5 method. Interpulse interval was 15–60 s. Currents were filtered at 5 kHz and digitized at 50 kHz with a 16-bit analog-to-digital converter (ITC-16, Instrutech, Great Neck, NY, USA). Voltage clamping of terminals with action potential waveforms (APWs) was done as described previously (Borst & Sakmann, 1996). The method of measurement of the presynaptic, volume-averaged Ca2+ concentration has been described in Borst & Helmchen (1998).
Acquisition and analysis
Acquisition and analysis were done with Pulse Control 4.7 (Herrington & Bookman, 1994), combined with Igor (WaveMetrics, Lake Oswego, OR, USA) macros, which allowed different voltage protocols to be simultaneously imposed on the terminal and the postsynaptic cell.
To study the effect of a 100 ms prepulse on the calcium current during a subsequent test pulse to 0 mV, the currents during the test pulse were normalized to the currents during the test pulse that were evoked by prepulses to −40 mV or more negative potentials.
Data are presented as means ± standard error of the mean (s.e.m.).
RESULTS
Postsynaptic depolarization-induced synaptic depression
EPSCs were evoked at a holding potential of −80 mV by afferent stimulation in non-selective Ringer solution, using a bipolar stimulation electrode that was placed at the decussation of the trapezoid body. At −80 mV, most of the EPSC is carried by AMPA-type glutamate receptors (Forsythe & Barnes-Davies, 1993; Bollmann et al. 1998). If the EPSC was preceded by a depolarization of the postsynaptic cell to 0 mV for 100 ms, the amplitude of the EPSCs that were evoked following the depolarizing step was transitorily reduced (Fig. 2A and B). The EPSC time course was not changed by the depolarizing prepulse (Fig. 2A). Ten milliseconds after the depolarizing step, the EPSCs were 35 ± 5% (n = 7) smaller than the EPSCs evoked in the absence of a depolarizing prepulse (Fig. 3). Recovery from the postsynaptic depolarization-induced synaptic depression was fast. In Fig. 3, recovery was described by a single exponential function with a time constant of 175 ms. The size of the EPSC was not reduced when it was evoked 10 ms after a 100 ms depolarizing step to 80 mV, instead of to 0 mV (n = 3; Fig. 3, ○). During the step to 80 mV only a small amount of Ca2+ is expected to enter the postsynaptic cell, suggesting that the postsynaptic Ca2+ entry, rather than the postsynaptic depolarization, triggered the postsynaptic depolarization-induced synaptic depression.
Figure 2. Postsynaptic depolarization-induced synaptic depression.
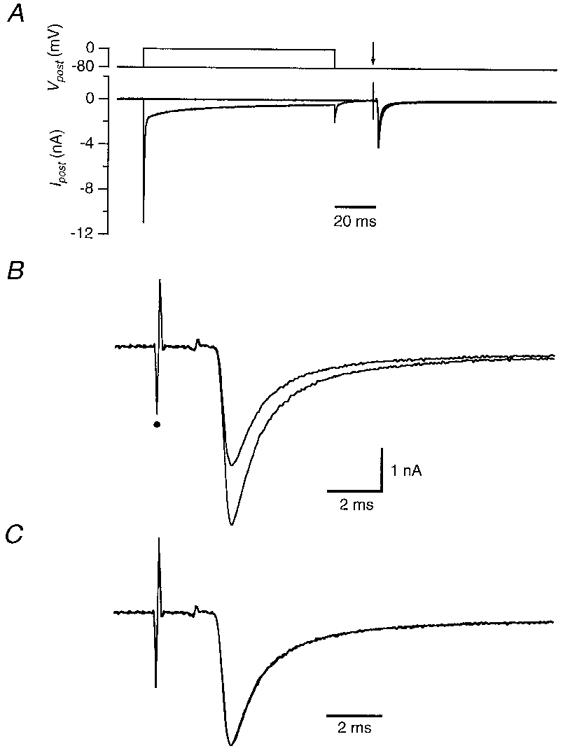
At an interval of 20 ms following a 100 ms depolarization from −80 mV to 0 mV of the postsynaptic cell, an EPSC was evoked by extracellular afferent stimulation. Postsynaptic pipette solution contained Cs+ and 10 mM BAPTA; Ca2+ was the charge carrier. A, top, postsynaptic voltage protocol. Arrow indicates the time of afferent stimulation. Bottom, postsynaptic currents. The step to 0 mV evoked a large inward current. B, EPSCs evoked in A shown at higher resolution. The EPSC following the depolarizing step had a similar time course but a decreased amplitude to that evoked in the absence of a depolarizing step. Small dot indicates stimulation artifact. C, same as B, except that the 2 EPSCs were scaled to the same peak amplitude.
Figure 3. Recovery from postsynaptic depolarization-induced synaptic depression.
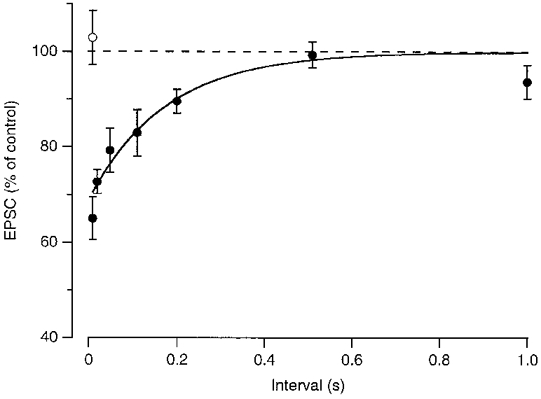
Average effect of a depolarizing step to 0 mV (•; n = 4–7) or 80 mV (○; n = 3) on EPSC size at different intervals after the step. Before averaging, the EPSC amplitudes were normalized to the amplitude of the EPSCs in the absence of a prepulse in the same experiment. Continuous line is the fit with an exponential function with a time constant of 175 ms.
Effect of postsynaptic Ca2+ influx on presynaptic calcium currents
We next addressed the question whether the postsynaptic Ca2+ influx was accompanied by a decrease in the presynaptic Ca2+ influx during an action potential. Simultaneous pre- and postsynaptic voltage-clamp recordings were made, the calcium current was pharmacologically isolated and the presynaptic Ca2+ influx during an action potential was estimated by voltage clamping the calyx of Held with action potential waveforms (APWs; Borst & Sakmann, 1996). In initial experiments, the postsynaptic cell was held continuously at 0 mV. As a result, the presynaptic calcium current was clearly reduced (n = 2, not shown). This reduction was not due to a contaminating current, since the increase in the volume-averaged intracellular Ca2+ concentration ([Ca2+]i) evoked by the APW was reduced to the same extent (not shown; Borst & Helmchen, 1998). The decrease in the presynaptic calcium current is expected to lead to a reduction in the size of the EPSC and therefore it may underlie the postsynaptic depolarization-induced synaptic depression illustrated in Fig. 2.
There are two distinct possibilities for how postsynaptic Ca2+ influx may decrease the presynaptic calcium currents. First, the postsynaptic Ca2+ influx could trigger the release of an (unknown) retrograde messenger from the postsynaptic cell (Fitzsimonds & Poo, 1998), which subsequently could inhibit the presynaptic calcium channels. Second, the large postsynaptic Ca2+ influx could partially deplete the synaptic cleft of calcium ions (Fig. 1), reducing the amount available to trigger presynaptic release. To discriminate between these two possibilities, we studied the reduction of the presynaptic calcium currents by the postsynaptic Ca2+ influx under conditions where the likelihood that a retrograde messenger would be released from the postsynaptic cell was minimized. Therefore, Ba2+ (2 mM) was used as the charge carrier and the postsynaptic cell was loaded with 10 mM BAPTA. Postsynaptic cells were depolarized for 100 ms to −20 mV and the effect on the pre- or postsynaptic barium current was monitored by voltage clamping both the terminal and the postsynaptic cell with a high-frequency train of identical APWs (Fig. 4, right). The same protocol, but without a depolarizing step served as a control for the effects of the APW trains on the pre- or postsynaptic barium currents (Fig. 4, left). The depolarizing step in the postsynaptic cell resulted in a large Ba2+ influx into the postsynaptic cell, averaging 137 ± 12 pC (n = 5). At the same time, the barium current evoked by the APWs in the presynaptic terminal was reduced (Fig. 4, right). It had decreased by 10 ± 1% (n = 5) at the end of the 100 ms depolarizing step, compared to the trains evoked in the absence of the depolarizing step. After repolarization of the postsynaptic cell, the barium current in the presynaptic terminal recovered (Fig. 4, arrow). The time course of the recovery could be approximated by a single exponential function with a time constant of 60 ms (Fig. 5). No effect on the presynaptic currents was observed when the postsynaptic cell was depolarized to 60 mV, during which little Ba2+ entered (n = 2), indicating that the postsynaptic Ba2+ influx, but not the postsynaptic depolarization, was responsible for the decrease in the presynaptic barium current.
Figure 4. Postsynaptic depolarization transitorily decreased presynaptic Ba2+ influx.
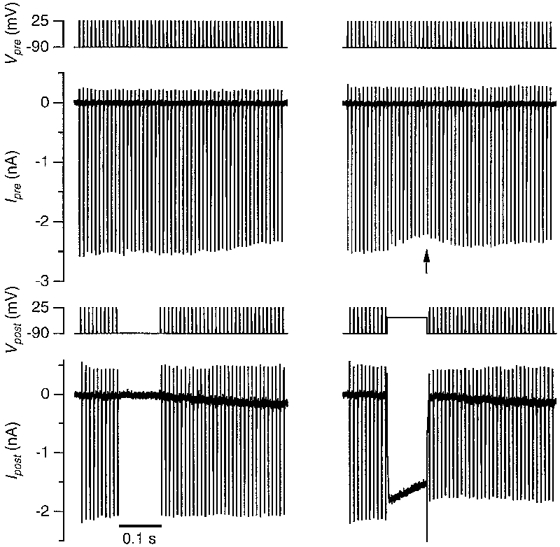
Both the presynaptic terminal (top 2 panels) and the postsynaptic cell (bottom two panels) were voltage clamped with a 0·5 s train of identical APWs at 100 Hz. After 10 action potentials, the postsynaptic train was interrupted for 100 ms and either the membrane potential was kept at −90 mV (left panel) or a 100 ms step to −20 mV from the holding potential of −90 mV was applied (right panel). Bottom panel shows postsynaptic barium currents. Arrow points at the transient decrease in presynaptic barium currents that was induced by the postsynaptic Ba2+ influx.
Figure 5. Time course of the effect of a postsynaptic depolarization on presynaptic Ba2+ influx.
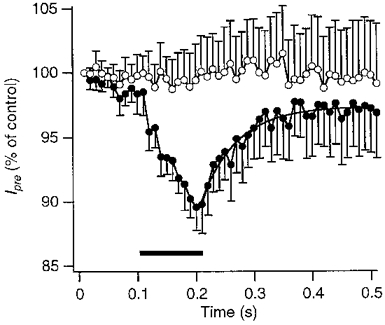
Mean peak amplitude of the presynaptic barium current during APWs in 5 experiments, using the same protocol as shown in Fig. 4. Currents were normalized to the response to the first APW of each train. The presynaptic barium currents decreased during the depolarizing step in the postsynaptic cell (•). The depolarizing step is indicated by the filled bar. No effect was seen in the absence of a depolarizing step (○). Continuous line is a fit with a single exponential function with a time constant of 60 ms. Interval between trains was 60 s. Postsynaptic cell contained 10 mM BAPTA, presynaptic terminal contained 1 mM fura-2.
Depolarization of the postsynaptic cell to −10 mV for 100 ms with Ca2+ as the charge carrier resulted in the influx of 120 ± 14 pC of Ca2+ and in a decrease of the presynaptic calcium currents by 6 ± 2% (n = 3) at the end of the depolarizing step. Recovery from this decrease occurred with a similar time course to that observed with Ba2+ as the charge carrier (not shown). The observation that the recovery from the depolarization-induced decrease in EPSCs (Fig. 3) and from the decrease in the presynaptic Ca2+ or Ba2+ influx (Fig. 5) were similar, suggested that the postsynaptic depolarization-induced synaptic depression was caused by a reduction in presynaptic transmitter release due to a decrease in presynaptic Ca2+ influx.
Effect of presynaptic Ca2+ influx on pre- and postsynaptic calcium currents
The decrease in the presynaptic currents during an APW that was induced by the postsynaptic depolarization was also observed under conditions where Ba2+ was the charge carrier and the postsynaptic cell contained 10 mM BAPTA. Therefore, it did not seem likely that a retrograde messenger was causing the transient decrease in the presynaptic currents, although a release mechanism that is not based on exocytosis cannot be fully excluded. The alternative possibility, namely that a depletion of extracellular Ca2+ was responsible for the effect of the postsynaptic calcium influx on the size of the presynaptic calcium currents, was further tested by reversing the role of the terminal and the postsynaptic cell. The protocol used in Fig. 4 was less suitable for this purpose, since a small residual EPSC prevented the quantification of the postsynaptic calcium currents during APWs. Instead, a long depolarization was applied to the presynaptic terminal and its effect on both the pre- and the postsynaptic calcium currents was tested. We first stepped the membrane potential of the presynaptic terminal for 100 ms to different potentials (Fig. 6A, upper traces). This prepulse was followed by a short (5 ms) test pulse applied simultaneously to the pre- (Fig. 6A, Vpre) and postsynaptic (Fig. 6A, Vpost) membrane 10 and 115 ms after the end of the prepulse. The test pulses were to 0 mV, close to the reversal potential of the EPSC, making it possible to neglect the contribution of the small residual EPSC to the postsynaptic currents that were evoked by the test pulses. The terminal was loaded with 10 mM BAPTA. The presynaptic prepulse reduced both the pre- and the postsynaptic currents that were evoked by the test pulses. The amount of reduction depended on the size of the presynaptic calcium current that was evoked by the prepulse. The maximum reduction of the presynaptic calcium current during the first test pulse was 29 ± 3% (n = 5). This maximum was reached at command voltages of −10 to 0 mV, following the entry of 161 ± 11 pC of Ca2+ during the prepulse (Fig. 6A). A second test pulse, applied 100 ms after the first one, showed that the presynaptic calcium current recovered relatively slowly.
Figure 6. Current-dependent decrease of pre- and postsynaptic calcium currents during presynaptic Ca2+ influx.
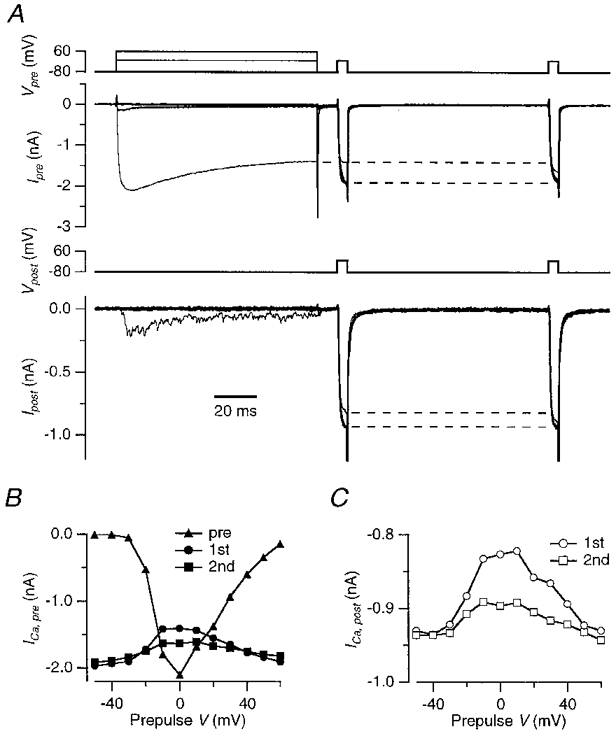
A, a 100 ms step to −40, 0 or 60 mV in the presynaptic terminal was followed after 10 ms and after 115 ms by a 5 ms step to 0 mV applied simultaneously to both the pre- (top traces, Vpre) and the postsynaptic recording (third trace from top, Vpost). Presynaptic currents are shown in the family of traces second from top (Ipre), postsynaptic currents in the family of traces fourth from top (Ipost). The first 0·6 ms of the postsynaptic capacitative artifact has been blanked. Data were digitally filtered to 1 kHz. Terminal contained 10 mM BAPTA. The dashed lines indicate the difference in the currents evoked during the first test pulse in the absence or presence of a prepulse to 0 mV. B, peak amplitudes of the presynaptic calcium currents measured during the prepulse and during the test pulses to 0 mV. Test pulses were given 10 ms (•) and 115 ms (▪) after the prepulse (▴). C, peak amplitudes of the postsynaptic calcium currents measured during the test pulse to 0 mV at 10 ms (○) and at 115 ms (□) following the prepulses applied to the calyx.
The presynaptic prepulse also reduced the size of the postsynaptic calcium current during the test pulse. Again, the larger the size of the presynaptic current during the test pulse, the larger the reduction of the current during the test pulse. The postsynaptic calcium current during the first test pulse in the postsynaptic cell was reduced by a maximum of 14 ± 3% (n = 5, Fig. 6A and C). After a presynaptic prepulse to 60 mV, postsynaptic calcium currents did not decrease. A second 5 ms test pulse to 0 mV was applied 100 ms later to the postsynaptic cell to monitor recovery of the calcium currents. The reduction in the postsynaptic calcium current was around 50% smaller during the second test pulse (Fig. 6A), similar to the recovery of the presynaptic calcium currents (Fig. 6A).
Effect of high concentrations of BAPTA on transmitter release
In the same series of experiments as that illustrated in Fig. 6, it was possible to compare the relationship between presynaptic Ca2+ influx and decrease of postsynaptic calcium current with the relationship between presynaptic Ca2+ influx and presynaptic transmitter release (as measured from the EPSC amplitude). Since the reduction of the postsynaptic calcium current depended linearly on the size of the presynaptic calcium influx during the prepulse, we tested whether transmitter release in the presence of 10 mM BAPTA in the terminal also depended linearly on the presynaptic calcium influx. This is to be expected if the reduction was due to vesicular release of an anterograde messenger. When terminals were loaded with 10 mM BAPTA, the evoked release was much smaller than in the presence of 50 μM fura-2. Even at the voltage that resulted in the maximal presynaptic calcium current (Fig. 7A), all that was observed was an increase in the frequency of small EPSCs, which returned to the baseline within a few millliseconds after the Ca2+ influx into the terminal stopped (Fig. 7A, bottom traces). The low level of release was not due to an inhibitory effect of BAPTA on the calcium currents (Bödding & Penner, 1995), since peak amplitudes of the calcium currents were similar in the presence of 10 mM BAPTA and 50 μM fura-2 (-2·0 ± 0·2 and −1·7 ± 0·2 nA, respectively, reached at −10 to 0 mV). To obtain a rough estimate of the number of vesicles that were released, the integral of the increase in the postsynaptic current during the presynaptic prepulse was divided by the quantal charge (assumed to be 83 fC; Borst & Sakmann, 1996). Maximal total output was only around 90 ± 20 vesicles (n = 5), obtained at the peak of the Ca2+ influx. This is less than the quantal content at physiological Ca2+ concentration of a single action potential, which is about 200 (Borst & Sakmann, 1996).
Figure 7. Calcium dependence of synaptic transmission in the presence of 10 mM BAPTA in the terminal.
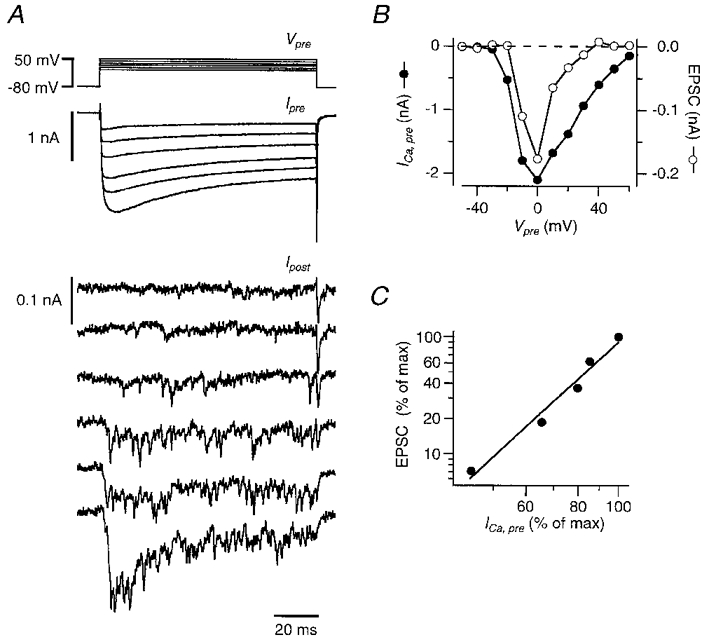
Same experiment as illustrated in Fig. 6. A, simultaneous recording of presynaptic calcium currents (middle) and EPSCs (bottom) during presynaptic voltage steps to different potentials (top). For the calcium currents and the EPSCs the bottom trace is the step to 0 mV and the top trace is the step to 50 mV. B, peak amplitude of the presynaptic calcium current during the prepulse versus voltage (•, left axis) and mean amplitude of the EPSC evoked by the prepulse measured between 5 and 10 ms after the onset of the presynaptic voltage step (○, right axis). C, peak amplitude of presynaptic calcium currents and EPSC amplitudes during the prepulse, plotted on a double-logarithmic scale. Slope of the straight line is 3·3.
The EPSCs that were elicited by the step to the voltage that resulted in the largest presynaptic calcium current (e.g. 0 mV in Fig. 7A) were 40–70% smaller towards the end than at the beginning of the depolarizing step in the terminal (Fig. 7A, bottom trace). Because of the small peak amplitude of the postsynaptic currents (< 250 pA; Fig. 7A), neither postsynaptic receptor desensitization nor depletion of the releasable pool of vesicles is likely to contribute to this form of synaptic depression. Instead, the reduction in the presynaptic calcium current during the depolarization is a more likely cause.
Release of glutamate was proportional to approximately the third power of the Ca2+ influx when the calyx was loaded with 10 mM BAPTA (n = 4, Fig. 7A). This is in contrast to the reduction of the postsynaptic voltage-activated calcium currents during the test pulses in the same experiments, which was linearly proportional to the size of the presynaptic calcium influx during the prepulse (cf. Figs 6B and 7B).
DISCUSSION
We studied the reduction of EPSCs and the presynaptic Ca2+ influx during a prolonged postsynaptic depolarization. The results indicated that this reduction was due to the depletion of Ca2+ in the synaptic cleft. Here, we will discuss the mechanics and implications of this finding. In general, we were able to separate the contribution of depletion from the contribution of calcium channel inactivation by studying the effect of postsynaptic calcium influx on presynaptic calcium currents and vice versa. Any sort of cross-talk between the pre- and the postsynaptic cell is expected to occur via the synaptic cleft, since this is where they contact each other.
Depletion of Ca2+ in the synaptic cleft
Postsynaptic depolarization resulted in a novel form of synaptic depression that was most probably due to depletion of Ca2+ in the synaptic cleft. The main evidence favouring Ca2+ depletion was that the postsynaptic calcium current reduced the presynaptic Ca2+ influx in a current-dependent manner. These experiments were performed under conditions that minimized the likelihood that a retrograde messenger would be released from the postsynaptic cell body. In the presence of 10 mM BAPTA, somatic release is expected to be blocked during 100 ms depolarizing steps (Huang & Neher, 1996), although it has been argued that this concentration of BAPTA was not sufficient to block the release of a retrograde messenger from Purkinje cells (Vincent & Marty, 1993). We observed that the effects were actually somewhat larger with Ba2+ as the charge carrier than with Ca2+, in contrast to what would be expected for Ca2+-dependent vesicular release of a retrograde messenger. A second line of evidence favouring Ca2+ depletion in the cleft was that the presynaptic calcium current reduced the postsynaptic calcium current in a current-dependent manner, again under conditions where transmitter release was minimal. Although the reduction in the postsynaptic calcium current could be due to the release of an unknown messenger from the terminal, the reduction in the postsynaptic current depended linearly on the size of the presynaptic Ca2+ influx, whereas the release of glutamate depended on the third power of the presynaptic Ca2+ influx.
Contribution of Ca2+ depletion to reduction of presynaptic calcium current
What was the contribution of extracellular Ca2+ depletion to the decrease in presynaptic calcium currents during a prolonged presynaptic depolarization? A 100 ms depolarization of the presynaptic terminal reduced the postsynaptic calcium currents by about 15%, whereas the presynaptic calcium currents were reduced by about 30%. Conversely, a 100 ms depolarization of the postsynaptic cell caused a reduction of the presynaptic calcium current of around 10%. Although the amplitudes of the pre- and postsynaptic calcium currents were similar, not all postsynaptic calcium channels face the synaptic cleft (Fig. 1; Bollmann et al. 1998). Somatic calcium channels that are not facing the synaptic cleft and dendritic or axonal channels will not directly contribute to the depletion of Ca2+ around the presynaptic terminal. Therefore, presynaptic Ca2+ influx is expected to decrease the Ca2+ concentration around the terminal more efficiently than postsynaptic Ca2+ influx. The reverse is probably also true, since not all presynaptic calcium currents face the synaptic cleft (Wu et al. 1999). Presynaptic calcium influx during a 100 ms step resulted in a decrease of the postsynaptic calcium currents that was half as large as the decrease in the presynaptic calcium currents. A clear decrease in presynaptic Ca2+ currents was also observed following a 100 ms postsynaptic step. Therefore, we conclude that up to half of the decrease of the current through presynaptic calcium channels in the calyx of Held during a 100 ms presynaptic depolarizing step appears to be due to depletion of Ca2+ in the extracellular space. It should be noted that recordings shown here were made from cells at the surface of the slice, during continuous bath perfusion, minimizing depletion of Ca2+ in the extracellular volume.
Inactivation of presynaptic calcium channels
An additional mechanism that contributed to the reduction of the presynaptic calcium current is, presumably, the inactivation of calcium channels. The calyx of Held in 9-day-old rats contains a mixture of different types of calcium channels. N-, P/Q- and R-type channels all contribute to release (Iwasaki & Takahashi, 1998; Wu et al. 1998, 1999). The inactivation mechanism of neuronal, non-L-type calcium channels has been difficult to elucidate. Some properties have been suggestive of a mechanism in which the build-up of [Ca2+]i inactivates the channel, others more indicative of a voltage-dependent inactivation mechanism (Kasai & Aosaki, 1988; Jones & Marks, 1989; Kay, 1991; Cox & Dunlap, 1994; Forsythe et al. 1998; Patil et al. 1998). A U-shaped inactivation curve (Fig. 6) is insufficient evidence for a calcium-dependent inactivation mechanism, since it has been shown that such an inactivation curve may also be produced by a voltage-dependent inactivation mechanism (Jones & Marks, 1989; Patil et al. 1998).
Current-dependent reduction of presynaptic calcium currents has also been observed at other presynaptic terminals (Augustine & Eckert, 1984; Yawo & Momiyama, 1993; von Gersdorff & Matthews, 1996; Wright et al. 1996; Branchaw et al. 1997). However, apart from the U-shaped inactivation curve, the reduction of the calcium current in the calyx lacked the hallmarks of the calcium-dependent inactivation of calcium currents (Eckert & Chad, 1984). In particular, the decrease in the currents was not very different when Ba2+ was used as a charge carrier or when high concentrations of BAPTA were used to minimize the build-up of [Ca2+]i (results not shown; Forsythe et al. 1998). Forsythe et al. (1998) observed that inactivation was reduced when currents were carried by monovalent cations, supporting a calcium-dependent mechanism, although it cannot be excluded that the absence of divalent cations changes the gating of calcium channels (Cox & Dunlap, 1994) and depletion of the charge carrier in the synaptic cleft may have been less pronounced under these conditions. We found that our earlier preliminary evidence favouring a contribution of presynaptic calcium channel inactivation to synaptic depression during high-frequency action potential trains (Borst et al. 1997) could instead be attributed to depletion of extracellular Ca2+ (not shown). Therefore, before a definitive conclusion about the inactivation mechanism of the calcium channels in the calyx of Held can be drawn, more experiments are needed that take the contribution of depletion into account.
Cleft geometry
If Ca2+ influx is substantial, the restricted extracellular space may be depleted of Ca2+ (Almers et al. 1981; Bers, 1983). The observation that the synaptic cleft can be depleted of Ca2+ is compatible with its small volume (Krnjevic et al. 1980; Smith, 1992; Vassilev et al. 1997; Egelman & Montague, 1998; Rusakov et al. 1998). The calyx of Held covers around 60% of the soma of the principal cell (Casey & Feldman, 1988). Assuming a surface area of 1000 μm2 for the principal cell (Sommer et al. 1993) and an average width of 30 nm, the synaptic cleft would contain only 7 pC of Ca2+ when the extracellular Ca2+ concentration is 2 mM (Fig. 1). This amount would be sufficient to support not more than around eight presynaptic (Borst & Sakmann, 1996; Helmchen et al. 1997) or two to three postsynaptic (Bollmann et al. 1998) action potentials if Ca2+ entered only from the synaptic cleft volume. However, for a clearly detectable decrease, a 100 ms pre- or postsynaptic step to 0 mV was required, which resulted in the entry of more than 100 pC of Ca2+ into the terminal or the postsynaptic cell. Although the calcium channels in the calyx of Held do not exclusively face the synaptic cleft (Wu et al. 1999) and the same holds for the postsynaptic cell (Bollmann et al. 1998), nevertheless this suggests that the calcium content of the synaptic cleft is much larger than 7 pC.
There are three possible explanations for this discrepancy. Firstly, the synaptic cleft volume may be larger than assumed in the above calculation. A clear widening of the interface between the calyx and the postsynaptic soma inbetween active zones has been observed (Lenn & Reese, 1966; Casey & Feldman, 1985, 1988). This is not an artifact induced by fixatives, as these were also observed after rapid cryo-fixation in the calyx terminals of the anteroventral cochlear nucleus (Tatsuoka & Reese, 1989). Secondly, Ca2+ is likely to accumulate near membranes (McLaughlin, 1989; Cevc, 1990). In recent simulation studies, this effect was not taken into account (Smith, 1992; Vassilev et al. 1997; Egelman & Montague, 1998; but see Bers & Peskoff, 1991). Thirdly, there may be a mechanism for rapid replenishment of extracellular Ca2+ that was not picked up in our experiments. We will next discuss the latter two possibilities in more detail.
Accumulation of Ca2+ near membranes
Although no evidence for strong interactions with fixed charges on the surface of cells was observed for long-range diffusion (Nicholson & Rice, 1987), the Ca2+ concentration is likely to be higher near the membrane (McLaughlin, 1989; Cevc, 1990). How much calcium the membranes that are facing the synaptic cleft bind is not known, but a relatively large concentration of Ca2+ has been demonstrated in the synaptic cleft using histochemical methods (Probst, 1986). Sarcolemmal vesicle membranes bind around 0·6 Ca2+ nm−2 at physiological calcium concentrations (Bers & Peskoff, 1991). Assuming a similar binding capacity for synaptic membranes and a cleft width of 30 nm, the calcium bound to the membranes would raise the total calcium content 35-fold, providing one explanation for the apparent resistance to depletion of the synaptic cleft. Most of the calcium probably binds to zwitterionic phospholipids (Bers et al. 1985). Like sarcolemmal membranes (Post et al. 1988), the outer leaflet of synaptic membranes contains few anionic phospholipids: less than 1% is phosphatidylserine (Fontaine et al. 1980). Figure 8 shows the relationship between negative charge density and total Ca2+ content of the synaptic cleft. The dashed line shows the charge if the membranes bound Ca2+ directly. An even larger density would be needed if the calcium was bound as a diffuse counter ion cloud (Appendix; continuous line in Fig. 8).
Figure 8. Calcium charge inside the cleft as a function of the membrane surface charge density.
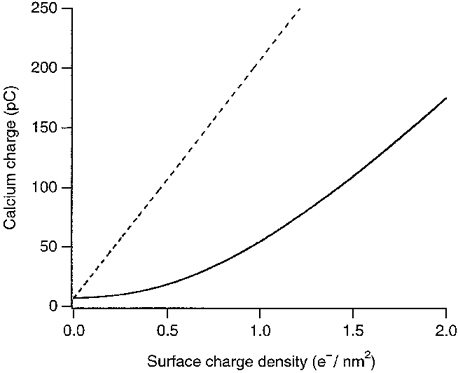
The calcium charge inside the volume of the cleft for co-ordinated binding (dashed line) and diffuse binding (continuous line) is plotted as a function of the membrane surface charge density in electronic units per nanometre squared. The surface charge density of the membranes and the calcium charge were obtained by integrating the Poisson-Boltzmann equation (Bers et al. 1985). For this figure, the bulk concentrations of potassium, calcium and chloride ions are 150, 2 and 154 mM, respectively. The geometry of the synaptic cleft is as described in the Discussion.
Recovery from depletion of Ca2+ in the synaptic cleft
Most probably, the bulk extracellular volume was the source for the replenishment of the Ca2+ in the synaptic cleft. The time course of recovery could be approximated by a single exponential function with a time constant of around 60 ms. This means that on a time scale of hundreds of milliseconds, the Ca2+ concentration in the bulk of the synaptic cleft volume is expected to be similar to the Ca2+ concentration in the interstitial fluid. With a diffusion constant for Ca2+ of 300 μm2 s−1 (Nicholson & Rice, 1987) calcium ions are expected to diffuse on average around 10 μm in 60 ms. This recovery is somewhat slower than expected, since the diameter of the postsynaptic cell is around 15–20 μm, resulting in a maximal possible path length of close to 10 μm. One possible explanation is that diffusion may be slowed down as a result of the interaction of Ca2+ with membranes (McLaughlin & Brown, 1981).
Apart from this slow component of replenishment, there may be a component that was too fast to be picked up in our experiments. For example, in 9-day-old rats the calyces already contain fenestrations (Kandler & Friauf, 1993), which will reduce the path length for diffusion of Ca2+ from the bulk extracellular volume. Clearly, more information about the complex geometry of the synaptic cleft is needed for a more definite statement. In addition, when calcium ions enter the cell, the synaptic cleft becomes more negative. This electrical driving force may have speeded up the replenishment of Ca2+ from the extracellular volume.
Two other mechanisms that could contribute to replenishment in vivo probably did not contribute in our experiments. Firstly, extrusion of Ca2+ from the terminal or postsynaptic cell was negligible, since the loading with exogenous calcium buffers slows the clearance of Ca2+ from the pre- and postsynaptic cytoplasm appreciably (Helmchen et al. 1997; Bollmann et al. 1998). As a result, the measured time course of the return of [Ca2+]i to the resting level was much slower than the recovery from depletion. At physiological temperature, the presynaptic volume-averaged Ca2+ concentration in the terminal decays with a time constant of around 35 ms following an action potential (Helmchen et al. 1997). This suggests that extrusion of Ca2+ could contribute to recovery from depletion at physiological temperatures. However, clearance of Ca2+ is slower after larger Ca2+ loads (F. Helmchen, unpublished results). A dependence of the duration of Ca2+ transients on the duration of action potential trains has also been reported for calyx-type terminals in the chick ciliary ganglion (Brain & Bennett, 1995).
The second mechanism that could contribute in vivo is replenishment of extracellular Ca2+ by vesicle fusion. Synaptic vesicles contain high concentrations of Ca2+. Although the exact concentration is difficult to measure, it may be at least 100 mM (Grohovaz et al. 1996). If their Ca2+ content is that high, a vesicle would be able to resupply a substantial fraction of the Ca2+ that flows in for each vesicle that is released. In the case of the calyx of Held, with a total of about 13 000 calcium ions entering the calyx per released vesicle (Borst & Sakmann, 1996), a 50 nm vesicle containing > 100 mM Ca2+ would resupply > 30% of the calcium that had entered the terminal.
Contribution of a reduction in presynaptic Ca2+ influx to synaptic depression
Under most conditions, vesicle depletion rather than a reduction in presynaptic Ca2+ influx may be the dominant mechanism for short-term synaptic depression in the MNTB (von Gersdorff et al. 1997; Borst & Sakmann, 1998b; Wang & Kaczmarek, 1998; Wu & Borst, 1999). The presynaptic calcium influx during a single presynaptic action potential triggered, by itself, only a small depletion of the Ca2+ in the synaptic cleft. However, following a large influx into the postsynaptic cell, the synaptic cleft was partially depleted of Ca2+, resulting in a short-lived form of synaptic depression. Our experiments suggest that under certain conditions the Ca2+ concentration in the synaptic cleft provides a sensitive measure of the level of synaptic activity, but that the synaptic cleft is more resistant to Ca2+ depletion than expected on the basis of its small volume.
Acknowledgments
We thank L.-G. Wu and B. Katz for their comments on an earlier version of this manuscript and S. McLaughlin, A. Roth and E. von Kitzing for helpful discussions on the interaction of Ca2+ with membranes. J.G.G.B. was supported by a Training and Mobility of Researchers fellowship.
APPENDIX
Eberhard von Kitzing
Estimating the contribution of calcium binding to membrane charges to the calcium concentration in the synaptic cleft
A considerable discrepancy between the calcium charge inside the cleft measured in the depletion experiments and that estimated from the volume of the cleft and its bulk calcium concentration was observed. The experiments suggested a calcium charge inside the cleft of more than 200 pC. On the other hand, in the bulk solution of the cleft a calcium charge of 7 pC is estimated. A calcium concentration of 2 mM, together with a contact surface of 600 μm2 and a width of the cleft of 30 nm yields a charge of 7 pC. How can this paradox be explained? A possible mechanism to store considerable amounts of calcium in the cleft is co-ordinated or diffuse binding to the cleft membranes.
Both sides of the cleft are facing the membrane, thus, the total membrane surface to which calcium may bind is S≈ 1200μm2= 1·2 × 109 nm2. Two hundred picocoulombs distributed over this surface results in a surface charge density of 0·17 pC μm−2, being equivalent to one electronic charge per nanometre squared or 0·5 calcium atoms per nanometre squared, similar to the estimated binding of Ca2+ to sarcolemmal membranes (Bers & Peskoff, 1991). This would be the surface charge density or surface calcium density if the 200 pC bound directly to the membrane delineating the cleft.
Another possibility would be diffuse binding to lipid surface charges. Any surface charge density is screened by a respective counter ion cloud in the solution. Because the surface charges would not only be screened by calcium, the respective negative surface charge density would have to be even larger than in the case of direct binding. However, because divalent ions are much more effective in screening than monovalent ions (Muller & Finkelstein, 1972; Cevc, 1990), even at low calcium concentrations, calcium ions would dominate screening. The necessary surface charge density to create a certain total calcium charge in the cleft is shown in Fig. 8.
References
- Almers W, Fink R, Palade PT. Calcium depletion in frog muscle tubules: the decline of calcium current under maintained depolarization. The Journal of Physiology. 1981;312:177–207. doi: 10.1113/jphysiol.1981.sp013623. [DOI] [PMC free article] [PubMed] [Google Scholar]
- Augustine GJ, Eckert R. Calcium-dependent inactivation of presynaptic calcium channels. Society for Neuroscience Abstracts. 1984;10:194. [Google Scholar]
- Barnes-Davies M, Forsythe ID. Pre- and postsynaptic glutamate receptors at a giant excitatory synapse in rat auditory brainstem slices. The Journal of Physiology. 1995;488:387–406. doi: 10.1113/jphysiol.1995.sp020974. [DOI] [PMC free article] [PubMed] [Google Scholar]
- Bers DM. Early transient depletion of extracellular Ca during individual cardiac muscle contractions. American Journal of Physiology. 1983;244:H462–468. doi: 10.1152/ajpheart.1983.244.3.H462. [DOI] [PubMed] [Google Scholar]
- Bers DM, Peskoff A. Diffusion around a cardiac calcium channel and the role of surface bound calcium. Biophysical Journal. 1991;59:703–721. doi: 10.1016/S0006-3495(91)82284-6. [DOI] [PMC free article] [PubMed] [Google Scholar]
- Bers DM, Philipson KD, Peskoff A. Calcium at the surface of cardiac plasma membrane vesicles: cation binding, surface charge screening and Na-Ca exchange. Journal of Membrane Biology. 1985;85:251–261. doi: 10.1007/BF01871520. [DOI] [PubMed] [Google Scholar]
- Bödding M, Penner R. Pharmacological effects of Ca2+ chelators on calcium currents in bovine chromaffin cells. Biophysical Journal. 1995;68:A210. [Google Scholar]
- Bollmann JH, Helmchen F, Borst JGG, Sakmann B. Postsynaptic Ca2+ influx mediated by three different pathways during synaptic transmission at a calyx-type synapse. Journal of Neuroscience. 1998;18:10409–10419. doi: 10.1523/JNEUROSCI.18-24-10409.1998. [DOI] [PMC free article] [PubMed] [Google Scholar]
- Borst JGG, Helmchen F. Calcium influx during an action potential. In: Conn PM, editor. Methods in Enzymology. Vol. 293. New York: Academic Press; 1998. pp. 352–371. [DOI] [PubMed] [Google Scholar]
- Borst JGG, Helmchen F, Sakmann B. Pre- and postsynaptic whole-cell recordings in the medial nucleus of the trapezoid body of the rat. The Journal of Physiology. 1995;489:825–840. doi: 10.1113/jphysiol.1995.sp021095. [DOI] [PMC free article] [PubMed] [Google Scholar]
- Borst JGG, Helmchen F, Sakmann B. A decrease in presynaptic calcium influx may contribute to synaptic depression. Journal of General Physiology. 1997;110:18–19A. [Google Scholar]
- Borst JGG, Sakmann B. Calcium influx and transmitter release in a fast CNS synapse. Nature. 1996;383:431–434. doi: 10.1038/383431a0. [DOI] [PubMed] [Google Scholar]
- Borst JGG, Sakmann B. Calcium current during a single action potential in a large presynaptic terminal of the rat brainstem. The Journal of Physiology. 1998a;506:143–157. doi: 10.1111/j.1469-7793.1998.143bx.x. [DOI] [PMC free article] [PubMed] [Google Scholar]
- Borst JGG, Sakmann B. Facilitation of presynaptic calcium currents in the rat brainstem. The Journal of Physiology. 1998b;513:149–155. doi: 10.1111/j.1469-7793.1998.149by.x. [DOI] [PMC free article] [PubMed] [Google Scholar]
- Borst JGG, Sakmann B. Effect of changes in action potential shape on calcium currents and transmitter release in a calyx-type synapse of the rat auditory brainstem. Philosophical Transactions of the Royal Society. 1999;354:347–355. doi: 10.1098/rstb.1999.0386. B. [DOI] [PMC free article] [PubMed] [Google Scholar]
- Brain KL, Bennett MR. Calcium in the nerve terminals of chick ciliary ganglia during facilitation, augmentation and potentiation. The Journal of Physiology. 1995;489:637–648. doi: 10.1113/jphysiol.1995.sp021079. [DOI] [PMC free article] [PubMed] [Google Scholar]
- Branchaw JL, Banks MI, Jackson MB. Ca2+- and voltage-dependent inactivation of Ca2+ channels in nerve terminals of the neurohypophysis. Journal of Neuroscience. 1997;17:5772–5781. doi: 10.1523/JNEUROSCI.17-15-05772.1997. [DOI] [PMC free article] [PubMed] [Google Scholar]
- Casey MA, Feldman ML. Aging in the rat medial nucleus of the trapezoid body. Journal of Comparative Neurology. 1985;232:401–413. doi: 10.1002/cne.902320311. II. Electron microscopy. [DOI] [PubMed] [Google Scholar]
- Casey MA, Feldman ML. Age-related loss of synaptic terminals in the rat medial nucleus of the trapezoid body. Neuroscience. 1988;24:189–194. doi: 10.1016/0306-4522(88)90322-3. [DOI] [PubMed] [Google Scholar]
- Cevc G. Membrane electrostatics. Biochimica et Biophysica Acta. 1990;1031:311–382. doi: 10.1016/0304-4157(90)90015-5. [DOI] [PubMed] [Google Scholar]
- Cox DH, Dunlap K. Inactivation of N-type calcium current in chick sensory neurons: calcium and voltage dependence. Journal of General Physiology. 1994;104:311–336. doi: 10.1085/jgp.104.2.311. [DOI] [PMC free article] [PubMed] [Google Scholar]
- Eckert R, Chad JE. Inactivation of Ca channels. Progress in Biophysics and Molecular Biology. 1984;44:215–267. doi: 10.1016/0079-6107(84)90009-9. [DOI] [PubMed] [Google Scholar]
- Egelman DM, Montague PR. Computational properties of peri-dendritic calcium fluctuations. Journal of Neuroscience. 1998;18:8580–8589. doi: 10.1523/JNEUROSCI.18-21-08580.1998. [DOI] [PMC free article] [PubMed] [Google Scholar]
- Fitzsimonds RM, Poo MM. Retrograde signaling in the development and modification of synapses. Physiological Reviews. 1998;78:143–170. doi: 10.1152/physrev.1998.78.1.143. [DOI] [PubMed] [Google Scholar]
- Fontaine RN, Harris RA, Schroeder F. Aminophospholipid asymmetry in murine synaptosomal plasma membrane. Journal of Neurochemistry. 1980;34:269–277. doi: 10.1111/j.1471-4159.1980.tb06592.x. [DOI] [PubMed] [Google Scholar]
- Forsythe ID, Barnes-Davies M. The binaural auditory pathway: excitatory amino acid receptors mediate dual timecourse excitatory postsynaptic currents in the rat medial nucleus of the trapezoid body. Proceedings of the Royal Society. 1993;251:151–157. doi: 10.1098/rspb.1993.0022. B. [DOI] [PubMed] [Google Scholar]
- Forsythe ID, Tsujimoto T, Barnes-Davies M, Cuttle MF, Takahashi T. Inactivation of presynaptic calcium current contributes to synaptic depression at a fast central synapse. Neuron. 1998;20:797–807. doi: 10.1016/s0896-6273(00)81017-x. [DOI] [PubMed] [Google Scholar]
- Geiger JRP, Melcher T, Koh D-S, Sakmann B, Seeburg PH, Jonas P, Monyer H. Relative abundance of subunit mRNAs determines gating and Ca2+ permeability of AMPA receptors in principal neurons and interneurons in rat CNS. Neuron. 1995;15:193–204. doi: 10.1016/0896-6273(95)90076-4. [DOI] [PubMed] [Google Scholar]
- Grohovaz F, Bossi M, Pezzati R, Meldolesi J, Torri Tarelli F. High resolution ultrastructural mapping of total calcium: electron spectroscopic imaging/electron energy loss spectroscopy analysis of a physically/chemically processed nerve-muscle preparation. Proceedings of the National Academy of Sciences of the USA. 1996;93:4799–4803. doi: 10.1073/pnas.93.10.4799. [DOI] [PMC free article] [PubMed] [Google Scholar]
- Heinemann U, Konnerth A, Pumain R, Wadman WJ. Extracellular calcium and potassium concentration changes in chronic epileptic brain tissue. Advances in Neurology. 1986;44:641–661. [PubMed] [Google Scholar]
- Helmchen F, Borst JGG, Sakmann B. Calcium dynamics associated with a single action potential in a CNS presynaptic terminal. Biophysical Journal. 1997;72:1458–1471. doi: 10.1016/S0006-3495(97)78792-7. [DOI] [PMC free article] [PubMed] [Google Scholar]
- Herrington J, Bookman RJ. Pulse Control V4.0: IGOR XOPs for Patch Clamp Data Acquisition and Capacitance Measurements. Miami, FL, USA: University of Miami; 1994. [Google Scholar]
- Huang L-Y M, Neher E. Ca2+-dependent exocytosis in the somata of dorsal root ganglion neurons. Neuron. 1996;17:135–145. doi: 10.1016/s0896-6273(00)80287-1. [DOI] [PubMed] [Google Scholar]
- Iwasaki S, Takahashi T. Developmental changes in calcium channel types mediating synaptic transmission in rat auditory brainstem. The Journal of Physiology. 1998;509:419–423. doi: 10.1111/j.1469-7793.1998.419bn.x. [DOI] [PMC free article] [PubMed] [Google Scholar]
- Jones SW, Marks TN. Calcium currents in bullfrog sympathetic neurons. II. Inactivation. Journal of General Physiology. 1989;94:169–182. doi: 10.1085/jgp.94.1.169. [DOI] [PMC free article] [PubMed] [Google Scholar]
- Kandler K, Friauf E. Pre- and postnatal development of efferent connections of the cochlear nucleus in the rat. Journal of Comparative Neurology. 1993;328:161–184. doi: 10.1002/cne.903280202. [DOI] [PubMed] [Google Scholar]
- Kasai H, Aosaki T. Divalent cation dependent inactivation of the high-voltage-activated Ca-channel current in chick sensory neurons. Pflügers Archiv. 1988;411:695–697. doi: 10.1007/BF00580869. [DOI] [PubMed] [Google Scholar]
- Kay AR. Inactivation kinetics of calcium current of acutely dissociated CA1 pyramidal cells of the mature guinea-pig hippocampus. The Journal of Physiology. 1991;437:27–48. doi: 10.1113/jphysiol.1991.sp018581. [DOI] [PMC free article] [PubMed] [Google Scholar]
- Krnjevic K, Morris ME, Reiffenstein RJ. Changes in extracellular Ca2+ and K+ activity accompanying hippocampal discharges. Canadian The Journal of Physiology and Pharmacology. 1980;58:579–583. doi: 10.1139/y80-097. [DOI] [PubMed] [Google Scholar]
- Lenn NJ, Reese TS. The fine structure of nerve endings in the nucleus of the trapezoid body and the ventral cochlear nucleus. American Journal of Anatomy. 1966;118:375–390. doi: 10.1002/aja.1001180205. [DOI] [PubMed] [Google Scholar]
- McLaughlin S. The electrostatic properties of membranes. Annual Reviews in Biophysics and Biophysical Chemistry. 1989;18:113–136. doi: 10.1146/annurev.bb.18.060189.000553. [DOI] [PubMed] [Google Scholar]
- McLaughlin S, Brown J. Diffusion of calcium ions in retinal rods. A theoretical calculation. Journal of General Physiology. 1981;77:475–487. doi: 10.1085/jgp.77.4.475. [DOI] [PMC free article] [PubMed] [Google Scholar]
- Muller RU, Finkelstein A. The effect of surface charge on the voltage-dependent conductance induced in thin lipid membranes by monazomycin. Journal of General Physiology. 1972;60:285–306. doi: 10.1085/jgp.60.3.285. [DOI] [PMC free article] [PubMed] [Google Scholar]
- Neher E. Vesicle pools and Ca2+ microdomains: new tools for understanding their roles in neurotransmitter release. Neuron. 1998;20:389–399. doi: 10.1016/s0896-6273(00)80983-6. [DOI] [PubMed] [Google Scholar]
- Nicholson C, Rice ME. Calcium diffusion in the brain cell microenvironment. Canadian The Journal of Physiology and Pharmacology. 1987;65:1086–1091. doi: 10.1139/y87-170. [DOI] [PubMed] [Google Scholar]
- Nicholson C, ten Bruggencate G, Stöckle H, Steinberg R. Calcium and potassium changes in extracellular microenvironment of cat cerebellar cortex. Journal of Neurophysiology. 1978;41:1026–1039. doi: 10.1152/jn.1978.41.4.1026. [DOI] [PubMed] [Google Scholar]
- Oertel D. Encoding of timing in the brain stem auditory nuclei of vertebrates. Neuron. 1997;19:959–962. doi: 10.1016/s0896-6273(00)80388-8. [DOI] [PubMed] [Google Scholar]
- Patil PG, Brody DL, Yue DT. Preferential closed-state inactivation of neuronal calcium channels. Neuron. 1998;20:1027–1038. doi: 10.1016/s0896-6273(00)80483-3. [DOI] [PubMed] [Google Scholar]
- Post JA, Langer GA, Op den Kamp JA, Verkleij AJ. Phospholipid asymmetry in cardiac sarcolemma. Biochimica et Biophysica Acta. 1988;943:256–266. doi: 10.1016/0005-2736(88)90557-3. Analysis of intact cells and ‘gas-dissected’ membranes. [DOI] [PubMed] [Google Scholar]
- Probst W. Ultrastructural localization of calcium in the CNS of vertebrates. Histochemistry. 1986;85:231–239. doi: 10.1007/BF00494809. [DOI] [PubMed] [Google Scholar]
- Rusakov DA, Harrison E, Stewart MG. Synapses in hippocampus occupy only 12% of cell membranes and are spaced less than half-micron apart: a quantitative ultrastructural analysis with discussion of physiological implications. Neuropharmacology. 1998;37:513–521. doi: 10.1016/s0028-3908(98)00023-9. [DOI] [PubMed] [Google Scholar]
- Smith SJ. Do astrocytes process neural information? Progress in Brain Research. 1992;94:119–136. doi: 10.1016/s0079-6123(08)61744-6. [DOI] [PubMed] [Google Scholar]
- Sommer I, Lingenhöhl K, Friauf E. Principal cells of the rat medial nucleus of the trapezoid body: an intracellular in vivo study of their physiology and morphology. Experimental Brain Research. 1993;95:223–239. doi: 10.1007/BF00229781. [DOI] [PubMed] [Google Scholar]
- Tatsuoka H, Reese TS. New structural features of synapses in the anteroventral cochlear nucleus prepared by direct freezing and freeze-substitution. Journal of Comparative Neurology. 1989;290:343–357. doi: 10.1002/cne.902900304. [DOI] [PubMed] [Google Scholar]
- Vassilev PM, Mitchel J, Vassilev M, Kanazirska M, Brown EM. Assessment of frequency-dependent alterations in the level of extracellular Ca2+ in the synaptic cleft. Biophysical Journal. 1997;72:2103–2116. doi: 10.1016/S0006-3495(97)78853-2. [DOI] [PMC free article] [PubMed] [Google Scholar]
- Vincent P, Marty A. Neighboring cerebellar Purkinje cells communicate via retrograde inhibition of common presynaptic interneurons. Neuron. 1993;11:885–893. doi: 10.1016/0896-6273(93)90118-b. [DOI] [PubMed] [Google Scholar]
- von Gersdorff H, Matthews G. Calcium-dependent inactivation of calcium current in synaptic terminals of retinal bipolar neurons. Journal of Neuroscience. 1996;16:115–122. doi: 10.1523/JNEUROSCI.16-01-00115.1996. [DOI] [PMC free article] [PubMed] [Google Scholar]
- von Gersdorff H, Schneggenburger R, Weis S, Neher E. Presynaptic depression at a calyx synapse: the small contribution of metabotropic glutamate receptors. Journal of Neuroscience. 1997;17:8137–8146. doi: 10.1523/JNEUROSCI.17-21-08137.1997. [DOI] [PMC free article] [PubMed] [Google Scholar]
- Wang LY, Kaczmarek LK. High-frequency firing helps replenish the readily releasable pool of synaptic vesicles. Nature. 1998;394:384–388. doi: 10.1038/28645. [DOI] [PubMed] [Google Scholar]
- Wright SN, Brodwick MS, Bittner GD. Presynaptic calcium currents at voltage-clamped excitor and inhibitor nerve terminals of crayfish. The Journal of Physiology. 1996;496:347–361. doi: 10.1113/jphysiol.1996.sp021690. [DOI] [PMC free article] [PubMed] [Google Scholar]
- Wu L-G, Borst JGG. The reduced release probability of releasable vesicles during recovery from short-term synaptic depression. Neuron. 1999;23:1–20. doi: 10.1016/s0896-6273(01)80039-8. [DOI] [PubMed] [Google Scholar]
- Wu L-G, Borst JGG, Sakmann B. R-type Ca2+ currents evoke transmitter release at a rat central synapse. Proceedings of the National Academy of Sciences of the USA. 1998;95:4720–4725. doi: 10.1073/pnas.95.8.4720. [DOI] [PMC free article] [PubMed] [Google Scholar]
- Wu L-G, Westenbroek RE, Borst JGG, Catterall WE, Sakmann B. Calcium channel types with distinct presynaptic localization couple differentially to transmitter release in single calyx-type synapses. Journal of Neuroscience. 1999;19:726–736. doi: 10.1523/JNEUROSCI.19-02-00726.1999. [DOI] [PMC free article] [PubMed] [Google Scholar]
- Yawo H, Momiyama A. Re-evaluation of calcium currents in pre- and postsynaptic neurones of the chick ciliary ganglion. The Journal of Physiology. 1993;460:153–172. doi: 10.1113/jphysiol.1993.sp019464. [DOI] [PMC free article] [PubMed] [Google Scholar]