

Abstract
We made whole-cell recordings from CA1 pyramidal cells in the rat hippocampal slice preparation to study the calcium (Ca2+) dependence of depolarization-induced suppression of inhibition (DSI). DSI is a retrograde signalling process in which voltage-dependent Ca2+ influx into a pyramidal cell leads to a transient decrease in the release of GABA from interneurons.
To investigate the Ca2+ dependence of DSI without altering extracellular divalent cations, we varied the type and amount of Ca2+ chelator (EGTA or BAPTA) in the recording pipette (keeping the chelator: Ca2+ ratio constant). Evoked inhibitory postsynaptic currents (IPSCs) were induced in the presence of antagonists of ionotropic glutamate receptors. DSI was induced by depolarizing voltage steps, lasting from 0·025 to 5 s, to 0 mV.
DSI was directly dependent on the duration of the voltage step used to induce it, from threshold up to a maximal value of IPSC suppression, whether EGTA or BAPTA was used, and whether their concentrations were 0·1, 0·5 or 2 mM. For instance, a voltage step lasting 1·37 s produced half-maximal DSI with 2 mM BAPTA, but with 0·1 mM BAPTA, half-maximal DSI was achieved with a step lasting 0·186 s. Peak DSI was the same in all cases, and DSI was blocked with either 10 mM EGTA or BAPTA in the pipette. Bath application of carbachol could overcome the block of DSI by 10 mM EGTA but not by 10 mM BAPTA.
We calculated that a voltage step lasting ≈100 ms would be necessary to activate half-maximal DSI in the absence of exogenous Ca2+ buffers.
Log-log plots of calculated total Ca2+ influx, estimated from time integrals of Ca2+ currents, versus DSI yielded a straight line with a slope of ≈1, and increasing extracellular [Ca2+] from 2·5 to 5 mM did not change the slope.
The time course of decay of DSI was well described by an exponential function with a time constant of ≈20 s and was not affected by changes in either concentration or type of Ca2+ buffer.
The data suggest that, in its Ca2+ dependence, DSI more closely resembles the slow release of neuropeptides and hormones than it does the process of fast release of many neurotransmitters.
At fast synapses, neurotransmission is tightly coupled to calcium influx and steeply dependent on the instantaneous internal [Ca2+] near the plasma membrane, which rises to high levels, and falls quickly with the opening and closing of voltage-dependent Ca2+ channels (VDCCs) (Dodge & Rahamimoff, 1967; Adler et al. 1991; Llinas et al. 1992; Borst et al. 1995; Borst & Sakmann, 1996; Wu & Saggau, 1997). However, chemical secretion is not always Ca2+ dependent in this way. Slow transmitter release from peptidergic nerve terminals (Peng & Zucker, 1993; Seward et al. 1995) or chromaffin cells (Neher & Zucker, 1993; Chow et al. 1994; Engisch & Nowycky, 1996; Seward & Nowycky, 1996) is typically initiated by prolonged Ca2+ influx and appears to be dependent on the [Ca2+] at a substantial distance from the VDCCs, rather than on the instantaneous submembrane [Ca2+].
Principal cells in the brain can release chemicals, often from dendrites, that travel in the retrograde direction and influence incoming signals. Several unconventional modulators, for example nitric oxide and carbon monoxide (Dawson & Snyder, 1994), may be retrograde messengers, but conventional neurotransmitters may also act in this way. Examples include dopamine (Cheramy et al. 1981; Jaffe et al. 1998) in the substantia nigra, dynorphin in the dentate gyrus (Drake et al. 1994), and oxytocin and vasopressin in the supraoptic nucleus (Kombian et al. 1997). By affecting cells synapsing on it, a cell releasing a retrograde messenger could affect its own state of excitability. Although retrograde signalling is triggered by Ca2+ influx, there is almost no information on its Ca2+ dependence.
A well-established retrograde signal process exists in the hippocampus (Pitler & Alger, 1992, 1994; Alger & Pitler, 1995; Alger et al. 1996; Morishita & Alger, 1997; Ohno-Shosaku et al. 1998) and cerebellum (Llano et al. 1991; Vincent et al. 1992; Vincent & Marty, 1993) whereby voltage-dependent Ca2+ influx into a principal cell causes a transient reduction in the release of GABA from interneurons. This process, called depolarization-induced suppression of inhibition (DSI), is probably mediated by release of a messenger, perhaps glutamate or a glutamate analogue (Glitsch et al. 1996; Morishita et al. 1998), from somato-dendritic regions of the principal cells. DSI thus provides a robust model for investigation of retrograde neurotransmission.
DSI could involve an unusual release mechanism. It is experimentally induced by long cellular depolarizations, usually > 1 s, and has a slow onset and long duration, typically not achieving peak levels for several seconds following postsynaptic depolarization and lasting for 20–60 s at 30°C. Hence, DSI could require large and prolonged increases in [Ca2+]i and have slow intrinsic kinetics. However, the dynamics of [Ca2+]i changes depend not only on the spatiotemporal pattern of Ca2+ influx, but also on endogenous and exogenous Ca2+ buffers (Zhou & Neher, 1993). The calcium buffers, BAPTA or EGTA, used at millimolar concentrations in experiments on DSI, could have affected its properties.
By varying the intracellular Ca2+ buffering conditions, we have begun to explore the Ca2+ dependence of DSI in CA1 pyramidal cells. This approach, extensively used in investigations of neurotransmitter release (Adler et al. 1991; von Gersdorff & Matthews, 1994, 1997; Borst et al. 1995; Borst & Sakmann, 1996; Mennerick & Matthews, 1996), is particularly suitable for DSI because it directly affects [Ca2+]i without influencing other cells or the extracellular environment. The data suggest that DSI more closely resembles hormone or peptide secretion than it does fast synaptic neurotransmission.
METHODS
Preparation of slices
Hippocampal slices were obtained from young adult (30–50 days) Sprague-Dawley rats using conventional techniques. All experiments were carried out in strict accordance with the guidelines set forth by the Institutional Animal Care and Use Committee of the University of Maryland School of Medicine. After the animals were deeply anaesthetized with halothane and decapitated, the hippocampi were quickly removed and placed in ice-cold, oxygenated saline. Hippocampi were glued to the chuck of a vibratome (Technical Products International) and sectioned transversely into 400-μm-thick slices. Slices were incubated at room temperature (22–24°C) for > 1 h before being transferred to the experimental chamber (Nicoll & Alger, 1981), where they were held submerged and constantly perfused with experimental saline bubbled with 95% O2-5% CO2 at 30°C (pH 7·4).
Experimental solutions
The experimental saline consisted of (mM): 120 NaCl, 25 NaHCO3, 3 KCl, 2·5 CaCl2, 2 MgSO4 or MgCl2, 1 NaH2PO4 and 10 glucose, plus 6-cyano-7-nitroquinoxaline-2,3-dione (CNQX), 20 μM, and 2-amino-5-phosphonovaleric acid (APV), 50 μM, to block ionotropic glutamate receptor-mediated responses. When [Ca2+]o was increased to 5 mM, Mg2+ salts were omitted.
Whole-cell patch electrodes (3–6 MΩ in the bathing medium) contained (mM): 100 CsCH3SO3, 10 Hepes, 2 MgATP, 1 MgCl2 and 5 QX-314, pH 7·2. QX-314 is used to block voltage-dependent Na+ and GABAB-mediated inward rectifier conductances that could complicate interpretations. DSI is not dependent on pyramidal cell G-proteins (Pitler & Alger, 1994) and is not affected by absence of guanosine triphosphate (GTP); therefore, to block potentially contaminating G-protein-dependent responses, GTP was omitted. Pipette solutions, except for those with 10 mM Ca2+ buffer, contained 60 or 70 mM CsCl in addition to the above salts, while solutions with 10 mM buffer contained 45 mM CsCl. In all pipette solutions the ratio of [Ca2+ buffer]: total [Ca2+] was 10:1 to maintain free [Ca2+]i∼20 nM. Ca2+ was not added to solutions containing 100 μM Ca2+ buffer, as ∼10 μM Ca2+ is present as contaminants in the water and in other salts. All Ca2+ buffers were introduced into the pyramidal cell by diffusion from the pipette for at least 15 min before data collection was begun.
Data acquisition and analysis
Whole-cell voltage-clamp recordings were made from CA1 pyramidal cells using the ‘blind’ technique (Blanton et al. 1989). An Axoclamp-2B (Axon Instruments) was used, and records were filtered at 2 kHz (Frequency Devices) and digitized at 5 kHz by a Digidata 1200 A/D converter (Axon Instruments). Monosynaptic IPSCs were evoked (eIPSCs) continuously at 0·33 Hz with stimulation in CA1 stratum oriens or radiatum. The magnitude of DSI was calculated from:
where the control IPSC amplitude (IPSCC) is the mean of eight eIPSCs preceding the voltage step, and the test IPSC (IPSCT) is the mean of five IPSCs following the step (omitting the first post-step IPSC, because DSI is still developing at that time; Pitler & Alger, 1994). For each cell, means of 2–6 DSI trials were used to obtain a value of DSI for that cell.
Ca2+ currents were isolated at the end of an experiment by applying DSI-inducing voltage steps after switching to a perfusion containing 200 μM Cd2+ and subtracting the resulting currents from the originals. Data were collected and analysed with pCLAMP6 (Axon Instruments). All fits to the data were generated by Sigmaplot 4.0 (Jandel Scientific).
To estimate the [Ca2+]i that results from a voltage step, we modelled a CA1 pyramidal cell as a spherical soma (10 μm radius) with an apical dendrite consisting of three continuous cylinders totalling 400 μm in length. We only modelled the soma plus apical dendrite because our previous work had shown that our standard protocol elicits DSI that is dependent on current through N-type Ca2+ channels (Lenz et al. 1998), and N-type channels are localized to the cell bodies and apical dendrites of CA1 cells (Westenbroek et al. 1992). The main part of the apical dendrite containing N-type channels is ∼400 μm in length (Westenbroek et al. 1992). We approximated the tapering of the dendrite with three cylinders that were 100, 200 and 100 μm in length, and had radii of 5, 3 and 2 μm, respectively. The total volume of this model is 7·9 pl. We assume that Ca2+ release from internal stores is not involved in DSI (Lenz et al. 1998), and that there is an endogenous buffer equivalent to 100 μM BAPTA. For long steps, Ca2+ transporters would have to be taken into account, but as a first approximation we have neglected them. We assume that [Ca2+]i is then expressed by:
where [Ca2+]T is the total [Ca2+] (bound and free), Kb is the binding constant of Ca2+ to BAPTA (5 × 10⁶), and the function H =Kb([BAPTA]T - [Ca2+]T) - 1 (cf. Peng & Zucker, 1993).
Maximal DSI and the voltage-step duration to elicit half-maximal DSI (ET50) were determined from the computer-generated equations of the log time-response curves (e.g. Fig. 1A). Here, ‘Maximal DSI’ refers to the asymptotic, largest suppression of IPSC amplitudes obtained with increases in voltage-step duration. ‘Peak DSI’ refers to the greatest percentage reduction in IPSC amplitudes observed in a given condition. For descriptive purposes, the correlation coefficients, r values, of the fits of the means of the data points are given.
Figure 1. Dependence of DSI on duration of postsynaptic depolarization and intracellular [BAPTA].
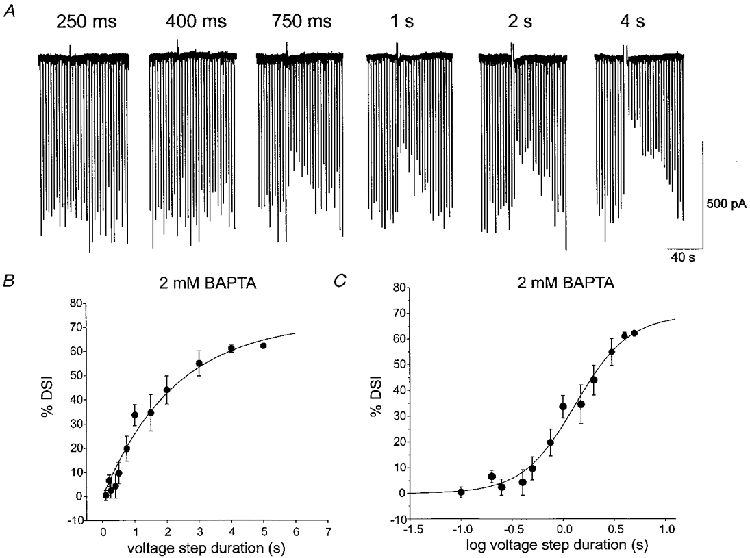
In all figures, downward deflections are evoked monosynaptic IPSCs recorded under whole-cell voltage clamp in CA1 pyramidal cells. High pipette [Cl−] causes IPSCs to appear as inward currents. Ionotropic glutamate receptors have been blocked by 20 μM CNQX and 50 μM APV. DSI is represented by the reduction in IPSC amplitudes that follows depolarizing voltage steps (upward deflections). A, DSI was evoked with depolarizing voltage steps to 0 mV applied to the pyramidal cell. The electrode contained 2 mM [BAPTA]i. The duration of the voltage step was varied from 100 ms to 4 s, and the DSI was measured (see Methods) for each step. Representative responses to voltage steps of various traces are shown. Increasing the voltage-step duration caused a progressive increase in DSI. B, plot of DSI versus the duration of the DSI-inducing step for a group of cells was well fitted by an exponential equation (n = 5, r = 0·983). For each cell the mean DSI for a given step duration was obtained from at least two trials. Each data point is the mean of values obtained from the cells. C, a semilog plot of the group data was sigmoidal in form. Time to half-maximal DSI (ET50), 1·37 s, was estimated from the fitted line.
RESULTS
With 2 mM [BAPTA]i in the whole-cell recording pipette (see Methods), brief voltage steps (100–250 ms) to 0 mV from the holding potential of −70 mV did not induce DSI in CA1 pyramidal cells, but longer steps elicited progressively greater DSI (Fig. 1A) (cf. Ohno-Shosaku et al. 1998). A plot of DSI versus voltage-step duration was well fitted by the equation:
where ts is the step duration and τ is the time constant. A plot of DSI versus the logarithm of the voltage-step duration was well fitted by a sigmoidal function:
where t is log voltage-step duration, to is a slope factor and τ is the time constant. Peak DSI was 58·6 ± 3·4% (all values are given as means ±s.e.m.). The voltage-step duration (interpolated from the sigmoidal functions) that produced half-maximal DSI (ET50) was 1·37 s (n = 5).
As such high [BAPTA]i could have affected the [Ca2+]i dynamics and thus DSI, we repeated the experiments using either 500 μM or 100 μM [BAPTA]i, with free [Ca2+]i maintained at a constant level. Lowering [BAPTA]i greatly enhanced the ability of briefer voltage steps to elicit DSI (Figs 2 and 3). With 500 μM [BAPTA]i, the ET50 for DSI was 406 ms, and with 100 μM [BAPTA]i it was 186 ms. In the latter case, detectable DSI could be elicited with voltage steps as short as 25 ms. Despite the large effects on ET50, however, no change was apparent in peak DSI calculated from the raw data for each cell (which was 60·6 ± 2·7%, n = 5, with 500 μM [BAPTA]i and 53·6 ± 4·4%, n = 4, with 100 μM [BAPTA]i) among the three [BAPTA]i conditions.
Figure 2. Lowering the intracellular [BAPTA] enhances DSI induced with short voltage steps.
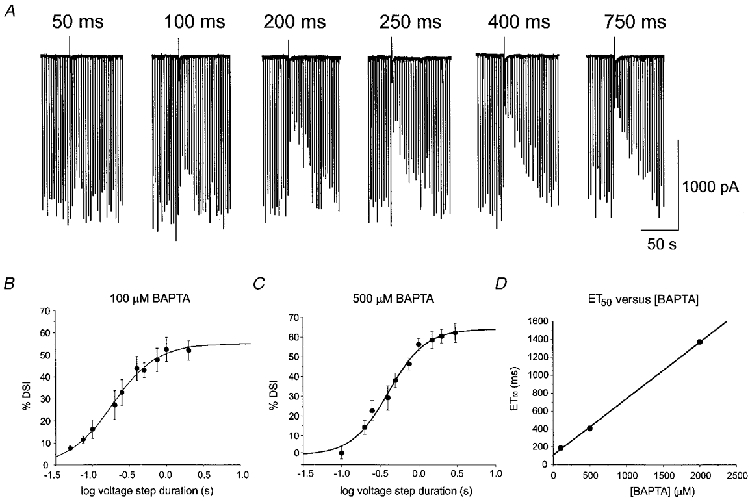
A, DSI was elicited with voltage steps to 0 mV of various durations in a cell containing 100 μM BAPTA. Voltage steps as short as 50 ms elicited some DSI (left-hand trace), and long depolarizations produced greater DSI. B, grouped data from 4 cells filled with 100 μM BAPTA showing DSI as a function of the log of the duration of the DSI-inducing step. The means of this relationship were well fitted by a sigmoidal relation with an ET50 of 186 ms. C, grouped data from 6 cells filled with 500 μM BAPTA (50 μM Ca2+), fitted with a sigmoidal function with an ET50 of 406 ms. D, plot of the ET50 for DSI versus the [BAPTA]i. The ET50 values were obtained from the sigmoidal fits of the data shown in Fig. 1C and Fig. 2B and C. The plot gives a linear relation that intersects the y-axis at 109·3 ms (i.e. ET50= 0·77 [BAPTA]i+ 109·3). This provides an estimate of the ET50 for DSI evoked with no exogenous BAPTA.
Figure 3. DSI is linearly related to voltage-step duration and total Ca2+ influx.
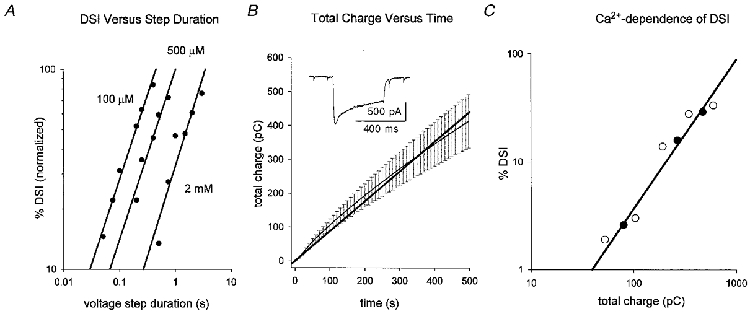
A, normalized DSI (maximal DSI = 100%) is plotted versus voltage-step duration on a double logarithmic axis. The graph represents the grouped data from cells with the indicated [BAPTA]i (n = 4, 6 and 5 for 100 μM, 500 μM and 2 mM BAPTA, respectively), so each data point represents the mean DSI from several cells for a given postsynaptic depolarization. Only those voltage steps that elicited submaximal DSI were plotted; error bars omitted for clarity. The slopes in all cases were near 1·0 (see text). B, a plot of total charge versus duration of postsynaptic depolarization. Cd2+-subtracted Ca2+ currents elicited by voltage steps to 0 mV were integrated over time for 5 cells with 500 μM BAPTA. The mean total Ca2+ influx (±s.e.m.) was plotted (at 10 ms intervals) versus voltage-step duration, which gave a nearly linear relation over the 500 ms period. The mean data from 5 cells are plotted as the thin black line. A linear regression line through the means is displayed as the thick black line. The graph shows that to a first approximation Ca2+ influx calculated as the current integral is reasonably well fitted by a linear function. The inset shows a sample Ca2+ current from one of the cells used. Scale bar 500 pA, 400 ms. C, data from one cell with 100 μM [BAPTA]i where DSI is plotted versus total Ca2+ influx. Calcium influx was varied first by changing the duration of the postsynaptic depolarization in control solution, i.e. 2·5 mM [Ca2+]o (•) and then again after increasing [Ca2+]o to 5 mM (○). Total Ca2+ influx was obtained by integrating the Cd2+-subtracted currents for each step. The results are typical of 3 experiments like this. The mean slope of the relation between DSI and Ca2+ influx was 1·3 (n = 3).
Relatively long depolarizations may be necessary to elicit DSI in the absence of exogenous Ca2+ buffers
To estimate the ET50 for DSI in the absence of exogenous Ca2+ buffer, ET50 values (obtained from Figs 1C, 2B and 2C) were plotted against [BAPTA]i, and the linear regression line was extrapolated to zero [BAPTA]i (Fig. 2A). This gave an estimated ET50 for DSI of 109 ms in the absence of exogenous buffer.
DSI is linearly related to total postsynaptic Ca2+ influx
We examined DSI as a function of voltage-step duration for the dynamic range (∼15-80% of maximum) of the step duration-response curves (Fig. 3A). Double logarithmic plots revealed slopes of 0·84 for 100 μM BAPTA (n = 4), 0·85 for 500 μM BAPTA (n = 6) and 0·90 for 2 mM BAPTA (n = 5). Thus, log DSI was linearly related (with a slope near 1) to log voltage-step duration, and this suggested that DSI might be linearly related to total Ca2+ influx.
We integrated Cd2+-subtracted Ca2+ currents elicited by voltage steps from −70 mV to 0 mV in 5 cells containing 500 μM [BAPTA]i and plotted the calculated values of total Ca2+ influx versus voltage-step duration. The relationship was reasonably linear over the range 75–500 ms (Fig. 3A), in agreement with measurements of [Ca2+]i produced by the same range of voltage-step durations (Thayer & Miller, 1990). Hence it is plausible that the linearity shown in Fig. 3A reflects a reasonably linear increase in Ca2+ influx.
In a different group of cells, we calculated both the total charge transfer by Cd2+-subtracted Ca2+ currents evoked by a variety of voltage steps and the DSI induced by the same steps. The log-log plot of DSI versus total Ca2+ influx was also linear with a slope of 1·31 ± 0·03 (e.g. Fig. 3A, filled circles). When [Ca2+]o was subsequently increased to 5 mM in the same cells (n = 3), the DSI elicited by a given voltage step increased (as reported by Lenz et al. 1998); however, the slope of the log-log relationship between calculated Ca2+ influx and DSI remained ∼1·3 (e.g. open circles in Fig. 3A). DSI appears to depend linearly on total Ca2+ influx regardless of the method used to increase influx.
Despite lowering [BAPTA]i and increasing [Ca2+]o, we were unable to elicit DSI with voltage-step durations shorter than ∼25 ms, suggesting that DSI requires a threshold level of [Ca2+]i that is reached during prolonged Ca2+ influx. From total Ca2+ influx we calculated that a minimum of 79 ± 24 pC of charge, corresponding to ∼25 × 107 calcium ions, was required to produce just detectable (∼5%) DSI in cells containing 100 μM [BAPTA]i (n = 4).
BAPTA and EGTA affect DSI similarly
The results thus far suggest that DSI may be related to a rise in cytoplasmic [Ca2+]i. Thus the Ca2+-sensing apparatus may be located at a distance from voltage-dependent Ca2+ channels. To test this hypothesis, we performed experiments with EGTA instead of BAPTA. The affinities of EGTA and BAPTA for Ca2+ are very similar, but the kinetics (on-rate and off-rate) of BAPTA are > 100-fold faster than those of EGTA (Tsien, 1980). If the DSI Ca2+ sensor were close to the point of Ca2+ entry, then EGTA would be less effective than BAPTA at reducing DSI (Adler et al. 1991; Stern, 1992), and the ET50 for DSI would be of shorter duration with EGTA than with BAPTA. On the contrary, the ET50 values defined by grouped and fitted data for DSI with 500 μM and 100 μM [EGTA]i were 548 ms (n = 5) and 266 ms (n = 3), respectively (i.e. comparable to results with BAPTA). In order to compare the results for EGTA and BAPTA quantitatively, we also determined the ET50 for each cell individually. For 100 μM EGTA the ET50 was 248·7 ± 43·9 ms (n = 3) and for 100 μM BAPTA, 200·8 ± 26·8 ms (n = 4). For 500 μM EGTA the ET50 was 456·8 ± 77·2 ms (n = 5) and for 500 μM BAPTA, 441·0 ± 85·9 ms (n = 6). There is no statistical difference between the data for EGTA and those for BAPTA at any given concentration.
Peak DSI was the same with [EGTA]i (52·4 ± 6·3% in 500 μM and 59·6 ± 8·9%, n = 3, in 100 μM [EGTA]i) as it was with BAPTA. At 10 mM, the two buffers were equally effective in blocking DSI, peak DSI being 9·6 ± 7·7% (n = 5) with EGTA and 2·7 ± 1·1% with BAPTA (n = 3, the difference was not significant, P > 0·5). The data support the inference that the effects of Ca2+ buffers on DSI did not depend on buffer kinetics, and thus support the inference that DSI induction depends on a rise in [Ca2+] at a distance from the site of Ca2+ influx.
Carbachol application can overcome DSI block by EGTA but not by BAPTA
Although DSI is dependent on voltage-dependent Ca2+ influx, and Ca2+ enters pyramidal cells through multiple types of VDCC, DSI elicited by our standard protocol is only blocked by ω-conotoxin GVIA (Lenz et al. 1998). Hence, DSI may be triggered preferentially by Ca2+ influx through postsynaptic N-type Ca2+ channels. The expectation, when release is coupled to Ca2+ influx through a particular channel, would be that BAPTA, with its faster binding kinetics, would be significantly more effective in blocking release than EGTA (Stern, 1992). Apparent equivalence of EGTA and BAPTA in inhibiting DSI induction thus presented a puzzle, and we wanted to know if a difference between EGTA and BAPTA could be revealed under any conditions. Carbachol, acting through a muscarinic receptor (Pitler & Alger, 1992, 1994; Martin & Alger, 1999) markedly increases DSI of spontaneous IPSCs, as well as Ca2+ influx into cells (Reynolds & Miller, 1989; Tsubokawa & Ross, 1997). We therefore recorded from cells with solutions containing either 10 mM EGTA or 10 mM BAPTA, and, after establishing that DSI was blocked, we bath-applied 6 μM carbachol. As is shown in the example of Fig. 4, increasing the intensity of extracellular stimulation to increase IPSCs or broadening the duration of the DSI-inducing voltage step did not induce DSI prior to carbachol application. However, robust DSI appeared in EGTA-containing cells after applying carbachol. In all four cells loaded with 10 mM EGTA, a substantial degree of DSI developed (2·1 ± 2·0% in control increased to 51·9 ± 6·0% in carbachol, P < 0·005, n = 4). In contrast, in cells loaded with 10 mM BAPTA, a modest (34%) degree of DSI appeared in only one cell, and carbachol had statistically insignificant effects on the group (2·7 ± 1·1% in control, 19·2 ± 7·9% in carbachol, P = 0·14, n = 3). The difference in efficacy between EGTA and BAPTA in this case confirms that, whatever the exact nature of the action of carbachol, it is Ca2+ dependent. The possible significance of this effect is considered in Discussion.
Figure 4. Carbachol enhances DSI in cells filled with 10 mM EGTA. Representative data from one cell.
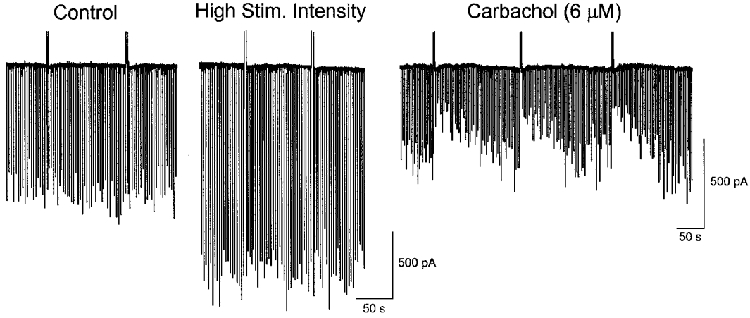
The cell contained 10 mM EGTA, and virtually no DSI was present in control (left trace, mean IPSC reduction over three trials during the DSI period, 7·2%). Increasing extracellular stimulus intensity to increase IPSCs, and prolonging the DSI step, did not induce DSI (middle trace). IPSC amplitudes were reduced by 6 μM carbachol; however, the same stimulus conditions as in the middle trace resulted in robust DSI in the presence of carbachol (right trace, 56·4% IPSC reduction, mean of three consecutive trials). Note difference in time base in the right trace.
Time course of DSI is not tightly coupled to the dynamics of [Ca2+]i
When elicited by voltage steps ≤1 s in duration, DSI often does not reach its peak value for several seconds (Llano et al. 1991; Pitler & Alger, 1994). However, 2 mM BAPTA could slow the rise in [Ca2+]i (Sala & Hernandez-Cruz, 1990) and hence the time-to-peak DSI. In this case, reducing [BAPTA]i by 20-fold should reduce the time-to-peak DSI. Because IPSCs were evoked at low frequency (0·33 Hz), it was not possible to quantify precisely the time-to-peak DSI. Nevertheless, peak DSI occurred at the second IPSC in the DSI period whether 100 μM or 2 mM [BAPTA]i was used, as is clear from examination of the group data in Fig. 5B. Hence, within the limits of detectability in these experiments, the time-to-peak DSI was insensitive to changes in [BAPTA]i, although clearly this issue requires further investigation.
Figure 5. The duration of DSI is not affected by changes in intracellular Ca2+ buffering.
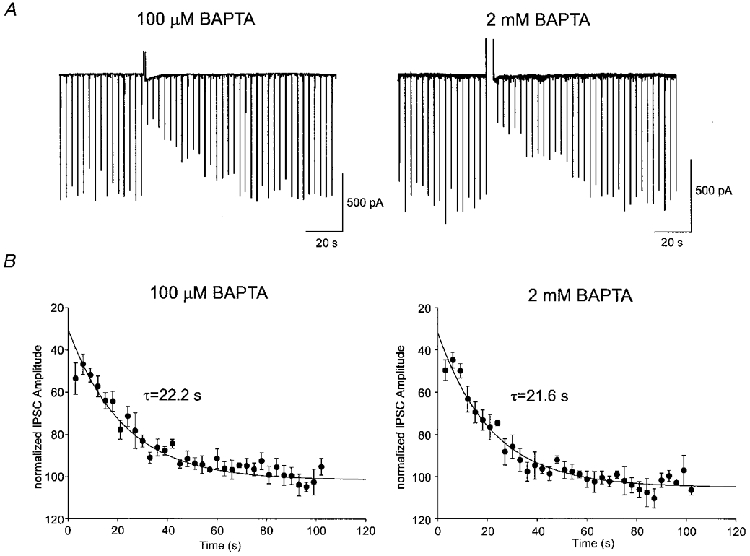
A, the left-hand trace is an example of a single DSI trial in a cell recorded with 100 μM [BAPTA]i. DSI was evoked by a 400 ms step in this cell. The IPSCs returned to control values over several tens of seconds following the DSI-inducing step. In another cell recorded with 2 mM [BAPTA]i (right trace), DSI was induced by a 3 s depolarization, which elicited peak DSI similar to that observed in the left trace. Notice the similar time course of recovery of the IPSCs back to control levels following the DSI-inducing step. B, the time course of the decay of DSI was well fitted by exponential functions. The time constant for decay (τdecay) of DSI with 100 μM [BAPTA]i (22·2 s, n = 4) was not different from the τdecay in cells with 2 mM [BAPTA]i (21·6 s, n = 5, P > 0·1). For these experiments we chose DSI trials showing similar peak DSI. To achieve this we gave 100–400 ms depolarizing steps to cells containing 100 μM [BAPTA]i and 1–4 s steps to cells containing 2 mM [BAPTA]i. The extrapolated DSI at time 0 for the 100 μM BAPTA condition was 71·3%, and was 72·9% for the 2 mM BAPTA condition. Because DSI was not maximal until the second IPSC following the depolarizing step, the first IPSC was ignored when fitting the data.
A striking feature of DSI is its prolonged duration, i.e. typically 40–60 s (Llano et al. 1991; Pitler & Alger, 1994) at 30°C. A Ca2+ buffer can prolong the time that [Ca2+]i remains elevated, because bound Ca2+ cannot be removed from the cytosol by Ca2+-clearing processes and yet can continue to produce effects as it gradually unbinds from the buffer (Sala & Hernandez-Cruz, 1990). To address the possibility that a prolonged Ca2+ transient might underlie the duration of DSI, we measured the time course of decay of DSI in cells recorded with 100 μM or 2 mM [BAPTA]i. To obtain similar peak DSI levels, we applied 100 to 400 ms-long steps in the former case, and 1 to 3 s steps in the latter. Peak DSI was 46·8 ± 4·8% with 100 μM and 44·8 ± 3·7% (P > 0·7) with 2 mM [BAPTA]i. The decay of DSI from its peak was well fitted by the exponential equation:
(Fig. 5A). The first IPSC after the DSI-inducing step was ignored when fitting the curve because DSI had not reached its peak value by then. The time constant of decay of DSI was 22·2 s (n = 4) with 100 μM [BAPTA]i and 21·6 s (n = 5) with 2 mM [BAPTA]i (difference not significant, P > 0·8).
EGTA will release Ca2+ over a longer period of time because of its slower Ca2+-binding and -unbinding kinetics, and thereby delay the return of free [Ca2+]i to resting levels following an increase. However, [EGTA]i did not alter the time course of DSI, which decayed with a time constant of 19·6 ms in 2 mM EGTA (n = 5, P > 0·05, data not shown). The similar DSI decay time constants with EGTA and with different concentrations of BAPTA suggest that the duration of DSI was not determined by the kinetics of the [Ca2+]i transient.
DISCUSSION
At some fast synapses, low concentrations of exogenous Ca2+ buffers applied to the presynaptic terminal have little effect on the secretory response (Adler et al. 1991), in agreement with the Ca2+ microdomain hypothesis (Llinas et al. 1992). Release at these synapses is triggered by a bolus of Ca2+ (hundreds of micromolar) that acts locally (within tens of nanometres) on a low-affinity Ca2+ sensor (Adler et al. 1991; Llinas et al. 1992). Synaptic transmission occurs within a few hundred microseconds after a preterminal action potential, and the secretory response terminates upon dissipation of Ca2+ microdomains. At other synapses release is affected by low millimolar concentrations of Ca2+ chelators, but BAPTA is more efficacious than EGTA in inhibiting release, which is compatible with the requirement for a high local Ca2+ concentration, and focal site of release at these synapses (von Gersdorff & Matthews, 1994, 1996; Mennerick & Matthews, 1996). At the calyx of Held, release is reduced by low [BAPTA]i or [EGTA]i (Borst et al. 1995; Borst & Sakmann, 1996); however, it is activated by a 1 ms-long pulse of Ca2+ and is proportional to the 4th power of Ca2+ influx. Therefore, while the details of its Ca2+ dependence are not yet clear, the calyx resembles a conventional fast synapse. In contrast, chemical release at peptidergic nerve terminals (Peng & Zucker, 1993; Seward et al. 1995) and chromaffin cells (Neher & Zucker, 1993; Chow et al. 1994; Engisch & Nowycky, 1996; Seward & Nowycky, 1996) may have fast and slow phases. The slow phase is elicited by repetitive action potentials or prolonged depolarizations. There is often a ‘threshold’ level of [Ca2+]i needed for the slow phase, and a nearly linear dependence of release on total [Ca2+]i. Release from these cells is sensitive to low concentrations of EGTA and BAPTA.
DSI differs from fast synaptic neurotransmission: (1) DSI induction is sensitive to low concentrations of exogenous Ca2+ buffers. (2) The ET50 for DSI is linearly dependent on [BAPTA]i and is ∼100 ms, even in the absence of BAPTA. (3) EGTA and BAPTA were equipotent in blocking DSI. (4) DSI is linearly dependent on calculated total Ca2+ influx. (5) The time course of DSI is not tightly coupled to [Ca2+]i dynamics. In summary, DSI resembles the process of secretion of hormones or peptides more closely than it does fast synaptic transmission. This conclusion fits with the lack of evidence for true synaptic contacts made by pyramidal cell dendrites onto interneurons.
Reductions in [Ca2+ buffer]i, with essentially constant baseline [Ca2+]i, greatly enhanced the ability of short-duration voltage steps to induce DSI. The marked effects of exogenous buffers on DSI imply that the endogenous Ca2+-buffering power of pyramidal cells must be low, perhaps functionally equivalent to < 100 μM BAPTA (cf. Zhou & Neher, 1993). The magnitude of DSI was constant for a given voltage-step duration in a given cell over time, suggesting that there was no significant washout of endogenous buffers during the experiments. The requirement for long-duration voltage steps to induce a DSI-like phenomenon in tissue-cultured hippocampal neurons (Ohno-Shosaku et al. 1998) may be related to the high intracellular buffer concentration (5 mM EGTA) used in those experiments. High concentrations of BAPTA (> 30 mM) are needed to block DSI in cerebellar Purkinje cells (Llano et al. 1991; Vincent & Marty, 1993), reflecting differences in endogenous Ca2+-buffering properties and size between these cells and CA1 pyramidal cells.
We estimated an ET50 of ∼100 ms for DSI in the absence of exogenous buffers. With 100 μM [BAPTA]i, DSI required a minimal step duration of ∼25 ms. This is markedly longer than the ∼1 ms duration depolarization required for synaptic neurotransmitter release, but quantitatively similar to the thresholds found for hormone and peptide release (cf. Peng & Zucker, 1993). In neurohypophyseal nerve terminals (Seward et al. 1995), the threshold for release is estimated at 4–6 × 10⁷ calcium ions, and in bovine chromaffin cells it is ∼10 × 107 calcium ions (Seward & Nowycky, 1996) for the slow release phase. Given the larger size of the pyramidal cells, this is comparable to our estimate of 25 × 107 calcium ions for DSI threshold. DSI is unaffected by the Ca2+-ATPase inhibitor, cyclopiazonic acid (40 μM) (Lenz et al. 1998), which quickly depletes intracellular stores of Ca2+ (Garaschuk et al. 1997), suggesting that stored Ca2+ does not play a role in DSI, and that voltage-dependent Ca2+ influx is sufficient for its initiation.
Release processes dependent on third or higher order powers of [Ca2+] are thought to require the co-operative actions of multiple Ca2+ ions at a given site (Dodge & Rahamimoff, 1967). Different models have been offered to explain linear dependence of release processes on Ca2+ influx (Seward et al. 1995; Engisch & Nowycky, 1996; Seward & Nowycky, 1996). One interpretation of the linear dependence of the ET50 on [BAPTA]i would be that the Ca2+ buffer must first be saturated at some site before free Ca2+ is available to initiate DSI, and thereafter DSI would be directly proportional to [Ca2+]. This could explain our observation that [Ca2+ buffer]i determined the degree of DSI induced by a given Ca2+ influx. The putative site would be sufficiently distant from the point of Ca2+ influx for EGTA and BAPTA to be equally effective. To determine if buffer saturation by our experimental procedures is possible, we used a simple model of a CA1 pyramidal cell; total volume of 8 pl for soma and apical dendrite, where the relevant voltage-dependent Ca2+ channels are located (see references in Lenz et al. 1998), with no Ca2+ release from intracellular stores, or significant Ca2+ extrusion during the step, and with 100 μM total endogenous buffer with Ca2+ affinity comparable to BAPTA. In this model (see Methods), a voltage step of 150 ms would admit sufficient Ca2+ to saturate the BAPTA, and a subsequent increment in [Ca2+]i could then initiate DSI, thus explaining both its threshold and linear dependence on total [Ca2+]i. Note that this is a worst-case calculation, as it shows that the BAPTA throughout this entire cell becomes bound by Ca2+. Thus, even though the details will depend on the exact volume of interest, it is unlikely that all BAPTA molecules in the cell would have to be bound before DSI occurred. Buffer saturation would only be required at the site of DSI initiation. The concept that buffer saturation accounts for the threshold for DSI is also compatible with the independence of properties of DSI from buffer kinetics; i.e. peak DSI and the dependence of DSI on total Ca2+ influx appear to be the same with EGTA or BAPTA.
However, the actual situation must be more complex. Endogenous Ca2+ buffers tend to be of lower affinity but higher capacity than BAPTA (Zhou & Neher, 1993). Moreover, Ca2+ influx through different types of Ca2+ channels is not equally capable of initiating DSI (Lenz et al. 1998). Antagonists of P-, Q-, R-, T- and, under most conditions, L-type channels, do not reduce DSI, despite depressing voltage-dependent Ca2+ influx. Block of DSI by ω-conotoxin GVIA points to a key role for N-type Ca2+ current, and suggests that a bulk rise in [Ca2+]i alone is not sufficient for DSI induction. Moreover, carbachol application revealed a difference between the capabilities of EGTA and BAPTA to block DSI when they were present at 10 mM.
One type of solution to this problem is suggested by the work of Seward & Nowycky (1996) and Seward et al. (1995), who propose a model of peptide release involving two kinetically distinct, Ca2+-dependent steps, one of which involves an increase in global Ca2+ and prepares large dense-core vesicles for release, but does not cause fusion. In the second step, once the vesicles have been prepared, a high concentration of submembrane [Ca2+]i can trigger release. The threshold phase could represent Ca2+-dependent vesicle priming or other Ca2+-dependent factors, such as phosphorylation. In their preparations, BAPTA and EGTA, which had equivalent effects on the threshold phase, had dissimilar effects on the secretory phase of release: BAPTA was more potent than EGTA and suppressed maximal release. In contrast, there was normally no difference between the effects of EGTA and BAPTA on peak DSI. The equivalence of EGTA and BAPTA suggests their effects are independent of their kinetic properties in the absence of carbachol. The Ca2+ on-rate for EGTA is ≥100 times slower than that of BAPTA; Ca2+ can diffuse farther in the presence of EGTA than BAPTA before being bound.
To account for both the ability of ω-conotoxin GVIA to block DSI selectively, and the evidence that DSI depends on a global Ca2+ increase, we suggest that DSI may require a Ca2+-dependent ‘priming’ step and yet depend on N-type Ca2+ current for actual initiation. The Ca2+ sensor for the priming step would be away from, and the Ca2+ sensor for DSI release near to, the N-type Ca2+ channels. EGTA and BAPTA would normally be indistinguishable in blocking DSI because they would be equally effective in blocking the priming step. As the DSI process could not take place without having been primed, the expected greater efficacy of BAPTA versus EGTA in limiting DSI could not be detected. This hypothesis is testable and suggests, for example, that sufficient elevation of [Ca2+]i to induce priming should enhance the ability of a brief N-type current to induce DSI. The size of the zone of buffer saturation would be dependent on buffer concentration and kinetics (Stern, 1992), and hence, under the appropriate conditions, differences between EGTA and BAPTA could appear. Carbachol, which can elevate Ca2+ influx, may enhance the priming step in this way and thus reveal the relatively greater efficacy of BAPTA in blocking DSI. A major caveat is that we do not understand the mechanism by which carbachol enhances DSI, and increasing Ca2+ influx is only one possibility. As an alternative to distinct Ca2+ sensors, it is possible that multiple, kinetically distinct Ca2+-dependent release steps may reflect release from vesicle pools in various states of releasability (Neher, 1998). Our data cannot distinguish between these models, but the similarities between DSI and these slow forms of secretion suggest similar mechanisms may be involved.
The linear relationship between DSI and total Ca2+ influx contrasts with the 3rd or 4th power relationship commonly found at fast synapses (Dodge & Rahamimoff, 1967; Wu & Saggau, 1997). Although voltage-dependent Ca2+ currents cannot be ideally clamped in the slice preparation, the error will be greatest during the rising phase of the currents, and not the plateau phase (i.e. ≥25 ms after the start of the voltage step) to which DSI was most sensitive in these experiments. The linear relationship between DSI and voltage-step duration (Fig. 3A) suggests that the relevant Ca2+ current was under reasonable control. We did not do a pharmacological dissection (cf. Lenz et al. 1998) of Ca2+ current contributions to DSI for the various step durations. Hence we do not know if, as suggested by the data, N-type current is a constant fraction of total Ca2+ current at all durations or if other factors maintain the linear relationship. We propose that the requirement for steps lasting > 25 ms could reflect the time required for [Ca2+]i to reach a threshold rather than a truly time-dependent step, as raising [Ca2+]o permitted shorter steps to induce greater DSI and yet the linear relationship between DSI and calculated Ca2+ influx was maintained. The observation that this relationship remained linear despite increases in [Ca2+]o also argues against microdomain models, inasmuch as [Ca2+] in the microdomain is expected to change as a function of [Ca2+]o. The large and long-lasting dendritic Ca2+ spikes observed in hippocampal cells (Wong & Prince, 1978) may be ideally suited to initiating DSI (cf. Le Beau & Alger, 1998).
The decay of DSI was insensitive to [BAPTA]i or [EGTA]i, suggesting it is not determined by the time course of the elevation of [Ca2+]i. This agrees with measurements of [Ca2+]i. For example, Regehr & Tank (1992) observed that [Ca2+]i returned to resting levels following its increase by a 500 ms-long train of synaptic stimulation with a time constant of ∼6 s, with 300–600 μM fura-2 in the cells. Similar results were obtained by applying depolarizing voltage steps to CA1 pyramidal cell somata (Jaffe et al. 1994). Decreasing the fura-2 concentration to 100 μM decreased the [Ca2+]i decay time constant to ∼2·5 s (Regehr & Tank, 1992). Thus the time course of [Ca2+]i decay would be too fast to account for the duration of DSI (τ∼20 s) and would not explain the independence of the DSI decay constant from [Ca2+ buffer]i. If DSI expression is mediated by presynaptic metabotropic glutamate receptors (Glitsch et al. 1996; Morishita et al. 1998; Morishita & Alger, 1999), then the slow course of DSI may reflect the operation of downstream effectors of these receptors.
Membrane-bound compartments in the somatic-dendritic regions of hippocampal cells in culture can take up the dye FM1-43 and release it, from these regions, in a Ca2+-dependent way (Maletic-Savatic & Malinow, 1998). Perhaps the Ca2+ dependence of DSI is related to this novel form of non-synaptic release.
Acknowledgments
This work was submitted in partial fulfillment of the PhD requirements of R. A. Lenz. We thank T. Abrams, J. Kao, and S. Thompson and members of our laboratory for their comments on a draft of the manuscript. We thank E. Elizabeth for expert typing and editorial assistance. This work was supported by USPHS grant NS 30219 to B.E.A.
References
- Adler EM, Augustine GJ, Duffy SN, Charlton MP. Alien intracellular calcium chelators attenuate neurotransmitter release at the squid giant synapse. Journal of Neuroscience. 1991;11:1496–1507. doi: 10.1523/JNEUROSCI.11-06-01496.1991. [DOI] [PMC free article] [PubMed] [Google Scholar]
- Alger BE, Pitler TA. Retrograde signaling at GABAA-receptor synapses in the mammalian CNS. Trends in Neurosciences. 1995;18:333–340. doi: 10.1016/0166-2236(95)93923-l. [DOI] [PubMed] [Google Scholar]
- Alger BE, Pitler TA, Wagner JJ, Martin LA, Morishita W, Kirov SA, Lenz RA. Retrograde signalling in depolarization-induced suppression of inhibition in rat hippocampal CA1 cells. The Journal of Physiology. 1996;496:197–209. doi: 10.1113/jphysiol.1996.sp021677. [DOI] [PMC free article] [PubMed] [Google Scholar]
- Blanton MG, Lo Turco JJ, Kriegstein AR. Whole cell recording from neurons in slices of reptilian and mammalian cerebral cortex. Journal of Neuroscience Methods. 1989;30:203–210. doi: 10.1016/0165-0270(89)90131-3. [DOI] [PubMed] [Google Scholar]
- Borst JGG, Helmchen F, Sakmann B. Pre- and postsynaptic whole-cell recordings in the medial nucleus of the trapezoid body of the rat. The Journal of Physiology. 1995;489:825–840. doi: 10.1113/jphysiol.1995.sp021095. [DOI] [PMC free article] [PubMed] [Google Scholar]
- Borst JGG, Sakmann B. Calcium influx and transmitter release in a fast CNS synapse. Nature. 1996;383:431–434. doi: 10.1038/383431a0. [DOI] [PubMed] [Google Scholar]
- Cheramy A, Leviel V, Glowinski J. Dendritic release of dopamine in the substantia nigra. Nature. 1981;289:537–542. doi: 10.1038/289537a0. [DOI] [PubMed] [Google Scholar]
- Chow RH, Klingauf J, Neher E. Time course of Ca2+ concentration triggering exocytosis in neuroendocrine cells. Proceedings of the National Academy of Sciences of the USA. 1994;91:12765–12769. doi: 10.1073/pnas.91.26.12765. [DOI] [PMC free article] [PubMed] [Google Scholar]
- Dawson TM, Snyder SH. Gases as biological messengers: nitric oxide and carbon monoxide in the brain. Journal of Neuroscience. 1994;14:5147–5159. doi: 10.1523/JNEUROSCI.14-09-05147.1994. [DOI] [PMC free article] [PubMed] [Google Scholar]
- Dodge FA, Jr, Rahamimoff R. Co-operative action of calcium ions in transmitter release at the neuromuscular junction. The Journal of Physiology. 1967;193:419–432. doi: 10.1113/jphysiol.1967.sp008367. [DOI] [PMC free article] [PubMed] [Google Scholar]
- Drake CT, Terman GW, Simmons ML, Milner TA, Kunkel DD, Schwartzkroin PA, Chavkin C. Dynorphin opioids present in dentate granule cells may function as retrograde inhibitory neurotransmitters. Journal of Neuroscience. 1994;14:3736–3750. doi: 10.1523/JNEUROSCI.14-06-03736.1994. [DOI] [PMC free article] [PubMed] [Google Scholar]
- Engisch KL, Nowycky MC. Calcium dependence of large dense-cored vesicle exocytosis evoked by calcium influx in bovine adrenal chromaffin cells. Journal of Neuroscience. 1996;16:1359–1369. doi: 10.1523/JNEUROSCI.16-04-01359.1996. [DOI] [PMC free article] [PubMed] [Google Scholar]
- Garaschuk O, Yaari Y, Konnerth A. Release and sequestration of calcium by ryanodine-sensitive stores in rat hippocampal neurones. The Journal of Physiology. 1997;502:13–30. doi: 10.1111/j.1469-7793.1997.013bl.x. [DOI] [PMC free article] [PubMed] [Google Scholar]
- Glitsch M, Llano I, Marty A. Glutamate as a candidate retrograde messenger at interneurone-Purkinje cell synapses of rat cerebellum. The Journal of Physiology. 1996;497:531–537. doi: 10.1113/jphysiol.1996.sp021786. [DOI] [PMC free article] [PubMed] [Google Scholar]
- Jaffe DB, Ross WN, Lisman JE, Lasser-Ross N, Miyakawa H, Johnston D. A model for dendritic Ca2+ accumulation in hippocampal pyramidal neurons based on fluorescence imaging measurements. Journal of Neurophysiology. 1994;71:1065–1077. doi: 10.1152/jn.1994.71.3.1065. [DOI] [PubMed] [Google Scholar]
- Jaffe EH, Marty A, Schulte A, Chow RH. Extrasynaptic vesicular transmitter release from the somata of substantia nigra neurons in rat midbrain slices. Journal of Neuroscience. 1998;18:3548–3553. doi: 10.1523/JNEUROSCI.18-10-03548.1998. [DOI] [PMC free article] [PubMed] [Google Scholar]
- Kombian SB, Mouginot D, Pittman QJ. Dendritically released peptides act as retrograde modulators of afferent excitation in the supraoptic nucleus in vitro. Neuron. 1997;19:903–912. doi: 10.1016/s0896-6273(00)80971-x. [DOI] [PubMed] [Google Scholar]
- Le Beau FEN, Alger BE. Transient suppression of GABAA-receptor-mediated IPSPs after epileptiform burst discharges in CA1 pyramidal cells. Journal of Neurophysiology. 1998;79:659–669. doi: 10.1152/jn.1998.79.2.659. [DOI] [PubMed] [Google Scholar]
- Lenz RA, Wagner JJ, Alger BE. N- and L-type calcium channel involvement in depolarization-induced suppression of inhibition in rat hippocampal CA1 cells. The Journal of Physiology. 1998;512:61–73. doi: 10.1111/j.1469-7793.1998.061bf.x. [DOI] [PMC free article] [PubMed] [Google Scholar]
- Llano I, Leresche N, Marty A. Calcium entry increases the sensitivity of cerebellar Purkinje cells to applied GABA and decreases inhibitory synaptic currents. Neuron. 1991;6:565–574. doi: 10.1016/0896-6273(91)90059-9. [DOI] [PubMed] [Google Scholar]
- Llinas R, Sugimori M, Silver RB. Microdomains of high calcium concentration in a presynaptic terminal. Science. 1992;256:677–679. doi: 10.1126/science.1350109. [DOI] [PubMed] [Google Scholar]
- Maletic-Savatic M, Malinow R. Calcium-evoked dendritic exocytosis in cultured hippocampal neurons. Part I: Trans-Golgi network-derived organelles undergo regulated exocytosis. Journal of Neuroscience. 1998;18:6803–6813. doi: 10.1523/JNEUROSCI.18-17-06803.1998. [DOI] [PMC free article] [PubMed] [Google Scholar]
- Martin LA, Alger BE. Muscarinic facilitation of the occurrence of depolarization-induced suppression of inhibition in rat hippocampus. Neuroscience. 1999;92:61–71. doi: 10.1016/s0306-4522(98)00745-3. [DOI] [PubMed] [Google Scholar]
- Mennerick S, Matthews G. Ultrafast exocytosis elicited by calcium current in synaptic terminals of retinal bipolar neurons. Neuron. 1996;17:1241–1249. doi: 10.1016/s0896-6273(00)80254-8. [DOI] [PubMed] [Google Scholar]
- Morishita W, Alger BE. Sr2+ supports depolarization-induced suppression of inhibition and provides new evidence for a presynaptic expression mechanism in rat hippocampal slices. The Journal of Physiology. 1997;505:307–317. doi: 10.1111/j.1469-7793.1997.307bb.x. [DOI] [PMC free article] [PubMed] [Google Scholar]
- Morishita W, Alger BE. Evidence for endogenous excitatory amino acids as mediators in DSI of GABAAergic transmission in hippocampal CA1. Journal of Neurophysiology. 1999. in the Press. [DOI] [PubMed]
- Morishita W, Kirov SA, Alger BE. Evidence for metabotropic glutamate receptor activation in the induction of depolarization-induced suppression of inhibition in hippocampal CA1. Journal of Neuroscience. 1998;18:4870–4882. doi: 10.1523/JNEUROSCI.18-13-04870.1998. [DOI] [PMC free article] [PubMed] [Google Scholar]
- Neher E. Vesicle pools and Ca2+ microdomains: new tools for understanding their roles in neurotransmitter release. Neuron. 1998;20:389–399. doi: 10.1016/s0896-6273(00)80983-6. [DOI] [PubMed] [Google Scholar]
- Neher E, Zucker RS. Multiple calcium-dependent processes related to secretion in bovine chromaffin cells. Neuron. 1993;10:21–30. doi: 10.1016/0896-6273(93)90238-m. [DOI] [PubMed] [Google Scholar]
- Nicoll RA, Alger BE. A simple chamber for recording from submerged brain slices. Journal of Neuroscience Methods. 1981;4:153–156. doi: 10.1016/0165-0270(81)90049-2. [DOI] [PubMed] [Google Scholar]
- Ohno-Shosaku T, Sawada S, Yamamoto C. Properties of depolarization-induced suppression of inhibitory transmission in cultured rat hippocampal neurons. Pflügers Archiv. 1998;435:273–279. doi: 10.1007/s004240050512. [DOI] [PubMed] [Google Scholar]
- Peng Y-Y, Zucker RS. Release of LHRH is linearly related to the time integral of presynaptic Ca2+ elevation above a threshold level in bullfrog sympathetic ganglia. Neuron. 1993;10:465–473. doi: 10.1016/0896-6273(93)90334-n. [DOI] [PubMed] [Google Scholar]
- Pitler TA, Alger BE. Postsynaptic spike firing reduces synaptic GABAA responses in hippocampal pyramidal cells. Journal of Neuroscience. 1992;12:4122–4132. doi: 10.1523/JNEUROSCI.12-10-04122.1992. [DOI] [PMC free article] [PubMed] [Google Scholar]
- Pitler TA, Alger BE. Depolarization-induced suppression of GABAergic inhibition in rat hippocampal pyramidal cells: G protein involvement in a presynaptic mechanism. Neuron. 1994;13:1447–1455. doi: 10.1016/0896-6273(94)90430-8. [DOI] [PubMed] [Google Scholar]
- Regehr WG, Tank DW. Calcium concentration dynamics produced by synaptic activation of CA1 hippocampal pyramidal cells. Journal of Neuroscience. 1992;12:4202–4223. doi: 10.1523/JNEUROSCI.12-11-04202.1992. [DOI] [PMC free article] [PubMed] [Google Scholar]
- Reynolds IJ, Miller RJ. Muscarinic agonists cause calcium influx and calcium mobilization in forebrain neurons in vitro. Journal of Neurochemistry. 1989;53:226–233. doi: 10.1111/j.1471-4159.1989.tb07318.x. [DOI] [PubMed] [Google Scholar]
- Sala F, Hernandez-Cruz A. Calcium diffusion modeling in a spherical neuron. Relevance of buffering properties. Biophysical Journal. 1990;57:313–324. doi: 10.1016/S0006-3495(90)82533-9. [DOI] [PMC free article] [PubMed] [Google Scholar]
- Seward EP, Chernevskaya NI, Nowycky MC. Exocytosis in peptidergic nerve terminals exhibits two calcium-sensitive phases during pulsatile calcium entry. Journal of Neuroscience. 1995;15:3390–3399. doi: 10.1523/JNEUROSCI.15-05-03390.1995. [DOI] [PMC free article] [PubMed] [Google Scholar]
- Seward EP, Nowycky MC. Kinetics of stimulus-coupled secretion in dialyzed bovine chromaffin cells in response to trains of depolarizing pulses. Journal of Neuroscience. 1996;16:553–562. doi: 10.1523/JNEUROSCI.16-02-00553.1996. [DOI] [PMC free article] [PubMed] [Google Scholar]
- Stern MD. Buffering of calcium in the vicinity of a channel pore. Cell Calcium. 1992;13:183–192. doi: 10.1016/0143-4160(92)90046-u. [DOI] [PubMed] [Google Scholar]
- Thayer SA, Miller RJ. Regulation of the intracellular free calcium concentration in single rat dorsal root ganglion neurones in vitro. The Journal of Physiology. 1990;425:85–115. doi: 10.1113/jphysiol.1990.sp018094. [DOI] [PMC free article] [PubMed] [Google Scholar]
- Tsien RY. New calcium indicators and buffers with high selectivity against magnesium and protons: design, synthesis, and properties of prototype structures. Biochemistry. 1980;19:2396–2404. doi: 10.1021/bi00552a018. [DOI] [PubMed] [Google Scholar]
- Tsubokawa H, Ross WN. Muscarinic modulation of spike backpropagation in the apical dendrites of hippocampal CA1 pyramidal neurons. Journal of Neuroscience. 1997;17:5782–5791. doi: 10.1523/JNEUROSCI.17-15-05782.1997. [DOI] [PMC free article] [PubMed] [Google Scholar]
- Vincent P, Armstrong CM, Marty A. Inhibitory synaptic currents in rat cerebellar Purkinje cells: modulation by postsynaptic depolarization. The Journal of Physiology. 1992;456:453–471. doi: 10.1113/jphysiol.1992.sp019346. [DOI] [PMC free article] [PubMed] [Google Scholar]
- Vincent P, Marty A. Neighboring cerebellar Purkinje cells communicate via retrograde inhibition of common presynaptic interneurons. Neuron. 1993;11:885–893. doi: 10.1016/0896-6273(93)90118-b. [DOI] [PubMed] [Google Scholar]
- von Gersdorff H, Matthews G. Dynamics of synaptic vesicle fusion and membrane retrieval in synaptic terminals. Nature. 1994;367:735–739. doi: 10.1038/367735a0. [DOI] [PubMed] [Google Scholar]
- von Gersdorff H, Matthews G. Depletion and replenishment of vesicle pools at a ribbon-type synaptic terminal. Journal of Neuroscience. 1997;17:1919–1927. doi: 10.1523/JNEUROSCI.17-06-01919.1997. [DOI] [PMC free article] [PubMed] [Google Scholar]
- Westenbroek RE, Hell JW, Warner C, Dubel SJ, Snutch TP, Catterall WA. Biochemical properties and subcellular distribution of an N-type calcium channel α1 subunit. Neuron. 1992;9:1099–1115. doi: 10.1016/0896-6273(92)90069-p. [DOI] [PubMed] [Google Scholar]
- Wong RKS, Prince DA. Participation of calcium spikes during intrinsic burst firing in hippocampal neurons. Brain Research. 1978;159:385–390. doi: 10.1016/0006-8993(78)90544-9. [DOI] [PubMed] [Google Scholar]
- Wu L-G, Saggau P. Presynaptic inhibition of elicited neurotransmitter release. Trends in Neurosciences. 1997;20:204–212. doi: 10.1016/s0166-2236(96)01015-6. [DOI] [PubMed] [Google Scholar]
- Zhou Z, Neher E. Mobile and immobile calcium buffers in bovine adrenal chromaffin cells. The Journal of Physiology. 1993;469:245–273. doi: 10.1113/jphysiol.1993.sp019813. [DOI] [PMC free article] [PubMed] [Google Scholar]