Abstract
We visualized the changes in intracellular Ca2+ concentration ([Ca2+]i), using fluo-3 as an indicator, in individual smooth muscle cells within intact rat tail artery preparations.
On average in about 45 % of the vascular smooth muscle cells we found spontaneous Ca2+ waves and oscillations (≈0.13 Hz), which we refer to here as Ca2+ ripples because the peak amplitude of [Ca2+]i was about one-seventh of that of Ca2+ oscillations evoked by noradrenaline.
We also found another pattern of spontaneous Ca2+ transients often in groups of two to three cells. They were rarely observed and are referred to as Ca2+ flashes because their peak amplitude was nearly twice as large as that in noradrenaline-evoked responses.
Sympathetic nerve activity was not considered responsible for the Ca2+ ripples, and they were abolished by inhibitors of either the Ca2+ pump in the sarcoplasmic reticulum (cyclopiazonic acid) or phospholipase C (U-73122).
Both angiotensin antagonists ([Sar1,Ile8]-angiotensin II and losartan) and an angiotensin converting enzyme inhibitor (captopril) inhibited the Ca2+ ripples.
The extracellular Ca2+-dependent tension borne by unstimulated arterial rings was reduced by the angiotensin antagonist by ≈50 %.
These results indicate that the Ca2+ ripples are generated via inositol 1,4,5-trisphosphate-induced Ca2+ release from the intracellular Ca2+ stores in response to locally produced angiotensin II, which contributes to the maintenance of vascular tone.
Intracellular Ca2+ signals exhibit characteristic spatiotemporal patterns in various cell types and regulate a vast array of cell functions including cell movement, secretion, cell differentiation, cell death, gene expression and synaptic plasticity (Berridge, 1993). In vascular smooth muscle cells, the best known cell function regulated by the intracellular Ca2+ concentration ([Ca2+]i) is contraction, which controls blood pressure. Recent studies indicate that [Ca2+]i may also have a role in cell growth with activation of a phosphorylation cascade via the Ca2+-dependent proline-rich tyrosine kinase (PYK2) (Brinson et al. 1998; Sabri et al. 1998). Vascular smooth muscle cell proliferation is implicated in vascular diseases such as atherosclerosis.
Although Ca2+ signalling mechanisms are often studied in isolated or cultured cells, it is also important to study Ca2+ signals within the context of the organized cell structure of tissues, because there exist intercellular interactions which may not yet be fully understood. With the above idea in mind, we visualized the changes in [Ca2+]i in individual smooth muscle cells within intact vascular wall strips excised from rat tail arteries and loaded with a fluorescent Ca2+ indicator. Our previous studies using confocal microscopy indicated that sympathetic nerve stimulation induces Ca2+ waves and oscillations in individual vascular smooth muscle cells due to release of Ca2+ from intracellular stores (Iino et al. 1994; Kasai et al. 1997). In this study we optimized our imaging system to detect Ca2+ signals with an improved signal-to-noise ratio using wide-field fluorescence microscopy with a high power magnification objective and a cooled charge-coupled device (CCD) camera. Quite unexpectedly, we found Ca2+ waves and oscillations in vascular smooth muscle cells even without extrinsic stimulation. It was notable that these spontaneous Ca2+ oscillations had a much smaller amplitude than those induced by sympathetic or α-adrenergic stimulation. Hence, we refer to these Ca2+ responses as Ca2+ ripples. We further demonstrate that Ca2+ ripples contribute to tension production and are generated by angiotensin II (Ang II) produced locally within the arterial strips by the tissue renin-angiotensin system (RAS) (Peach, 1977; Dzau, 1993; Zimmerman & Dunham, 1997). Thus the new Ca2+ signalling pattern discovered in vascular smooth muscle cells may mediate the regulation of cell functions by the local RAS.
METHODS
Tissue preparation
Male Wistar rats, weighing about 200-300 g (age 8-10 weeks) were anaesthetized with diethyl ether and exsanguinated, as approved by the local ethics committee. Tail arteries (external diameter 600-800 μm) were excised and carefully cut open after cleaning off the surrounding connective tissue to prepare ∼8 mm long strips. The arterial strips were incubated with physiological salt solution (PSS) containing 44.3 μm fluo-3 AM and 0.03 % cremophor EL for ∼2 h at room temperature (20-23°C) (Kasai et al. 1997). After the dye loading, the arterial strip was pinned at the four corners onto a silicone rubber sheet using fine stainless steel pins (140 μm in diameter) with the endothelial side facing away from the silicone rubber. To suppress the movement of smooth muscle cells we added to the PSS 10 μm cytochalasin D (Saito et al. 1996), a capping agent of actin filaments, and/or 5 μm wortmannin, a myosin light chain kinase inhibitor (Nakanishi et al. 1992). For extensive suppression of the movement, we usually applied both drugs together. In some experiments, endothelium was removed by rubbing with a small piece of tissue paper. The loss of endothelial cells in these preparations was confirmed by the absence of fluo-3 fluorescence intensity change in response to 1 μm acetylcholine, which is known to induce Ca2+ mobilization in endothelial cells (Kasai et al. 1997).
Intracellular Ca2+ imaging
The silicone rubber sheet was placed with the pinned tissue facing downward in an experimental trough with a coverslip at the bottom. The trough was then mounted on the stage of an inverted fluorescence microscope (IX70, Olympus) equipped with a CCD camera (Photometrics). The arterial wall was viewed under a water immersion objective (LUMPlanFL ×60, NA = 0.90, Olympus) with an excitation wavelength of 480 nm and emission wavelengths of 515-550 nm. Due to the sufficiently shallow focal depth of the objective, individual fluo-3-loaded endothelial and smooth muscle cells could be visualized within the tissue. The images of 256 × 256 pixels (170 × 170 μm) were obtained at 2 frames s−1 with an exposure time of 100 ms.
The image analysis was carried out on a Macintosh computer using the program IPLab (Signal Analytics Corporation). We chose a well-focused 1/4 region (128 × 128 pixels) of the view and analysed all the cells in the region of interest. Small rectangular regions (composed of about 64-100 pixels) were selected to analyse the fluorescence intensity change in the individual cells. A slow decline in the fluorescence intensity due to photobleaching of fluo-3 was corrected for by a linear extrapolation of the initial decay of fluorescence intensity or by the time course of change in the fluorescence intensity averaged over the entire region in each frame. The latter method was used when no evoked response was present. The fluorescence intensity of individual cells was normalized to the mean value (F0) of fluorescence intensity between Ca2+ spikes.
Perfusion of solutions
The preparation was continually perfused using a peristaltic pump (0.1 ml s−1) through the narrow space (∼800 μm) between the preparation and the coverslip. Perfusion solutions were preheated so that the temperature within the trough was maintained at either 25-28°C or 34-37°C. Most of the Ca2+ measurements shown below were carried out within the lower temperature range. However, essentially the same results have been obtained within the higher temperature range.
Measurement of contraction
The arterial preparations were cut into rings (∼1 mm in length) after cleaning off the surrounding connective tissue and placed over a pair of stainless steel hooks (100 μm in diameter). One of the hooks was connected to a strain gauge transducer (BG-10, Kulite) and the other was attached to a micromanipulator for adjustment of the length of the arterial rings. The transducer and micromanipulator were fixed to a common plastic bar that was mounted on a three-dimensional micromanipulator (M-2, Narishige) for the positioning of the preparation in the solution contained in wells (volume 0.5 ml) heated to 37°C. The resting tension was adjusted to about 1.8 mN.
Materials
Physiological salt solution contained (mm): NaCl, 150; KCl, 4; CaCl2, 2; and MgCl2, 1. Ca2+-free PSS contained (mm): NaCl, 150; KCl, 4; CaCl2, 0; MgCl2, 3; and EGTA, 5. High potassium (80 K) solution contained (mm): NaCl, 74; KCl, 80; CaCl2, 2; and MgCl2, 1. All solutions contained (mm): Hepes, 5; and glucose, 5.6; and were adjusted to pH 7.4 with NaOH. Fluo-3 AM was purchased from Molecular Probes. Noradrenaline, cyclopiazonic acid, tetrodotoxin, prazosin, cremophor EL, cytochalasin D, PD-142893, CGP 29,287 and captopril were purchased from Sigma. U-73122 and U-73343 were obtained from Calbiochem. [Sar1,Ile8]-angiotensin II and angiotensin II were purchased from Wako. Losartan was a kind gift from Merck & Co., Inc. USA. All other chemicals were of the highest reagent grade available.
Statistical analysis
Differences between groups were evaluated with the use of Student's paired t test, unpaired t test (Fig. 4A) or one way repeated-measures ANOVA followed by Fisher's protected least-significant difference test (Fig. 5B). All results are quoted as means ±s.e.m. unless otherwise stated.
Figure 4. Effect of inhibitors of phospholipase C and endothelin on Ca2+ ripples.
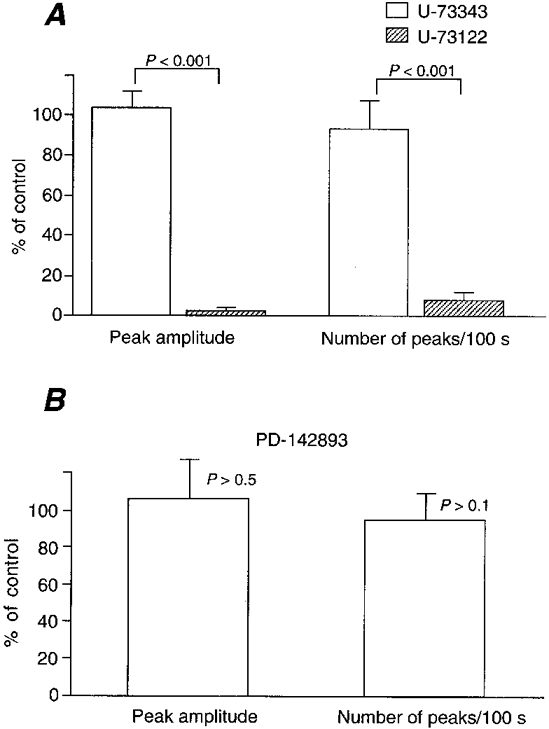
A, Ca2+ ripples were abolished by a phospholipase C inhibitor (U-73122, 100 nm, pretreated for 1 min) but not by its inactive analogue (U-73343, 100 nm, pretreated for 1 min). n = 36. B, absence of effect of an endothelin antagonist, PD-142893 (10 μm, pretreated for 5 min). n = 36. Means ±s.e.m.
Figure 5. Effect of an Ang II antagonist, [Sar1,Ile8]-Ang II (10 nm), on Ca2+ ripples.
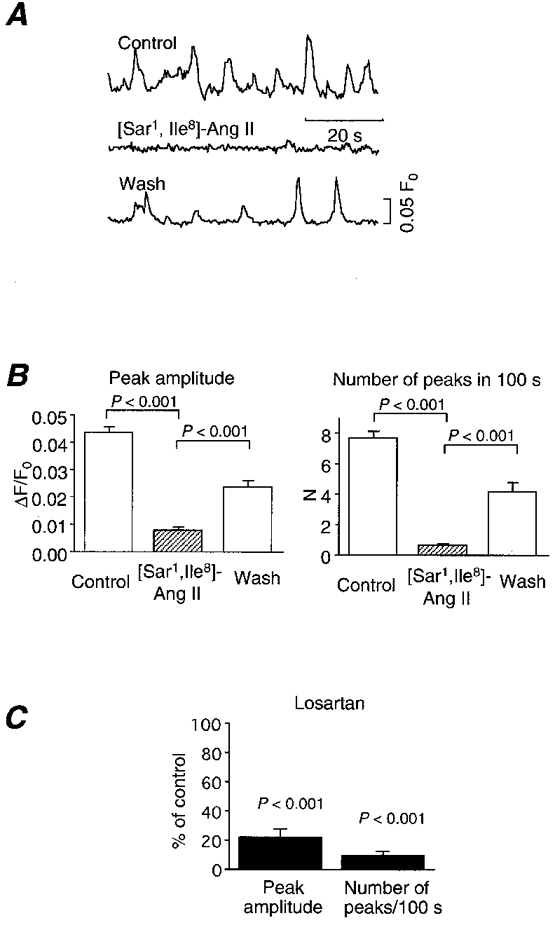
A, representative traces of Ca2+ ripples before (upper trace), during (middle) and after washout of (lower) [Sar1,Ile8]-Ang II. Ca2+ ripples were reversibly abolished. The antagonist was pretreated for 5 min and washed for 2 min before the measurement of [Ca2+]i. B, compiled results of the effect of [Sar1,Ile8]-Ang II on Ca2+ ripples (n = 80). P < 0.001. C, effect of a non-peptide AT1 receptor antagonist, losartan (10 μm), on Ca2+ ripples (n = 36). Means ±s.e.m.
RESULTS
Spontaneous Ca2+ transients without extrinsic stimulation
Individual fluo-3-loaded vascular smooth muscle cells were visualized within the excised arterial wall strips under an epifluorescence microscope equipped with a cooled CCD camera (Fig. 1A). To our surprise, we found spontaneous, transient increases in [Ca2+]i in the smooth muscle cells even in the absence of extrinsic stimulation. A significant proportion of the cells exhibited repetitive increases in [Ca2+]i. Figure 1B shows the time courses of such Ca2+ transients in five representative cells (areas 1, 2, 4, 5 and 7 in Fig. 1A) as well as the time courses of [Ca2+]i in two silent cells (areas 3 and 6). Since the peak amplitude of the [Ca2+]i transients was much smaller than that of noradrenaline (NA)-evoked Ca2+ oscillations (see below), we refer to these repetitive Ca2+ transients as Ca2+ripples. As shown in Fig. 1C Ca2+ ripples were generated by waveform propagation of increases in [Ca2+]i. The wave velocity of Ca2+ ripples was 18.3 ± 1.0 μm s−1 (n = 25, where n is the number of cells), which is similar to the value obtained in NA-induced Ca2+ waves in the same cells (Iino et al. 1994). Although the proportion of cells exhibiting Ca2+ ripples differed among different vessels, on average, Ca2+ ripples were observed in about 44.8 % of the cells (Table 1). In these cells, the mean frequency of Ca2+ ripples was 0.129 ± 0.006 Hz (156 cells).
Figure 1. Spontaneous Ca2+ oscillations (Ca2+ ripples) in arterial smooth muscle cells.
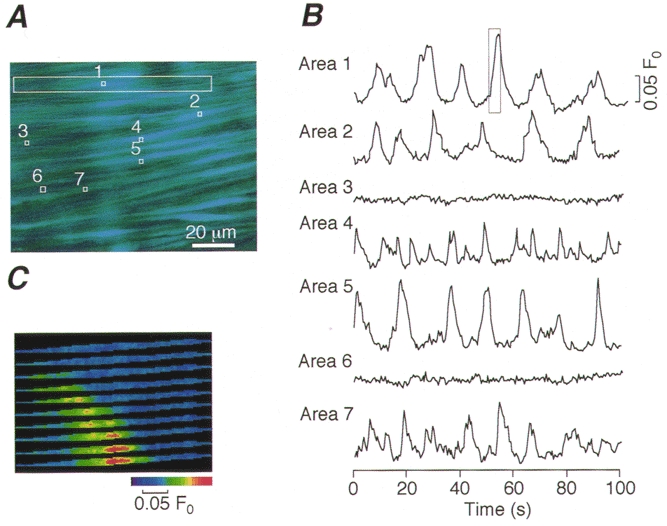
A, a time-averaged image of fluo-3-loaded smooth muscle cells in isolated strips of the rat tail artery. B, time courses of changes in the fluorescence intensity in small areas (1-7) indicated by □ in A. C, consecutive images of a Ca2+ ripple in the cell enclosed by the large box in A. The images were taken at 0.5 s intervals and correspond to the time course enclosed by the box in B, Area 1.
Table 1. Proportion of smooth muscle cells that exhibited Ca2+ ripples or Ca2+ flashes in tail artery.
| Ca2+ripples | Ca2+flashes | ||||
|---|---|---|---|---|---|
| Artery | Total number of cells | Number of cells* | Percentage | Number of cells* | Percentage |
| 1 | 72 | 18 | 25.0 | 0 | 0.0 |
| 2 | 81 | 13 | 16.0 | 0 | 0.0 |
| 3 | 77 | 47 | 61.0 | 5 | 6.5 |
| 4 | 73 | 55 | 75.3 | 3 | 4.1 |
| 5 | 47 | 13 | 27.7 | 0 | 0.0 |
| 6 | 58 | 18 | 31.0 | 0 | 0.0 |
| 7 | 64 | 28 | 43.8 | 3 | 4.7 |
| 8 | 51 | 13 | 25.5 | 0 | 0.0 |
| 9 | 57 | 29 | 50.9 | 5 | 8.8 |
| 10 | 51 | 47 | 92.2 | 0 | 0.0 |
| Means ±s.e.m. | 63.1 ± 3.8 | 28.1 ± 5.1 | 44.8 ± 7.9 | 1.6 ± 0.1 | 2.4 ± 1.1 |
Number of cells that exhibited either Ca2+ ripples or a Ca2+ flash in a 100 s observation period.
In addition to Ca2+ ripples, we found another pattern of spontaneous increase in [Ca2+]i, which is referred to as Ca2+flashes because the peak amplitude in Ca2+ flashes was much greater than that in Ca2+ ripples (Fig. 2). Ca2+ flashes were often observed in groups of two to three cells (Fig. 2A and B). The mean number of cells in each group was 2.85 ± 0.11 (34 flash sites). The pattern of spread of the increase in [Ca2+]i in the case of a Ca2+ flash was quite different from the Ca2+ waveforms found in Ca2+ ripples. The time courses of increase in [Ca2+]i during a Ca2+ flash shown in Fig. 2C were compared at seven equally spaced points within the single cell (Fig. 2A and Da-g). The peak amplitude became lower and the kinetics slower as the distance from the site of initiation increased. Therefore, Ca2+ flashes do not seem to involve regenerative Ca2+ mobilization and the [Ca2+]i seems to decay via diffusion and/or sequestration processes. Ca2+ flashes were observed in 2.4 % of the cells within a 100 s observation period (Table 1). In other words, the probability of occurrence of a Ca2+ flash was about 0.00024 s−1 cell−1. This extremely low frequency precluded further characterization of the Ca2+ flashes in this study.
Figure 2. Spontaneous, spike-like increase in [Ca2+]i (Ca2+ flash).
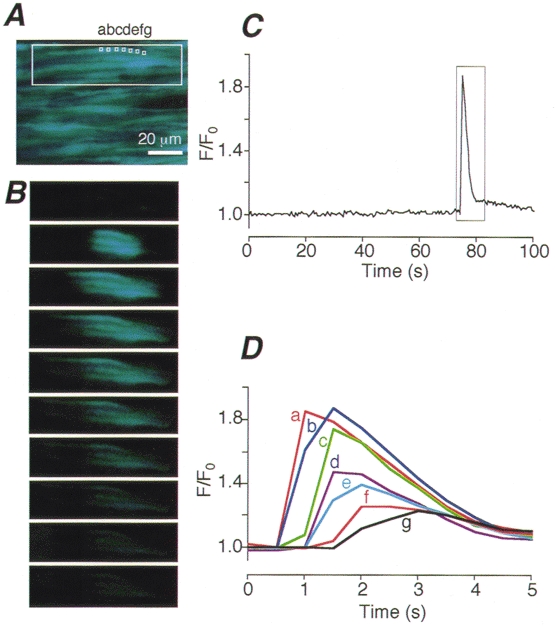
A, a time-averaged image of smooth muscle cells in a region where a Ca2+ flash was observed. B, intracellular Ca2+ images of a Ca2+ flash obtained at 0.5 s intervals in a group of three smooth muscle cells enclosed by the large box in A. C, changes in fluorescence intensity plotted against time in the area indicated by the small box (a) in A. D, time courses of changes in the fluorescence intensity of a Ca2+ flash enclosed by the box in C on an expanded time scale at 7 equally spaced points within the cell (a-g in A).
Spontaneous Ca2+ transients vs. evoked responses
We then compared the spontaneous Ca2+ transients with the [Ca2+]i responses to NA, a physiological agonist, in the smooth muscle cells. As reported previously (Iino et al. 1994), NA induces Ca2+ waves and oscillations in smooth muscle cells (Fig. 3A, right traces). The mean peak amplitude of the Ca2+ ripples was about one-seventh of the maximum amplitude of the Ca2+ oscillations evoked by 30 nm NA, while the peak amplitude of the Ca2+ flashes was nearly twice as large as that in the NA-evoked response (Fig. 3B).
Figure 3. Spontaneous Ca2+ transients (Ca2+ ripples and Ca2+ flashes) in comparison with Ca2+ transients evoked by NA (30 nm).
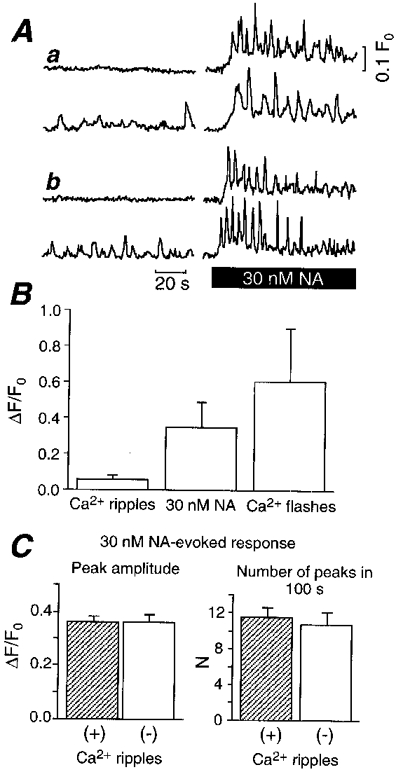
A, representative time course of [Ca2+]i before (left) and after (right) application of 30 nm NA. Results from two representative cells that did or did not exhibit Ca2+ ripples from two independent arteries (a and b). B, comparison of mean amplitude of Ca2+ ripples (156 cells), maximum amplitude in NA-evoked response (142 cells), and mean amplitude of Ca2+ flashes (102 cells). Means ±s.d.C, comparison of NA-evoked responses in cells that did or did not exhibit Ca2+ ripples. Peak amplitude (left) and the number of peaks in a 100 s observation period (right) are shown. Means ±s.e.m. (n = 20).
As described above, only about half of the cells exhibited Ca2+ ripples. To examine if there are any differences between the cells that did or did not exhibit Ca2+ ripples, we studied the Ca2+ oscillations induced by 30 nm NA in the smooth muscle cells within the same vessel wall strip. There was no difference in the NA-induced Ca2+ oscillations, in terms of the mean peak amplitude (P > 0.9) and the number of peaks in 100 s (P > 0.5), between cells that did or did not exhibit Ca2+ ripples (Fig. 3A and C). The result suggests that the occurrence of Ca2+ ripples is not correlated with the viability of the cells. Ca2+ ripples were also observed in the aorta (data not shown), indicating that this phenomenon is not confined to the tail artery.
Characterization of Ca2+ ripples
Intact vascular wall preparations such as those used in this study contain the perivascular sympathetic nerve network, which releases transmitters that induce Ca2+ mobilization in the smooth muscle cells upon electrical stimulation (Hirst & Edwards, 1989; Iino et al. 1994; Kasai et al. 1997). To study the relationship between the Ca2+ ripples and possible intrinsic nerve activity, we examined the effect of tetrodotoxin and prazosin, an α1-adrenergic antagonist. However, these drugs had no effect on the Ca2+ ripples (data not shown). Thus, the sympathetic nerve postganglionic fibres do not seem to exhibit spontaneous activity in these preparations and are unlikely to be responsible for the Ca2+ ripples. Ca2+ ripples were found both in the presence and in the absence of cytochalasin D or wortmannin, which were used for suppression of cell movements (data not shown). We observed Ca2+ ripples with or without the flow of solution through the experimental chamber. These results indicate that the Ca2+ ripples are not simply attributable to the particular experimental conditions used in this study.
We then studied the source of the Ca2+ mobilized during the Ca2+ ripples. Ca2+ ripples were observed for more than 3 min even in the absence of extracellular Ca2+, while they were abolished by 5 μm cyclopiazonic acid, a sarco(endo)plasmic reticulum Ca2+-ATPase inhibitor (Goeger et al. 1988; Kasai et al. 1994), in both intact arterial walls (n = 3) and endothelium-denuded preparations (n = 3). An inhibitor of phospholipase C (U-73122, 100 nm) but not its inactive analogue (U-73343) (Smith et al. 1990) abolished the Ca2+ ripples (Fig. 4A). These results indicate that the Ca2+ ripples are generated via inositol 1,4,5-trisphosphate-induced Ca2+ release from the intracellular Ca2+ stores.
We then looked for a receptor upstream of phospholipase C. The effect of PD-142893 (10 μm), an endothelin receptor antagonist (Cody et al. 1992), was studied because our preparation had an intact endothelium. However, this drug had no effect on Ca2+ ripples (Fig. 4B). Furthermore, Ca2+ ripples were observed in endothelium-denuded preparations (n = 3). Thus, endothelium-derived factors are not responsible for the generation of Ca2+ ripples. We then investigated the effect of 10 nm[Sar1,Ile8]-Ang II, an Ang II antagonist (Turker et al. 1972). Indeed, Ca2+ ripples were reversibly abolished by the antagonist (Fig. 5A andB). Since there are two types (AT1 and AT2) of Ang II receptors, we studied the effect of 10 μm losartan, a non-peptide AT1 receptor antagonist. Losartan also inhibited Ca2+ ripples (Fig. 5C). Furthermore, 10 μm captopril, an Ang II converting enzyme (ACE) inhibitor, also inhibited Ca2+ ripples (Fig. 6). After inhibition of Ca2+ ripples by the ACE inhibitor, recovery of Ca2+ ripples was observed upon application of 300 nm Ang II (n = 4). Ca2+ ripples were also inhibited by a renin antagonist 30 μm CGP 29,287 (Wood et al. 1985), and an application of 30 nm angiotensin I (Ang I) reversed this inhibition (n = 6). The Ang I-induced Ca2+ ripples were, in turn, blocked by 10 μm captopril (n = 3). These results indicate that the generation of Ca2+ ripples is attributable to the AT1 receptor activation by Ang II that is produced locally from angiotensinogen within the arterial tissue.
Figure 6. Effect of an ACE inhibitor, captopril (10 μm), on Ca2+ ripples.
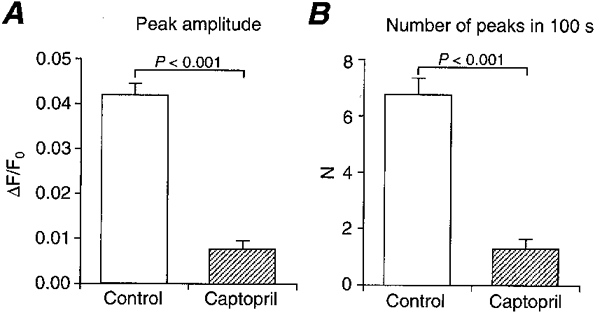
Captopril, preincubated for 15 min, inhibited Ca2+ ripples in terms of both mean peak amplitude (A) and the number of peaks in a 100 s observation period (B). Means ±s.e.m. (n = 36).
Response to Ang II
We further studied the direct effects of Ang II on smooth muscle cells. Application of extrinsic Ang II to the preparation induced oscillatory Ca2+ transients similar to the Ca2+ ripples in smooth muscle cells. Figure 7A shows representative time courses of the Ca2+ ripples before the application of Ang II and the subsequent Ca2+ oscillations evoked by 100 nm Ang II in the same cells. When the mean peak size of the Ca2+ transients induced by 100 nm Ang II and that of the Ca2+ ripples were compared in individual cells (n = 80), we found a close correlation between these values with the slope (regression coefficient) close to unity (Fig. 7B). Interestingly, cells that did not exhibit Ca2+ ripples over a 100 s observation period showed virtually no response to extrinsic Ang II either (Fig. 7B, the filled circle representing 26 cells). In the cells that did exhibit Ca2+ ripples, the number of peaks induced by 100 nm Ang II within the 100 s observation period was about twice that in the Ca2+ ripples (Fig. 7C).
Figure 7. Effect of extrinsic Ang II (100 nm) on [Ca2+]i.
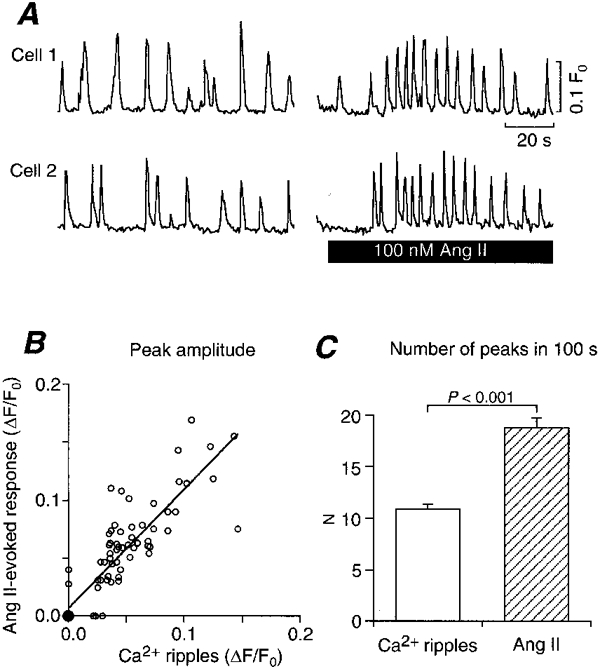
A, representative time courses of Ca2+ ripples (left) and Ang II-evoked responses (right) in two cells. B, scatter plot of amplitudes of Ang II-evoked responses vs. Ca2+ ripples. ○, single samples and • 26 samples. Regression coefficient, 1.028; correlation coefficient, 0.876; P < 0.0001. n = 80. C, comparison of number of peaks in a 100 s observation period between Ca2+ ripples and 100 nm Ang II-evoked responses.
Effect of Ang II antagonist on basal tension
To evaluate the physiological role of intrinsic Ang II which produces Ca2+ ripples in the smooth muscle tension production, we investigated the effect of 100 nm[Sar1,Ile8]-Ang II on the tension borne by unstimulated arterial ring preparations. [Sar1,Ile8]-Ang II reduced the resting tension by about 8 % of the amplitude of tension generated in a high potassium solution (Fig. 8A and B). The extent of reduction by Ca2+-free PSS in comparison with that generated in a high potassium solution was about 16 %. Therefore, the extent of reduction by [Sar1,Ile8]-Ang II was equivalent to about half of the extracellular Ca2+-dependent basal tension. These results suggest that intrinsic Ang II takes part in the maintenance of basal tension in rat tail arteries.
Figure 8. Effect of an Ang II antagonist, [Sar1,Ile8]-Ang II (10 nm), on tension in a ring preparation of the tail artery.
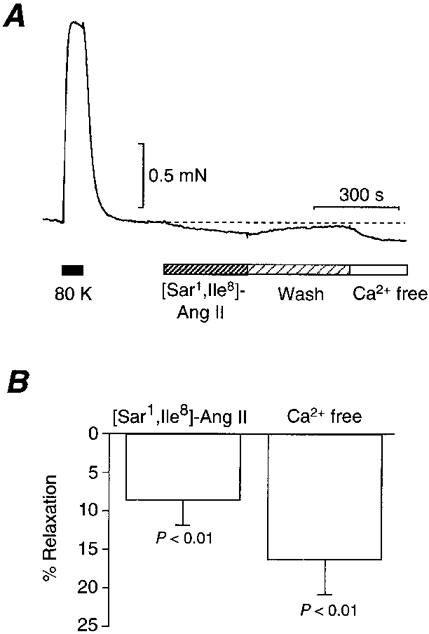
A, representative tension trace and the effect of [Sar1,Ile8]-Ang II. High potassium solution (80 K) and Ca2+-free PSS (Ca2+ free) were used. B, compiled results of the effect of [Sar1,Ile8]-Ang II and Ca2+-free PSS on tension compared with the tension evoked by a high potassium solution. Means ±s.e.m. (n = 5).
DISCUSSION
In the present study, we show, for the first time to our knowledge, the occurrence of spontaneous, repetitive Ca2+ waves, or Ca2+ ripples, under unstimulated conditions within vascular smooth muscle cells. Our results also indicate that the Ca2+ ripples are generated by locally produced Ang II via the AT1 receptor, which contributes to the maintenance of vascular tone. Since the mean peak amplitude of the Ca2+ ripples was relatively low, only about one-seventh of the peak amplitude of the Ca2+ oscillations elicited by NA, it appears likely that this spontaneous activity escaped detection in our previous studies (Iino et al. 1994; Kasai et al. 1997). Since the out-of-focus light increased the background fluorescence intensity in the wide-field microscopy used here, values of fluorescence intensity change (ΔF/F0) were lower than those obtained in our previous work using confocal microscopy. However, improvement in the signal-to-noise ratio of Ca2+ imaging within the intact arterial wall by the use of a cooled CCD camera facilitated the detection of low-amplitude signals in this study.
Spontaneous and localized Ca2+ transients were observed in vascular smooth muscle cells and are referred to as Ca2+ sparks (Nelson et al. 1995). These Ca2+ transients are thought to be due to release of Ca2+ via a cluster of ryanodine receptors. Ca2+ sparks are significantly shorter lived (half-decay time ∼50 ms; Nelson et al. 1995) than either Ca2+ ripples or Ca2+ flashes, and probably escaped detection in our Ca2+ imaging due to their limited time resolution (frame interval 500 ms).
On average, only about half of the cells exhibited Ca2+ ripples. It is unlikely that the cells that did not exhibit Ca2+ ripples were mechanically damaged, because the cells were rather evenly distributed over the vascular wall and responded equally to NA. We also demonstrated that the cells that did not exhibit Ca2+ ripples also did not respond to extrinsic Ang II. Further study is required to clarify the basis of the aforementioned inhomogeneity in response.
Ang II was initially considered to be a hormone-like agonist produced by the renin-angiotensin system (RAS) whose components are synthesized in different organs and interact within the circulation to generate the active peptide Ang II which then reaches its target organs via the circulation. However, recent studies suggest that, in addition to the systemic RAS, various organs including the heart, blood vessels and brain locally synthesize both the substrates and enzymes of the RAS except probably for renin, which may be taken up by the local tissues from the circulation (Peach, 1977; Dzau, 1993; Zimmerman & Dunham, 1997). Thus, the local RAS in the blood vessels may be involved in the regulation of blood pressure. In accordance with the function of the local RAS, we found a decrease in the resting tension of the arterial strips upon application of an Ang II inhibitor that abolished Ca2+ ripples.
In addition to the effect on vascular contraction, Ang II induces cell growth via AT1 receptor-mediated signalling in vascular smooth muscle cells and other cell types. Indeed, Ang II has been implicated in the remodelling of both cardiac and vascular tissues (Bell & Madri, 1990; Daemen et al. 1991; Baker et al. 1992; Itoh et al. 1993; Zimmerman & Dunham, 1997). Recent studies suggest that Ca2+-dependent activation of PYK2 mediates Ang II-induced activation of MAP kinases, which controls cell growth (Brinson et al. 1998; Sabri et al. 1998). Therefore, it will be important to study the relationship between the pathophysiological states of vascular tissues and Ca2+ ripples in relation to vascular remodelling.
The very sharp rise in [Ca2+]i in Ca2+ flashes is quite unique and interesting. However, the low frequency of occurrence of Ca2+ flashes (< 1 h−1 cell−1) precluded detailed analysis of the underlying mechanism. Since two to three cells usually fired at the same time junctional coupling between cells is likely to be involved. The Ca2+ flash is initiated by an increase in [Ca2+]i within a limited space (< 20 μm), and then spreads in an apparently passive manner. As the space constant of vascular smooth muscle cells in the rat (1-2 mm) (Kuriyama & Suzuki, 1978) is much greater than the initial size of the Ca2+ flash, it is unlikely that Ca2+ entered the cells via locally activated voltage-dependent Ca2+ channels. The modulatory mechanisms and physiological roles of Ca2+ flashes require further elucidation.
In summary, we found two patterns of spontaneous changes in [Ca2+]i, namely Ca2+ ripples and Ca2+ flashes within smooth muscle cells of the rat tail artery. The local RAS is considered to be responsible for the generation of Ca2+ ripples and to contribute to the vascular tone. Since [Ca2+]i regulates cell growth, it would be of interest to examine the pattern of occurrence of Ca2+ ripples during remodelling of vascular tissues.
Acknowledgments
This work was supported in part by grants from the Ministry of Education, Science, Sports and Culture of Japan.
References
- Baker KM, Booz GW, Dostal DE. Cardiac actions of angiotensin II: Role of an intracardiac renin-angiotensin system. Annual Review of Physiology. 1992;54:227–241. doi: 10.1146/annurev.ph.54.030192.001303. [DOI] [PubMed] [Google Scholar]
- Bell L, Madri JA. Influence of the angiotensin system on endothelial and smooth muscle cell migration. American Journal of Pathology. 1990;137:7–12. [PMC free article] [PubMed] [Google Scholar]
- Berridge MJ. Inositol trisphosphate and calcium signalling. Nature. 1993;361:315–325. doi: 10.1038/361315a0. [DOI] [PubMed] [Google Scholar]
- Brinson AE, Harding T, Diliberto PA, He Y, Li X, Hunter D, Herman B, Earp HS, Graves LM. Regulation of a calcium-dependent tyrosine kinase in vascular smooth muscle cells by angiotensin II and platelet-derived growth factor. Dependence on calcium and the actin cytoskeleton. Journal of Biological Chemistry. 1998;273:1711–1718. doi: 10.1074/jbc.273.3.1711. [DOI] [PubMed] [Google Scholar]
- Cody WL, Doherty AM, He JX, DePue PL, Rapundalo ST, Hingorani GA, Major TC, Panek RL, Dudley DT, Haleen SJ, LaDouceuer D, Hill KE, Flynn MA, Reynolds EE. Design of a functional hexapeptide antagonist of endothelin. Journal of Medical Chemistry. 1992;35:3301–3303. doi: 10.1021/jm00095a029. [DOI] [PubMed] [Google Scholar]
- Daemen MJ, Lombardi DM, Bosman FT, Schwartz SM. Angiotensin II induces smooth muscle cell proliferation in the normal and injured rat arterial wall. Circulation Research. 1991;68:450–456. doi: 10.1161/01.res.68.2.450. [DOI] [PubMed] [Google Scholar]
- Dzau VJ. Tissue renin-angiotensin system in myocardial hypertrophy and failure. Archives of Internal Medicine. 1993;153:937–942. [PubMed] [Google Scholar]
- Goeger DE, Riley RT, Dorner JW, Cole RJ. Cyclopiazonic acid inhibition of the Ca2+-transport ATPase in rat skeletal muscle sarcoplasmic reticulum vesicles. Biochemical Pharmacolgy. 1988;37:978–981. doi: 10.1016/0006-2952(88)90195-5. [DOI] [PubMed] [Google Scholar]
- Hirst GD, Edwards FR. Sympathetic neuroeffector transmission in arteries and arterioles. Physiological Reviews. 1989;69:546–604. doi: 10.1152/physrev.1989.69.2.546. [DOI] [PubMed] [Google Scholar]
- Iino M, Kasai H, Yamazawa T. Visualization of neural control of intracellular Ca2+ concentration in single vascular smooth muscle cells in situ. EMBO Journal. 1994;13:5026–5031. doi: 10.1002/j.1460-2075.1994.tb06831.x. [DOI] [PMC free article] [PubMed] [Google Scholar]
- Itoh H, Mukoyama M, Pratt RE, Gibbons GH, Dzau VJ. Multiple autocrine growth factors modulate vascular smooth muscle cell growth response to angiotensin II. Journal of Clinical Investigation. 1993;91:2268–2274. doi: 10.1172/JCI116454. [DOI] [PMC free article] [PubMed] [Google Scholar]
- Kasai Y, Iino M, Tsutsumi O, Taketani Y, Endo M. Effects of cyclopiazonic acid on rhythmic contractions in uterine smooth muscle bundles of the rat. British Journal of Pharmacology. 1994;112:1132–1136. doi: 10.1111/j.1476-5381.1994.tb13201.x. [DOI] [PMC free article] [PubMed] [Google Scholar]
- Kasai Y, Yamazawa T, Sakurai T, Taketani Y, Iino M. Endothelium-dependent frequency modulation of Ca2+ signalling in individual vascular smooth muscle cells of the rat. The Journal of Physiology. 1997;504:349–357. doi: 10.1111/j.1469-7793.1997.349be.x. [DOI] [PMC free article] [PubMed] [Google Scholar]
- Kuriyama H, Suzuki H. Electrical property and chemical sensitivity of vascular smooth muscles in normotensive and spontaneously hypersensitive rats. The Journal of Physiology. 1978;285:409–424. doi: 10.1113/jphysiol.1978.sp012579. [DOI] [PMC free article] [PubMed] [Google Scholar]
- Nakanishi S, Kakita S, Takahashi I, Kawahara K, Tsukuda E, Sano T, Yamada K, Yoshida M, Kase H, Matsuda Y. Wortmannin, a microbial product inhibitor of myosin light chain kinase. Journal of Biological Chemistry. 1992;267:2157–2163. [PubMed] [Google Scholar]
- Nelson MT, Cheng H, Rubart M, Santana LF, Bonev AD, Knot HJ, Lederer WJ. Relaxation of arterial smooth muscle by calcium sparks. Science. 270:633–637. doi: 10.1126/science.270.5236.633. [DOI] [PubMed] [Google Scholar]
- Peach MJ. Renin-angiotensin system: biochemistry and mechanisms of action. Physiological Reviews. 1977;57:313–370. doi: 10.1152/physrev.1977.57.2.313. [DOI] [PubMed] [Google Scholar]
- Sabri A, Govindarajan G, Griffin TM, Byron KL, Samarel AM, Lucchesi PA. Calcium- and protein kinase C-dependent activation of the tyrosine kinase PYK2 by angiotensin II in vascular smooth muscle. Circulation Research. 1998;83:841–851. doi: 10.1161/01.res.83.8.841. [DOI] [PubMed] [Google Scholar]
- Saito SY, Hori M, Ozaki H, Karaki H. Cytochalasin D inhibits smooth muscle contraction by directly inhibiting contractile apparatus. Journal of Smooth Muscle Research. 1996;32:51–60. doi: 10.1540/jsmr.32.51. [DOI] [PubMed] [Google Scholar]
- Smith RJ, Sam LM, Justen JM, Bundy GL, Bala GA, Bleasdale JE. Receptor-coupled signal transduction in human polymorphonuclear neutrophils: effects of a novel inhibitor of phospholipase C-dependent processes on cell responsiveness. Journal of Pharmacology and Experimental Therapeutics. 1990;253:688–697. [PubMed] [Google Scholar]
- Turker RK, Hall MM, Yamamoto M, Sweet CS, Bumpus FM. A new, long-lasting competitive inhibitor of angiotensin. Science. 1972;177:1203–1205. doi: 10.1126/science.177.4055.1203. [DOI] [PubMed] [Google Scholar]
- Wood JM, Gulati N, Forgiarin IP, Fuhrer W, Hofbauer KG. Effects of a specific and long-acting renin inhibitor in the marmoset. Hypertension. 1985;7:797–803. doi: 10.1161/01.hyp.7.5.797. [DOI] [PubMed] [Google Scholar]
- Zimmerman BG, Dunham EW. Tissue renin-angiotensin system: a site of drug action? Annual Review of Pharmacology and Toxicology. 1997;37:53–69. doi: 10.1146/annurev.pharmtox.37.1.53. [DOI] [PubMed] [Google Scholar]


