Abstract
The perforated patch whole-cell configuration of the patch-clamp technique was applied to superficial cells in intact pancreatic islets. Immunostaining in combination with confocal microscopy revealed that the superficial cells consisted of 35 % insulin-secreting B-cells and 65 % non-B-cells (A- and D-cells).
Two types of cell, with distinct electrophysiological properties, could be functionally identified. One of these generated oscillatory electrical activity when the islet was exposed to 10 mm glucose and had the electrophysiological characteristics of isolated B-cells maintained in tissue culture.
The Ca2+ current recorded from B-cells in situ was 80 % larger than that of isolated B-cells. It exhibited significant (70 %) inactivation during 100 ms depolarisations. The inactivation was voltage dependent and particularly prominent during depolarisations evoking the largest Ca2+ currents.
Voltage-dependent K+ currents were observed during depolarisations to membrane potentials above −20 mV. These currents inactivated little during a 200 ms depolarisation and were unaffected by varying the holding potential between −90 and −30 mV.
The maximum resting conductance in the absence of glucose, which reflects the conductance of ATP-regulated K+ (KATP) channels, amounted to ≈4 nS. Glucose produced a concentration-dependent reduction of KATP channel conductance with half-maximal inhibition observed with 5 mm glucose.
Combining voltage- and current-clamp recording allowed the estimation of the gap junction conductance between different B-cells. These experiments indicated that the input conductance of the B-cell at stimulatory glucose concentrations (≈1 nS) is almost entirely accounted for by coupling to neighbouring B-cells.
It has been known for more than 30 years that pancreatic B-cells are electrically excitable (Dean & Matthews, 1968, 1970) and utilise electrical signals to couple changes in the blood glucose concentration to the initiation of insulin secretion (for review see Henquin & Meissner, 1984). In the mouse, the traditional preparation for electrophysiological experiments, electrical activity in the B-cell consists of oscillations in the membrane potential between depolarised plateaux, on which Ca2+-dependent action potentials are superimposed, and repolarised silent intervals. Using the patch-clamp technique, many of the ion channels participating in the generation of this electrical activity have been characterised (Ashcroft & Rorsman, 1989). These data have successfully been utilised in an attempt to mathematically model B-cell electrical activity (Smolen et al. 1993; Sherman, 1996). However, to date all patch-clamp experiments have been conducted on isolated B-cells maintained in tissue culture whereas most membrane potential recordings have been obtained from intact islets. Clearly it would be desirable if the properties of the currents could be documented in the intact tissue to allow direct comparison of the activation and inactivation properties of the membrane currents and the electrical activity. A development in this direction is the application of the single microelectrode (high-resistance) voltage-clamp technique (Finkel & Redman, 1984) to intact pancreatic islets (Rojas et al. 1995). This method has been successfully applied to investigate the cell-cell coupling (Mears et al. 1995). An alternative method is to apply patch-clamp techniques to more intact preparations using thin tissue slices (Edwards & Konnerth, 1992). The latter approach has the advantage that low-resistance electrodes are used and involves the formation of giga seal. Here we report the first application of patch-clamp recordings to B-cells in intact pancreatic islets. The amplitude and the activation and inactivation kinetics of the voltage-gated Ca2+ and K+ currents that underlie the action potential have thus been documented. We have also estimated the resting conductance due to the activity of the ATP-regulated K+ channels (KATP) and the gap junction conductance. Comparison of these parameters indicates that at insulin-releasing glucose concentrations, the input conductance of the B-cell in intact islets is almost fully accounted for by the electrical coupling to neighbouring B-cells.
METHODS
Preparation of pancreatic islets
The experiments were (unless otherwise indicated) carried out on cells in situ within intact pancreatic islets. NMRI mice were purchased from commercial breeders (Möllegaard, Ry, Denmark). Care and use of animals was approved by the ethical committee of Lund University. The mice were stunned by a blow against the head and killed by cervical dislocation. Immediately afterwards the abdominal cavity was opened and collagenase (2 mg, dissolved in Hanks’ buffer) was injected into the pancreatic duct. The islets were then isolated by gentle digestion for 25 min at 37°C. Islets thus isolated were washed extensively in collagenase-free solution and subsequently maintained in short-term tissue culture (< 16 h) at 37°C in RPMI 1640 containing 5 mm glucose and 10 % (v/v) fetal calf serum (Flow Laboratories, Irvine, UK) and supplemented with 100 μg ml−1 streptomycin and 100 IU ml−1 penicillin (both from Northumbria Biologicals, Ltd, Cramlington, UK). Single B-cells were prepared essentially as described previously (Rorsman & Trube, 1986).
Electrophysiology
The electrophysiological recordings were, except for the data of Fig. 2A and B and Fig. 3C, obtained from superficial B-cells in intact islets, functionally identified by the ability to generate the characteristic oscillatory electrical activity in the presence of glucose (Henquin & Meissner, 1984), using the perforated patch whole-cell recording mode. The islets were immobilised by a wide-bore (diameter, 50–100 μm) suction pipette (Fig. 1B). The measurements were performed using an EPC-9 patch-clamp amplifier (HEKA Electronics, Lambrecht/Pfalz, Germany) and Pulse software (version 8.11; HEKA). Voltage-gated currents were compensated for capacitive transients and linear leak using a P/4 protocol. Patch pipettes were pulled from borosilicate glass (tip resistance, 3–5 MΩ when filled with the pipette solutions). In all recordings, electrical contact with the cell interior was established by addition of 0.24 mg ml−1 of the pore-forming antibiotic amphotericin B (Rae et al. 1991) to the pipette solution (Sigma). Perforation required a few minutes and the voltage clamp was considered satisfactory when the series conductance was ≥ 40 nS (series resistance ≤ 25 MΩ). We estimate that for the currents shown, the voltage error was < 5 mV even for the greatest currents.
Figure 2. Two types of islet cell can be identified from electrophysiological properties.
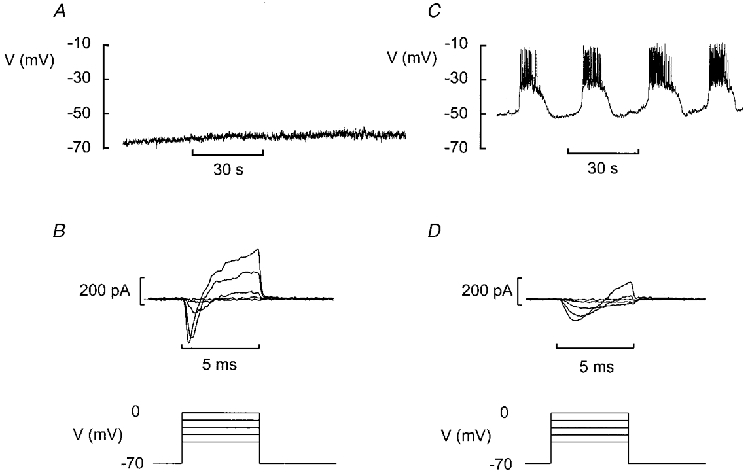
A, the majority of superficial cells had a stable and negative membrane potential even in the presence of 10 mm glucose. B, voltage-clamp depolarisation of these cells (5 ms to voltages between −40 and 0 mV) elicited a spiky inward current and a rapidly activating outward current. The glucose concentration was 10 mm. C, electrical activity recorded from a fraction of the cells in the presence of 10 mm glucose. D, voltage-clamp depolarisation of cells of this type (same protocol as in B) elicited smaller currents with slower activation kinetics. The voltage-clamp records were obtained after lowering the glucose concentration to 5 mm to suppress regenerative electrical activity.
Figure 3. Characterisation of the Ca2+ current.
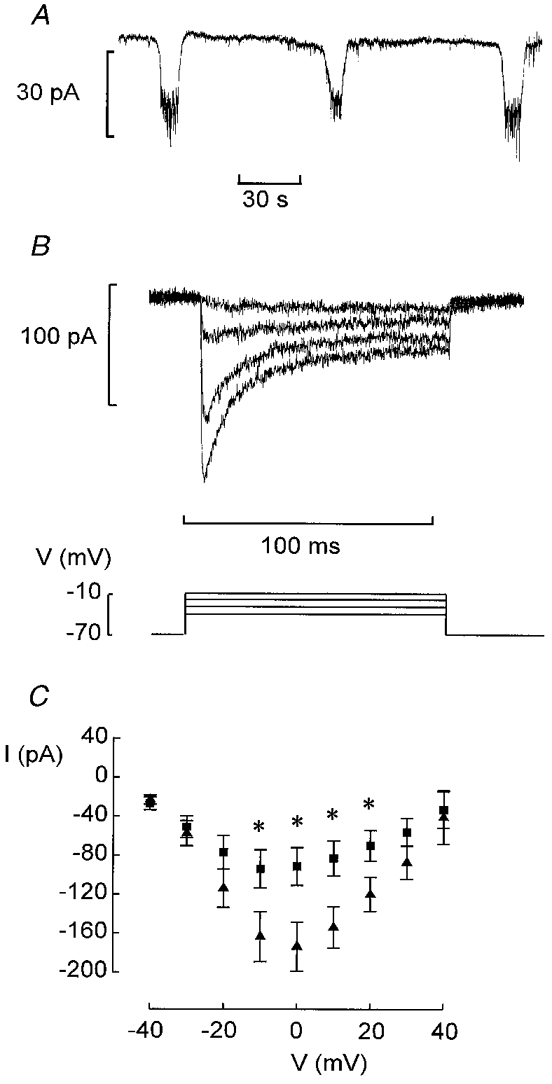
A, oscillations in holding current due to bursts of action potentials in neighbouring B-cells recorded in the presence of 10 mm glucose. B, Ca2+ currents elicited by voltage-clamp depolarisations to membrane potentials between −40 and −10 mV from a holding potential of −70 mV. C, peak Ca2+ current amplitudes recorded during depolarisations to voltages between −40 and +40 mV from B-cells in intact islets (▴) and isolated B-cells maintained in tissue culture for 2–4 days (▪). Data are mean values ±s.e.m. of 15 (▴) and 8 (▪) experiments. * P < 0.05 vs. current amplitude recorded at the same voltage in B-cells of intact islets.
Figure 1. Experimental design.
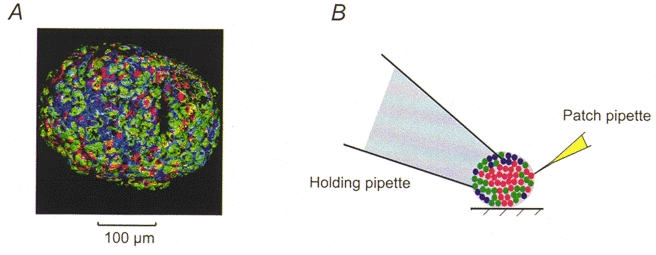
A, confocal image of superficial cells in a mouse pancreatic islet. The cells have been stained with anti-insulin (red), anti-glucagon (green) and anti-somatostatin (blue) antibodies. Note that all islet cell types are accessible on the surface. B, schematic diagram of the experimental system. The islet is held in place by gentle suction applied to the interior of a wide-bore holding pipette. Patch-clamp experiments are then performed using standard patch electrodes placed on the opposite pole of the islet.
Solutions
The standard extracellular medium consisted of (mm): 140 NaCl, 3.6 KCl, 2 NaHCO3, 0.5 NaH2PO4, 0.5 MgSO4, 5 Hepes (pH 7.4 with NaOH) and 2.6 CaCl2. Glucose was present at a concentration of 5 mm in all experiments involving voltage-clamp recordings of voltage-gated membrane currents in B-cells. The pipette solution was composed of (mm): 76 K2SO4, 10 NaCl, 10 KCl, 1 MgCl2 and 5 mm Hepes (pH 7.35 with KOH). For the recording of the inward Na+ and Ca2+ currents, outward currents were suppressed by the inclusion of TEA-Cl at a concentration of 20 mm in the extracellular medium (NaCl was correspondingly reduced to maintain isosmolarity) and by replacing K2SO4 in the pipette-filling solution with an equimolar amount of Cs2SO4. Experiments in Ca2+-free medium (Fig. 6B) were performed after substituting MgCl2 for CaCl2 in the extracellular solution so that the final concentration of Mg2+ became 3.7 mm.
Figure 6. Delayed outward K+ currents recorded from B-cells in situ.
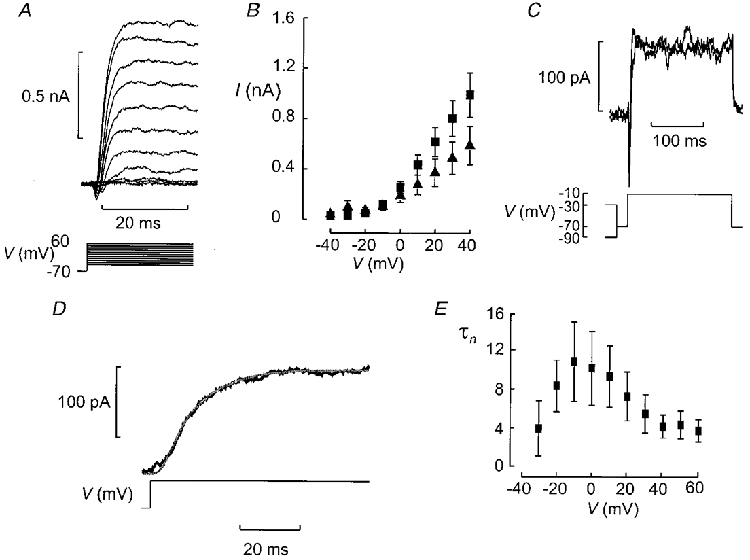
A, K+ currents evoked by depolarisation (100 ms applied at a frequency of 0.25 Hz) to membrane potentials between −50 and +60 mV from a holding potential of −70 mV. B, I–V relationship of peak outward current. Data are mean values ±s.e.m. of the peak K+ current recorded under control conditions (▪) and after removal of extracellular Ca2+ (▴), obtained from 7 and 4 experiments, respectively. C, outward K+ current in a B-cell was independent of variations of the holding potential between −90 and −30 mV. Prior to the test pulse to −10 mV (200 ms), a 200 ms conditioning pulse to −90 or −30 mV was applied. Between the conditioning pulse and the test pulse there was an interval of 20 ms during which the cell was held at −70 mV. Note that the current elicited during the test pulse was sustained and that its amplitude was the same irrespective of whether the conditioning pulse was to −90 or −30 mV. D, activation of the K+ current can be described by n4 kinetics. The fitted function (smooth curve) has been superimposed on the current evoked by a voltage-clamp depolarisation to 0 mV. E, relationship between time constant of activation (τn) and membrane potential (V). Data are mean values ±s.e.m. from 4 experiments.
Confocal microscopy
Freshly isolated mouse pancreatic islets were cultured overnight in RPMI 1640 medium and subsequently washed in the standard extracellular solution. All subsequent steps were carried out at 4°C. Islets were fixed with 4 % formaldehyde in phosphate-buffered saline (PBS) overnight, then permeabilised overnight with 0.3 % Triton X-100. Non-specific binding was blocked by pre-treatment for 2 h with 10 % normal donkey serum (Jackson Immuno Research, West Grove, PA, USA) before the islets were incubated with the primary antibodies (guinea-pig anti-insulin (Eurodiagnostica, Malmö, Sweden), sheep anti-glucagon (Biogenesis Ltd, Poole, UK) and rabbit anti-somatostatin (Dako, Carpinteria, CA, USA)) for 4–12 h. After washing with PBS supplemented with 0.3 % Triton X-100, secondary antibodies (Cy5 anti-guinea-pig, Cy2 anti-sheep and Texas Red anti-rabbit, all from Jackson Laboratories) were added and were present for 4–12 h. Islets were finally washed, post-fixed for 30 min in 4 % formaldehyde and mounted in a 1:1 mixture of glycerol and VectaShield (Vector, Burlingame, CA, USA). Immunolabelled islets were imaged on a confocal microscope (Zeiss LSM510, Jena, Germany), using 488 nm (Ar), 543 nm (He-Ne) and 633 nm (He-Ne) lasers for excitation. Emission was detected at 505–530 nm (green channel, glucagon), 565–615 nm (blue channel, somatostatin) and > 650 nm (red channel, insulin). Crosstalk was minimised by sequentially exciting and scanning each of the three channels. The final image was constructed from a stack of 3X3 Gauss-filtered stacks of 154 images (0.6 μm apart), using the surface-rendering function of the Zeiss 3D-software module.
Data analysis
The activation and deactivation parameters of the K+ and Ca2+ currents were calculated using Pulsefit software (HEKA). Data are presented as mean values ±s.e.m. for the indicated number (n) of experiments. A new islet was usually used for every experiment and the data shown were obtained from islets isolated from several mice. Statistical significances were evaluated using Student's t test.
RESULTS
Confocal microscopy of intact islets
Figure 1A shows a confocal image of a mouse pancreatic islet. The image has been processed such that only the superficial cells are seen. It is clear that a large fraction (35 %) of the superficial cells in this islet were insulin-secreting B-cells. Whereas the D-cells had a more irregular morphology, both the A- and B-cells had ellipsoid shapes. The long (a) and short (b) radii averaged 16.5 ± 0.3 and 12.1 ± 0.3 μm in the B-cells and 12.7 ± 0.4 and 10.9 ± 0.2 μm in the A-cells, respectively. The surface areas (A) of the A- and B-cell were then calculated using the equation:
| (1) |
The cell surface areas were accordingly estimated to be 430 ± 20 μm2 (n= 20) and 630 ± 20 μm2 (n= 20) for the A- and B-cells, respectively. Assuming a specific membrane capacitance of 1 μF cm−2, these values for the cell surface area predict cell capacitances of 4.3 and 6.3 pF.
Two types of islet cell can be identified by electrophysiological properties
Perforated patch whole-cell recordings from superficial cells within intact pancreatic islets generated two types of response. In the majority of cells (> 70 %), no spontaneous electrical activity was observed when the islet was exposed to 10 mm glucose (Fig. 2A). The membrane potential was stable and ranged between −60 and −80 mV. Voltage-clamp depolarisations applied to such cells elicited a rapidly activating inward current followed by an outward current (Fig. 2B). The cell capacitance of this type of cell averaged 4.8 ± 0.3 pF (n= 20), close to that predicted for A-cells from the cell surface area.
In a minority of the superficial cells (52 cells out of a total of more than 200 cells - non-B-cells identified during the early stages of the work on intact islets were discarded so this frequency represents an upper estimate), electrical activity in 10 mm glucose consisted of oscillations in the membrane potential between depolarised plateaux and repolarised silent intervals (Fig. 2C). This electrical activity is regarded as a hallmark of pancreatic B-cells and has traditionally been used to functionally identify insulin-secreting B-cells (Henquin & Meissner, 1984). Voltage-clamp depolarisations elicited a slowly developing inward current followed by the delayed activation of an outward current (Fig. 2D). These currents resemble those that have previously been documented in isolated mouse pancreatic B-cells maintained in tissue culture (Rorsman & Trube, 1986). The measured cell capacitance of cells with these electrical properties was 7.4 ± 0.3 pF (n= 22; P < 0.001vs. cells in Fig. 2A and B), which is in reasonable agreement with the 6.3 pF expected from the cell surface area and not too different from the 5.3 pF reported previously (Rorsman & Trube, 1986). Collectively, these observations suggest that whereas the data in Fig. 2A and B were recorded from a non-B-cell (probably an A- or a D-cell), those in Fig. 2C and D were from a B-cell. In this paper we focus on the electrophysiological properties of the B-cells in situ.
Voltage-activated Ca2+ currents in B-cells within intact islets
We first studied the voltage-gated currents in B-cells within intact pancreatic islets. The cells were first identified by the appearance of oscillatory electrical activity in the presence of 10 mm glucose as described above. Under voltage-clamp conditions, the membrane potential of the cell under study is held constant but the neighbouring cells continue to generate electrical activity. The associated changes of the membrane potential spread into the voltage-clamped cell via the gap junctions and give rise to changes in the holding current appearing as inverted bursts of action potentials (Fig. 3A). Such current oscillations were not observed when the recording was obtained from cells with the electrophysiological characteristics of non-B-cells (cf. Fig. 9C).
Figure 9. Electrical coupling between different B-cells.
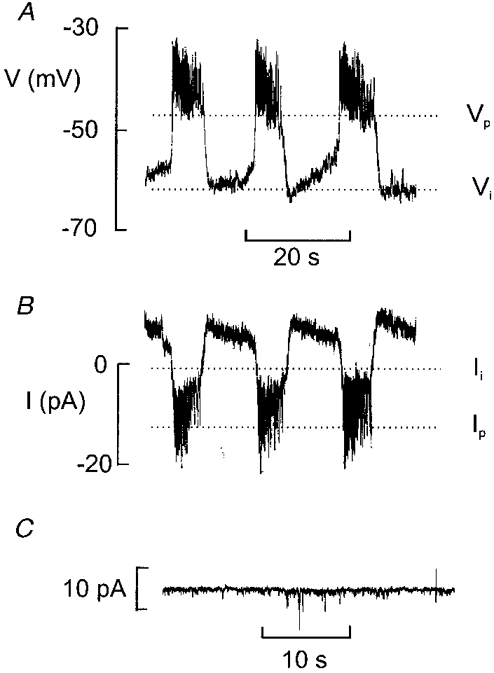
A, glucose-induced electrical activity recorded with 10 mm glucose. Note that the membrane potential undergoes regular oscillations. The maximally negative interburst potential (Vi) and the plateau potential (Vp) are indicated by dotted lines. B, variations of the holding current recorded from the same cell. The variations of the holding current reflect bursts of action potentials in a neighbouring cell. The current levels corresponding to the repolarisation of the burst of action potentials (Ii) and the plateau (Ip) are indicated by dotted lines. C, stable holding current recorded at −70 mV in a non-B-cell in an intact islet exposed to 10 mm glucose.
After identification of cells displaying inverted bursts of action potentials, the glucose concentration was lowered to 5 mm to suppress spontaneous electrical activity. Voltage-clamp depolarisations were then applied to activate the voltage-activated membrane currents. Figure 3B shows a family of Ca2+ currents recorded at an external Ca2+ concentration of 2.6 mm and activated by stepping the membrane potential from −70 mV to voltages between −40 and +60 mV (only responses up to −10 mV shown). There was considerable inactivation of the current during the depolarisations and the Ca2+ current amplitude fell by 68 ± 6 % (n= 8) during a 100 ms depolarisation to −10 mV. The I–V relationship of the inward current recorded from B-cells in situ is summarised in Fig. 3C (▴). The maximum peak Ca2+ current amounted to ∼180 pA. This value is twice that observed in individual B-cells maintained in tissue culture (90 pA, ▪). The integrated Ca2+ current observed during a 100 ms depolarisation to −20 mV (i.e. at the peak of the B-cell action potential) in a B-cell in situ was 7.7 ± 1.0 pC (n= 8).
The activation of the Ca2+ current could be described by m2 kinetics. The value of m is given by the equation:
| (2) |
where τm is the time constant of activation. Figure 4A shows the observed current and the function approximated to the data points for depolarisations to −30 and −10 mV. It is clear that the model correctly predicts the behaviour of the recorded current. The peak current amplitudes at −30 and −10 mV have been normalised and it thus becomes clear that activation was quicker at the more depolarised potentials. Figure 4B shows that the τm fell from a mean value of 1 ms at −30 mV to 0.5 ms at voltages more positive than −10 mV.
Figure 4. Voltage dependence of Ca2+ current activation and inactivation.
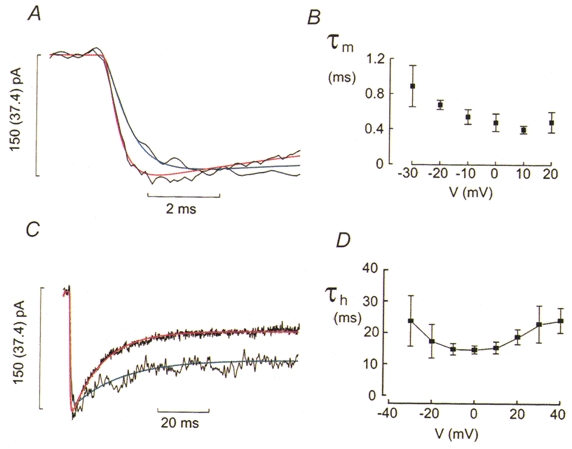
A, Ca2+ currents evoked by membrane depolarisations to −30 mV (trace with superimposed blue curve) and −10 mV (trace with superimposed red curve). The blue and red curves were derived assuming m2 kinetics. The values of the time constant of activation (τm) were 0.56 ms at −30 mV and 0.33 ms at −10 mV. The value in parentheses for the scale bar refers to the trace with superimposed blue curve. B, τm measured at different membrane potentials (V). C, inactivation of the Ca2+ currents elicited by depolarisations to −30 mV (trace with superimposed blue curve) and −10 mV (trace with superimposed red curve). To facilitate comparison of the inactivation, the current amplitudes have been normalised. The value in parentheses for the scale bar refers to the trace with superimposed blue curve. The blue and red curves represent an exponential function fitted to the current using time constants of inactivation (τh) of 19.5 and 12.3 ms at −30 and −10 mV, respectively. D, τh displayed against voltage during the depolarisation (V). Note the U-shaped relationship with a minimum at 0 mV. Data are mean values ±s.e.m. from 6 experiments.
Figure 4C compares the inactivation of the Ca2+ currents elicited by depolarizations to −30 and −10 mV. To facilitate the comparison of the inactivation behaviour, the peak currents have been normalised to the same peak amplitude. By this manoeuvre it is evident that inactivation was considerably faster during the pulse to −10 mV, i.e. the depolarisation evoking the largest current, than at −30 mV. The time course of inactivation was approximated by a single exponential and the time constant of inactivation (τh) calculated. The fitted function has been superimposed on the current record in Fig. 4C. Again, the inactivation of the current was well described by the fitted function. Figure 4D summarises the relationship between τh and voltage. The value of τh varied with the voltage during the pulse in a U-shaped fashion displaying a minimum at voltages around 0 mV (Fig. 4D). For example, the time constant of inactivation increased from 15.2 ± 1.41 ms at 0 mV to 18.8 ± 2.38 ms at +20 mV (n= 5; P < 0.06). This voltage dependence overlaps that of the peak Ca2+ current amplitude (Fig. 3C) as expected if Ca2+ current inactivation is a Ca2+-dependent process (Plant, 1988a).
TTX-sensitive Na+ currents in B-cells
Functionally identified B-cells also contained a TTX-blockable Na+ current (Fig. 5C). The steady-state inactivation properties were determined using a standard two-pulse protocol in which a depolarisation to 0 mV was preceded by a conditioning pulse to voltages between −180 and −50 mV. Varying the voltage between −180 and −130 mV had little effect on the amplitude of the current that could subsequently be elicited. However, for more positive conditioning voltages, the current amplitude became progressively smaller and at −90 mV the current was fully inactivated (Fig. 5A). The relationship between the voltage during the conditioning pulse (Vm) and the peak current amplitude is summarised in Fig. 5B. The data points can be approximated to the equation:
| (3) |
where h∞ is the current amplitude expressed as a fraction of the maximal current (i.e. I/Imax), Vh is the membrane potential at which h∞ is 0.5 and kh is the steepness coefficient. The current response following the conditioning pulse to −180 mV was taken as unity. In a series of five experiments, Vh and kh averaged −104 ± 1 and 8 ± 1 mV, respectively. The peak Na+ current amplitude during a depolarisation to 0 mV amounted to −392 ± 10 pA (n= 5) when the conditioning voltage was more negative than −140 mV.
Figure 5. Steady-state inactivation of the Na+ current in pancreatic B-cells.
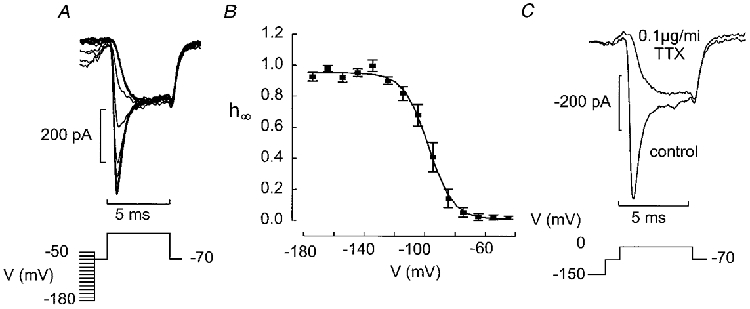
A, the B-cell was subjected to a conditioning pulse (100 ms) to voltages between −180 and −50 mV prior to the 5 ms test pulse to 0 mV. Between the conditioning pulse and the test pulse the cell was held at −70 mV for 1 ms. B, relationship between conditioning voltage (V) and relative current amplitude (h∞=I/Imax). The current response elicited by depolarisation to 0 mV following a conditioning pulse to −180 mV was taken as unity. Mean values ±s.e.m. from 4 experiments. The curve was obtained by fitting the Boltzmann equation (eqn (3)) to the data points. C, currents elicited by a 5 ms depolarisation to 0 mV following a 100 ms conditioning pulse to −150 mV under control conditions and after addition of tetrodotoxin (TTX, 0.1 μg ml−1).
Delayed outward currents in pancreatic B-cells
Depolarisations to membrane potentials between −40 and +60 mV were applied from a holding potential of −70 mV to pancreatic B-cells identified as described above. The resultant outward K+ currents are shown in Fig. 6A. Outward current first became detectable during a depolarisation to −20 mV where the peak current amplitude averaged 40 ± 9 pA (n= 7). The current amplitude subsequently increased linearly with the applied voltage (Fig. 6B). Consistent with data in isolated B-cells (Smith et al. 1990b), the delayed outward current was little affected by inhibition of Ca2+ entry and the current amplitude measured in four cells at 0 mV in the presence and absence of 2.6 mm extracellular Ca2+ averaged 210 ± 53 and 178 ± 50 pA, respectively. Inactivation was negligible during the 200 ms depolarisation. The current amplitude was likewise unaffected by varying the voltage during a conditioning pulse between −90 and −30 mV (Fig. 6C). The activation of the outward current was determined after inhibition of the Ca2+ current and was described by n4 kinetics (Fig. 6D) where n is given by eqn (2) with the exception that the time constant of activation should be referred to as τn. The time constant of activation was maximal at −10 mV where it amounted to 11 ± 4 ms (n= 4; Fig. 6E).
Glucose regulation of resting conductance in B-cells in situ
Figure 7A and B shows recordings of the membrane potential and membrane conductance, respectively, in a B-cell in an intact pancreatic islet exposed to 10, 5, 0 and 20 mm glucose. Membrane conductance was monitored by switching the amplifier from the current- to the voltage-clamp mode and application of ±10 mV voltage excursions from −70 mV (Fig. 7B, bottom). The resulting current deflections were used to estimate the input conductance of the cell. The experiment began in the presence of 10 mm glucose to enable the functional identification of the B-cell. In the presence of 10 mm glucose, the measured membrane conductance was determined as 1.5 nS. Reducing the glucose concentration to 5 mm resulted in membrane repolarisation, cessation of electrical activity and an increase in membrane conductance to ∼2 nS. The complete removal of glucose was associated with a further repolarisation (down to −70 mV) and increase in membrane conductance to 3 nS. The glucose concentration was finally elevated to 20 mm. This was associated with the induction of continuous electrical activity and a decrease in membrane conductance to < 1.5 nS.
Figure 7. Whole-cell KATP conductance in B-cells in situ.
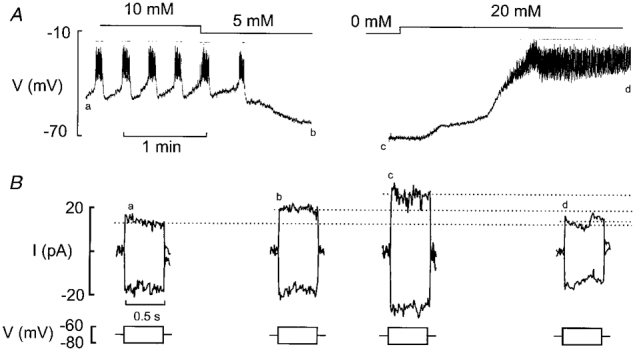
A, membrane potential recordings from a B-cell in an intact islet at 10, 5, 0 and 20 mm glucose. Note that varying the glucose concentration (as indicated above the membrane potential trace) influenced the B-cell membrane potential and electrical activity. B, recordings of resting conductance from the same cell. The conductance was monitored by application of 500 ms voltage pulses to −80 and −60 mV from the holding potential of −70 mV (bottom). The associated current responses (top) were recorded as indicated by letters a-d in A.
Figure 8A displays the relationship between the glucose concentration and membrane conductance of B-cells in situ. It can be observed that the conductance decreased in a glucose-dependent fashion from a value of 3.6 nS in the absence of glucose to ∼1 nS at glucose concentrations ≥ 20 mm. The latter value is close to that obtained in the presence of 0.1 mm tolbutamide (1.07 ± 0.13 nS, n= 9; Fig. 8A) indicating that the minimum input conductance of B-cells in situ, contrary to the situation in isolated B-cells (Smith et al. 1990a; Rorsman et al. 1991), does not fall below ∼1 nS. Half-maximal inhibition was observed at a glucose concentration of ∼5 mm.
Figure 8. Modulation of whole-cell KATP conductance.
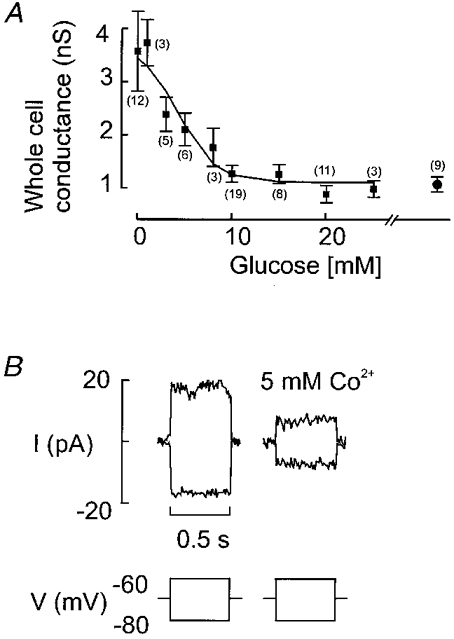
A, relationship between glucose concentration and measured whole-cell conductance calculated from current responses elicited by ±10 mV voltage excursions in Fig. 7B. Values are means ±s.e.m. of the indicated (within parentheses) number of experiments. The rightmost data point indicates the input resistance measured in the simultaneous presence of > 10 mm glucose and 0.1 mm tolbutamide. Note that the whole-cell conductance does not fall below ≈1 nS. B, block of whole-cell KATP conductance by Co2+ (5 mm) applied in the absence of glucose.
We attempted to study the KATP conductance of B-cells in situ in the presence of Co2+ (5 mm) to suppress regenerative electrical activity, which may interfere with the conductance measurements. However, as shown in Fig. 8B, this divalent cation inhibited the resting K+ conductance itself thus invalidating the conductance measurements. The effects of the cation on the KATP conductance explains why the B-cell depolarises towards the plateau potential when action potential firing is suppressed by addition of Co2+ and also the transient stimulation of electrical activity seen upon removal of the cation from the bath (Ribalet & Beigelman, 1981).
Cell-cell coupling between pancreatic islet cells
It has been demonstrated (Mears et al. 1995) that it is possible to estimate the gap junction conductance from the changes in holding current associated with the generation of electrical activity in the neighbouring cells. Figure 9A and B shows consecutive recordings of the membrane potential and the holding current at −70 mV, respectively, from the same B-cell. The interburst (Vi) membrane potential was −62 mV and the plateau potential (Vp), from which the action potentials originate, was −47 mV. The holding current during the silent interval (Ii) and active phase (Ip) was −1 and −12 pA, respectively. The gap junction conductance (Gj) can be estimated from the equation:
| (4) |
In the experiment shown in Fig. 9, Gj can thus be estimated to be ∼1 nS. In a series of 16 experiments, the mean values of Ii, Ip, Vp and Vi were −22 ± 3 pA, −39 ± 4 pA, −39 ± 1 mV and −54 ± 3 mV, respectively. The mean value of Gj determined from these values amounted to 1.35 ± 0.18 nS. This value is close to that estimated for the membrane conductance in the presence of 10 mm glucose (1.27 ± 0.16 nS, n= 19; Fig. 8A). When the recording was made from a non-B-cell (cf. Fig. 2A–C), no oscillations of the holding current similar to those observed in the B-cell were detected (Fig. 9C).
DISCUSSION
We report here the first in situ measurements of the whole-cell KATP channel conductance at different glucose concentrations, voltage-dependent membrane currents and gap junction conductance from insulin-secreting pancreatic B-cells. In keeping with a recent report, based on measurements of the cytoplasmic Ca2+ concentration (Nadal et al. 1999), we demonstrate that a fraction of B-cells are accessible at the surface of the pancreatic islets and that their functional properties are distinct from those of non-B-cells. Here, we first compare the properties of the membrane currents in B-cells within the intact islets with those previously reported in isolated B-cells. We then consider the implications of cell-cell coupling to the overall function of the pancreatic islets.
Comparison of voltage-gated membrane currents in isolated and in situ B-cells
The maximum peak Ca2+ current that could be recorded from a B-cell within an intact islet is approximately twice that observed in an isolated B-cell. This difference can be expected to have dramatic effects on the generation of B-cell electrical activity and secretion. For example, if activation of a Ca2+-dependent current leads to the termination of bursts of action potentials seen at intermediate glucose concentrations (Fig. 2D), then the relative smallness of the Ca2+ current in isolated B-cells may account for the failure of dispersed cells to generate the characteristic oscillatory electrical activity (cf. Smith et al. 1990a).
The charge entry per 100 ms depolarisation to −20 mV (i.e. duration and height of a B-cell action potential) is ∼8 pC. This corresponds to the entry of 50 amol of Ca2+. In a cell with a volume of ∼1 pl, this is sufficient to increase the cytoplasmic Ca2+ concentration by 50 μm. Even if we assume that 99 % of all Ca2+ entering the cell is rapidly bound (Rorsman et al. 1992) it is obvious that a single action potential can be expected to elevate [Ca2+]i by several hundred nanomolar, perhaps sufficiently to initiate exocytosis (Ämmäläet al. 1993).
Consistent with previous reports from isolated B-cells (Plant, 1988b; Ashcroft & Rorsman, 1989) we also observed a TTX-sensitive Na+ current in B-cells of intact islets with a half-maximal inactivation at −100 mV and no current remaining at physiological membrane potentials (above −80 mV). The fact that the current has the same inactivation properties in intact islets as in isolated cells allows us to discard the possibility that the inactivation properties are simply an artefact due to the disruption of the islet and the function of this current remains enigmatic. It seems possible that physiological agonist(s) may act on the Na+ current thus shifting its inactivation towards a more positive membrane potential so that it can contribute to the generation of the action potentials. Addition of TTX has little effect on insulin secretion and the electrical activity of mouse B-cells (Meissner & Schmelz, 1974; Tarvin & Pace, 1981; Plant, 1988b). By contrast, TTX-sensitive Na+ channels participate actively in the generation of action potentials and initiation of insulin secretion in rat (Hiriart & Matteson, 1988), human (Barnett et al. 1995) and canine B-cells (Pressel & Misler, 1991).
Resting conductance of the B-cell vs. gap junction conductance
The amplitude of the KATP conductance measured in the intact islet was 2.6 nS when allowance was made for the fact that roughly 1 nS of the membrane conductance was accounted for by coupling to neighbouring cells. This value is ∼60 % of that observed in isolated B-cells (4.9 nS; Smith et al. 1990a). Glucose produced a concentration-dependent reduction of the KATP conductance with half-maximal inhibition being attained at a concentration of 5 mm. At glucose concentrations ≥ 10 mm nearly all (80 %; (1.5 nS - 1 nS)/(3.6 nS - 1 nS)) KATP channels are closed and a further elevation of glucose to 20 mm produces a further decrease in membrane conductance of only ∼0.5 nS. The measured gap junction conductance at 10 mm glucose was determined as 1.3 nS. Accordingly, the membrane conductance of B-cells measured in situ at insulin-releasing glucose concentrations is almost entirely accounted for by the electrical coupling to other B-cells. The minimum conductance recorded at high glucose concentration (20 mm) is ∼1 nS (Fig. 8A). The gap junction conductance between pairs of cultured B-cells has been estimated as 215 pS (Pérez-Armendariz et al. 1991). The latter value suggests that every B-cell within the intact islet is coupled to an average of five other B-cells. The significance of coupling is apparent from the observation that regenerative electrical activity in the neighbouring cells gave rise to inward currents in the voltage-clamped cell (Fig. 9). The amplitude of these current oscillations averaged 15 pA. In a cell with a resistance of > 0.8 GΩ (i.e. < 1.25 nS), such currents can be estimated to produce a depolarisation of > 10 mV. If this occurs in a cell with a membrane potential of −60 mV, such changes of the membrane potential would be sufficient to initiate activation of the voltage-gated Ca2+ channels and action potential firing. The spread of current between electrically coupled B-cells therefore most probably contributes to the synchronisation of islet electrical activity (Meissner, 1976; Eddlestone et al. 1984; Nadal et al. 1999). The reduced input resistance of the B-cells in situ at insulin-releasing glucose concentrations also makes it more difficult for stochastic events (such as random openings of ion channels) to affect the electrical activity. This is in contrast to the situation in isolated cells where the input resistance can exceed 10 GΩ. Such high input resistances imply that openings of a channel with an amplitude of 1 pA can produce a change in the membrane potential of 10 mV. This may be a cause of the chaotic bursting seen in isolated cells (Rorsman & Trube, 1986; Sherman et al. 1988).
Evidence for homologous coupling between B-cells
Electrical activity of neighbouring B-cells could be observed through the gap junctions when recordings were made from cells with the electrophysiological characteristics of B-cells. Somewhat surprisingly, such oscillations of the holding current were not seen when recording from non-B-cells (as indicated by the presence of a voltage-gated Na+ current; Fig. 9A–C). This suggests that, contrary to previous suggestions (Meda et al. 1986) but in agreement with recent [Ca2+]i measurements from B-, A- and D-cells in intact islets (Nadal et al. 1999), electrical coupling between A- and B-cells does not occur.
Usefulness of patch-clamp recordings from intact islets
Patch-clamp recordings in situ have several attractive features. The use of low-resistance patch electrodes for voltage clamping facilitates the recording of rapid current responses. The amplitude as well as the kinetic properties of the voltage-gated membrane currents can thereby be determined in situ. Such information is highly desirable in the current efforts to explain B-cell electrical activity by mathematical modelling. It is also valuable when attempting to correlate the electrophysiological behaviour to other functional parameters such as changes of [Ca2+]i and secretion. For example, this method will, when combined with capacitance measurements, allow detailed studies of the properties of exocytosis in B-cells within intact islets. Experiments in adrenal chromaffin cells suggest that there exists a closer spatial relationship between the Ca2+ channels and the exocytotic machinery in the intact tissue than indicated by experiments on dispersed cells (Moser & Neher, 1997). Finally, we point out that patch-clamp experiments on intact pancreatic islets may be necessary to establish the mechanisms participating in the generation of the oscillatory glucose-induced electrical activity (Fig. 2D). This cannot be addressed in isolated cells simply because the normal bursting pattern is not retained in dispersed B-cells (Smith et al. 1990a).
Acknowledgments
We thank the Swedish Medical Research Coucil (grant no. 8647), the Swedish Diabetes Association, the Juvenile Diabetes Foundation International, the Novo Nordisk Research Committee, the Knut and Alice Wallenberg Stiftelse, the Crafoord Foundation, the Segerfalks Stiftelse and the Medical Faculty, Lund University, for financial support.
References
- Ämmälä C, Eliasson L, Bokvist K, Larsson O, Ashcroft FM, Rorsman P. Exocytosis elicited by action potentials and voltage-clamp calcium currents in individual mouse pancreatic B-cells. Journal of Physiology. 1993;472:665–688. doi: 10.1113/jphysiol.1993.sp019966. [DOI] [PMC free article] [PubMed] [Google Scholar]
- Ashcroft FM, Rorsman P. Electrophysiology of the pancreatic β-cell. Progress in Biophysics and Molecular Biology. 1989;54:87–143. doi: 10.1016/0079-6107(89)90013-8. [DOI] [PubMed] [Google Scholar]
- Barnett DW, Pressel DM, Misler S. Voltage-dependent Na+ and Ca2+ currents in human pancreatic islet β-cells: evidence for roles in the generation of action potentials and insulin secretion. Pflügers Archiv. 1995;431:272–282. doi: 10.1007/BF00410201. [DOI] [PubMed] [Google Scholar]
- Dean PM, Matthews EK. Electrical activity in pancreatic islet cells. Nature. 1968;219:389–390. doi: 10.1038/219389a0. [DOI] [PubMed] [Google Scholar]
- Dean PM, Matthews EK. Glucose-induced electrical activity in pancreatic islet cells. The Journal of Physiology. 1970;210:255–264. doi: 10.1113/jphysiol.1970.sp009207. [DOI] [PMC free article] [PubMed] [Google Scholar]
- Eddlestone GT, Goncalves A, Bangham JA, Rojas E. Electrical coupling between cells in islets of Langerhans from mouse. Journal of Membrane Biology. 1984;77:1–14. doi: 10.1007/BF01871095. [DOI] [PubMed] [Google Scholar]
- Edwards FA, Konnerth A. Patch-clamping cells in sliced tissue preparations. Methods in Enzymology. 1992;207:208–222. doi: 10.1016/0076-6879(92)07015-g. [DOI] [PubMed] [Google Scholar]
- Finkel AS, Redman S. Theory and operation of a single microelectrode voltage clamp. Journal of Neuroscience Methods. 1984;11:101–127. doi: 10.1016/0165-0270(84)90029-3. [DOI] [PubMed] [Google Scholar]
- Henquin JC, Meissner HP. Significance of ionic fluxes and changes in membrane potential for stimulus-secretion coupling in pancreatic β-cells. Experientia. 1984;40:1043–1052. doi: 10.1007/BF01971450. [DOI] [PubMed] [Google Scholar]
- Hiriart M, Matteson DR. Na channels and two types of Ca channels in rat pancreatic β-cells identified with the reverse hemolytic plaque assay. Journal of General Physiology. 1988;91:617–639. doi: 10.1085/jgp.91.5.617. [DOI] [PMC free article] [PubMed] [Google Scholar]
- Mears D, Sheppard NF, Jr, Atwater I, Rojas E. Magnitude and modulation of pancreatic β-cell gap junction electrical conductance in situ. Journal of Membrane Biology. 1995;146:163–176. doi: 10.1007/BF00238006. [DOI] [PubMed] [Google Scholar]
- Meda P, Santos RM, Atwater I. Direct identification of electro-physiologically monitored cells within intact mouse islets of Langerhans. Diabetes. 1986;35:232–236. doi: 10.2337/diab.35.2.232. [DOI] [PubMed] [Google Scholar]
- Meissner HP. Electrophysiological evidence for coupling between β cells of pancreatic islets. Nature. 1976;262:502–504. doi: 10.1038/262502a0. [DOI] [PubMed] [Google Scholar]
- Meissner HP, Schmelz H. Membrane potential of β-cells in pancreatic islets. Pflügers Archiv. 1974;351:195–206. doi: 10.1007/BF00586918. [DOI] [PubMed] [Google Scholar]
- Moser T, Neher E. Rapid exocytosis in single chromaffin cells recorded from mouse adrenal slices. Journal of Neuroscience. 1997;17:2314–2323. doi: 10.1523/JNEUROSCI.17-07-02314.1997. [DOI] [PMC free article] [PubMed] [Google Scholar]
- Nadal A, Quesada I, Soria B. Homologous and heterologous asynchronicity between identified α-, β- and δ-cells within intact islets of Langerhans in the mouse. The Journal of Physiology. 1999;517:85–93. doi: 10.1111/j.1469-7793.1999.0085z.x. [DOI] [PMC free article] [PubMed] [Google Scholar]
- Pérez-Armendariz M, Roy C, Sparay DC, Bennett MVL. Biophysical properties of gap junctions between freshly dispersed pairs of mouse pancreatic beta cells. Biophysical Journal. 1991;59:76–92. doi: 10.1016/S0006-3495(91)82200-7. [DOI] [PMC free article] [PubMed] [Google Scholar]
- Plant TD. Properties and calcium-dependent inactivation of calcium currents in cultured mouse pancreatic B-cells. The Journal of Physiology. 1988a;404:731–747. doi: 10.1113/jphysiol.1988.sp017316. [DOI] [PMC free article] [PubMed] [Google Scholar]
- Plant TD. Na+ currents in cultured mouse pancreatic B-cells. Pflügers Archiv. 1988b;411:429–435. doi: 10.1007/BF00587723. [DOI] [PubMed] [Google Scholar]
- Pressel DM, Misler S. Role of voltage-dependent ionic currents in coupling glucose stimulation to insulin secretion in canine pancreatic islet B-cells. Journal of Membrane Biology. 1991;124:239–253. doi: 10.1007/BF01994357. [DOI] [PubMed] [Google Scholar]
- Rae J, Cooper K, Gates P, Watsky M. Low access resistance perforated patch recordings using amphotericin B. Journal of Neuroscience Methods. 1991;37:15–26. doi: 10.1016/0165-0270(91)90017-t. [DOI] [PubMed] [Google Scholar]
- Ribalet B, Beigelman PM. Calcium action potentials and potassium permeability activation in pancreatic β-cells. American Journal of Physiology. 1980;239:C124–133. doi: 10.1152/ajpcell.1980.239.3.C124. [DOI] [PubMed] [Google Scholar]
- Rojas E, Stokes CL, Mears D, Atwater I. Single-microelectrode voltage clamp measurements of pancreatic beta-cell membrane ionic currents in situ. Journal of Membrane Biology. 1995;143:65–77. doi: 10.1007/BF00232524. [DOI] [PubMed] [Google Scholar]
- Rorsman P, Ämmälä C, Berggren P-O, Bokvist K, Larsson O. Cytoplasmic calcium transients due to single action potentials and voltage-clamp depolarizations in mouse pancreatic B-cells. EMBO Journal. 1992;11:2877–2884. doi: 10.1002/j.1460-2075.1992.tb05356.x. [DOI] [PMC free article] [PubMed] [Google Scholar]
- Rorsman P, Bokvist K, Ämmälä C, Arkhammar P, Berggren P-O, Larsson O, Wåhlander K. Activation by adrenaline of a low-conductance G protein-dependent K+-channel in mouse pancreatic B cells. Nature. 1991;349:77–79. doi: 10.1038/349077a0. [DOI] [PubMed] [Google Scholar]
- Rorsman P, Trube G. Calcium and delayed potassium currents in mouse pancreatic β-cells under voltage-clamp conditions. The Journal of Physiology. 1986;374:531–550. doi: 10.1113/jphysiol.1986.sp016096. [DOI] [PMC free article] [PubMed] [Google Scholar]
- Sherman A. Contributions of modeling to understanding stimulus-secretion coupling in pancreatic β-cells. American Journal of Physiology. 1996;271:E362–372. doi: 10.1152/ajpendo.1996.271.2.E362. [DOI] [PubMed] [Google Scholar]
- Sherman A, Rinzel J, Keizer J. Emergence of organized bursting in clusters of pancreatic β-cells by channel sharing. Biophysical Journal. 1988;54:411–425. doi: 10.1016/S0006-3495(88)82975-8. [DOI] [PMC free article] [PubMed] [Google Scholar]
- Smith PA, Ashcroft FM, Rorsman P. Simultaneous recordings of glucose dependent electrical activity and ATP-regulated K+-currents in isolated mouse pancreatic β-cells. FEBS Letters. 1990a;261:187–190. doi: 10.1016/0014-5793(90)80667-8. [DOI] [PubMed] [Google Scholar]
- Smith PA, Bokvist K, Arkhammar P, Berggren P-O, Rorsman P. Delayed rectifying and calcium-activated K+ channels and their significance for action potential repolarization in mouse pancreatic β-cells. Journal of General Physiology. 1990b;95:1041–1059. doi: 10.1085/jgp.95.6.1041. [DOI] [PMC free article] [PubMed] [Google Scholar]
- Smolen P, Rinzel J, Sherman A. Why pancreatic islets burst but single β cells do not. The heterogeneity hypothesis. Biophysical Journal. 1993;64:1668–1680. doi: 10.1016/S0006-3495(93)81539-X. [DOI] [PMC free article] [PubMed] [Google Scholar]
- Tarvin JT, Pace CS. Glucose-induced electrical activity in the pancreatic β-cell: effect of veratridine. American Journal of Physiology. 1981;240:C127–134. doi: 10.1152/ajpcell.1981.240.3.C127. [DOI] [PubMed] [Google Scholar]


