

Abstract
A combination of patch-clamp, amperometric and fluorimetric methods were used to investigate the Ca2+ dependence and kinetics of secretion from pancreatic β-cells elicited by voltage-gated Ca2+ entry.
Whether measured by the change in cell capacitance or by amperometric detection of 5-hydroxytryptamine (5-HT) release, the voltage dependence of the amount of secretion mirrored that of both the peak Ca2+ current and Ca2+ entry.
The magnitude of secretion elicited by a single pulse could be entirely accounted for by a readily releasable pool of ≈200 vesicles. Neither depression nor potentiation of release was observed with 0·1 Hz pulse trains.
Transient amperometric currents were detected, which occurred independently of each other and were attributed to the fusion of single vesicles.
The time course of the macroscopic amperometric current could be accurately reconstructed by convolution of the all-events latency distribution and the unitary amperometric current.
In response to membrane depolarisation, secretion was initiated with a variable latency: ≈95 % of the first secretory events occurred at least 50 ms after the start of the voltage pulse (and Ca2+ influx). Secretion fell rapidly on membrane repolarisation, even though the average intracellular calcium concentration ([Ca2+]i) was still elevated.
The [Ca2+] in the locality of the release site was estimated from the all-events latency distribution. [Ca2+] rose during a voltage pulse and secretion was elicited at > 0·4 μm and peaked at ≈2–10 μm.
A rise in the intracellular calcium concentration ([Ca2+]i) is a key signal in the initiation of insulin secretion from the pancreatic β-cell. This increase principally results from Ca2+ influx through voltage-gated L-type Ca2+ channels located in the plasma membrane, which open in response to membrane depolarisation evoked by secretagogues (Ashcroft et al. 1994). Although numerous studies have examined the relationship between [Ca2+]i and insulin secretion (see Hellman et al. 1992, for review), only a few have explored the kinetics of release from single β-cells at high time resolution (Gillis & Misler, 1992; Ämmäläet al. 1993; Proks et al. 1996). All of these studies employed the capacitance method to measure exocytosis, which detects the increase in cell capacitance associated with the fusion of the secretory vesicle(s) with the plasma membrane. However, because of the large changes in membrane conductance that occur when voltage-gated channels are activated, this method cannot be used to measure secretion during the voltage step used to evoke exocytosis (Gillis, 1995). Furthermore, the capacitance method assumes that any endocytosis that occurs during a voltage pulse is sufficiently slow for it to be ignored. An additional problem with this method is that the identity of the organelle/s from which the fusing membrane originates is assumed to be that of the secretory vesicle, although this may not necessarily be the case (Oberhauser et al. 1996).
The problems associated with the capacitance method can be overcome by concomitantly measuring secretion using amperometry. In many endocrine cells, the contents of secretory vesicles are electrochemically active, that is they will readily undergo oxidation at an electrode held at a potential in excess of the redox potential. Consequently, the release of granule contents can be detected by the amperometric current associated with this process (Chow et al. 1992). Incubation of pancreatic β-cells with solutions containing the electrochemically active amine 5-hydroxytryptamine (5-HT) results in the co-localisation of 5-HT with insulin within the secretory granules (Ekholm et al. 1971). Because 5-HT is co-released with insulin (Gylfe, 1978), amperometry can be used to monitor the secretion of 5-HT, and thereby insulin, from the pancreatic β-cell (Smith et al. 1995).
In this study we have used a combination of amperometric, voltage-clamp and capacitance methods to investigate quantal secretory events in single β-cells, elicited by Ca2+ influx during voltage-step depolarisations. Some preliminary results have already been published in abstract form (Smith et al. 1994).
Table 1.
Glossary of symbols
| N5-HT | Total number of molecules of 5-HT released per quantal event |
| r | Distance between the 5-HT source and the amperometric electrode |
| D | Diffusion coefficient for 5-HT |
| I5-HT | Macroscopic (or ensemble) 5-HT oxidation current |
| i5-HT | Oxidation current associated with a unitary event |
| Ld | Latency distribution of all events |
| Np | Number of unitary events detected per pulse |
| Q5-HT | Total 5-HT detected during a pulse |
| ICa | Ca2+ current |
| ICa,p | Peak Ca2+ current |
| QCa | Integrated Ca2+ entry during a step depolarisation |
| ΔCm | Change in capacitance associated with a step depolarisation |
| ΔCm,c | Calculated change in capacitance |
| [Ca2+]i | Average bulk intracellular Ca2+ concentration |
| [Ca2+]e | Ca2+ concentration at the exocytotic site |
METHODS
Cell preparation
NMRI mice were killed by cervical dislocation and pancreatic islets isolated by collagenase digestion. Islets were dispersed into single β-cells by low Ca2+ treatment (Smith et al. 1995). Cells were plated onto plastic Petri dishes or glass coverslips (for fluorescence experiments) and maintained for 1–4 days in RPMI 1640 tissue culture medium (Gibco), supplemented with 10 % fetal calf serum, 10 μU ml−1 penicillin and 10 μg ml−1 streptomycin at 37°C in a humidified atmosphere containing 5 % CO2.
Current and capacitance recordings
Because it maintains intracellular metabolism and second messenger systems intact, the perforated-patch configuration of the patch-clamp technique was used to measure whole-cell currents and changes in cell capacitance. The holding potential was −70 mV.
Ca2+ currents (ICa) were elicited by one of three pulse protocols: (i) a series of incremental voltage pulses from −40 to +60 mV, in +10 mV steps of 500 ms duration; (ii) a series of pulses to +20 mV ranging in length from 50 to 550 ms in 100 ms steps; or (iii) a train of voltage pulses to +20 mV of 200 ms duration. In all cases, voltage pulses were applied at 0.1 Hz.
Changes in cell capacitance and conductance were measured as described previously (Ämmäläet al. 1993). A 20 mV root mean square (r.m.s.) 800 Hz sine wave was added to the holding potential and ten cycles averaged for each data point. The resulting current was analysed at two orthogonal phase angles, with a temporal resolution of 100 ms per point. The phase angle was determined empirically for each experiment by varying the Gseries and Cslow knobs of the patch-clamp amplifier. Capacitance was calibrated by measuring the response to small changes in Cslow. Exocytosis was evoked by voltage-clamp depolarisations to elicit voltage-gated Ca2+ influx.
Currents, conductance and capacitance were all measured using an EPC7 patch-clamp amplifier (List Electronic, Darmstadt, Germany), filtered at 500 Hz, digitised at 1 kHz using a Digidata 1200 interface (Axon Instruments, Foster City, USA) and stored on computer.
Amperometry
Carbon-fibre electrodes (CFEs) were fabricated, and amperometric currents detected, as described previously (Smith et al. 1995). The carbon fibres employed in this study were 8 μm in diameter and had an exposed length of between 10 and 20 μm, comparable to the diameter of a single β-cell (10–12 μm). The CFE was held at a potential of +600 mV to oxidise 5-HT and was placed such that it just touched the surface of the β-cell under study.
Amperometric currents were filtered at 50–200 Hz using an 8-pole Bessel filter, digitised at 1 kHz and analysed using in-house software. Only positive current transients which exceeded baseline by > 5 times the r.m.s. noise for > 10 ms were taken as secretory events, a criterion which gives a probability of false event detection of < 0.1 % per sample point. For construction of all-events latency histograms, latencies were determined manually. Using this method, the minimum detectable interval between events was 5 ms. This procedure was necessary because of changes in the baseline current produced by the superimposition of amperometric events.
Calcium measurements
To monitor changes in [Ca2+]i we used the calcium fluorophore fluo-3, as described previously (Smith et al. 1995). Cells were loaded with 1 μm fluo-3 AM ester (Molecular Probes, OR, USA) at room temperature (21–23°C) for 20–30 min in Hanks’ solution supplemented with 2.8 mm glucose. The dye was excited at 480 nm and fluorescence was monitored at 530 nm. The fluorescence signal was filtered at 1–10 Hz and stored on digital audiotape pending later analysis. Unless stated otherwise, the fluorescence signals were not calibrated in terms of [Ca2+] but are presented as percentage changes in signal (% Fluor), with the prestimulation (basal) level set at 100 %. Because fluo-3 has a Kd for Ca2+ of 0.4-2.5 μm (Molecular Probes), changes in fluorescence are expected to depend quasi-linearly on [Ca2+]i over the range of concentrations expected in this study (0.1-10 μm) (Rorsman et al. 1992).
To correlate changes in [Ca2+]i with secretion, the time course of the filtered fluorescence signal was deconvolved with the transfer function of the signal filter to obtain the time course of the original signal. Control studies showed that this procedure restored the signal to within 5 % of its original time course.
Solutions
The standard extracellular (bath) solution contained (mm): 108 NaCl, 5.6 KCl, 1.2 MgCl2, 2.6 CaCl2, 10 Hepes (pH 7.4 with NaOH) and 30 TEACl (to block voltage-gated K+ currents). To aid detection of exocytosis, 5 μm forskolin was added to the bath solution; this potentiates secretion from β-cells by elevating intracellular cAMP (Ämmäläet al. 1993; Smith et al. 1995). For perforated-patch whole-cell recordings, the pipette was filled with (mm): 76 Cs2SO4, 10 KCl, 10 NaCl, 40 sucrose, 5 Hepes (pH 7.4 with CsOH) and 1 MgCl2. Perforation was produced by inclusion of 0.24 mg ml−1 amphotericin B in the pipette solution. Perforation was considered adequate when the series conductance exceeded 33 nS. The bath had a volume of 0.2 ml and was continuously perfused at a rate of 1–2 ml min−1. All experiments were carried out at 31–33°C.
Data display
Unless otherwise indicated, data in the text are expressed as means ± one s.e.m., and the symbols in the figures indicate the mean and the vertical bars one s.e.m.P < 0.05 was considered significant.
RESULTS
Voltage dependence of the amperometric current
Figure 1A–C illustrates the Ca2+ currents, changes in cell capacitance and associated amperometric currents elicited by a series of depolarising voltage pulses from −20 to +50 mV in a single pancreatic β-cell. Because it is not possible to monitor the capacitance change during the depolarisation, the increase in cell capacitance is observed only after the voltage pulse. The time course of secretion during the pulse may, however, be observed from the amperometric current trace. This revealed that the release of 5-HT was not initiated until after the Ca2+ current had started to decay and that 5-HT release continued for some time after the membrane had been repolarised.
Figure 1. Representative measurements of secretion and Ca2+ currents in a single β-cell.
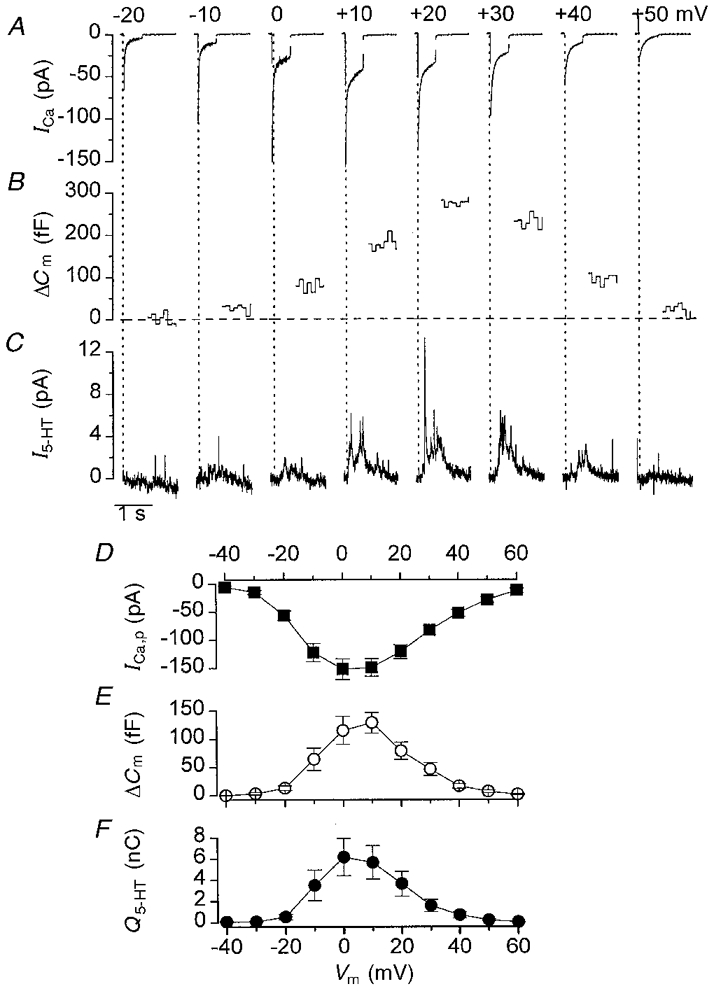
A-C, calcium currents (ICa; A), changes in cell capacitance (ΔCm; B) and amperometric currents (I5-HT; C) recorded simultaneously from a single β-cell in response to 500 ms voltage steps from −70 mV to the potentials indicated. Pulses were applied at 0.1 Hz. Because it is not possible to record ΔCm during the pulse, this part of the record is missing. The dotted vertical lines indicate the start of the voltage pulse. Horizontal dashed line in B indicates baseline. D-F, voltage dependence of the peak calcium current (ICa,p), change in cell capacitance and integrated amperometric signal (Q5-HT). The values are means ±s.e.m. of data obtained from 15 cells.
The voltage dependence of the Ca2+ current, the associated increase in cell capacitance, and the integral of the amperometric current transient is shown in Fig. 1D–F. As previously reported (Gillis & Misler, 1992; Ämmäläet al. 1993), the voltage dependence of the capacitance signal mirrored that of the peak Ca2+ current. Both were initiated at ∼-30 mV, reached their maximum between 0 and 10 mV and declined at more positive potentials. It is clear that 5-HT release also showed a similar voltage dependence, consistent with the idea that 5-HT release is dependent on Ca2+ entry rather than depolarisation per se.
Time course of the amperometric events
When the rate of secretion was low (as indicated by a small capacitance change), the amperometric current transients appeared as discrete events (Fig. 2A). In contrast, when the rate of exocytosis was greater, the amperometric current was often composed of the summation of many events (Fig. 2B).
Figure 2. Analysis of unitary secretion during the pulse.
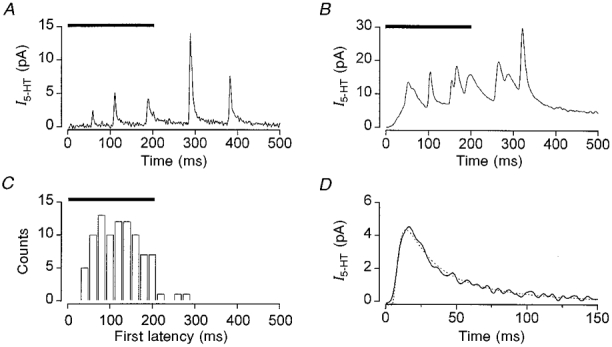
Amperometric currents (I5-HT) elicited by a single voltage pulse from −70 to +20 mV applied for the time indicated by the horizontal bars. A, typical individual record consisting of discrete events. B, amperometric current recorded in response to a single voltage pulse, which demonstrates the summation of events that occurs at high release rates. C, representative distribution of first latencies compiled from the secretion elicited by 95 pulses to +20 mV (data are for a single cell). D, expansion of a representative unitary event (continuous line) showing the fit of eqn (1) (dotted line) with N5-HT of 5.2 × 10⁵ molecules and r of 6.4 μm.
Individual amperometric transients were characterised by a rapid rising phase and slow monophasic decay (Fig. 2A and D) and probably represent the release of 5-HT associated with the fusion of a single secretory granule, i.e. a unitary or quantal event (Wightman et al. 1991; Chow et al. 1992; Smith et al. 1995). We did not observe a slowly rising ‘foot’ to the unitary current transients, as has been reported previously for β-cells (Zhou & Misler, 1996) and chromaffin cells (Chow et al. 1992). In our studies, any likeness to a foot could be accounted for by the superimposition of a large fast transient on a smaller, slower, event (Smith et al. 1995). One possible reason for not observing a foot is that it may be obscured by noise. To explore this possibility, we constructed ensemble currents by averaging unitary amperometric events. However, we were still unable to detect a ‘foot process’ preceding the ensemble unitary current (Fig. 3, and 3 other cells). The unitary events recorded in the present study had rise times, decay times, amplitudes and integral charge (data not shown) similar to those already documented for β-cells not subject to voltage-clamp conditions (Smith et al. 1995; Zhou & Misler, 1996).
Figure 3. Variation of unitary events.
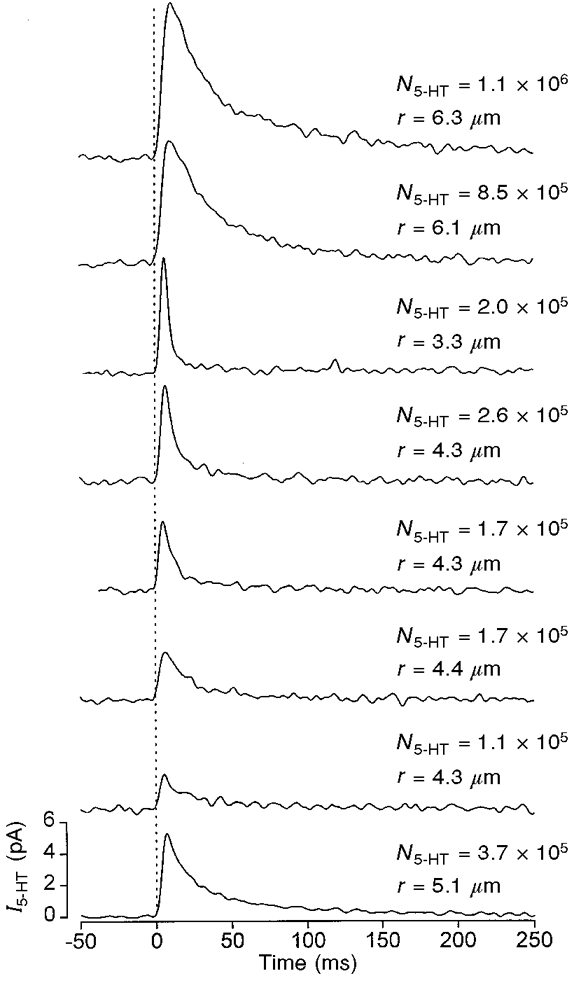
Typical unitary amperometric currents elicited by voltage pulses from −70 to +20 mV. Events were chosen on the basis of similar rise times and are aligned (as indicated by the dotted line) by the onset of the transient. The bottom trace indicates the ensemble current produced by averaging the 7 unitary events shown. Fitting eqn (1) to each event individually gave the parameter values indicated. The mean values for N5-HT ((4 ± 2) × 105 molecules) and r (4.7 ± 2 μm) are similar to those obtained for the fit of eqn (1) to the mean event (3.7 × 10⁵ molecules, 5.1 μm).
The distribution of the latency between the start of the depolarisation and the onset of the first amperometric transient (first latency) is shown in Fig. 2C. In general, the first amperometric transient was initiated with a delay after the start of the depolarisation: for a voltage step to +20 mV, 95 % of transients occurred at least 50 ms after the start of the pulse (5th percentile; mean, 148 ± 6 ms). Most amperometric transients also occurred during the voltage pulse itself (i.e. within the first 200 ms).
The latency distribution for all amperometric transients evoked by the depolarisation (all-events latency, Ld) is a measure of the probability of release. This is obtained simply by measuring the latency of all of the individual current transients when the rate of secretion is low (Fig. 10). In most experiments, however, the rate of 5-HT release was so great that it was not possible to resolve unitary current transients, a situation which prevented direct measurement of Ld. In these cases, we estimated the distribution of quantal events by deconvolution of the amperometric signal using a method similar to that employed for the analysis of endplate currents at the neuromuscular junction (Van der Kloot, 1988). This technique requires a knowledge of the average time course of the unitary event, and the demonstration that the events occur independently of each other.
Figure 10. Latency distributions.
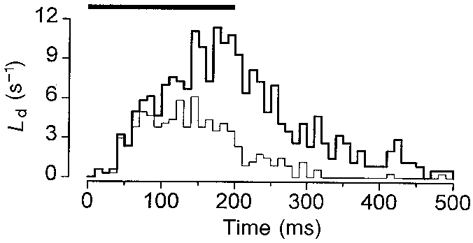
Pooled latency distribution measured manually from secretion elicited by 343 pulses (66 failures), from −70 to +20 mV in 7 separate cells. The duration of the pulse is indicated by the horizontal bar. The thick line indicates the all-events latency distribution (total of 751 events; mean, 235 ± 7 ms; 68 and 193 ms for the 5th and 50th percentile, respectively). The thin line is the associated first latency distribution (277 events; mean, 148 ± 6 ms; 50 and 137 ms for the 5th and 50th percentile, respectively).
Estimation of the time course of the average unitary event
The time course of the average unitary amperometric current was estimated using a diffusion model that assumes a one-dimensional diffusional flux into an infinite absorbing plane (the carbon-fibre electrode) which lies parallel to the surface of an infinite reflecting plane (the β-cell) from which 5-HT is instantaneously released (after Chow et al. 1992). For our calculations, we assumed that the CFE absorbed and oxidised the majority of released amine. We found that the first term of the analytical solution to this problem (by the method of image planes; Chow et al. 1992) was sufficient to give a good description of our data. The time course of the unitary amperometric current, i5-HT(t), is given by:
| (1) |
where N5-HT is the total number of 5-HT molecules released, r is the distance (in μm) between the source of 5-HT and the CFE, t is the time (in ms) from the start of the unitary event, D is the diffusion coefficient for 5-HT in free solution (0.6 μm2 ms−1; Gerhardt & Adams, 1982), e is the elementary charge (1.6 × 10⁻¹⁹ C), and z is the valency of 5-HT oxidation (+4; Bruns & Jahn, 1995). Equation (1) was fitted to individual unitary events by using just two free parameters (N5-HT and r; Figs 2D, dotted line, and 3). For the cell shown in Fig. 6, the values obtained for N5-HT and r were normally distributed (data not shown; n= 73 transients) with mean values of (1.3 ± 0.1) × 106 molecules (median, 1 × 10⁶ molecules) and 7.9 ± 0.1 μm (median, 7.9 μm), respectively. Neither N5-HT nor r varied as a function of time (data not shown). Similar results were obtained for another 20 cells similarly analysed (see also Fig. 3).
Figure 6. Representative analysis of secretion during the pulse.
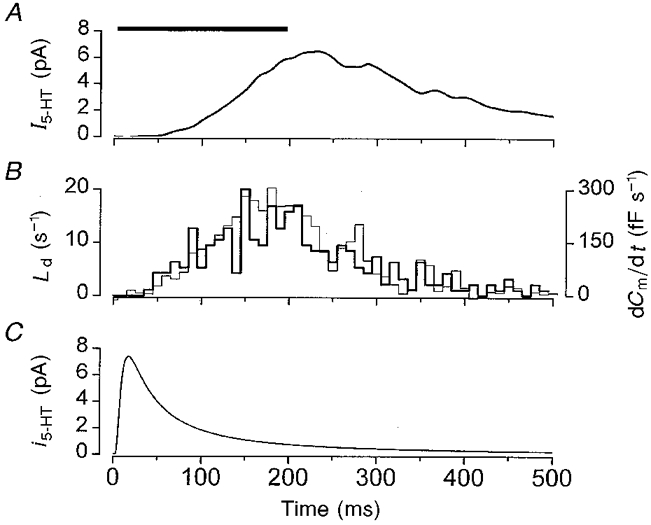
A, ensemble amperometric current (I5-HT). B, all-events latency distribution (Ld). The thick line indicates the measured raw data. The thin line is the calculated Ld obtained by deconvolution of the ensemble amperometric current shown in A with i5-HT shown in C. C, average time course of the unitary amperometric event, i5-HT, calculated using eqn (1) with values given in the text. All measurements were recorded from the same cell and represent the average responses to 95 consecutive voltage steps from −70 to +20 mV, of 200 ms duration applied at 0.1 Hz. The duration of the pulse is indicated by the horizontal bar.
Unitary events occur independently
We next examined whether the unitary events elicited by the voltage step occurred independently of each other (del Castillo & Katz, 1954; Chow et al. 1992). If this is the case, then the number of unitary events evoked per pulse will follow a Poisson distribution (del Castillo & Katz, 1954) and will be given by:
| (2) |
where fR is the expected count for R events per pulse, μ is the mean number of events per pulse (average quantal content, 2.2 ± 0.3 for 6 cells), and O is the total number of stimulus pulses (trials). For the analysis shown in Fig. 4A, the number of events showed a clear Poisson distribution (χ2 < 9, P > 0.1). Furthermore, the variance of the distribution was identical to its mean, as expected for a Poisson distribution (2.9 events per pulse). In five other cells examined, each with > 25 consecutive pulses, the number of events per pulse also followed a Poisson distribution. There was no periodic correlation between successive unitary events when assessed using the autocorrelation function (Fig. 4B; similar results were obtained for 5 other cells). We conclude that the exocytosis of β-cell granules occurs independently. Additional support for this idea is provided by the finding that the first latency was reciprocally dependent on the quantal content, i.e. the number of amperometric events that occurred during the pulse (Np; Fig. 4C) (for an explanation of this relationship see Barrett & Stevens, 1972).
Figure 4. Statistical analysis of secretion during a pulse.
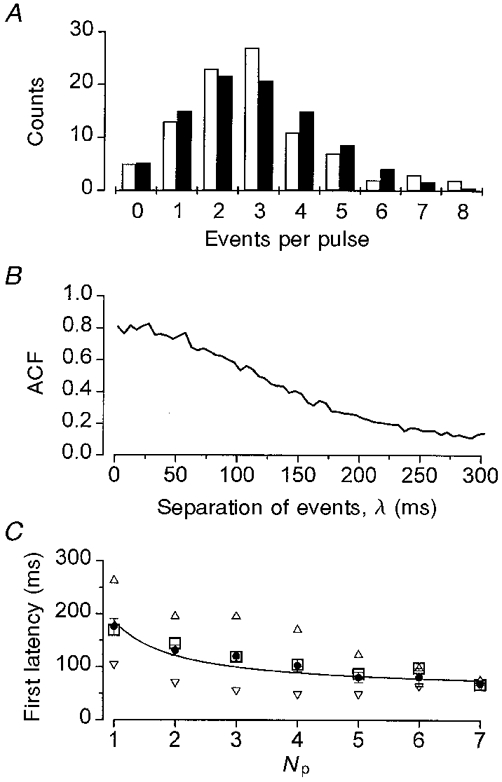
A, Poisson analysis of the number of unitary events per pulse. □, observed counts; ▪, expected counts calculated from eqn (2) with μ= 2.9 and O= 93. B, autocorrelation function (ACF) for the latency distribution shown in Fig. 6B. C, relationship between the mean first latency ±s.e.m. (•) and the number of events per pulse (Np) for the same data as in A. The median (□), 5th (▿) and 95th (▵) percentiles are also shown. The continuous line is a fit of the data with the empirical equation: First latency = Latmin+ (Lat1 - Latmin)/Np, with Latmin= 56 ms and Lat1= 186 ms. Latmin is the minimum latency and Lat1 is the latency observed for pulses with only one event. The mean values of Latmin and Lat1 from 5 cells were 75 ± 79 and 196 ± 10 ms, respectively.
Both facilitation and depression of secretion has been reported to occur with pulse trains of > 1 Hz (Ämmäläet al. 1993). We therefore determined whether exocytosis was stable during a pulse train of 0.1 Hz. For the cell illustrated in Fig. 5, the peak calcium current (-115 ± 1.9 pA) and the integrated Ca2+ entry (22 ± 0.2 pC) elicited by 25 consecutive pulses to +20 mV, changed little during the train. In contrast, the extent of secretion varied from pulse to pulse. For most pulses, the amount of 5-HT released (283 ± 27 fC pulse−1) closely correlated with the change in cell capacitance (34 ± 3 fF pulse−1; Fig. 5B). The first latency was also highly variable from pulse to pulse (Fig. 5C), as were the number of amperometric events per pulse (2.9 ± 0.3 events pulse−1; Fig. 5D). Both these parameters showed no consistent change throughout the pulse train. This was confirmed by performing runs tests of above and below the medians (Sokal & Rohlf, 1995). The number of runs observed was the same as that expected for a random sequence of events. Similar results were obtained in five other cells. This pulse-to-pulse variation in secretion can be explained by the fact that exocytosis is not localised specifically to the CFE but occurs randomly over the whole surface of the cell. Consequently, when the secretory rate is low, the probability of detection will also be low, resulting in a high variation in the number of secretory events detected.
Figure 5. Secretion is stable during a train of 0.1 Hz pulses.
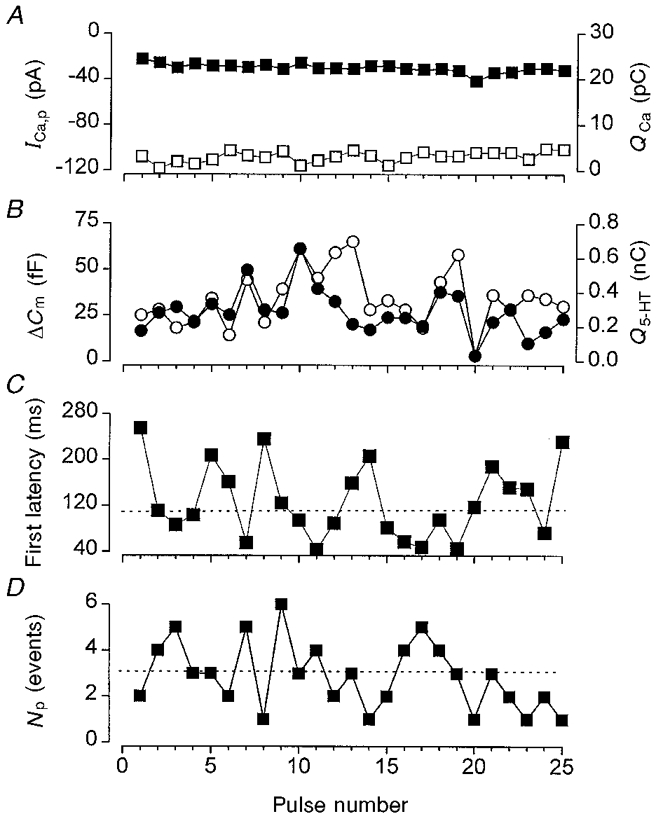
A, peak Ca2+ current (ICa,p; □) and integrated Ca2+ entry (QCa; ▪) elicited by 25 consecutive voltage pulses from −70 to +20 mV, of 200 ms duration applied at 0.1 Hz. B, change in cell capacitance (ΔCm; ○) and integrated 5-HT release (Q5-HT; •) elicited during the same train of pulses as in A. C, first latency for secretion elicited by each pulse during the same train of pulses as in A. D, number of unitary secretory events (Np) detected per pulse by the CFE. In C and D, the dotted lines mark the median values.
We conclude that, although the amount of secretion during a pulse is somewhat variable, under our experimental conditions the secretion during a pulse is independent of the position of the pulse within the train. This fact allows us to analyse data averaged from trains of pulses. Furthermore, the analyses presented above demonstrate that the unitary events occur independently of each other, and have a time course that can be easily quantified.
Estimation of the time course of secretion by deconvolution
The macroscopic 5-HT current transient (I5-HT) results from the summation of a variable number of unitary events (i5-HT). It has a time course, I5-HT(t), that is determined by the probability of a vesicle being released at time t after the start of the depolarising pulse and the time course of the unitary amperometric current, i5-HT(t) (Van der Kloot, 1988). The probability of release is given by the latency distribution of all events, Ld (Chow et al. 1994). I5-HT(t) is given by the convolution integral:
| (3) |
where λ is the delay variable, and i5-HT(t) is calculated from eqn (1) using the mean values of N5-HT and r obtained from fitting unitary events observed in the same cell (see Fig. 3 for an example, and for validation of this method).
To check the accuracy of the convolution method we first performed the analysis using an ensemble record as this can be considered equivalent to a single macroscopic I5-HT trace which consists of the summation of many events. A representative analysis is illustrated in Fig. 6 and shows an ensemble amperometric current constructed by summing a total of 274 unitary events evoked by a train of 95 consecutive voltage steps to +20 mV. The all-events latency distribution, Ld, was also determined by direct measurement of the individual unitary events (Fig. 6B). Figure 6C illustrates the time course of i5-HT calculated using eqn (1) and the mean values of N5-HT and r obtained from fitting eqn (1) to 73 discrete events from the same cell.
Deconvolution of I5-HT with i5-HT produced a time course of secretory rate (Fig. 6B, thin line) that was almost identical to that determined by discrete measurement (Fig. 6B, thick line). A major requirement of the deconvolution analysis is that the amplitudes of the quantal event are very similar (del Castillo & Katz, 1954; Van der Kloot, 1988). Because N5-HT and r were only marginally skewed from a Gaussian distribution, the similarity of the derived Ld to that measured suggests that use of the average i5-HT is acceptable and meets this requirement (Fig. 3). By deconvolution of I5-HT with i5-HT, it is therefore possible to obtain an accurate estimate of the all-events latency distribution during the pulse.
Analysis of secretion and bulk calcium
The relationship between the Ca2+ current, the average cytosolic Ca2+ concentration and secretion detected by both cell capacitance and amperometry is examined in Fig. 7. Although both Ca2+ entry (Fig. 7A) and the rise in the average [Ca2+]i (Fig. 7B) began almost immediately on depolarisation, in this particular cell the minimum delay (first latency) to the onset of secretion was 35 ms (Fig. 7E). An index of the rate of secretion can be obtained from the all-events latency distribution, Ld. As Fig. 7E shows, this was maximal at the end of the voltage pulse, the time at which the average cytosolic Ca2+ concentration was highest. It is unlikely that Ca2+ release from intracellular stores contributed to the Ca2+ transient associated with voltage-gated entry, because this phenomenon does not occur in β-cells from other species (Dukes & Cleemann, 1993).
Figure 7. Correlation of secretion with intracellular Ca2+.
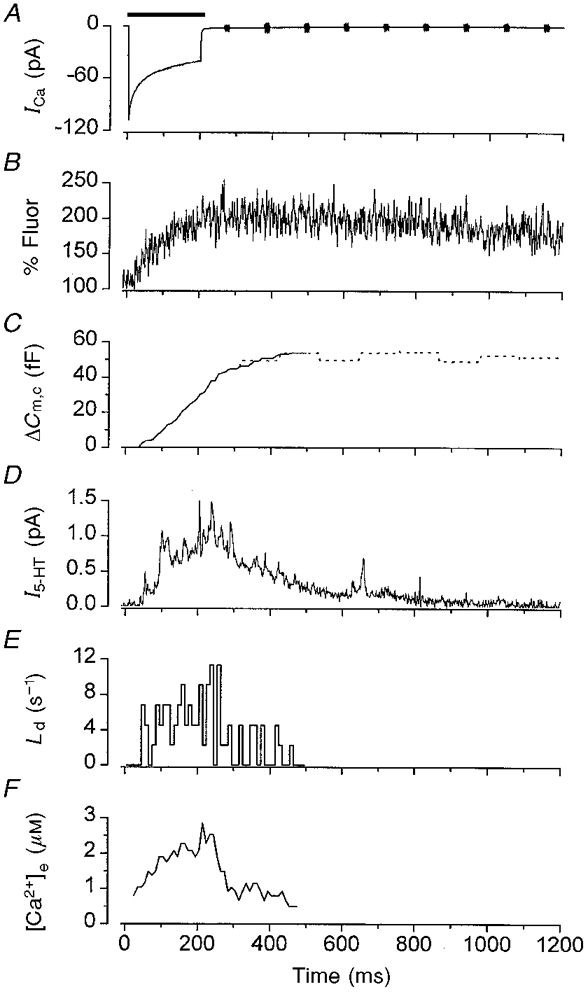
Ensemble averages of the Ca2+ current (ICa; A), fluo-3 fluorescence (B), change in cell capacitance (continuous line, calculated; dotted line, measured) (C) and amperometric current (I5-HT; D) recorded simultaneously from a single β-cell in response to 27 consecutive 200 ms voltage pulses, applied at 0.1 Hz, from −70 to +20 mV. The duration of the pulse is indicated by the horizontal bar. E, all-events latency (Ld) histogram measured from the original amperometric records averaged in D. F, intracellular Ca2+ concentration at the release site ([Ca2+]e) estimated from the rate of change of ΔCm illustrated in C using eqn (4) with parameters given in the text.
Following repolarisation, Ca2+ entry ceased within 1 ms (Fig. 1, and Rorsman & Trube, 1986), but the average [Ca2+]i did not return to the prestimulatory level until ∼5 s later. This rate of recovery was slower than that at which secretion declined, as the amperometric signal returned to baseline within ∼1000 ms. Likewise, Ld also declined rapidly. These data are consistent with the idea that the Ca2+ indicator does not accurately reflect the [Ca2+] at the site of exocytosis and suggest that the increase in [Ca2+] at the release sites rapidly collapses on repolarisation. Our observations of the changes in [Ca2+] are similar to those previously reported for β-cells using the ratiometric Ca2+ fluorescent probe indo-1 (Rorsman et al. 1992). Loading of the β-cell with fluo-3 produced no obvious effect on the first, or all-events, latency distributions (data not shown), which demonstrates that if the fluoroprobe acts as a mobile Ca2+ buffer it does not have a marked effect on the timing of secretion (for a full discussion of this point see Neher, 1998).
Because Ld is a measure of the rate of secretion it can be used to calculate the time course of ΔCm (ΔCm,c) and dCm/dt during the pulse (Fig. 6B). In turn, dCm/dt can then be used to estimate the Ca2+ concentration in the vicinity of the exocytotic sites, [Ca2+]e (Chow et al. 1994). To calculate ΔCm,c we assumed that no endocytosis occurred during the pulse, that the capacitance change only reflected the exocytosis of vesicles that contained 5-HT (Oberhauser et al. 1996), and that all the vesicles released had a similar unitary capacitance and 5-HT content (Albillos et al. 1997). Ld was integrated to give the time course of the amount of secretion measured at the CFE. This value was then scaled using the average change in ΔCm measured after the pulse, to yield the time course of ΔCm,c during the pulse (Chow et al. 1994), which is illustrated as the continuous line in Fig. 7C. It closely follows the measured value of ΔCm after the pulse (Fig. 7C, dotted line).
In the particular cell illustrated, the ratio of ΔCm/Np was ∼21 fF event−1. If we assume that a single secretory event contributes a capacitance of ∼2 fF (Ämmäläet al. 1993), we can conclude that the CFE detected ∼10 % of the total secretion from this cell.
Estimation of calcium concentration at the release site
In chromaffin cells, the calcium concentration at the exocytotic site, [Ca2+]e, has been estimated for the secretion of catecholamines elicited by voltage-gated Ca2+ entry (Chow et al. 1994). This was achieved by calculating the time course of ΔCm during the pulse, using data from simultaneous capacitance and amperometric measurements of secretion as described above. [Ca2+]e was then extrapolated from the previously measured kinetic relationship between dCm/dt and [Ca2+]i.
Although a kinetic model of secretion has not been formulated for the β-cell, the relationship between [Ca2+]i and dCm/dt has been determined (Ämmäläet al. 1993; Bokvist et al. 1995; Proks et al. 1996). The dependence of the rate of exocytosis on [Ca2+]e can be described by:
| (4) |
(Bokvist et al. 1995; Proks et al. 1996), where dCm/dtmax is the maximum rate of secretion, [Ca2+]e is the Ca2+ concentration sensed by the exocytotic machinery, EC50 is the concentration of [Ca2+]e that gives the half-maximal rate of secretion, and h is an index of co-operativity. In using eqn (4) to estimate the time course of the change in [Ca2+]e, it is assumed that the kinetics of secretion (excluding the first latency) are determined solely by the time course of the change in [Ca2+]e, and that vesicle release occurs independently. For our calculations, we used values of 1.6 μm and 2.5 for EC50 and h, respectively (after Proks et al. 1996). For dCm/dtmax, we used the maximum value observed in the present study: ∼300 fF s−1. The time course of the change in [Ca2+]e estimated from the secretion elicited by a voltage pulse to +20 mV is illustrated in Fig. 7F. In this example, secretion was initiated once the Ca2+ concentration at the release site reached ∼0.6 μm. The increase in [Ca2+]e saturated towards the end of the pulse at a concentration of ∼2.5 μm, reflecting the saturation observed in the macroscopic amperometric current. On termination of the voltage step, [Ca2+]e decayed to a quasi-steady level of ∼0.5 μm within 500 ms. However, because of the method employed to estimate [Ca2+]e, its time course cannot be estimated reliably beyond the period of vesicle release (∼500 ms for the record shown).
Effect of voltage on the relationship between [Ca2+]e and exocytosis
The relationship between secretion and [Ca2+]e was explored further by performing a similar analysis for data evoked by voltage pulses of differing amplitudes and duration.
Because of the variability in the amount of secretion, which is more apparent for pulses that evoke only small Ca2+ currents, we averaged the amperometric currents and the capacitance changes from several cells. From this averaged data, we then constructed an all-events latency distribution (Ld) by deconvolution. The average time courses of the measured amperometric current, the calculated change in membrane capacitance and the estimated change in [Ca2+] at the release site, evoked by pulses of varying amplitude and duration, are shown in Fig. 8. Figure 8A–C shows that the peak amplitude of the amperometric current, ΔCm,c and [Ca2+]e varied as a function of the duration of the voltage pulse. All three parameters also varied with the amplitude of the depolarisation (Fig. 8D–F), the rate of rise, and the final amplitude, of each response first increasing and then decreasing as the voltage step was made more positive.
Figure 8. Analysis of secretion elicited by pulses of varying duration and amplitude.
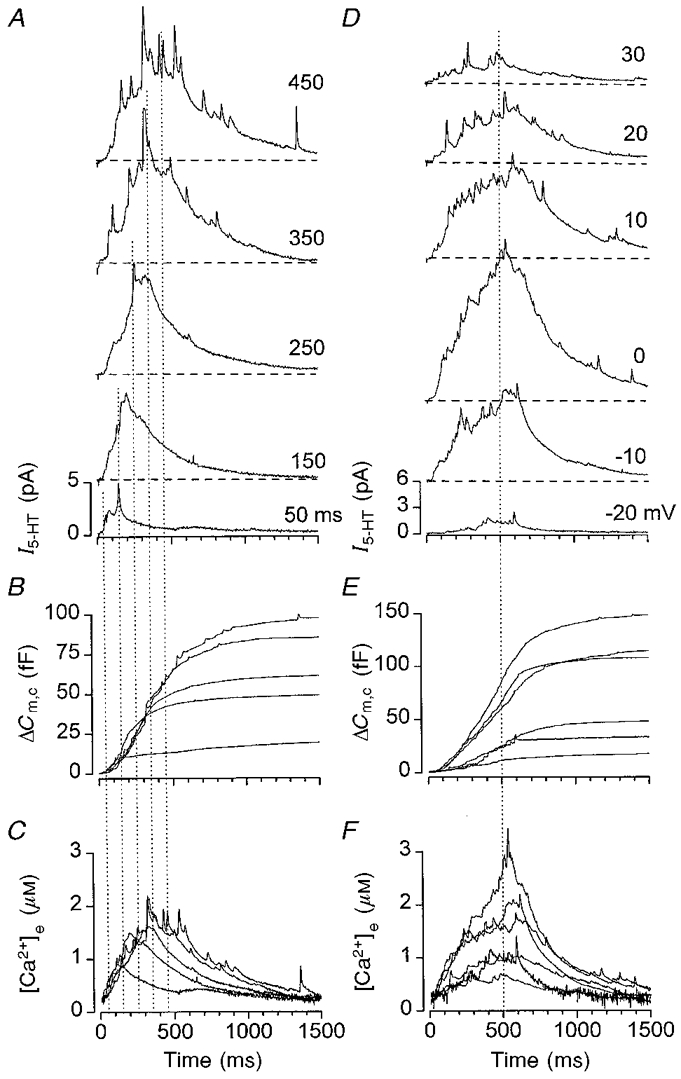
The start of the records are coincident with the onset of the voltage pulse and the end of the pulses are indicated by the vertical lines. Horizontal dashed lines indicate the respective baselines. A-C, secretion elicited by pulses from −70 to +20 mV with variable duration. Each record represents the average of the responses from 6 cells. A, ensemble amperometric current records (I5-HT) elicited by pulses of (from bottom to top): 50, 150, 250, 350 and 450 ms duration. B, estimate of the change in cell capacitance (ΔCm,c) (exocytosis) obtained by deconvolution of the signal shown in A. C, estimate of the Ca2+ concentration at the release site ([Ca2+]e) using eqn (4) with the parameters given in the text. D-F, secretion elicited by variable amplitude pulses from −70 mV. Each record represents the average of the responses from 15 cells. D, ensemble amperometric current records elicited by pulses to (from bottom to top): −20, −10, 0, 10, 20 and 30 mV amplitude. E, estimate of the change in cell capacitance (exocytosis) obtained by deconvolution of the signal shown in D. F, estimate of the Ca2+ concentration at the release site using eqn (4) with parameters given in the text. In E and F, the traces (from bottom to top) are for pulses to −20, 30, 20, 10, −10 and 0 mV, respectively.
Figure 9A shows that there was a parabolic relationship between membrane potential and the latency to the first amperometric transient. This voltage dependence was the inverse of that found for either the amperometric charge (Q5-HT; Fig. 1F) or the Ca2+ entry (QCa; Fig. 9B) evoked by a step depolarisation. The first latency clearly decreased as Ca2+ entry increased and was shortest at +10 mV (5th percentile, 54 ms; mean, 115 ± 20 ms), where QCa and Q5-HT were largest.
Figure 9. Relationship of secretion and Ca2+.
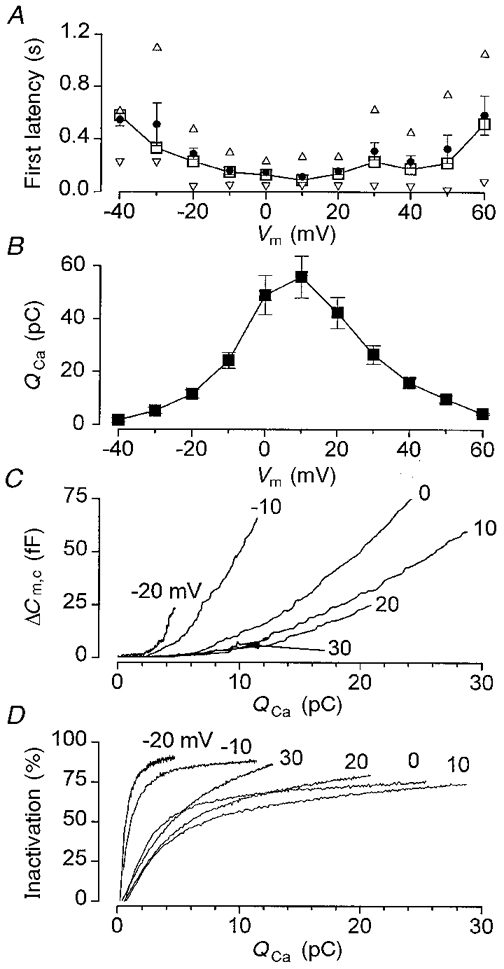
A, voltage dependence of the mean first latency (•), the median (□), and the 5th (▿) and 95th (▵) percentiles. The data are means ±s.e.m. of 15 cells. B, voltage dependence of the integrated Ca2+ influx (QCa) for the same cells as shown in A. C, changes in cell capacitance (ΔCm,c), measured from Fig. 8E, plotted as a function of Ca2+ influx (QCa). The membrane potential is indicated adjacent to the trace. D, inactivation of the Ca2+ current plotted as a function of Ca2+ influx (QCa). Inactivation was measured as the inward current amplitude (at a given time during the pulse) expressed as a percentage of the associated peak inward current amplitude for the same voltage pulse.
Figure 9C illustrates the relationship between ΔCm,c and Ca2+ entry during the pulse. A clear hysteresis can be seen in this relationship, with greater secretion being elicited at negative potentials than at positive potentials, for the same amount of Ca2+ entry. This phenomenon has been observed previously (Ämmäläet al. 1993), and was independent of the number of pulses or the sequence of the pulse in a pulse train. For comparison, Fig. 9D illustrates the relationship between Ca2+ influx during the pulse (QCa) and inactivation of the Ca2+ current (a process that is believed to be regulated by near/sub- membrane [Ca2+]i; Plant, 1988; Rorsman et al. 1992). A similar hysteresis can be seen in this relationship.
In Figs 7D and 8D, there appeared to be a transient increase in secretion on termination of the pulse. However, this was not observed in the majority of cases (e.g. Fig. 6B). In seven out of seven cells for which all-events latency histograms were constructed for amperometric responses elicited by a pulse train, secretion began to decay within 5 ms of membrane repolarisation. This is shown clearly by the pooled all-events latency distribution for these seven cells (Fig. 10). For completeness, the pooled first latency distribution is also shown. Both pooled latency distributions compare favourably with those obtained for individual cells (Figs 2C and 6B, respectively).
DISCUSSION
In this study, we have combined amperometry with capacitance methods to analyse the exocytosis of individual secretory granules from the pancreatic β-cell at the quantal level. We also characterised the kinetics of granule release as a function of Ca2+ entry through voltage-dependent Ca2+ channels, which enabled us to estimate the local Ca2+ concentration in the vicinity of the secretory machinery.
Unitary amperometric events
Analysis of the individual amperometric transients suggests that the release of β-cell granules is both random and independent of the release of other granules, as documented for synaptic vesicles at the neuromuscular junction (del Castillo & Katz, 1954). In contrast to previous reports (Alvarez de Toledo et al. 1993), we were unable to detect a ‘foot’ to the unitary amperometric transient. Instead the majority of unitary events had rise times which approached that of the recording apparatus, suggesting that they resulted from the rapid and complete dilation of the fusion pore. Thus it appears that in β-cells the release of granule contents occurs instantly. We estimate that ∼106 molecules are released per unitary event, which is about 10-fold greater than that previously reported (Smith et al. 1995; Zhou & Misler, 1996). Assuming a spherical granule, with a mean diameter of ∼320 nm (Dean, 1973), we estimate that the intravesicular concentration of 5-HT is around 100 mm.
In this study, we assumed that the CFE detected all of the 5-HT released in its vicinity. A similar assumption has been made by others (Wightman et al. 1991; Chow et al. 1992; Bruns & Jahn, 1995; Smith et al. 1995). Because of the spatial randomness of secretion, the amount of 5-HT that is detected by the CFE will depend on the distance of the release events from the CFE (Wightman et al. 1995). We found the majority of events were well fitted by a simple diffusion model (eqn (1)), which yielded similar values for the distance between the release site and the CFE (r). This suggests that these vesicles were released from sites with comparable distances from the CFE, and that they therefore experience similar degrees of diffusional loss.
The values obtained for r (∼8 μm) were greater than that expected (< 1 μm), given that the CFE was positioned so as to just touch the cell. One possible reason for this discrepancy is that the value of the diffusion coefficient used to fit eqn (1) was too large. This might be the case, for example, if the mobility of 5-HT was restricted by a vesicle matrix like that of the mast cell granule (Rahamimoff & Fernandez, 1997), which reduces the diffusion coefficient for 5-HT to a value 103 times smaller than that in free solution (Marszalek et al. 1997). If this were the case in β-cells, the initial diffusion of 5-HT out of the vesicle would be slower than its final rate of diffusion in free solution. The relative contribution of these two rates of diffusion to the time course of the amperometric transient will depend on the recording geometry. When the CFE is close to the release site, the rate of diffusion from the granule matrix will be rate limiting, but when the CFE is some distance away from the release site, free diffusion will dictate the time course of the amperometric current (Wightman et al. 1995). If we use the restricted diffusion coefficient for 5-HT of 1.3 × 10⁻³μm ms−1 determined for mast cell granules (Marszalek et al. 1997), the mean distance between release site and CFE becomes ∼0.3 μm, a value more consistent with that expected from the topology of our experiments.
Kinetics of unitary events release
The latency distribution of all unitary events, which is a measure of the rate of secretion, does not mirror the time course of the Ca2+ current. In particular, the amperometric transients occur with a delay and they continue after the pulse.
We observed that the rate of secretion saturated 200–300 ms into the pulse. Because this time was independent of the magnitude of the voltage step and Ca2+ current, saturation of the rate of secretion is unlikely to be due to a concentration effect (for example, saturation of Ca2+ binding sites by Ca2+ or saturation of the docking sites by vesicles). An alternative explanation for the saturation of the rate of release is that saturation may represent a steady-state condition, where the rate of vesicle release is limited by the rate of vesicle supply.
The readily releasable pool
It has been suggested that the β-cell possesses a pool of ∼50–200 vesicles (100–400 fF) that are available for rapid release; this is referred to as the readily releasable pool (RRP; Renström et al. 1996; Eliasson et al. 1997). These vesicles are believed to be ready to undergo the fusion process when intracellular [Ca2+] rises. The absence of either facilitation or depression of secretion during pulse trains suggests that the size of the RRP does not vary during the time course of our experiments, and that the RRP can be replenished during the interpulse interval of ∼10 s (Renström et al. 1996).
In principle, a RRP of ∼200 vesicles can fully account for the secretion elicited by any pulse in the present study. In our experiments, we calculate that for a voltage step to 0 mV, an average of ∼60 vesicles (120 fF) are released. This amounts to ∼25 % of the RRP. For voltage steps to −20 or +20 mV, however, where secretion is less, 2 % (∼7 vesicles) and 10 % (∼40 vesicles), respectively, of the RRP is secreted. In the train experiments, only 6 % of the RRP was released during a pulse to +20 mV. Although these estimates are strongly dependent on both the size, and the rate of replenishment, of the RRP they demonstrate that the kinetics of secretion in our study probably relate to the time course of the Ca2+ transient at the release site rather than the rate at which the RRP is replenished. A similar conclusion has been reached for chromaffin cells (Heinemann et al. 1994; Neher, 1998).
Microscopic secretion: latency
The minimum latency between the onset of Ca2+ current and the first amperometric transient was highly variable both within and between cells. In only 4 trials, out of 277 pooled from 7 cells, was the first secretory event elicited within the first 50 ms of the pulse, the majority of first events appearing much later during the pulse. The 5th percentile value of 50 ms is similar to the first latency values reported for secretion of dense core vesicles from chromaffin cells (∼50 ms; Chow et al. 1992) and melanotrophs (∼40 ms; Thomas et al. 1993). Whether the earlier events are representative of either an exocytotic burst (Thomas et al. 1993) or spontaneous release is unclear.
It has been reported previously that an absolute delay of ∼42 ms exists between the instantaneous elevation of intracellular Ca2+ (by flash photolysis of caged Ca2+) and the onset of secretion (measured by the change in cell capacitance; Eliasson et al. 1997). If we assume that the caged Ca2+ was distributed evenly throughout the cell and was therefore in close proximity to the exocytotic Ca2+ sensor, this delay cannot be diffusional in origin but must be due to a mechanistic process. The first latency distributions measured in this study also suggest a delay of ∼50 ms before exocytosis is initiated. Because secretion decays rapidly and without delay on membrane repolarisation, as [Ca2+]e falls, this suggests that the first latency may not be due solely to the time taken to elevate [Ca2+]e to threshold, but is due to a priming process (Renström et al. 1996; Eliasson et al. 1997). This process of priming must be decommissioned between pulses, because the first latency did not show a trend during the pulse train. We therefore suggest that the first latency is determined by several processes, which include priming of the secretory machinery, as well as diffusion of Ca2+ to the release site. Once primed, however, exocytosis proceeds with kinetics described by the time course of the change in [Ca2+]e.
Macroscopic secretion: kinetics
In this study we demonstrate that the macroscopic kinetics of 5-HT secretion from the β-cell can be reconstructed by convolution of the unitary amperometric current and the latency distribution of all amperometric events (Ld). The finding that Ld accurately describes the time course of change in membrane capacitance after the pulse (when ΔCm can be measured) supports the idea that Ld also describes the time course of membrane fusion during the pulse. In addition, the time course of secretion (Ld) we describe is similar to that measured for dCm/dt in β-cells at a similar temporal resolution (Eliasson et al. 1997).
Secretion and calcium
We observed that for the same amplitude of Ca2+ current, [Ca2+]e was larger at negative potentials than at positive potentials. This is consistent with the Ca2+ domain theory, which argues that more Ca2+ will enter per Ca2+ channel at a negative membrane potential, because of the greater driving force, but that the number of channels activated will be less. Thus the Ca2+ concentration in the vicinity of an open channel will be higher at the negative membrane potential. The release sites must therefore be located sufficiently close to the Ca2+ channels to detect Ca2+ entry through Ca2+ channels per se, rather than averaging Ca2+ entry over the whole of the cell's surface. A similar argument has been put forward to account for the observation that for Ca2+ currents of similar magnitude, inactivation is larger at the more negative membrane potential (Plant, 1988; Rorsman et al. 1992). Interestingly, the values we obtained for [Ca2+]e were similar to those obtained for chromaffin cells by a similar method, for which a tested kinetic model of secretion is available (Heinemann et al. 1994).
Acknowledgments
We thank the Wellcome Trust and the British Diabetic Association for support. P.A.S. held a Wellcome Trust Career Development Award 042345.
References
- Albillos A, Dernick G, Horstmann H, Almers W, Alvarez De Toledo G, Lindau M. The exocytotic event in chromaffin cells revealed by patch amperometry. Nature. 1997;389:509–512. doi: 10.1038/39081. [DOI] [PubMed] [Google Scholar]
- Alvarez De Toledo G, Fernandez-Chacon R, Fernandez JM. Release of secretory products during transient vesicle fusion. Nature. 1993;363:554–558. doi: 10.1038/363554a0. [DOI] [PubMed] [Google Scholar]
- Ämmälä C, Eliasson L, Bokvist K, Larsson O, Ashcroft FM, Rorsman P. Exocytosis elicited by action potentials and voltage clamp calcium currents in individual mouse pancreatic B-cells. The Journal of Physiology. 1993;472:665–688. doi: 10.1113/jphysiol.1993.sp019966. [DOI] [PMC free article] [PubMed] [Google Scholar]
- Ashcroft FM, Proks P, Smith PA, Ämmälä C, Bokvist K, Rorsman P. Stimulus-secretion coupling in pancreatic β-cells. Journal of Cellular Biochemistry. 1994;55S:54–65. doi: 10.1002/jcb.240550007. [DOI] [PubMed] [Google Scholar]
- Barrett EF, Stevens CF. Quantal independence and uniformity of presynaptic release kinetics at the frog neuromuscular junction. The Journal of Physiology. 1972;227:665–689. doi: 10.1113/jphysiol.1972.sp010053. [DOI] [PMC free article] [PubMed] [Google Scholar]
- Bokvist K, Eliasson L, Ämmälä C, Renström E, Rorsman P. Co-localization of L-type Ca2+ channels and insulin-containing secretory granules and its significance for the initiation of exocytosis in mouse pancreatic β-cells. EMBO Journal. 1995;14:50–57. doi: 10.1002/j.1460-2075.1995.tb06974.x. [DOI] [PMC free article] [PubMed] [Google Scholar]
- Bruns D, Jahn R. Real-time measurement of transmitter release from single synaptic vesicles. Nature. 1995;377:62–65. doi: 10.1038/377062a0. [DOI] [PubMed] [Google Scholar]
- Chow RH, Klingauf J, Neher E. Time course of Ca2+ concentration triggering exocytosis in neuroendocrine cells. Proceedings of the National Academy of Sciences of the USA. 1994;91:12765–12769. doi: 10.1073/pnas.91.26.12765. [DOI] [PMC free article] [PubMed] [Google Scholar]
- Chow RH, Ruden L, Neher E. Delay in vesicle fusion revealed by electrochemical monitoring of single secretory events in adrenal chromaffin cells. Nature. 1992;356:60–63. doi: 10.1038/356060a0. [DOI] [PubMed] [Google Scholar]
- Dean PM. Ultrastructural morphometry of the pancreatic β-cell. Diabetologia. 1973;9:115–119. doi: 10.1007/BF01230690. [DOI] [PubMed] [Google Scholar]
- Del Castillo J, Katz B. Quantal components of the end-plate potential. The Journal of Physiology. 1954;124:560–573. doi: 10.1113/jphysiol.1954.sp005129. [DOI] [PMC free article] [PubMed] [Google Scholar]
- Dukes ID, Cleemann L. Calcium current regulation of depolarization-evoked calcium transients in beta-cells (HIT-T15) American Journal of Physiology. 1993;264:E348–353. doi: 10.1152/ajpendo.1993.264.3.E348. [DOI] [PubMed] [Google Scholar]
- Ekholm R, Ericson LE, Lundquist I. Monoamines in the pancreatic islets of the mouse. Subcellular localization of 5-hydroxytryptamine by electron microscopic autoradiography. Diabetologia. 1971;7:339–348. doi: 10.1007/BF01219468. [DOI] [PubMed] [Google Scholar]
- Eliasson L, Renström E, Ding W-G, Proks P, Rorsman P. Rapid ATP-dependent priming of secretory granules precedes Ca2+-induced exocytosis in mouse pancreatic B-cells. The Journal of Physiology. 1997;503:399–412. doi: 10.1111/j.1469-7793.1997.399bh.x. [DOI] [PMC free article] [PubMed] [Google Scholar]
- Gerhardt G, Adams RN. Determination of diffusion coefficients by flow injection analysis. Analytical Chemistry. 1982;54:2618–2620. [Google Scholar]
- Gillis KD. Techniques for membrane capacitance measurements. In: Sakmann B, Neher E, editors. Single Channel Recording. New York: Plenum Press; 1995. pp. 155–198. chap. 7. [Google Scholar]
- Gillis KD, Misler S. Single cell assay of exocytosis from pancreatic islet B cells. Pflügers Archiv. 1992;420:121–123. doi: 10.1007/BF00378654. [DOI] [PubMed] [Google Scholar]
- Gylfe E. Association between 5-hydroxytryptamine release and insulin secretion. Journal of Endocrinology. 1978;78:239–248. doi: 10.1677/joe.0.0780239. [DOI] [PubMed] [Google Scholar]
- Heinemann C, Chow RH, Neher E, Zucker RS. Kinetics of the secretory response in bovine chromaffin cells following flash photolysis of caged Ca2+ Biophysical Journal. 1994;67:2546–2557. doi: 10.1016/S0006-3495(94)80744-1. [DOI] [PMC free article] [PubMed] [Google Scholar]
- Hellman B, Gylfe E, Grapengiesser E, Lind PE, Marcstrom A. Cytoplasmic calcium and insulin secretion. In: Flatt PR, editor. Nutrient Regulation of Insulin Secretion. London: Portland Press; 1992. pp. 213–247. [Google Scholar]
- Marszalek PE, Farrell B, Verdugo P, Fernandez JM. Kinetics of release of serotonin from isolated secretory granules. II. Ion exchange determines the diffusivity of serotonin. Biophysical Journal. 1997;73:1169–1183. doi: 10.1016/S0006-3495(97)78149-9. [DOI] [PMC free article] [PubMed] [Google Scholar]
- Neher E. Vesicle pools and Ca2+ microdomains: new tools for understanding their roles in neurotransmitter release. Neuron. 1998;20:389–399. doi: 10.1016/s0896-6273(00)80983-6. [DOI] [PubMed] [Google Scholar]
- Oberhauser AF, Robinson IM, Fernandez JM. Simultaneous capacitance and amperometric measurements of exocytosis: a comparison. Biophysical Journal. 1996;71:1131–1139. doi: 10.1016/S0006-3495(96)79315-3. [DOI] [PMC free article] [PubMed] [Google Scholar]
- Plant TD. Properties and calcium-dependent inactivation of calcium currents in cultured mouse pancreatic B-cells. The Journal of Physiology. 1988;404:731–747. doi: 10.1113/jphysiol.1988.sp017316. [DOI] [PMC free article] [PubMed] [Google Scholar]
- Proks P, Eliasson L, Ämmälä C, Rorsman P, Ashcroft FM. Ca2+- and GTP-dependent exocytosis in mouse pancreatic β-cells involves both common and distinct steps. The Journal of Physiology. 1996;496:255–264. doi: 10.1113/jphysiol.1996.sp021682. [DOI] [PMC free article] [PubMed] [Google Scholar]
- Rahamimoff R, Fernandez JM. Pre- and postfusion regulation of transmitter release. Neuron. 1997;18:17–27. doi: 10.1016/s0896-6273(01)80043-x. [DOI] [PubMed] [Google Scholar]
- Renström E, Eliasson L, Bokvist K, Rorsman P. Cooling inhibits exocytosis in single mouse pancreatic B-cells by suppression of granule mobilization. The Journal of Physiology. 1996;494:41–52. doi: 10.1113/jphysiol.1996.sp021474. [DOI] [PMC free article] [PubMed] [Google Scholar]
- Rorsman P, Ämmälä C, Berggren PO, Bokvist K, Larsson O. Cytoplasmic calcium transients due to single action potentials and voltage-clamp depolarizations in mouse pancreatic B-cells. EMBO Journal. 1992;11:2877–2884. doi: 10.1002/j.1460-2075.1992.tb05356.x. [DOI] [PMC free article] [PubMed] [Google Scholar]
- Rorsman P, Trube G. Calcium and delayed potassium currents in mouse pancreatic β-cells under voltage-clamp conditions. The Journal of Physiology. 1986;374:531–550. doi: 10.1113/jphysiol.1986.sp016096. [DOI] [PMC free article] [PubMed] [Google Scholar]
- Smith PA, Duchen MR, Ashcroft FM. A fluorimetric and amperometric study of calcium and secretion in isolated mouse pancreatic beta-cells. Pflügers Archiv. 1995;430:808–818. doi: 10.1007/BF00386180. [DOI] [PubMed] [Google Scholar]
- Smith P, Proks P, Ashcroft FM. Exocytosis monitored by simultaneous measurement of cell capacitance and 5-HT release in isolated mouse pancreatic β-cells. The Journal of Physiology. 1994;480.P:123–124P. [Google Scholar]
- Sokal RR, Rohlf FJ. Biometry: The Principles and Practice of Statistics in Biological Research. 3. New York: W. H. Freeman and Co.; 1995. [Google Scholar]
- Thomas P, Wong JG, Lee AK, Almers W. A low affinity Ca2+ receptor controls the final steps in peptide secretion from pituitary melanotrophs. Neuron. 1993;11:93–104. doi: 10.1016/0896-6273(93)90274-u. [DOI] [PubMed] [Google Scholar]
- Van Der Kloot W. Estimating the timing of quantal releases during end-plate currents at the frog neuromuscular junction. The Journal of Physiology. 1988;402:595–603. doi: 10.1113/jphysiol.1988.sp017224. [DOI] [PMC free article] [PubMed] [Google Scholar]
- Wightman RM, Jankowski JA, Kennedy RT, Kawagoe KT, Shroeder TJ, Leszczyszyn DJ, Near JA, Diliberto EJ, Viveros OH. Temporally resolved catecholamine spikes correspond to single vesicle release from individual chromaffin cells. Proceedings of the National Academy of Sciences of the USA. 1991;88:10754–10758. doi: 10.1073/pnas.88.23.10754. [DOI] [PMC free article] [PubMed] [Google Scholar]
- Wightman RM, Schroeder TJ, Finnegan JM, Ciolkowski EL, Pihel K. Time course of release of catecholamines from individual vesicles during exocytosis at adrenal medullary cells. Biophysical Journal. 1995;68:383–390. doi: 10.1016/S0006-3495(95)80199-2. [DOI] [PMC free article] [PubMed] [Google Scholar]
- Zhou Z, Misler S. Amperometric detection of quantal secretion from patch-clamped rat pancreatic beta-cells. Journal of Biological Chemistry. 1996;271:270–277. doi: 10.1074/jbc.271.1.270. [DOI] [PubMed] [Google Scholar]