

Abstract
We examined the maturation of GABAA receptor synapses in cortical pyramidal neurons cultured from embryonic rats. The decay kinetics of GABAA receptor-mediated miniature postsynaptic currents (mPSCs) were compared with those of responses evoked by GABA in excised membrane patches.
Fast perfusion of 1 or 10 mM GABA on membrane patches evoked currents with different desensitizing time courses in young and old neurons. For neurons older than 4 days in vitro (DIV), GABAA currents had a fast component of desensitization (median ≈ 3 ms) seldom seen in patches from younger neurons. In contrast, mPSCs exhibited a substantial fast component of decay at 2–4 DIV that became more prominent with further development although the median value of its time constant remained unchanged.
The selective α3 subunit positive modulator SB-205384 had no effect on mPSCs at any time in vitro but potentiated extrasynaptic activity. This suggests that synapse maturation does not proceed by a gradual exchange of early embryonic GABAA receptor subforms for adult forms.
At all ages, the kinetic properties of mPSCs were heterogeneous. This heterogeneity extended to the level of mPSCs from single neurons and may be a normal aspect of synaptic functioning.
These results suggest that inhibitory synapses in developing neurons are capable of selectively capturing GABAA receptors having fast desensitization kinetics. This functional preference probably reflects the developmental turning point from an inwardly looking trophic capacity of embryonic GABAA receptors to a role concerned with information processing.
GABAA receptors mediate the majority of fast inhibitory synaptic interactions in the mammalian brain. In the adult brain, networks of neurons containing GABAAergic receptors have been implicated in the maintenance of rhythmic activities of neuronal circuits (Whittington et al. 1995; Wang & Buzsaki, 1996) and the precise control of the timing of excitability in individual neurons (Tsubokawa & Ross, 1996). Computational modelling studies have suggested that the kinetics of GABAA receptor-mediated synaptic potentials and the underlying conductance changes are fundamental to their activity as modulators of network oscillations (Traub et al. 1996). Since GABAA receptors are constructed from a large repertoire of protein subunits, many possibilities exist for different functional behaviours to exert such control. Subunit diversity also appears to underlie distinctive roles for GABAA receptors in the developing nervous system (Poulter et al. 1992; Laurie et al. 1992; Ma et al. 1993) where they regulate calcium oscillations in immature neurons and glia (Gu & Spitzer, 1995; LoTurco et al. 1995) and have long channel open times in comparison to adult channel attributes (Serafini et al. 1995). Thus, a change in function from a neurogenic to an information-processing role is accompanied by a change in the subunit composition of GABAA channels. Most notably, there is a switchover of the α subunits. Since the expression of the α2, α3 and α5 subunits in cultured neocortical and hippocampal neurons changes in a manner similar to that in vivo during early development (Laurie et al. 1992; Poulter et al. 1992, 1997; Brooks et al. 1997), cortical cultures provide a suitable model to study the functional change which accompanies this change in expression.
We have, therefore, investigated developmental changes in GABAA receptors in excised membrane patches and synapses and correlated their functional properties to GABAA receptor α subunit expression. Notably, we have found that a fast desensitization rate of GABAA receptors develops when synapses first form. We suggest that fast desensitizing receptors are preferentially inserted into postsynaptic densities during development. Some of these results have been presented before in abstract form (Hutcheon & Poulter, 1997).
METHODS
Culture methods
Experiments were performed in accordance with animal care protocols approved by the National Research Council of Canada. Pregnant Sprague-Dawley rats were killed, on embryonic day 18, by cervical dislocation while under deep halothane anaesthesia. Portions of the developing neocortex and paleocortex were isolated from pups in cold phosphate-buffered saline solution mixed with an equal volume of Eagle's minimum essential media supplemented with 20 mM glucose, 2 mM L-glutamine, 10 % fetal bovine serum and 10 % horse serum. This mixture was centrifuged at 1000 g for 6 min. The resulting tissue pellet was resuspended in 5–7 ml of plating medium and mechanically dissociated. After dissociation, an estimate of live cells was made by Trypan Blue exclusion and cells were plated at a density of 100 000 cm−2 on 35 mm poly-D-lysine-coated plastic culture dishes. The cells were grown and maintained in Dulbecco's modified Eagle's medium (DMEM) supplemented with 10 % horse serum (Gibco-BRI) and 10 mM 5-flurodeoxyuridine (FDU; after 3 days). By convention, we refer to the day upon which plating was performed as day 0 of the culturing protocol and the count of days in vitro begins on the following day. Thus, the following day is 1 DIV and so on.
RT-PCR
Cortical cultures at 3 and 17 DIV were solubilized and their total cellular RNA extracted by adding 2 ml of Triasol reagent to each culture dish followed by an organic extraction and precipitation as outlined in the manufacturers instructions. The prepared RNA was then assessed for purity and quantified. A 500 ng sample of RNA was reverse transcribed (RT) by priming with oligo-dT in a total volume of 20 μl. A 3 μl aliquot of the RT reaction mixture was then used as a template for subsequent PCR amplification using subunit-specific primers (α1-α5). As a control, glyceraldehyde-3-phosphate dehydrogenase (GAPDH) primers were used to check the fidelity of the PCR amplification. Following amplification, 10–15 μl of the PCR reaction mixture was run on a 1.75 % agarose gel. DNA was visualized by ethidium bromide staining and quantified using the NIH Image software. Band intensities in graphed data are expressed as the percentage of control band density which represents the amplification product of 109 copies of the clone.
Solutions
The control bathing solution comprised (mM): 145 NaCl, 5 KCl, 2 CaCl2, 2 MgCl2, 10 glucose, and 10 Hepes (310 mosmol kg−1, pH adjusted to 7.3-7.4). To block action potential generation and excitatory amino acid receptors, this solution was supplemented, when needed, with 100 nM tetrodotoxin (TTX; Sigma), 10 μM of the NMDA receptor antagonist dl-2-amino-5-phosphonopentanoic acid (APV; Precision Biochemicals) and 10 μM of the AMPA/kainate receptor antagonist 6,7-dinitroquinoxaline-2,3-dione (DNQX; Precision Biochemicals). To facilitate the acquisition of sufficient numbers of mPSCs, 50 μM Ruthenium Red (RR; Research Biochemicals Inc.) was briefly added to the perfusate. This creates a reversible and calcium-independent increase in mPSC frequency (Trudeau et al. 1996; Sciancalepore et al. 1998). Synaptic events obtained under these conditions were abolished by the specific GABAA receptor antagonist bicuculline methiodide (10 μM; Research Biochemicals Inc.). SB-205384, an α3 subunit-selective positive modulator at a non-benzodiazepine site on the GABAA receptor (Meadows et al. 1997, 1998), was a gift from SmithKline Beecham Pharmaceuticals. All these agents except RR (which was kept at room temperature) were kept frozen (-20°C) as concentrated stock solutions before being added to the external solution on the day of the experiment. The electrode solution for patch pipettes consisted of (mM): 145 CsCl, 10 NaCl, 10 Hepes, 1 Na2EDTA and 20 glucose (adjusted to pH 7.2-7.3). Osmolarity was adjusted by addition of distilled water or sucrose to between 290 and 300 mosmol kg−1.
Electrical and [Ca2+]i recordings and analysis
[Ca2+]i levels in groups of two to four neurons loaded with fura-2 AM were monitored using a spectrofluorimeter (Spex Inc.) as described previously (Wang et al. 1995). All electrical recordings were performed using an Axopatch 200A amplifier attached to a Digidata 1200 A/D interface and controlled by pCLAMP software. Signals were low-pass filtered at 2 kHz before being digitized at 10 kHz and saved to the hard disk of a PC computer, or digitized at 20 kHz and saved on a DAT tape recorder. Patch pipettes were fabricated from 1.5 mm outer diameter, thin-walled, borosilicate glass (World Precision Instruments) on a horizontal electrode puller (Sutter Instruments). Electrode resistances were typically 3–6 MΩ. Series resistance in the whole-cell configuration was 8–20 MΩ, of which 40–80 % could be compensated. Series resistance was checked periodically and recordings were abandoned if the resistance rose irreversibly above 20 MΩ. Since all patch recordings were made at a holding voltage of −60 mV, and only patch currents less than −500 pA were accepted for analysis, the maximum uncompensated voltage error was 6 mV, or 10 % of the driving force for Cl− current.
Fast GABA applications were achieved using glass theta tubing filled on one side with 1 or 10 mM GABA dissolved in control bathing solution diluted by 5 % and on the other side with the control solution only (Jones & Westbrook, 1995). D/A commands controlled movement of a piezo actuator holding the theta tubing. Typically, the patch pipette was placed 40 μm from the orifice of the control solution side of the theta tubing. Under optimal conditions, the 10–90 % rise time for solution exchange using our system was 50–100 μs as determined by the change in tip current at the open mouth of a recording electrode.
Post-synaptic currents (PSCs) were detected and saved if they crossed a threshold 10 pA below the baseline and did not have further mPSCs contaminating the decay phase. Histograms of the 10–90 % rise times of the collected events were plotted and fitted to a sum of Gaussian functions to isolate the population of mPSCs that were minimally affected by filtering (DeKoninck & Mody, 1994). On the basis of these fits, mPSCs with rise times less than 1 ms were accepted as being sufficiently unfiltered for further analysis. To determine maximal mPSC rates, 1 min segments of ongoing synaptic activity were reacquired from DAT tapes, numerically filtered at 450 Hz, and differentiated. Any events having negative-going peaks of more that 5 standard deviations from the baseline were accepted as representing the rising phase of a mPSC. Counting the number of these peaks gave the frequency of their occurrence. Checking this procedure against the original records invariably showed that it successfully detected individual mPSCs even if they occurred in temporally summated clusters.
For kinetic studies, a least-squares algorithm (available in the Clampfit program of the pCLAMP suite) was used for fitting the falling phases of mPSCs and patch responses to GABA with the equation:
| (1) |
where I is current, t is time from the peak, τi represents the i th exponential time constant with coefficient Ai, and I∞ is the steady-state current at t =+∞. To determine how many components to fit to each trace, nested fits with successively higher numbers of free parameters were fitted until the summed residuals changed by less than 1 % or until unphysical parameter values emerged (i.e. negative time constants). Early trials revealed that this procedure was preferable to using an F test to identify the best model. This is probably because eqn (1) is non-linear in the parameters τi and so does not meet the minimal requirements necessary for applying such tests. The procedure we adopted usually resulted in a maximum of two time constants for mPSCs and three time constants for patch currents.
The central tendency and dispersion of distributions are indicated by mean and s.e.m. unless distributions were not normally distributed, in which case they are given as median and inter-quartile range (IQR). For comparing distributions, we sought to use the most powerful statistical test available, given the constraints imposed by the nature of the data: for normally distributed data this was a Student's t test or one-way ANOVA; for non-normal data having samples with comparable dispersions a Kruskal-Wallis (K-W) test was used to identify differences in median values; for non-normal data with non-homogeneous dispersions a Kolmogorov-Smirnov (K-S) test was used to detect differences in distribution. The level of significance for statistical tests is P < 0.05 throughout. All experiments were performed at room temperature (18–22°C).
Classification of time constant values
For purposes of comparison, time constant values for patch and synaptic current decays at different stages of development were grouped according to objective criteria. For synaptic currents, the time constant values for all two-component decays were plotted in raster form, and a boundary for separating the components was sought that would minimize the incidence of misclassified time constants (e.g. Fig. 1). A misclassified time constant can occur, for instance, when the fastest time constant associated with one PSC is slower than the slow component of another. The optimal placement of boundaries can be achieved by a simple computer routine that calculates the number of misclassified time constant values for all possible boundaries, then selects the boundary with the lowest number. When several boundary placements yield the same minimal number of misclassifications, the one producing the largest sum of squared distances from the entire set of data is chosen. For our purposes, we evaluated boundaries at 1 ms intervals. In the case of patch responses to sustained GABA applications, which normally had three exponential components, two boundaries were placed simultaneously. Optimal boundary placement in this manner always resulted in fewer than 3 % misclassified time constants.
Figure 1. Method for grouping time constant values.

Demonstrated for a data set consisting of theoretical decay time constants for 10 different mPSCs. Each mPSC has two time constants with the faster of the pair indicated by a small filled rectangle and the slower by a large filled rectangle. A single boundary is sought that optimally separates the fast and slow components over the entire data set. Although any choice of boundary results in misclassified time constants, the dashed line indicates the optimal boundary, as explained in the text. This boundary placement has resulted in the fastest time constant for one mPSC (circled) being misclassified as a slow time constant.
RESULTS
These results are derived from whole-cell and patch recordings from 237 neurons in cortical primary cultures. Cultures were prepared from cells isolated on embryonic days 17 or 18 and were followed for up to 24 DIV. When possible, recordings were made from cells with pyramidal morphologies consisting of a dominant apical dendrite and multiple smaller dendrites erupting from the opposite pole of the soma.
Development of cortical neurons in primary culture
We first confirmed that neurons in these cultures were developing with properties comparable to those they would normally acquire in vivo. Properties indicating a normal maturational sequence included the eventual appearance of cells with distinct pyramidal and non-pyramidal morphologies, the gradual development of voltage-dependent inward currents (Fig. 2a) and the coupling of GABAA receptor activation to transient elevations of [Ca2+]i during early (Yuste & Katz, 1991; Reichling et al. 1994; Leinekugel et al. 1995), but not later, stages of development (Fig. 2b). Thus, these neurons developed mature physiological characteristics under our culture conditions.
Figure 2. Neocortical neurons in culture have normal developmental attributes.

A, development of somatic capacitance (○) and leak-subtracted peak inward currents evoked by +50 mV voltage steps from a holding potential of −80 mV (•). Both measures exhibit large increases during the first week of culture and relative stability thereafter. Data represented as means and s.e.m.B, fura-2 ratiometric fluorimetry reveals that 1 mM GABA (arrows) increases [Ca2+]i in 3 DIV neurons (Ba) but not in 24 DIV neurons (Bb). Elevation of external K+ concentration (arrowhead) following GABA administration to 24 DIV neurons demonstrates that [Ca2+]i levels are still affected by depolarization. Note that GABA disrupts ongoing [Ca2+]i oscillations in the older neurons. C, histogram of relative levels of mRNA for various GABAAα subunits in cultures after 3 and 17 DIV. Asterisks denote significant differences between ages (unpaired t tests: α1, P = 0.017; α3, P = 0.0491; α4, P = 0.002; α5, P = 0.027). Numbers above columns are sample sizes.
We also used RT-PCR to assay changes in GABAA subunit mRNAs in 3, 10 and 17 DIV cultures. The first time point represents the very beginning of synaptogenesis in these cultures (see below, Fig. 3C); the other two sample points are at 1 week intervals during a period of ongoing synaptogenesis. Figure 2C shows the switchover in mRNA abundance that occurs throughout this period. In agreement with Poulter et al. (1997), there was a high initial expression of α2, α3 and α5 transcripts in 3 DIV cultures followed by a decline in α3 and α5 subunit mRNA expression by 17 DIV. In apparent contrast to our previous results, the abundance of α2 transcript was unchanged overall. However, this probably represents the selective loss of expression in the glial cell population combined with a concomitant increase of α2 subunit expression in a subpopulation of neurons (Poulter et al. 1997). Our data also show a large increase in α1 and α4 transcripts in 17 DIV cultures, indicating that a mature GABAA receptor subunit expression profile is developing in these cultures (Wisden et al. 1992).
Figure 3. Development of GABAAergic properties of cultured neocortical neurons.
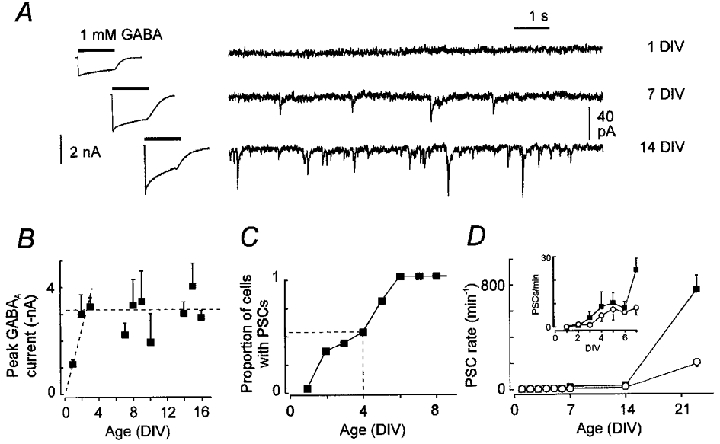
A, examples of whole-cell current responses to 1 s applications of 1 mM GABA (left) and spontaneously occurring mPSCs (right) at different times during development. B, development of peak whole-cell GABAAergic current (filled symbols). Dashed lines indicate developmental trend. C, proportion of neurons with observable mPSCs as a function of age in culture (5–6 observations for each time point). Vertical dashed line indicates point where half of the neurons exhibit mPSCs. All observations were carried out with 50 μM Ruthenium Red in the bathing solution to increase release probability. D, rates of mPSC occurrence in the presence (▪) and absence (○) of Ruthenium Red. Inset shows details for first week in culture. Data in B and D are median values and error bars represent half of the IQR.
Development of GABAA receptor function in culture
To establish an overall time course for developmental events, we measured whole-cell and synaptic events mediated by GABAA receptors (Fig. 3a). Whole-cell current recordings from cells as early as 1 DIV (i.e. the day after plating) invariably demonstrated responses to GABA application. The peak whole-cell inward current evoked by fast application of 1 mM GABA to the somatic region of neurons showed a significant increase between 1 and 2 DIV but was stable thereafter (K-W test, P = 0.002; Fig. 3b). These whole-cell currents were undiminished by baclofen and abolished by bicuculline (data not shown) and were, therefore, due to GABAA receptor activation.
Synaptic GABAA currents were rare immediately after dissociation and plating. Even in the presence of 50 μM RR, only half of the neurons tested had functional synapses by 4 DIV (Fig. 3C). Thus, the early expression of GABAAergic whole-cell currents, visible in Fig. 3b, does not correlate with the functional presence of synapses. Following the first 4 DIV, synaptogenesis was ongoing as revealed by the increased incidence of mPSCs (Fig. 3D and inset). These mPSCs, recorded in the presence of glutaminergic antagonists, were abolished by bicuculline (in 3 of 3 neurons, not shown), identifying them as arising from the activation of GABAA receptors.
To identify properties of GABAA receptors that change in step with the development of GABAAergic synapses, in the remainder of this paper we will present results grouped into different time periods based on the results above. One period, from 1 to 4 DIV, occurs at a time when there are few, if any, GABAAergic synapses (Fig. 3C). Another period, at the start of the second week of culturing (from 7 to 10 DIV), reflects an initial slow rate of GABAAergic synaptogenesis (Fig. 3D). Finally, a third period at the beginning of the third week of culturing (from 14 to 17 DIV) occurs during rapid proliferation of synapses (Fig. 3D).
GABAA currents in outside-out patches
In our initial whole-cell recordings, we observed that the desensitization rates of GABAA currents appeared to increase with time in culture (Fig. 3a, left). To examine desensitization more closely we recorded currents evoked in 55 outside-out membrane patches by rapid applications of 1 and/or 10 mM GABA.
In patches pulled from young and old neurons, GABAA currents desensitized rapidly during prolonged GABA applications. Figure 4a and B shows examples of currents evoked by 1 s applications of 1 mM GABA to patches excised from 2 and 8 DIV neurons. These traces illustrate the profound steady-state desensitization that was characteristic of GABA responses at all ages. When quantified as a percentage of the peak current using the formula Dss = 100 ×I∞/[I∞+ΣAi] (cf. eqn (1)), steady-state desensitization (Dss) was found not to depend on the age of the culture (K-W test, P > 0.9). In 55 patches from 1–17 DIV neurons, the median value of Dss was 92 % with an IQR of 7 %.
Figure 4. Responses of excised membrane to GABA.
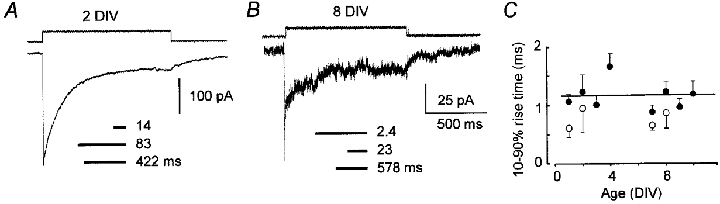
A and B, patch currents evoked by 1 s pulses of GABA (1 mM, concentration time course indicated above each trace) at 2 DIV (A) and 8 DIV (B) illustrating the development of a fast component of desensitization in older cultures. Time constant values from exponential fits to relaxation phase of each response are shown below traces. The lengths of the horizontal lines indicate the relative contributions of each exponential component. C, there are no age-related changes in 10–90 % rise times of currents in patches exposed to 1 mM GABA (•); 10 mM GABA (○) induced significantly faster activation of receptors in young and old cultures. Each symbol represents the median of 3–6 observations; error bars give half the IQR. Straight line is regression for 1 mM GABA data.
The time course of desensitization in patches from all cultures could usually be described by the sum of two or three exponential components. The results of fitting exponential functions to the desensitizing phases of the responses in Fig. 4a and B are displayed schematically beneath each current trace. Note the prominent fast (2.4 ms) time constant in the time course of desensitization for the patch from the older, but not younger, neuron. Age-related changes in desensitization such as these were evident in responses to both saturating (10 mM) and non-saturating (1 mM) GABA applications (n = 15 and 42, respectively). They were not due to developmental changes in on-binding rates as shown by the linear regression of 10–90 % rise times on age in culture in Fig. 4C (r < 0.001, P = 0.969). Moreover, the kinetics of desensitization did not depend on the direction of the current flow, since the waveform of the current relaxation was unchanged when the membrane was held at positive potentials.
To examine the development of GABAA desensitization kinetics further, we first classified the fitted desensitization time constants for patch responses as fast (τ1 < 20 ms), medium (20 ms ≤τ2≥ 115 ms) and slow (τ3 > 115 ms), according to the criterion of minimal misclassification as explained in Methods. These divisions were found to hold for 1–4 DIV and 7–10 DIV neurons and allowed us to compare the distributions of time constants at the two ages in each class (Fig. 5A–C). We found that, whereas there was no significant age-related difference for the medium (Fig. 5b) and slow (Fig. 5C) time constants (K-S tests, P = 0.904 and P = 0.548; median values, 49 ms and 455 ms, respectively), the distributions of fast desensitizing time constants (Fig. 5a) were significantly age dependent (K-S test, P = 0.012), with a median of 11.3 ms for younger patches and 2.8 ms for older patches. Thus, the τ1 components were faster in the older patches. In addition, fast desensitization became more prominent with development, as shown in the plot of the percentage contribution of τ1 to the overall desensitization versus DIV (Fig. 5D). There were no significant differences in the distributions of kinetic parameters between the 7–10 and 10–14 DIV groups.
Figure 5. Developmental changes in kinetic properties of GABAA receptor desensitization measured in excised patches.

A–C, cumulative distributions of time constant values derived from fits of multiple exponential components to current relaxations evoked by applications of 1 or 10 mM GABA. The thin line shows data from a period prior to synaptogenesis in culture (n = 19 neurons) and the thick line shows data 1 week later (n = 22 neurons). D, the prominence of the fast (< 20 ms) component of desensitization gradually increases with age in culture. Filled symbols give median values and error bars show half the IQR value.
Fast desensitization and receptor deactivation
Receptor desensitization is signalled by the waning of a response in the continued presence of an agonist. On a microscopic scale, this can be due to the closing of receptor channels which nevertheless remain bound to the agonist. Receptor deactivation is the response of receptors following withdrawal of an agonist as they migrate through different states before finally unbinding. Under certain conditions, desensitized states may make a large contribution to the time course of deactivation, even after a brief pulse of agonist.
To investigate the role that desensitization plays in the deactivation of GABA responses at different stages of development, we examined the responses of patches to short (≤ 1.5 ms) and long (> 100 ms) pulses of 1 or 10 mM GABA. In 21 patches taken from neurons of ages 1 to 17 DIV, responses to short applications usually had two prominent time constants. In older patches (> 7 DIV, n = 12), both time constants were significantly faster than in young patches (1–4 DIV, n = 9) as determined by K-S tests (P = 0.028; median values: older patches, 2.3 and 43 ms; younger patches, 6.2 and 63 ms). In 16 of the patches, we additionally obtained recordings for responses to sustained pulses (≥ 100 ms) of GABA. Examples of these results are shown in Fig. 6 where the responses in each patch are normalized to their peak values and superimposed.
Figure 6. Comparison of patch currents evoked by brief (< 1.5 ms) and sustained (> 100 ms) pulses of 1 mM GABA.

A–C, normalized GABA responses (averages of 3–7 responses each) in 3 patches of various ages are shown in the bottom portion of each panel. The timing of the GABA applications are shown by the two open-tip current traces at the top; brief and sustained applications (and the corresponding responses) are indicated by thick and thin traces, respectively. Divergence of traces was measured 20 ms after initial GABA application as shown in A. Arrowheads in C indicate fast desensitization reaching equilibrium over the first 20 ms of the response at a time when receptors are still insensitive to the time course of applied GABA. D, relative divergence (expressed as percentage of normalized peak current) did not depend on age in culture. E, fast time constants of current relaxations for brief (‘Short-pulse τ1‘) and sustained (‘Long-pulse τ1‘) pulses of GABA were correlated. Straight lines in D and E show regressions. F, frequency distribution of fast time constants for responses to long (open columns) and short (filled columns) pulses of GABA at a time during (7–10 DIV) and before (1–4 DIV) large scale synapse formation. A two-component Gaussian fit to the combined 7–10 DIV data revealed two populations of time constants (continuous lines, mean values 2.8 ms and 11.3 ms). Patches from 1–4 DIV neurons did not have a distinct population of < 5 ms time constants.
As exemplified in Fig. 6a, in some patches the time courses of the responses to short and sustained GABA pulses diverged immediately following the termination of the short pulse. In other patches (e.g. Fig. 6b and C), the initial time courses of the responses were similar over substantial lengths of time, indicating that desensitization played a predominant role in shaping the initial response. To quantify this, we measured the divergence of the traces 20 ms after the beginning of the response (e.g. Fig. 6a) and expressed this as a percentage of the scaled peak current. We chose to measure divergence over the first 20 ms so as to compare responses to brief and sustained pulses of GABA during the time that fast desensitization (defined as a component of desensitization with τ < 20 ms) is most likely to play a large role in shaping the response. The results for all 16 patches are plotted versus time in culture in Fig. 6D. A linear regression shows that the degree of divergence is not developmentally regulated (r = 0.105, P = 0.709). Furthermore, it can be seen that, in more than half the patches, the responses have diverged by less than 20 % during the 20 ms after GABA application (10 of 16 patches). During this time, the fast desensitization identified above is quick enough to essentially come to equilibrium. This was particularly true for the older cultures where the fast desensitizing components were large and had τ values < 5 ms. A particular instance is illustrated in Fig. 6C (arrowheads).
These results suggest that, in many cases, fast desensitization is the major factor shaping the initial deactivation of GABA receptors following transient pulses of GABA at high concentrations. This is reinforced in Fig. 6E, which shows that the values of the fast time constants of deactivation (following short GABA applications) and desensitization (to sustained GABA applications) in the same patch were correlated (r = 0.547, P = 0.031).
Finally, a close examination of the distribution of τ1 values in 7–10 DIV patches revealed two populations of fast time constants for responses to both sustained and transient pulses of GABA. Figure 6F shows histograms of all fast time constant values obtained for 7–10 DIV (top) and 1–4 DIV (bottom) cultures. Open columns indicate data obtained from long-pulse experiments and filled columns are for responses to short pulses of GABA. It is apparent that the fast time constants at 7–10 DIV are not distributed in a simple manner. In fact, for the long-pulse responses, fast time constants for this age group can be fitted to a sum of two Gaussian functions centred at 2.6 ms and 11.4 ms (continuous lines). The time constants for the short-pulse responses have a similar bimodal distribution. In contrast, the distribution of τ1 values for 1–4 DIV patches fits a single Gaussian centred at almost the same value (10.8 ms, dashed line) as the slower component for older patches.
Thus, during an era when synapses are just beginning to form in these cultures, GABA receptors acquire a prominent fast component of desensitization with a time constant value < 5 ms. Simultaneously, a similar fast component of channel deactivation develops in response to short pulses of GABA. This suggests that the time course of PSC decay may be influenced by the developmental changes in receptor desensitization.
Time courses and development of spontaneous GABAAergic synaptic currents
We examined GABAAergic mPSCs during the first 3 weeks in vitro. From a total of 1155 mPSCs accepted for analysis from neurons of all ages, 63 % could be fitted with one exponential component and the remainder required two components. In general, mPSCs decayed to baseline in less than 200 ms so that the fitted steady-state component of the decays, I∞, was close or equal to zero. Figure 7a and B shows examples of mPSCs with one- and two-component decay kinetics, demonstrating that the values of the fast time constants in two-component fits were comparable to the fast decay time constants observed in outside-out patches. Figure 8a shows that the median values of the fitted peak amplitudes of mPSCs grew as the cultures developed. For all mPSCs, the median peak amplitude increased from 25 to 33 pA from the first to the second week of culturing and then to 52 pA between the second and third week.
Figure 7. Time courses and exponential fits for GABAAergic mPSCs in two neocortical neurons.

A, an individual mPSC (points) whose decay could only be fitted by a one-component exponential function. The continuous line indicates the fitted function. B, an mPSC which was successfully fitted by a two-component exponential. The separate components are shown in the inset. Numbers and lines below each panel indicate the values of the fitted exponential time constants and their relative contributions to the overall time course; 37 % of all mPSCs were successfully fitted with two-component exponentials. The remaining mPSCs were fitted with one-component functions.
Figure 8. Distributions of parameters describing GABAAergic mPSCs in cultures from three developmental periods.

Each panel shows cumulative distributions of fitted parameters for neurons of three age groups: thin continuous lines represent data from neurons < = 4 DIV; dashed lines indicate data gathered between 7 and 10 DIV; thick continuous lines indicate data gathered between 14 and 17 DIV. A, distributions of peak amplitudes showing a significant increase during development. B, distributions of decay time constants for mPSC where only one exponential component could be fitted successfully. C, distributions of time constant values for two-component mPSCs. Data for the fast (τ1) and slow (τ2) time constant values are shown separately. D, distribution of percentage contribution of the fast component to the overall time course of decay for two-component mPSCs. There was a significant increase in the contribution of the fast component between 7–10 DIV and 14–17 DIV cultures.
Age-dependent changes in the values of decay time constants were also evident. For one-component fits, the time constants became significantly faster between the first, second and third weeks in culture (Fig. 8b; median values 24, 20 and 14 ms respectively; K-S tests: P = 0.002 for first and second week; P < 0.001 for first and third weeks). This is similar to data reported by Hollrigel & Soltesz (1997). For two-component fits, where the dividing point between ‘fast’ and ‘slow’ time constant values was found to be 15 ms (using the technique of minimal misclassifications described in Methods; see Fig. 1), the values of the slow time constants became significantly faster when 1–4 DIV cultures were compared to 14–17 DIV cultures (Fig. 8C; τ2 median values 52 and 31 ms; K-S test, P = 0.001). There was no significant change between 1–4 and 7–10 DIV cultures in this respect.
Unlike the situation for patch responses to GABA, there was no significant difference in the distribution of fast decay time constants with age in culture (Fig. 8C; τ1 median 3.5 ms; K-S tests, P < 0.001). Despite this developmental stability, the fast component contributed more to the decay of mPSCs in older cultures. Between the second and third weeks in culture there was a significant increase in the percentage of τ1 (Fig. 8D; median values 31 and 43 %; K-S test, P = 0.003). Between the first and second weeks, there was also a trend towards larger values for the percentage of τ1 but the difference between the distributions did not prove significant in a K-S test.
There is a possibility that the time courses of synaptic decays in these cultures could have been affected by predesensitization of receptors by low concentrations of ambient GABA. Experiments using a potentiator of GABAA receptor activity (SB-205384; see below) showed that low concentrations of ambient GABA may be present even in continuously perfused (> 2 ml min−1) cultures. However, bath application of 100 nM GABA failed to alter the kinetics of mPSCs decay (4 cultures). While higher concentrations of GABA (250 nM) resulted in small changes in mPSC kinetics, they also increased baseline noise and evoked a small inward shift in holding current (at a holding potential of −60 mV) during whole-cell recordings. It is unlikely that GABA was present at these higher levels in our cultures since the GABAA receptor antagonist SR-95531 (10 μM, applied in the bath) did not result in either a decrease in baseline noise or measurable changes in holding current (5 different cultures). We therefore conclude that the levels of ambient GABA in these cultures are too low to affect the kinetics of mPSCs.
In summary then, the time courses of synaptic decays became faster during the developmental period examined here. In one-component fits, this was due to a progressive shortening of the time constant whereas, for those mPSCs fitted with two time constants, this reflects an increased predominance of the stable fast component. A fast component of decay, however, was observed in even the earliest-forming synapses.
Accuracy of exponential fits
The results above demonstrate that the patterns of age-related changes in the time constants of single- and double-exponential decay functions for mPSCs are different. However, close observation of exponential curves fitted to individual mPSCs suggested that one-exponent fits were often generated when two-component fits failed due to the presence of noise in the traces. To examine the nature of the errors generated by the fitting process, we used a simulation analysis similar to that of Diamond & Jahr (1997). We constructed computational two-component mPSCs for 1–4, 7–10 and 14–17 DIV neurons using, for each developmental period, the median time constant values and relative amplitudes determined experimentally (see Fig. 8C and D). These mPSCs were then scaled to have peak amplitudes between 15 and 20 pA and summed with baseline recordings (filtered at 2 kHz) to produce artificially noisy data with two exponential components. The data were then refitted with sums of exponentials according to the same procedure as for real mPSCs. The resulting best fit to two-component mPSCs with added noise was often a single component exponential. This was not always the case and depended on the details of the time course of the added noise, particularly near the peak of the mPSC. The apparent developmental change in time constant values from these distorted one-component fits (Fig. 9, •) is similar to the change in the one-component fits of the real data (○). Although this does not mean that mPSCs never decay with a single exponential component, we conclude that many of the apparent single-exponential fits we obtained from mPSCs are probably poor fits to data that actually contain multiple time constants.
Figure 9. Time constant values from exponential fits to noisy data can result in the misleading appearance of a developmental shift in kinetics.

Two-component relaxations with added noise were reconstructed using median values from mPSC data. •, time constant values arising from one-component fits to these reconstructed data. There is an apparent developmental trend, although there was little or no developmental change in time constant values in the original data used for the reconstruction (cf. Fig. 8C). Instead, the changing prominence of fast decay (cf. Fig. 8D) creates a misleading impression of a shorter time constant when noise prevents a good two-component fit. ○, median values experimentally measured for one-component fits to genuine mPSCs (cf. Fig. 8B).
Comparison of synaptic and patch kinetics
The shifting balance between the relative amplitudes of the fast and slow components of mPSC decay during development was reminiscent of the emergence of the fast component of desensitization in outside-out patches described earlier. To investigate this relationship, we compared the contributions of fast components in patch responses and in two-component mPSC decays during the first and second weeks in culture. During the first week, the fast component was more prominent in mPSC decays than in the responses of patches to sustained GABA applications (Fig. 10a). In contrast, by the second week of culturing, the distribution of fast and slow components of the mPSCs accurately reflected the desensitizing kinetics of patch responses (Fig. 10b). This indicates that the time course of synaptic decay at the earliest stages of synaptogenesis (i.e. on or before 4 DIV) is abnormally fast compared to the properties expected from patch responses during the same period. A similar relationship was found when comparing the values of decay time constants for patches and mPSCs. As shown in Fig. 10C, the distribution of time constants observed for 1–4 DIV mPSCs are predicted better by the patch time constants from 7–10 DIV cultures (continuous curve, same as faster component of Gaussian fit to older cultures from Fig. 6F) than by the values from 1–4 DIV cultures (dashed curve, same as Gaussian fit for younger cultures from Fig. 6F). Thus, even the earliest-appearing synapses during the first week in culture have kinetic properties characteristic of the fast desensitization that appears during the second week in culture in patches. Since membrane patches presumably contain both extrasynaptic and synaptic receptors, we suggest that this indicates a selective accumulation of quickly desensitizing receptors inside synapses.
Figure 10. Comparison of the fast components of patch desensitization and mPSC decay in young (1–4 DIV) and older (7–10 DIV) cultures.

A, cumulative distribution of the percentage of the fast component at a time when GABAA synapses were not common in the cultures. The fast component was less prominent in the data derived from GABA applications to patches (thin line) than in synaptic decays (thick line). B, the percentage of the fast component at a time when synapses are proliferating. The distributions at this stage are not significantly different. C, the time constant values of fast decay in 1–4 DIV synapses (columns) are more similar to those for 7–10 DIV patches (continuous curve) than for contemporaneous 1–4 DIV patches (dashed curve). The distributions indicated by the curves are from the Gaussian fits shown in Fig. 6F.
Differential modulation of synaptic and non-synaptic receptors by SB-205384
The α3 subunit mRNA and protein of the GABAA receptor is highly expressed in neurons prior to synaptogenesis (Laurie et al. 1992; Poulter et al. 1992; Fritschy & Mohler, 1995). Furthermore, GABAA receptors constructed using these subunits desensitize slowly (Gingrich et al. 1995). This is similar to the responses of membrane patches from the younger cultures in this study but different from the relaxations of mPSCs. This suggests that the ‘embryonic’α3 subunit may be preferentially excluded from synapses during development. To test this, we used SB-205384, a selective potentiator of GABAA currents mediated by receptors that include α3 subunits (Meadows et al. 1997, 1998). In 13 of 14 cells at various times in culture ranging from 6 to 17 DIV, bath-applied SB-205384 (5 μM) reversibly induced an inward shift in the whole-cell holding current (Fig. 11A; median 87 pA, IQR 19 pA). The response to SB-205384 did not depend on time in culture and was mediated by activation of GABAA receptors since it was > 80 % blocked (Fig. 11b) by prior addition of 50 μM SR-95531 to the bathing medium. In contrast with this consistent effect on whole-cell currents, SB-205384 had no significant effects on the distributions of mPSC amplitudes or the kinetic properties of their decays (e.g. Fig. 11C and D; K-S tests: amplitudes, P = 0.320; τ1, P = 0.793; τ2, P = 0.493; % fast, P = 0.311). These data show that at least one α subunit expressed early in development is preferentially excluded from synapses.
Figure 11. SB-205384, a GABA potentiator selective for GABAA receptors containing the α3 subunit, affects extrasynaptic, but not synaptic, receptors.

A, bath application of SB-205384 (SB, horizontal bar) caused an inward current and an increase in noise in whole-cell recordings (holding potential, −60 mV). B, both effects were blocked by pretreatment with the GABAA receptor antagonist SR-95531 (SR, long horizontal bar). C, mPSCs collected before (Control) and during (SB) application of SB-205384 in the same cell show little difference in kinetics (fast and slow time constant values and their relative weight shown below traces; dashed lines show baseline). D, summary data for SB-205384 effects on mPSC parameters. Each symbol represents the median for 11 neurons. Upper and lower error bars show interquartile range. None of the parameters showed a significant effect of SB-205384.
DISCUSSION
We have identified a component of GABAA receptor desensitization in excised membrane patches that becomes faster and more prominent when synapses first begin to form between neurons. The developmental time course of this fast (≈ 3 ms) component of desensitization was reflected in the responses of receptors following brief pulses of GABA. However, there was no corresponding similarity between the development of fast desensitization in excised patches and the decay kinetics of mPSCs. Instead, mPSCs arising before 4 DIV decayed faster than expected, having time constants similar to those measured for desensitization in patches during the second week in culture. This suggests that developing synapses preferentially accumulate fast-desensitizing receptors.
Fast desensitization and receptor deactivation
Following a brief exposure to high concentrations of GABA, in synapses or membrane patches, receptors relax through a succession of states before ultimately unbinding. The relative rates for entry into and exit from these states determine the time course of current flow during the relaxation. In membrane patches, we often found that receptor unbinding was slow relative to the macroscopic kinetics of fast desensitization. This resulted in a strong contribution of fast desensitization to the time course of GABA responses, regardless of whether the stimulating pulse of GABA was brief or sustained.
A similar balance between fast desensitization and slow unbinding has already been noted in pyramidal neurons in neocortical brain slices (Galarreta & Hestrin, 1997) and cultured hippocampal interneurons (Berger et al. 1998). According to our findings, however, this relationship is developmentally regulated and, as desensitization becomes faster, it plays a progressively larger role in shaping the time course of receptor deactivation following a brief pulse of GABA. This is not due to changes in receptor affinity. We also found that unbinding rates, as assessed by the comparison of responses to short and long applications of GABA (Fig. 6D), were variable but did not show a consistent trend. In addition, the average activation rates of GABAA receptors were unchanged throughout the experimental period (Fig. 4C). GABAA receptor affinity is, therefore, stable during the time of synaptogenesis.
Based on findings such as these, we expected that synaptic mPSC relaxations should be slow initially and subsequently ‘speed up’ by gaining a fast (< 5 ms) time constant of decay. However, this was not the case. The time course of mPSCs was found to speed up only through the augmentation of an already initially existing < 5 ms component. Furthermore, this took place primarily after the second week in culture – out of step with the developmental course of rapid desensitization in patches. These results suggest a differential accumulation of fast-desensitizing receptors in developing synapses. In this scenario, embryonic receptors with slow kinetic properties are extrasynaptic and thus dominate the kinetics of patch responses. During the first week of culturing, fast-desensitizing receptors appear and are seen first in synapses. By the second week, the turnover to faster desensitizing receptors becomes general and is also seen in extrasynaptic receptors.
Factors responsible for fast desensitization
What accounts for the emergence of the < 5 ms fast desensitization in developing GABA receptors? One possibility could be a progressive phosphorylation of both extrasynaptic and synaptic receptors. The difference between early patch kinetics and PSC time course could then reflect a preferential phosphorylation of synaptic receptors. However, Jones & Westbrook (1997) found that, while phosphorylating/dephosphorylating agents have profound effects on the values of fast and slow decay time constant values for GABA responses, they produce no change in the relative prominence of these components. This is opposite to the pattern of developmental changes described here, where the fast time constant for mPSC decay is unchanged with development whereas its contribution to the overall time course of decay increases. Furthermore, we have found, in immunoprecipitation experiments of GABA receptors containing the major adult α1 subunit, that basal phosphorylation peaks at 10 DIV in our cultures and thereafter declines (data not shown). Thus, changes in phosphorylation do not correlate with the changes in synaptic kinetics in our experiments and do not appear to account for the developmental changes documented in this study.
Another possibility is that a developmental change in GABA receptor subunits results in faster desensitizing receptor combinations, some of which may be preferentially localized to developing synapses. Others have found that subunit make-up controls the speed and extent of desensitization (Verdoorn et al. 1990; Dominguez-Perrot, Feltz & Poulter, 1995; Tia et al. 1996; Haas & Macdonald, 1999). Previous studies of GABAA receptor subunits expression (Laurie et al. 1992; Poulter et al. 1992, 1997), and our own RT-PCR data reported in this study, indicate that the α subunits are the most actively regulated during development. Therefore, we speculate that the fast desensitization is due to an α subunit combination upregulated in culture or in the brain shortly after birth. This may be similar to the situation in cerebellar granular cells where Tia et al. (1996) have shown that the developmental upregulation in the α6 subunit causes an increase in the desensitization rate of GABAA receptors.
Our data also suggest that mature synapses may exclude certain α subunits that are highly expressed before synaptogenesis. Our pharmacological data show that a positive modulator of α3 subunit-containing receptors causes a response in extrasynaptic receptors but does not affect the mPSCs. This fits with our other observations since α3 subunit-containing receptors are slowly desensitizing (Verdoorn, 1994; Gingrich et al. 1995) and therefore not expected to make large contributions to synaptic responses. Presumably, the α3 subunit-containing receptors remain extrasynaptic as neurons mature since the magnitude of the current evoked by SB-205384 was independent of the age of the culture. This is in apparent conflict with the developmental decrease we observed in α3 mRNA levels in these cultures; however, such discrepancies could be due to changes in any of the numerous steps involved in RNA transcription and protein trafficking within neurons. The preferential sorting of the α3 subunit in cortical neurons may be analogous to the sorting of GABAA receptor subunit combinations between synaptic and extra synaptic sites in cerebellum. There, slow desensitizing GABA receptors containing the δ subunits, which desensitize slowly (Haas & Macdonald, 1999), were excluded from synaptic sites (Nusser et al. 1998). So although unit conductances of synaptic and extrasynaptic GABAA receptors in neurons may be similar (DeKoninck & Mody, 1994), it seems that they have distinct pharmacology and perhaps kinetics.
Significance of fast synaptic decay
Fast desensitization of GABAA receptors has been described previously in rat neocortical (Otis & Mody, 1992; Galarreta & Hestrin, 1997; Xiang et al. 1998), cerebellar granule (Tia et al. 1996) and stellate (Nusser et al. 1997) neurons. Our median time constant value of approximately 3 ms is close to the fastest that has been reported at room temperature. No matter what mechanism limits the span of GABAAergic mPSCs to a few milliseconds, it suggests a role for GABAergic synaptic transmission in the promotion of precise timing operations in the nervous system. A similar role has been proposed for AMPAergic EPSCs, which also have fast decay times. If so, interacting excitatory and inhibitory inputs must occur in close proximity to avoid dendritic filtering. It is worth noting here that functional AMPAergic synapses dominate cortical excitation only after the first postnatal week when the prominence of the fast GABAAergic component in IPSCs is also large. In contrast, during the earliest stages of postnatal development, when slowly desensitizing NMDA receptors dominate glutamatergic transmission, GABAA receptors generally lack a fast component of desensitization (for a review see Ben-Ari et al. 1997). Thus, the development of GABAAergic kinetics is matched with a corresponding development in glutamatergic systems. This coordinated shift in synaptic timing for the two major transmission systems of the brain may correspond to an overall shift in the functioning of neural circuits from an inwardly looking, trophic capacity to a role concerned with information processing.
Heterogeneity in synaptic kinetics
The decay time constants of all mPSCs were heterogeneous throughout synaptogenesis. Indeed, the distributions of fitted exponential time constants usually had coefficients of variation of more than 0.5. Most striking was the heterogeneity observed within individual cells indicating that a selective subcellular trapping or trafficking of subunits to synaptic sites is at play. As recently pointed out (Hájos & Mody, 1997), such heterogeneity of synapses within and among cells could be a functional aspect of neuronal organization. It may reflect, for example, differences in the identity of presynaptic inhibitory cells. In the brain, different types of inhibitory cells have different subcellular targets on cortical pyramidal neurons (Tamas et al. 1997). This segregation of inputs may correspond to a subcellular segregation of GABAAα subunits as seen in hippocampal neurons (Nusser et al. 1996). Given that there are many different α subunits expressed in the cortex, it seems likely that synaptic heterogeneity, which is established early in development, may use a similar α subunit selectivity. Furthermore, as most inhibitory inputs to cortical pyramidal cells arise from a diverse population of GABAergic neurons within the cortex (Kawaguchi, 1995; Cauli et al. 1997), synaptic heterogeneity could be a mechanism for controlling the modality of inhibition. Finally, we point out that heterogeneity is an essential raw material for any selective process in nature. For a neuron, the greater the heterogeneity among its synaptic properties the larger is its repertoire of ways to interact with other neurons.
Acknowledgments
We thank L. Brown for assistance in preparing neocortical cultures, Dr B. Chakravarthy for help with immunoprecipitation experiments, and Dr D. Small for advice in obtaining GABAergic agents. SB-205384 was a gift from Dr T. Blackburn of SmithKline Beecham Pharmaceuticals.
References
- Ben-Ari Y, Khazipov R, Leinekugel X, Caillard O, Gaiarsa JL. GABAA, NMDA and AMPA receptors: a developmentally regulated ‘menage a trois’. Trends in Neurosciences. 1997;20:523–529. doi: 10.1016/s0166-2236(97)01147-8. [DOI] [PubMed] [Google Scholar]
- Berger T, Schwarz C, Kraushaar U, Monyer H. Dentate gyrus basket cell GABAA receptors are blocked by Zn2+ via changes of their desensitization kinetics: an in situ patch-clamp and single-cell PCR study. Journal of Neuroscience. 1998;18:2437–2448. doi: 10.1523/JNEUROSCI.18-07-02437.1998. [DOI] [PMC free article] [PubMed] [Google Scholar]
- Brooks KA, Jin H, Price M, Dichter MA. Developmental expression of GABA(A) receptor subunit mRNAs in individual hippocampal neurons in vitro and in vivo. Journal of Neurochemistry. 1997;70:1017–1028. doi: 10.1046/j.1471-4159.1998.70031017.x. [DOI] [PubMed] [Google Scholar]
- Cauli B, Audinat E, Lambolez B, Angulo MC, Ropert N, Tsuzuki K, Hestrin S, Rossier J. Molecular and physiological diversity of cortical nonpyramidal cells. Journal of Neuroscience. 1997;17:3894–3906. doi: 10.1523/JNEUROSCI.17-10-03894.1997. [DOI] [PMC free article] [PubMed] [Google Scholar]
- Dekoninck Y, Mody I. Noise analysis of miniature IPSCs in adult rat brain slices: properties and modulation of synaptic GABAA receptor channels. Journal of Neurophysiology. 1994;71:1318–1335. doi: 10.1152/jn.1994.71.4.1318. [DOI] [PubMed] [Google Scholar]
- Diamond JS, Jahr CE. Transporters buffer synaptically released glutamate on a submillisecond time scale. Journal of Neuroscience. 1997;17:4672–4687. doi: 10.1523/JNEUROSCI.17-12-04672.1997. [DOI] [PMC free article] [PubMed] [Google Scholar]
- Dominguez-Perrot C, Feltz P, Poulter MO. Recombinant GABAA receptor desensitization: the role of the γ2 subunit and its physiological significance. The Journal of Physiology. 1995;497:145–159. doi: 10.1113/jphysiol.1996.sp021756. [DOI] [PMC free article] [PubMed] [Google Scholar]
- Fritschy JM, Mohler H. GABAA-receptor heterogeneity in the adult rat brain: differential regional and cellular distribution of seven major subunits. Journal of Comparative Neurology. 1995;359:154–194. doi: 10.1002/cne.903590111. [DOI] [PubMed] [Google Scholar]
- Galarreta M, Hestrin S. Properties of GABAA receptors underlying inhibitory synaptic currents in neocortical pyramidal neurons. Journal of Neuroscience. 1997;17:7220–7227. doi: 10.1523/JNEUROSCI.17-19-07220.1997. [DOI] [PMC free article] [PubMed] [Google Scholar]
- Gingrich KJ, Roberts WA, Kass RS. Dependence of the GABAA receptor gating kinetics on the α-subunit isoform: implications for structure-function relations and synaptic transmission. The Journal of Physiology. 1995;489:529–543. doi: 10.1113/jphysiol.1995.sp021070. [DOI] [PMC free article] [PubMed] [Google Scholar]
- Gu X, Spitzer NC. Distinct aspects of neuronal differentiation encoded by frequency of spontaneous Ca2+ transients. Nature. 1995;375:784–787. doi: 10.1038/375784a0. [DOI] [PubMed] [Google Scholar]
- Haas KF, Macdonald RL. GABAA receptor subunit γ2 and δ-subtypes confer unique kinetic properties on recombinant GABAA receptor currents in mouse fibroblasts. The Journal of Physiology. 1999;514:27–45. doi: 10.1111/j.1469-7793.1999.027af.x. [DOI] [PMC free article] [PubMed] [Google Scholar]
- Hájos N, Mody I. Synaptic communication among hippocampal interneurons: Properties of spontaneous IPSCs in morphologically identified cells. Journal of Neuroscience. 1997;17:8427–8442. doi: 10.1523/JNEUROSCI.17-21-08427.1997. [DOI] [PMC free article] [PubMed] [Google Scholar]
- Hollrigel GS, Soltesz I. Slow kinetics of miniature IPSCs during early postnatal development in granule cells of the dentate gyrus. Journal of Neuroscience. 1997;17:5119–5128. doi: 10.1523/JNEUROSCI.17-13-05119.1997. [DOI] [PMC free article] [PubMed] [Google Scholar]
- Hutcheon B, Poulter MO. Developmental switch in desensitization kinetics determines time course of GABA mediated synaptic transmission. Society for Neuroscience Abstracts. 1997;23:102. [Google Scholar]
- Jones MV, Westbrook GL. Desensitized states prolong GABAA channel responses to brief agonist pulses. Neuron. 1995;15:181–191. doi: 10.1016/0896-6273(95)90075-6. [DOI] [PubMed] [Google Scholar]
- Jones MV, Westbrook GL. Shaping of IPSC's by endogenous calcineurin activity. Journal of Neuroscience. 1997;17:7626–7633. doi: 10.1523/JNEUROSCI.17-20-07626.1997. [DOI] [PMC free article] [PubMed] [Google Scholar]
- Kawaguchi Y. Physiological subgroups of nonpyramidal cells with specific morphological characteristics in layer II/III of rat frontal cortex. Journal of Neuroscience. 1995;15:2638–2655. doi: 10.1523/JNEUROSCI.15-04-02638.1995. [DOI] [PMC free article] [PubMed] [Google Scholar]
- Laurie DJ, Wisden W, Seeburg PH. The distribution of thirteen GABAA receptor subunit mRNAs in the rat brain. III. Embryonic and postnatal development. Journal of Neuroscience. 1992;12:4151–4172. doi: 10.1523/JNEUROSCI.12-11-04151.1992. [DOI] [PMC free article] [PubMed] [Google Scholar]
- Leinekugel X, Tseeb V, Ben-Ari Y, Bregestovski P. Synaptic GABAA activation induces Ca2+ rise in pyramidal cells and interneurons from rat neonatal hippocampal slices. The Journal of Physiology. 1995;487:319–329. doi: 10.1113/jphysiol.1995.sp020882. [DOI] [PMC free article] [PubMed] [Google Scholar]
- Loturco JJ, Owens DF, Heath MJS, Davis MBE, Kriegstein AR. GABA and glutamate depolarize cortical progenitor cells and inhibit DNA synthesis. Neuron. 1995;15:1287–1298. doi: 10.1016/0896-6273(95)90008-x. [DOI] [PubMed] [Google Scholar]
- Ma W, Saunders PA, Somogyi R, Poulter MO, Barker JL. Ontogeny of GABAA receptor subunit mRNAs in rat spinal cord and dorsal root ganglia. Journal of Comparative Neurology. 1993;338:337–359. doi: 10.1002/cne.903380303. [DOI] [PubMed] [Google Scholar]
- Meadows HJ, Harries MH, Thompson M, Benham CD. Effect of SB-205384 on the decay of GABA-activated chloride currents in granule cells cultured from rat cerebellum. British Journal of Pharmacology. 1997;121:1334–1338. doi: 10.1038/sj.bjp.0701251. [DOI] [PMC free article] [PubMed] [Google Scholar]
- Meadows HJ, Kumar CS, Pritchett DB, Blackburn TP, Benham CD. SB-205384: a GABA(A) receptor modulator with novel mechanism of action that shows subunit selectivity. British Journal of Pharmacology. 1998;123:1253–1259. doi: 10.1038/sj.bjp.0701721. [DOI] [PMC free article] [PubMed] [Google Scholar]
- Nusser Z, Cull-Candy S, Farrant M. Differences in synaptic GABA(A) receptor number underlie variation in GABA mini amplitude. Neuron. 1997;19:697–709. doi: 10.1016/s0896-6273(00)80382-7. [DOI] [PubMed] [Google Scholar]
- Nusser Z, Sieghart W, Benke D, Fritschy JM, Somogyi P. Differential synaptic localization of two major γ-aminobutyric acid type A receptor α subunits on hippocampal pyramidal cells. Proceedings of the National Academy of Sciences of the USA. 1996;93:11939–11944. doi: 10.1073/pnas.93.21.11939. [DOI] [PMC free article] [PubMed] [Google Scholar]
- Nusser Z, Sieghart W, Somogyi P. Segregation of different GABAA receptors to synaptic and extrasynaptic membranes of cerebellar granule cells. Journal of Neuroscience. 1998;18:1693–1703. doi: 10.1523/JNEUROSCI.18-05-01693.1998. [DOI] [PMC free article] [PubMed] [Google Scholar]
- Otis TS, Mody I. Modulation of decay kinetics and frequency of GABAA receptor-mediated spontaneous inhibitory postsynaptic currents in hippocampal neurons. Neuroscience. 1992;49:13–32. doi: 10.1016/0306-4522(92)90073-b. [DOI] [PubMed] [Google Scholar]
- Poulter MO, Barker JL, O'carroll AM, Lolait SJ, Mahan LC. Differential and transient expression of GABAA receptor α-subunit mRNAs in the developing rat CNS. Journal of Neuroscience. 1992;12:2888–2900. doi: 10.1523/JNEUROSCI.12-08-02888.1992. [DOI] [PMC free article] [PubMed] [Google Scholar]
- Poulter MO, Ohannesian L, Larmet Y, Feltz P. Evidence that GABAA receptor subunit mRNA expression during development is regulated by GABAA receptor stimulation. Journal of Neurochemistry. 1997;68:631–639. doi: 10.1046/j.1471-4159.1997.68020631.x. [DOI] [PubMed] [Google Scholar]
- Reichling DB, Kyrozis A, Wang J, Macdermott AB. Mechanisms of GABA and glycine depolarization-induced calcium transients in rat dorsal horn neurons. The Journal of Physiology. 1994;476:411–421. doi: 10.1113/jphysiol.1994.sp020142. [DOI] [PMC free article] [PubMed] [Google Scholar]
- Sciancalepore M, Savic N, Gyori J, Cherubini E. Facilitation of miniature GABAergic currents by ruthenium red in neonatal rat hippocampal neurons. Journal of Neurophysiology. 1998;80:2316–2322. doi: 10.1152/jn.1998.80.5.2316. [DOI] [PubMed] [Google Scholar]
- Serafini R, Valeyev AY, Barker JL, Poulter MO. Depolarizing GABA-activated Cl− channels in embryonic rat spinal and olfactory bulb cells. The Journal of Physiology. 1995;488:371–386. doi: 10.1113/jphysiol.1995.sp020973. [DOI] [PMC free article] [PubMed] [Google Scholar]
- Tamas G, Buhl EH, Somogyi P. Fast IPSPs elicited via multiple synaptic release sites by different types of GABAergic neurone in the cat visual cortex. The Journal of Physiology. 1997;500:715–738. doi: 10.1113/jphysiol.1997.sp022054. [DOI] [PMC free article] [PubMed] [Google Scholar]
- Tia S, Wang JF, Kotchabhakdi N, Vicini S. Developmental changes of inhibitory synaptic currents in cerebellar granule neurons: Role of GABAA receptor α6 subunit. Journal of Neuroscience. 1996;16:3630–3640. doi: 10.1523/JNEUROSCI.16-11-03630.1996. [DOI] [PMC free article] [PubMed] [Google Scholar]
- Traub RD, Whittington MA, Colling SB, Buzsaki G, Jefferys JG. Analysis of gamma rhythms in the rat hippocampus in vitro and in vivo. The Journal of Physiology. 1996;493:471–484. doi: 10.1113/jphysiol.1996.sp021397. [DOI] [PMC free article] [PubMed] [Google Scholar]
- Trudeau LE, Doyle RT, Emery DG, Haydon PG. Calcium-independent activation of the secretory apparatus by ruthenium red in hippocampal neurons: a new tool to assess modulation of presynaptic function. Journal of Neuroscience. 1996;16:46–54. doi: 10.1523/JNEUROSCI.16-01-00046.1996. [DOI] [PMC free article] [PubMed] [Google Scholar]
- Tsubokawa H, Ross WN. IPSPs modulate spike backpropagation and associated [Ca2+]i changes in the dendrites of hippocampal CA1 pyramidal neurons. Journal of Neurophysiology. 1996;76:2896–2906. doi: 10.1152/jn.1996.76.5.2896. [DOI] [PubMed] [Google Scholar]
- Verdoorn TA. Formation of heteromeric γ-aminobutyric acid type A receptors containing two different α subunits. Molecular Pharmacology. 1994;45:475–480. [PubMed] [Google Scholar]
- Verdoorn TA, Draguhn A, Ymer S, Seeburg PH, Sakmann B. Functional properties of recombinant rat GABAA receptors depend upon subunit composition. Neuron. 1990;4:919–928. doi: 10.1016/0896-6273(90)90145-6. [DOI] [PubMed] [Google Scholar]
- Wang J, Morley P, Begin-Heick N, Whitfield J. Do pancreatic islet cells from neonatal rats have surface receptors or sensors for divalent cations? Cellular Signalling. 1995;7:651–658. doi: 10.1016/0898-6568(95)00044-p. [DOI] [PubMed] [Google Scholar]
- Wang XJ, Buzsaki G. Gamma oscillation by synaptic inhibition in a hippocampal interneuronal network model. Journal of Neuroscience. 1996;16:6402–6413. doi: 10.1523/JNEUROSCI.16-20-06402.1996. [DOI] [PMC free article] [PubMed] [Google Scholar]
- Whittington MA, Traub RD, Jefferys JG. Synchronized oscillations in interneuron networks driven by metabotropic glutamate receptor activation. Nature. 1995;373:612–615. doi: 10.1038/373612a0. [DOI] [PubMed] [Google Scholar]
- Wisden W, Laurie DJ, Monyer H, Seeburg PH. The distribution of 13 GABAA receptor subunit mRNAs in the rat brain. I. Telencephalon, diencephalon, mesencephalon. Journal of Neuroscience. 1992;12:1040–1062. doi: 10.1523/JNEUROSCI.12-03-01040.1992. [DOI] [PMC free article] [PubMed] [Google Scholar]
- Xiang Z, Huguenard JR, Prince DA. GABAA receptor-mediated currents in interneurons and pyramidal cells of rat visual cortex. The Journal of Physiology. 1998;506:715–730. doi: 10.1111/j.1469-7793.1998.715bv.x. [DOI] [PMC free article] [PubMed] [Google Scholar]
- Yuste R, Katz LC. Control of postsynaptic Ca2+ influx in developing neocortex by excitatory and inhibitory neurotransmitters. Neuron. 1991;6:333–344. doi: 10.1016/0896-6273(91)90243-s. [DOI] [PubMed] [Google Scholar]