

Abstract
Whole-cell recordings were made from rat CA1 neurones in brain slices. When electrodes contained diazo-2 (2 mm) or dibromo BAPTA (1 mm) a large steady-state outward current (hundreds of picoamps) developed within 5 min of breakthrough at a VH of −60 mV. BAPTA itself (1 mm) caused qualitatively similar but smaller effects.
The outward current was accompanied by increased conductance with a null potential close to the calculated K+ equilibrium potential (EK) of −110 mV. Development of outward current occurred concurrently with progressive loss of slow AHP tail current (IsAHP) evoked by brief depolarizations. The peak latency of IsAHP increased during the onset of chelator action.
The persistent outward current was reversibly inhibited by noradrenaline (10 μm) or isoprenaline (2–5 μm), and completely prevented by 8-bromoadenosine 3′,5′ cyclic monophosphate (8-Br cAMP; 100 μm) or QX-314 (10 mm) in recording electrodes. After development of outward current, diazo-2 photolysis caused inward current and decreased conductance. Both flash- and noradrenergic-sensitive responses were inwardly rectifying outward currents with null potentials close to EK.
The outward current induced by dibromo BAPTA was not blocked by internal EGTA (10 mm). However, experiments incorporating Ca2+ influx or Ca2+ loading of the buffer indicate that Ca2+ facilitated the outward current.
The outward currents induced by dibromo BAPTA or diazo-2 were not associated with significant changes in resting [Ca2+]i. Regions of the cell contributing to the outward current were deduced from measurements of fura-2 diffusion. These were compared with regions of [Ca2+]i elevation during IsAHP.
These results are consistent with the hypothesis that the BAPTA series Ca2+ buffers can activate those Ca2+-activated K+ channels that underlie the slow AHP, without the predicted elevation of bulk [Ca2+]i. Therefore these results cannot be interpreted solely in terms of Ca2+ concentration changes, although the observations illustrate a novel, investigative role for these compounds in the study of Ca2+-dependent processes.
The Ca2+ buffer BAPTA and its derivatives are used widely for measurement and manipulation of intracellular free Ca2+ concentration ([Ca2+]i). Studies with these compounds have occasionally included the parenthetic observation of hyperpolarization or outward current in association with their use (Schwindt et al. 1992b; Zhang et al. 1995; Velumian & Carlen, 1999). Since Ca2+ buffers may load with Ca2+ after introduction into cells (Mulkey & Zucker, 1993) or from impurities in salts, a persistent Ca2+-dependent K+ current has been suggested as the basis for this tonic outward current (Zhang et al. 1995; Velumian & Carlen, 1999), analogous to the likely explanation for the hyperpolarized membrane potential observed with Ca2+-loaded nitr-5 (Lancaster & Zucker, 1994).
This paper reports a quantitative investigation of this outward current using, principally, two BAPTA-derived Ca2+ buffers, diazo-2 and dibromo BAPTA. Diazo-2 is photolabile (unphotolysed KD 2.2 μm, photolysed KD 73 nM; Adams et al. 1989), thus allowing a convenient change of buffer properties during the experiment. Dibromo BAPTA has a KD (1.5 μm, Pethig et al. 1989) in the same range as unphotolysed diazo-2, but since it is not photolabile, we could use this compound in conjunction with ratiometric Ca2+ imaging with fura-2. We conclude that the outward current is generated by tonic activation of IsAHP that occurs without detectable bulk [Ca2+]i elevation.
The IsAHP, which is presumed to be generated by SK-type Ca2+-activated K+ channels, is conventionally studied with the Ca2+ influx accompanying action potentials or voltage clamp depolarizations. The physiological relevance of this approach is offset by the natural spatial and temporal variability of the Ca2+ signal or Ca2+-dependent process. Spatial variability will result from uneven distribution of calcium channels or their targets, in addition to the uncertainties of action potential propagation/depolarization over the soma-dendritic axis. Temporal variability is an intrinsic feature of depolarization-evoked Ca2+ entry which is initially localized to domains of high concentration on a millisecond time scale before dissipating to a reduced but less localized Ca2+ signal lasting seconds (Llinás et al. 1992; Monck et al. 1994; Eilers et al. 1995). The resultant ambiguities have allowed different interpretations of Ca2+ dependence of the Ca2+-activated K+ current which produces slow afterhyperpolarizations (sAHPs) in CA1 pyramidal cells. The time course of this current and some pharmacological properties have been variously attributed to direct activation by buffered Ca2+ (Lancaster & Zucker, 1994; Zhang et al. 1995), Ca2+-induced Ca2+ release (Sah & McLachlan, 1991; Tanabe et al. 1998), Ca2+ in conjunction with other second messengers (Schwindt et al. 1992a; Lasser-Ross et al. 1997) and delayed facilitation (reopening) of calcium channels following depolarization (Marrion & Tavalin, 1998).
These experiments with BAPTA-derived buffers allowed investigation of Ca2+-activated K+ current without depolarization-induced Ca2+ influx and thereby clarification of some issues which have been difficult to address by other methods. This principle has been used previously (Lancaster & Zucker, 1994; Sah & Clements, 1999) in experiments using flash photolytic release of Ca2+, but these are still transient events generated from a gradually depleting source as the buffer is photolysed. A steady-state Ca2+-activated K+ current is a major technical improvement which is much more amenable to investigation. In addition, imaging of the isosbestic (Ca2+-insensitive) wavelength of fura-2 allowed us to track the progress of dye after breakthrough while monitoring the electrical properties of the cell. With this novel information we can place some constraints on the spatial localization of membrane currents generated by the calcium chelators.
Some of this material has been published in abstract form (Lancaster & Batchelor, 1999).
METHODS
Tissue preparation
Hippocampi were obtained from 14- to 21-day-old rat pups after cervical dislocation and decapitation. Transverse slices (400 μm) were cut using a Vibratome (TPI-1000, Intracel, Royston, UK) and maintained at room temperature (15–30°C) at the interface between a moist oxygenated atmosphere and a medium of the following composition (mm): NaCl, 119; KCl, 2.5; MgCl2, 1.3; CaCl2, 2.0; NaH2PO4, 1.0; NaHCO3, 26; glucose, 11. This solution bubbled with 95 % O2-5 % CO2 was also perfused in the recording chamber where slices were submerged and temperature maintained between 28–30°C. Drugs were obtained from BDH (Poole, Dorset, UK) unless specified otherwise. Other chemicals used in the external solution were isoprenaline bitartrate and (-)-noradrenaline bitartrate (Sigma, St Louis, MO, USA).
Electrophysiology
Recording pipettes were fabricated with a horizontal puller (Sutter Instruments, Novato, CA, USA) using thin-walled glass containing a filament (Clark Electromedical, Pangbourne, UK). They were filled with the following solution (mM): potassium methylsulphate, 150 (Phase Separations, Wales); KCl, 10; Hepes, 10 (Sigma); NaCl, 4; MgATP, 4 (Sigma); NaGTP, 0.4 (Sigma). Osmolarity was adjusted to 280–290 mosmol l−1 and pH to 7.35-7.4 with KOH. Final K+ concentration was 160 mM. The methylsulphate anion was used because it has been shown to preserve IsAHP in a form similar to that observed with sharp electrode recordings (Lancaster & Adams, 1986; Zhang et al. 1994). Stock solutions of diazo-2 or dibromo BAPTA (Molecular Probes Europe, The Netherlands) were made in 150 mM KMops (pH 7.4, Sigma) and stored as aliquots at −20°C before dilution in the pipette solution. Pipette solution occasionally included 2 mM BAPTA, 10 mM EGTA (Sigma, pH 7.3-7.4 with KOH), QX-314 (10 mM, Alomone Labs, Jerusalem, Israel) or 8-Br cAMP (100 μM, Sigma). Open pipette resistance was 2–4 MΩ. Whole-cell patch voltage clamp recordings were obtained from neurones in the CA1 stratum pyramidale without visual identification. Access resistances ranged from 8 to 25 MΩ. Series resistance compensation was set to 70–80 % with a 10 μs lag. Membrane currents were recorded and filtered (500 Hz) using an Axopatch 1D (Axon Instruments, Foster City, CA, USA) and digitized at 1 kHz using a Digidata 1200 and pCLAMP 6 software (Axon Instruments) on an Intel 486-based personal computer. Analysis was performed using pCLAMP 6 and Origin (MicroCal Software Inc., Northampton, MA, USA).
Photolysis of diazo-2 was accomplished using a xenon arc flashlamp (Rapp design, Hi-Tech Scientific, Salisbury, UK) focussed on the recording chamber to illuminate a spot covering the CA1 region. Repeatability of flash actions indicates that photolysis is typically incomplete following a single flash (see also Lancaster & Zucker, 1994). This is caused by UV scattering and absorbance according to tissue and solution depth. Additionally, the absorption spectrum of diazo-2 (Adams et al. 1989) has a bandwidth that comprises less than 20 % of the total energy output of the 1 ms flash discharge.
Calcium imaging
To estimate the free cytoplasmic calcium ion concentration, [Ca2+]i, we added the calcium indicator dye fura-2 (200 μM of the pentapotassium salt; Molecular Probes) to the relevant pipette solutions. The emitted fluorescence of fura-2 was recorded using a cooled CCD camera (C4880-81 in 10-bit mode, 2 × 2 binning, Hamamatsu Photonics, Hamamatsu City, Japan) mounted on an upright microscope (Axioskop-FS, Zeiss, Welwyn Garden City, UK). The cells were imaged using a ×40 water immersion lens (Achroplan, numerical aperture 0.75, Zeiss). Excitation light was switched between 340 nm (half-width 14 nm, Chroma Technology, Brattleboro, VT, USA), 360 nm (half-width 10 nm, Omega Optical, Brattleboro, VT, USA) and 380 nm (half-width 14 nm, Chroma Technology) by a filter wheel (Lambda 10–2, Sutter Instruments) under the control of the image acquisition software (Acquisition Manager 3.10, Kinetic Imaging, Liverpool, UK). Image triplets (exposure 223 ms, separation ∼680 ms) were acquired every 7 s. [Ca2+]i was estimated using standard methods (Grynkiewicz et al. 1985) using a ratio of the fluorescence excited at 340 and 380 nm, where [Ca2+]i=KD(Sf2/Sb2)(R – Rmin/Rmax- R), where Rmin and Rmax are the fluorescence ratios in the absence and presence of saturating Ca2+, and Sf2 and Sb2 are 380 nm fluorescence in zero and saturating calcium, respectively. Values for Rmax (6.70), Rmin (0.43) and Sf2/Sb2 (5.95) were obtained by recording the fluorescence of the somatic region with either saturating (internal solution plus 10 mM CaCl2) or zero calcium levels (i.e. +10 mM EGTA). The KD of fura-2 under our conditions was estimated to be ∼200 nM.
Faster temporal resolution (15–20 Hz) during IsAHP was achieved with single wavelength imaging of fura-2 at 380 nm. The fluorescence signal is presented as -ΔF/F (per cent), where F is the mean value 1 s prior to depolarization. Single wavelength measurements were bracketed by ratio measurements; this allowed conversion of the fluorescence changes to approximate [Ca2+]i.
Calcium imaging during diazo-2 photolysis experiments was performed using the visible wavelength Ca2+ indicator calcium green-1 (200 μM, tetrapotassium salt, Molecular Probes). This was necessary to avoid photolysis of the diazo-2 by the UV wavelengths used to excite fura-2. Diazo-2 photolysis was performed using the xenon microscope lamp filtered through a UG11 filter (330 nm peak, H. V. Skan Ltd, Solihull, UK) installed in the filter wheel.
Data were analysed using Lucida 3.53 (Kinetic Imaging), Origin 4.1 (Microcal) and Excel-97 (Microsoft Inc.). Statistical significance was assessed using Student's unpaired t test.
The ‘blind’ patch-recording technique we employed necessitates the use of positive pressure for successful seal formation. This results in significant levels of fluorescence due to extracellular dye. The problem is particularly relevant in the experiments where we monitor the fluorescence immediately following breakthrough, i.e. during the development of the outward current. This background signal is neither stationary during the experiment (due to washing away the dye) nor is it evenly distributed throughout the field of view. Therefore a single background area will not provide adequate background correction for all parts of the image acquired. Instead, correction was made using matched background areas adjacent to the cellular region of interest for each time point. Electrophysiology was as before but using an Axopatch 200B for voltage clamp experiments or an Axoclamp-2A for acquisition of current clamp data. Some imaging data, not involving IsAHP, were acquired at room temperature with no obvious effect on resting [Ca2+]i.
RESULTS
Diffusion of diazo-2 or dibromo BAPTA into the cell was associated with an outward current which peaked within 4–5 min of seal breakthrough to whole-cell recording. This was routinely observed in the presence of the BAPTA-derived chelators (n = 87/88 cells), the single exception being a putative interneurone characterized by a brief spike duration (400 μs at half-amplitude) and the ability to fire at high frequency (up to 260 Hz). Figure 1a shows sample current traces from the voltage protocol (inset) designed to assess electrophysiological changes associated with the outward current. A voltage step from hold (VH, −60 mV) to −120 mV prior to a 3 s ramp to −50 mV produced a quasi-steady-state current-voltage (I–V) relation. This was followed by an 80 ms step to −10 mV to evoke unclamped Ca2+ influx which initially was able to generate IsAHP (lower trace in Fig. 1a). The second superimposed trace in Fig. 1a (2 mM diazo-2 in the pipette) was obtained after a 300 pA outward current had developed with a time course shown in Fig. 1B. The extra current was associated with an increase in conductance, as indicated by the increased current step at the end of the ramp and by the increased slope of the I–V plot in Fig. 1C. The I–V plots were fitted with a straight line between −80 and −90 mV. The extrapolation of this fit is visible in Fig. 1C and the intersection occurs at −107 mV, which is close to the calculated EK of −110 mV for these experiments. Another characteristic of the action of diazo-2 was loss of the depolarization-evoked IsAHP in tandem with the development of outward current (Fig. 1A, D and E). These two events are strongly correlated (Fig. 1E inset) and the IsAHP peak shows a shift to longer latency during this process (Fig. 1D). In some cells the buffer produced an additional inward current that was apparent during steps to −100 mV. In this paper we confine ourselves to study of the K+ conductance increase.
Figure 1. Characteristics of outward current produced by intracellular diazo-2.

A, membrane current in response to the voltage protocol shown in the inset, before and after development of a steady-state outward current. B, time course of outward current development; the abscissa represents time of whole-cell recording. C, current-voltage relation of the slope regions from A. The data were fitted with a straight line between −80 and −90 mV. Extrapolation of these fits crosses at −107 mV. D, loss of the depolarization-evoked IsAHP is accompanied by an increase in the time to peak of this current. E, time course of the loss of IsAHP is closely correlated (inset, R =−0.97) with the development of the outward current.
Diazo-2 is a photosensitive Ca2+ buffer which undergoes an increase in affinity upon photolysis (unphotolysed KD 2.2 μm, photolysed KD 73 nM). Photolysis should therefore reduce the availability of Ca2+ within the cell and thereby test the hypothesis that the outward current is due to persistent Ca2+-activated K+ current, as previously suggested (Zhang et al. 1995; Velumian & Carlen, 1999). An example of this experiment is illustrated in Fig. 2a where 150 J flash discharges progressively reversed the outward current. The partial reversibility or recovery from the flash was a common feature of this manipulation (20/22 cells). Individual traces immediately before and after the first flash are shown in Fig. 2B; the inward shift in holding current caused by the flash was accompanied by a decrease in membrane conductance. The slope regions in Fig. 2B were subtracted to produce the I–V relation of flash-sensitive current in Fig. 2C. The current had a null potential between −100 and −110 mV and showed inward rectification as expected for K+ current under asymmetric conditions. The time course of outward current relaxation following photolysis is illustrated in Fig. 2D. Records at 20 s intervals show current traces before, during and after a flash (arrow). The discharge, accompanied by a brief spike artifact, was followed by a current relaxation which required two time constants for an adequate fit to the data. This analysis was performed in six cells yielding τ1= 88 ± 17 ms and τ2= 962 ± 239 ms (means ±s.e.m.).
Figure 2. Effects of diazo-2 photolysis on persistent outward current.
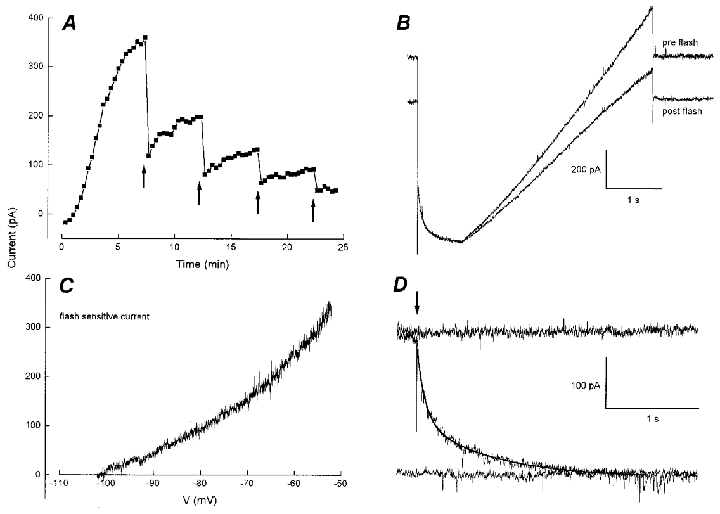
A, UV flashes (150 J, arrows) cause partial reversal of outward current; the flashes are followed by incomplete recovery leading to a cumulative loss of outward current after 4 flashes. B, pre- and post-flash membrane current traces (VH−60 mV, step to −100 mV for 500 ms, then a 3 s ramp to −50 mV). The post-flash inward current is associated with a reduction in slope and chord conductance. C, flash-sensitive current obtained by subtraction of slope regions in B. D, data from a different cell illustrating the time course of outward current decay following a 150 J flash (arrow). The smooth curve is a bi-exponential fit with τ1= 89 ms and τ2= 799 ms.
The flash sensitivity shown in Fig. 2 would normally be taken as evidence for a Ca2+ dependence of the tonically activated outward K+current (but see Figs 7 and 8). CA1 pyramidal cells contain at least three Ca2+-activated K+ currents. The BK type, which is TEA sensitive, is unlikely to be involved since implausibly high [Ca2+]i (Barrett et al. 1982; Yoshida et al. 1991) would be required to maintain activity at potentials negative to rest as in Figs 1 and 2. The most likely candidates are therefore apamin-sensitive and -insensitive SK-type Ca2+-activated K+ currents (Stocker et al. 1999). Our attention focussed on the IsAHP which is lost during outward current development; this is an apamin-insensitive current. There are no selective toxins for this current but it has a well described sensitivity to β-noradrenergic receptor agonists (Madison & Nicoll, 1986). We therefore used noradrenaline or isoprenaline as a pharmacological test on the outward current caused by diazo-2. Figure 3a shows that the diazo-2-dependent outward current was completely and reversibly sensitive to the β-specific agonist isoprenaline (2 μM) or UV flashes. Sample traces for control and isoprenaline application are shown in Fig. 3B. Subtracted slope regions under the relevant conditions generated currents that were isoprenaline and flash sensitive (Fig. 3C). After normalization to peak amplitude, these currents displayed identical I–V characteristics (Fig. 3D) of an inwardly rectifying outward current with a null potential close to EK.
Figure 7. Outward current under high and low Ca2+-loading conditions.

A, current traces showing effects of 0.5 mM Ca2+-1 mM dibromo BAPTA (voltage protocol as in Fig. 1A). B current traces showing effects of 10 mM EGTA-1 mM dibromo BAPTA. C, summary data for outward current development with Ca2+-loaded chelator (▾, n = 5) or in the presence of EGTA (▪, n = 5). For comparison, the control data without manipulation of Ca2+ (•) are reproduced from Fig. 6. All points represent mean ±s.e.m.
Figure 8. [Ca2+]i measurements during action of BAPTA series chelators.

A, image of a fura-2-filled CA1 cell indicating regions of interest for Ca2+ measurements. B, data taken from the cell in A show [Ca2+]i in the somatic (•) and dendritic region (dotted line) in conjunction with the development of outward current (▪; 1 mM dibromo BAPTA) following breakthrough at t = 0 s. Periodic [Ca2+]i elevations arise from the depolarizing voltage commands. C, left panel, mean somatic [Ca2+]i after 4–5 min recording for control (cont) cells and dibromo BAPTA with (DBB + cAMP) or without 8-Br cAMP (DBB). The right panel shows contemporaneous values of holding current under these conditions. D, a comparison of resting calcium green-1 fluorescence and holding current before (pre) and after (post) diazo-2 photolysis.
Figure 3. Correspondence of UV and noradrenergic sensitivity of outward current.

A, action of 2 μM isoprenaline (iso) and UV flashes (150 J, arrows) on the outward current caused by diazo-2. B, current traces (VH−60 mV, step to −100 mV then a 3 s ramp to −50 mV) before (con) and after isoprenaline (+iso) treatment show an inward current accompanied by a decrease in membrane conductance. C isoprenaline- and flash-sensitive currents obtained by subtraction. D normalization of the currents in C.
Summary data for the membrane actions of diazo-2 are shown graphically in Fig. 4. In comparison with control recordings without any exogenous Ca2+ buffer, 2 mM diazo-2 was associated with a clear development of outward current with an amplitude of 246 ± 28 pA (mean ±s.e.m., n = 20, holding potential −60 mV) 5 min after breakthrough (Fig. 4a). At this time, control values were −34 ± 22 pA (n = 10). Recordings from cells which showed inward current drift (and would normally be jettisoned) were not excluded from control data since it was not possible to make any comparable selection for the other data sets. From subsets of the diazo-2 cells, summary data for the effects of photolysis (first flash discharge) and noradrenergic action on holding current are shown in Fig. 4B and C, respectively. The x-axes have been normalized to the time of manipulation (t = 0). The mean reduction in current following a flash was 80 % (assuming a starting point at zero current, n = 9). The equivalent reduction caused by noradrenergic action was 94 % (n = 7).
Figure 4. Summary of membrane properties with diazo-2.

A, plot of holding current (VH−60 mV) against time of whole-cell recording for control (no calcium buffer, ▪, n = 10) and diazo-2 (2 mM, •, n = 20) recordings. Points in this figure represent means ±s.e.m. of absolute current measurements. B, effect of a 150 J UV flash (arrow) on outward current (mean current ±s.e.m. is reduced from 269 ± 35 to 55 ± 45 pA, n = 9). C, effect of a 2 min application (bar) of either 2 μM isoprenaline or 10 μM noradrenaline (mean current ±s.e.m. is reduced from 218 ± 60 to 12 ± 31 pA, n = 7). The abscissa for B and C is normalized to the time of manipulation and does not represent absolute recording time.
To test whether the outward current was a unique property of the photolabile compound, we performed a range of similar experiments with the related Ca2+ buffer dibromo BAPTA. This compound has a similar KD (1.5 μM) to unphotolysed diazo-2 without being UV sensitive, thus permitting further experiments in conjunction with fura-2 to determine the [Ca2+]i that was associated with the putative Ca2+-dependent outward current. Sample data from two cells recorded with 1 mM dibromo BAPTA in the pipette are shown in Fig. 5. The traces in Fig. 5a are the first and final sweeps from the time course of outward current development plotted in Fig. 5B. The outward current generated by dibromo BAPTA was accompanied by an increase in conductance over the range −100 to −50 mV and a concurrent loss of IsAHP during which the prolongation of peak latency was again observed (Fig. 5a inset shows sweeps 1 and 6). The I–V characteristics of the subtracted record of Fig. 5C reveal an inwardly rectifying outward current with a null potential at −104 mV. The data in Fig. 5D are from a different cell which illustrates reversible inhibition of the outward current by noradrenaline. The inset shows pseudo-steady-state I–V plots before and after current development, and following noradrenaline action. The zero current values from this plot indicate that under current clamp conditions the outward current would hyperpolarize the cell by 9 mV. These changes in membrane properties were reliably observed using dibromo BAPTA and appeared qualitatively similar to the action of diazo-2. The summary data in Fig. 6 give the time course of outward current development which reached a value of 548 ± 91 pA (n = 10, holding potential −60 mV) 5 min after breakthrough (Fig. 6, •). To assess any contribution of depolarization-evoked Ca2+ influx to development of this outward current, a series of experiments were performed in which resting conductance was monitored only with hyperpolarizing steps (inset in Fig. 6). Under these conditions an outward current still developed and its amplitude (413 ± 99 pA) 5 min after breakthrough was not significantly different from the data including depolarizing steps (Fig. 6, ^, P = 0.36). An average of 50 % of the dibromo BAPTA outward current was inhibited by noradrenergic action. As a further test of the correspondence between IsAHP and the outward current we performed a second pharmacological test based on the proposed transduction mechanism for β-adrenergic inhibition of the AHP which includes cAMP and protein kinase A activity (Madison & Nicoll, 1986; Pedarzani & Storm, 1993). Diffusion of 100 μM 8-Br cAMP together with dibromo BAPTA from the pipette (▾, Fig. 6) resulted in a holding current, at 5 min recording time, which was not significantly different (P = 0.22) from control pipette solution (8-Br cAMP, −90 ± 43 pA, n = 7; control from Fig. 4a, −34 ± 22 pA, n = 10). This result excludes a major contribution from apamin-sensitive channels to the outward current.
Figure 5. Characteristics of outward current produced by intracellular dibromo BAPTA.
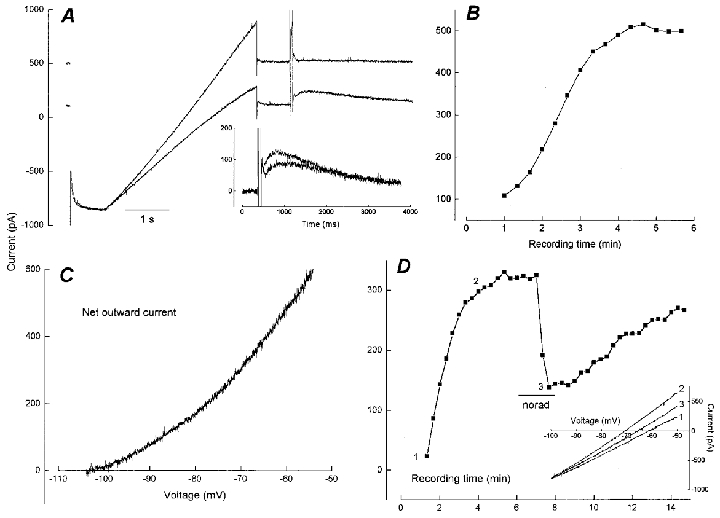
A, current traces before and after development of outward current with 1 mM dibromo BAPTA (voltage protocol as in Fig. 1A). The outward current is accompanied by increased membrane conductance and progressive loss of IsAHP. The peak latency of IsAHP increases during this process (inset). B, time course of outward current development following seal breakthrough at t = 0. C, I-V relation of the dibromo BAPTA-induced outward current obtained by subtraction of the traces in A. D, data from a different cell illustrating the effect of noradrenaline application (norad, 10 μM, 2 min) on dibromo BAPTA-induced current. Inset shows unsubtracted current slopes for the various conditions; 1, control; 2, outward current; 3, plus noradrenaline.
Figure 6. Hydrolysis-resistant cAMP blocks outward current development.

Summary data for outward currents evoked by dibromo BAPTA with voltage commands including depolarization (as in Fig. 1A, •, n = 10) or without depolarization (^, n = 9). The inset shows traces during outward current development without membrane depolarization (VH−70 mV, step to −85 mV). ▾, summary data for holding current when recording pipettes contained 1 mM dibromo BAPTA and 100 μM 8-Br cAMP (n = 7). All points represent mean ±s.e.m.
Thus far the data are consistent with persistently active IsAHP underlying the actions of the Ca2+ chelators. Opening of SK channels, which are postulated to underlie IsAHP, only requires elevated [Ca2+]i (Köhler et al. 1996; Xia et al. 1998), but since depolarization-evoked Ca2+ entry was not a prerequisite for the outward current, we performed more explicit tests of Ca2+ dependence using high- and low-Ca2+ pipette solution. These manipulations also minimise variability resulting from any Ca2+ contamination of the pipette solution. For high-Ca2+conditions, 0.5 mM Ca2+ was added to produce a 50 % loading of the dibromo BAPTA. For low-Ca2+ conditions 10 mM EGTA was included with dibromo BAPTA. Outward currents were still observed to develop with high Ca2+, but surprisingly, also with the highly buffered internal solution (Fig. 7a and B). The ability of EGTA to buffer is shown by the absence of IsAHP following depolarizing steps early in the experiment (Fig. 7B). Pooled data for these conditions are presented in Fig. 7C. The high-Ca2+ and EGTA data are shown in comparison to the previously illustrated dibromo BAPTA curve. The larger errors for these data may reflect the uncontrolled variable of Ca2+ loading in these experiments. The action of unloaded buffer was initially coincident with the EGTA/low-Ca2+ data and crossed over to coincide with the Ca2+-loaded curve after 6 min recording time. This observation, plus the slightly faster development of outward current with high-Ca2+ internal solution, suggests some involvement of Ca2+ in this process, but the clear outward current in the presence of 10 mM EGTA is difficult to reconcile with Ca2+ activation of the K+ current.
To test directly whether any change in bulk [Ca2+]i is associated with the persistent outward current we measured [Ca2+]i using the ratiometric dye fura-2, in conjunction with the changes in membrane properties caused by dibromo BAPTA (Fig. 8A–C). Measurements of [Ca2+]i were obtained from somatic and dendritic regions as outlined in Fig. 8a after careful correction for background signals (see Methods). Different regions of the cell exhibited similar resting [Ca2+]i. These measurements and the outward current recorded from this cell are shown in Fig. 8B. The outward current behaved as described previously, reaching a peak of about 420 pA within 4–5 min recording time. The [Ca2+]i measurements indicate a baseline value just after breakthrough of approximately 75 nM which fell to around 25 nM at 4–5 min. Periodic spikes in the [Ca2+]i signal are due to rhythmic coincidence of the fluorescence measurements (7 s interval) and the electrophysiology (20 s interval) protocol containing the depolarization, but since shutter opening is not exactly coincident with depolarization, the [Ca2+]i changes are underestimated. The dotted line shows that depolarization-induced Ca2+ transients were detectable in the dendrites after development of the outward current. Pooled data for the somatic [Ca2+]i levels at 4–5 min recording time are given in Fig. 8C for control cells (no buffer) as well as recordings using dibromo BAPTA (DBB) with or without 8-Br cAMP. The outward current was typically maximal at the time of these measurements. The mean somatic [Ca2+]i for dibromo BAPTA recordings was 21 ± 3 nM (n = 9) compared with 15 ± 3 nM (n = 6) for control cells. The value for 8-Br cAMP-treated cells (23 ± 6 nM, n = 6) was virtually identical to that for dibromo BAPTA alone. Corresponding values of holding current during the same time period are presented in Fig. 8C (right panel). The dibromo BAPTA-induced current increase in the group of cells used for the [Ca2+]i measurements above was 392 ± 47 pA (n = 9).
The comparison of outward current and resting [Ca2+]i was made also for diazo-2. In this case we performed the converse experiment of testing whether resting [Ca2+]i was altered following outward current deactivation by diazo-2 photolysis (Fig. 8D). Constant UV illumination (5–6 s) caused a change in holding current from 446 ± 87 to 2 ± 34 pA (n = 4). The resting fluorescence of calcium green-1 following photolysis was not significantly changed (96 ± 4 % of control, P = 0.27). The presence of active photolysis product was confirmed by a large reduction in the peak fluorescence following depolarization-evoked Ca2+ influx (not shown). This was associated with a marked reduction in the rate of decay of the Ca2+ signal as expected for an increase in the concentration of a high affinity buffer (Helmchen et al. 1996; Lasser-Ross et al. 1997). Taken together the electrophysiological and imaging data illustrated in Figs 7 and 8 show that the outward current induced by the chelators has no requirement for elevated [Ca2+]i.
In order to monitor fluorescence from the onset of the recording, the camera was focussed on the pipette tip prior to seal breakthrough. In some cases this focal plane also contained a substantial part of the apical dendrite (Fig. 9a) which gradually filled with the fura-2. In subsequent analysis, placement of regions of interest over the dendrite (D1-D3) allowed us to track the appearance of Ca2+-independent fluorescence (excited at 360 nm) in these regions during the course of the recording. Assuming that fura-2 and dibromo BAPTA have similar mobility within the cell, the progression of the fluorescence signal can be compared with the development of outward current, the principle being that only those parts of the cell which are visible (have dye present) can contribute to the outward current present at that time. This does not prove a contribution from all visible portions of the cell but rather places an outer limit on the possibilities. A semi-quantitative development of this idea is shown in Fig. 9. Fluorescence intensity was measured at the soma and three increasingly distal portions of the apical dendrite (D1-D3) shown in Fig. 9A. Fluorescence intensity is plotted versus time in Fig. 9B. The peak signal became progressively smaller (and noisier) in each region presumably because of decreasing path length; however, it is clear that the dye signal was delayed in more distal regions. The fluorescence intensity was fitted with a sigmoidal curve (this was an empirical convenience to provide a smooth curve and has no mechanistic implication). The time at which this curve crosses +2 s.d. of the noise was used as an objective estimate of the first dye appearance in that region. These values are compared directly with the time course of the outward current in Fig. 9C. Thus for the D2 data point, the current measured at that time (∼45 % of total) was accompanied by dye signal in the soma or dendritic regions proximal to D2. Conversely, the outward current had almost saturated (96 %) before any dye signal had appeared in region D3 or points beyond.
Figure 9. Measurement of dye diffusion constrains location of outward current.

A, image of a fura-2-filled CA1 cell indicating regions of interest for fluorescence (360 nm) measurements. B, time course of fluorescence intensity (arbitrary units) in the 4 regions of interest following breakthrough (t = 0). Dashed lines show sigmoidal fits to the dendritic data. The shaded area represents the noise level. C, time taken to reach significant fluorescence values at the dendritic regions delineated in A (left axis, ▪). The time course of current development is shown by the filled circles (right axis). The y-axes intercepts of the dashed lines denote the percentage of the outward current that has developed as the fura-2-dibromo BAPTA reaches the specified dendritic regions.
If the persistent outward current is generated by the same channels that are responsible for IsAHP, there should be some correspondence between regions of the cell involved in these two events. To test this prediction we examined the spatial distribution of elevated [Ca2+]i which triggers IsAHP. Trains of action potentials were used in preference to voltage clamp commands to preserve the physiological pattern of soma/dendritic depolarization. The cell in Fig. 10a shows somatic and proximal apical dendritic regions of interest from which imaging data were obtained; these regions correspond to the areas largely responsible for chelator action determined previously (Fig. 9). The AHPs following 1, 3, 5 and 7 spikes are illustrated in Fig. 10B in comparison with the simultaneous fluorescence increases for the soma and dendrite (Fig. 10C 1 and C 2, respectively). The faster rate of recovery from [Ca2+]i elevation in dendrites compared with the soma has been noted previously (Schiller et al. 1995). Extrapolation from ratiometric imaging in the same cell indicates that a 10 % change in fluorescence is equal to a change in [Ca2+]i of 51 nM. Thus action potential-evoked increases in [Ca2+]i are detectable within the same regions that contribute to the chelator-induced outward current.
Figure 10. Location of [Ca2+]i changes during slow afterhyperpolarizations.

A, image of a fura-2-filled CA1 cell indicating regions of interest for single wavelength (380 nm) fluorescence measurements during action potential-evoked AHPs. B, current clamp recordings of the sAHP following 1, 3, 5 or 7 action potentials evoked by brief (2 ms) current injections at a frequency of 67 Hz (inset shows 5 spike train). C 1, corresponding fluorescence measurements from the soma region on the same time scale as B. C 2, dendritic region fluorescence measurements for the 3 and 7 spike trains. Scale bar applies to C 1 and C 2.
The bar graph in Fig. 11 provides a quantitative comparison of the properties of the persistent outward current. The histograms represent the peak outward current that was recorded under the various conditions. In addition to the complete block described for diazo-2 photolysis and β-adrenergic stimulation (Fig. 4) the persistent outward current was also sensitive to 8-Br cAMP and QX-314 in the pipette. As a comparison, the peak IsAHP is also plotted. These data were obtained from the initial stages (before loss of the current) of recordings with diazo-2 or dibromo BAPTA and are, therefore, directly comparable data for the maximal IsAHP that can be evoked by 80 ms depolarizing commands under these conditions (normal Ringer solution, no blockers used). The conductance values associated with the outward currents were calculated after correction for individual voltage offsets in the recordings.
Figure 11. Action of BAPTA series chelators on holding current.
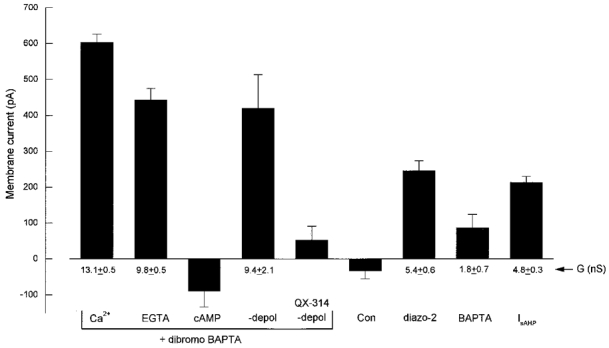
The histogram plots maximal outward current recorded in the presence of BAPTA series chelators under various conditions compared with control data without buffer (con, n = 10) and the IsAHP evoked by an 80 ms depolarization from −60 to −10 mV (n = 21). The dibromo BAPTA (1 mM) data set includes 50 % Ca2+ loaded (Ca2+, n = 5), with 10 mM EGTA (EGTA, n = 5), with 100 μM 8-Br cAMP (cAMP, n = 7), without depolarization (-depol) plus and minus 10 mM QX-314 (n = 9 and 5, respectively). Data for diazo-2 (2 mM, n = 20) and BAPTA itself (2 mM, n = 6) are also shown. The cAMP and QX-314 data are not significantly different from control data. Values of total conductance (G) were calculated after correcting for voltage offsets and are presented under the bars for the chelator data which are significantly different from control (P < 0.01).
DISCUSSION
Identity of the outward current
The large conductance increase generated by BAPTA series calcium chelators has the properties of a tonically activated K+ current with no clear voltage dependence between −50 and −100 mV. The current showed no requirement for depolarization and was observed to develop gradually during the first 5 min of whole-cell recording. In some cells there was a small decay of the current during a subsequent 10–30 min recording period. A number of persistent K+ currents have been described in hippocampal neurones. Selyanko & Sim (1998) described a sustained K+ current that was inhibited by raised Ca2+ and an increase in this current could explain our observations and be consistent with the observation that resting [Ca2+]i decreases somewhat (75–25 nM, Fig. 8) during the initial stages of a recording, possibly due to buffering by fura-2. This mechanism is unlikely to contribute a significant component to our data because powerful Ca2+ buffering produces a smaller outward current than Ca2+ loading (Figs 7 and 11), which opposes the prediction for a Ca2+-inhibited K+ current.
A possible contribution from the persistent K+ current IM is ruled out because stimulation of β-noradrenergic receptors or the addition of a hydrolysis-resistant cAMP analogue blocked the outward current. The outward current as well as IsAHP were blocked by intracellular QX-314. Although block of depolarization-evoked current could be due to the documented action of QX-314 on calcium current (Talbot & Sayer, 1996), the ability of this compound to abolish outward current in the absence of depolarization (Fig. 11) indicates a more direct action such as channel block. This would add to the promiscuity of this compound already known to affect many receptor and voltage-gated channels (Neher & Steinbach, 1978; Nathan et al. 1990; Oda et al. 1992; Perkins & Wong, 1995; Talbot & Sayer, 1996). The pharmacological profile of the outward current is the same as IsAHP which is lost in tandem with outward current development. This loss of a depolarization-induced current could be ascribed to a shunting action of the conductance increase which depresses Ca2+ influx during depolarization. However, fura-2 fluorescence changes could still be observed in soma and dendrites after outward current development, which suggests that shunting was insufficient to prevent depolarization-evoked Ca2+ influx. It should also be noted that reductions in the AHP which result from reduced Ca2+ entry are not associated with changes in the time to peak of the current/potential, in contrast to the peak latency changes reported in this study and in previous publications (Lancaster & Zucker, 1994; Zhang et al. 1995). An alternative explanation to shunting is that IsAHP was occluded by the outward current because it is the same conductance. This might arise if holding current changes are a consequence of greatly prolonged IsAHP (Velumian & Carlen, 1999). Although chelator action was accompanied by an increased decay time of IsAHP, this does not account for outward currents during voltage clamp at negative holding potentials without depolarization (Fig. 6). A persistently active slow AHP current is consistent with our observation that tonic outward current is generated in those parts of the cell (soma and dendrites) which appear to be responsible for the IsAHP (Sah & Bekkers, 1996; this study, Figs 9 and 10). However, IsAHP is demonstrably associated with elevated [Ca2+]i (the exact mechanism is subject to debate, see Introduction) whereas a pharmacologically identical outward current appears not to require elevated [Ca2+]i when induced by BAPTA series calcium chelators.
Actions of the chelators
The BAPTA series calcium chelators are capable of generating large outward currents in CA1 pyramidal cells. Diazo-2 and dibromo BAPTA (this study) as well as dimethyl BAPTA (Schwindt et al. 1992b; Zhang et al. 1995) are all capable of inducing this current as does BAPTA itself to a lesser degree (Velumian & Carlen, 1999; this study). While a reasonable first assumption is that the outward current is a consequence of the Ca2+ buffering characteristics of these compounds, any mechanism must account for the following data. Firstly, the outward current was not associated with elevated [Ca2+]i, as demonstrated by the independence from depolarization, insensitivity to high EGTA and the lack of bulk [Ca2+]i changes associated with activation or deactivation of the current. Secondly, the ability of the BAPTA series chelators to elicit outward currents showed no correlation with their KD (Zhang et al. 1995; this study): dibromo and dimethyl BAPTA (KD, 1.5 and 0.15 μM, respectively) produce large outward currents; diazo-2 (KD, 2.2 μM) causes an intermediate outward current; whereas difluoro BAPTA and BAPTA (KD, 1.7 and 0.21 μM, respectively) produce small or negligible outward current. Thus no clear relation exists between the Ca2+ buffering properties of these compounds and their ability to induce outward current.
Finally it is instructive to compare the actions of diazo-2 described here with those of diazo-4. In contrast to diazo-2, diazo-4 (unphotolysed KD, 89 μM) does not hyperpolarize cells or result in loss of IsAHP except after photolysis to the high affinity form (Lancaster & Zucker, 1994). In this case, block of IsAHP was irreversible as expected following generation of a high affinity calcium chelator within the cell. Similarly, when the outward current produced by diazo-2 is deactivated by photolysis, the standard interpretation would be that this is a result of increased [Ca2+]i buffering by the photolysis product. It is then difficult to explain the recovery of current in the presence of this high affinity buffer. Additionally, concurrent imaging revealed that photolysis-sensitive outward currents in excess of 400 pA are accompanied by only 6 % decreases in calcium green-1 signals, whereas 100–200 pA IsAHP accompany fluorescence changes of about 60 % (data not shown but see also Lasser-Ross et al. 1997; Sah & Clements, 1999). Perhaps, therefore, the deactivation of outward current is a consequence not of [Ca2+]i buffering but of the conformational change per se? A Ca2+-insensitive action of diazo-2 photolysis on holding current may account for the apparent slow effects of diazo-2 photolysis on IsAHP (Sah & Clements, 1999) which are observed in contrast to the rapid action of diazo-4, a compound lacking the additional variable of holding current changes (Lancaster & Zucker, 1994).
The initial development of outward current is similar to the time course of dye loading in these cells (Helmchen et al. 1996), but does this also explain the recovery time course following diazo-2 photolysis? The region of illumination includes a few millimetres of the recording pipette tip; therefore, the slow recovery of the outward current following photolysis is unlikely to be due to redistribution of unphotolysed chelator from the pipette. The recovery process might instead reflect a slow activation of outward current by the remaining, unphotolysed, diazo-2 within the cell.
This ensemble of observations is difficult to reconcile with Ca2+ buffering or [Ca2+]i changes as the prime mechanism of chelator actions, although it is conceivable that we failed to resolve some highly localized or rapid [Ca2+]i changes. The data also do not exclude some permissive role for the very low resting [Ca2+]i anticipated in the presence of EGTA. A facilitatory action of Ca2+ may then account for the difference between the action of low Ca2+ and Ca2+-loaded chelator (Figs 7 and 11). Exogenous Ca2+ chelators are noted to prolong the time course of IsAHP (peak latency and duration, Zhang et al. 1995). While no satisfactory explanation exists for this observation, it may be related to the underlying slow development of an outward current which receives a synergistic boost following Ca2+ influx (see Fig. 7). Speculation regarding a mechanism for chelator action might include the observation that BAPTA interacts with parvalbumin and calmodulin (Chiancone et al. 1986) and that there may be interactions among Ca2+, the chelators and a Ca2+ binding site, so converting a normally transient process to a permanently active state. This might be achieved by a massive increase in Ca2+ sensitivity, as suggested to underlie the action of 1-ethyl-2-benzimidazolinone on intermediate conductance KCa channels expressed in cell lines (Pedersen et al. 1999).
Location of the outward current
The fura-2 fluorescence following onset of recording provides a picture of the areas of the cell which contribute to the outward current generated by co-diffusion of dibromo BAPTA from the electrode. The assumptions made for this interpretation are that fura-2 and dibromo BAPTA have similar mobility within the cell, and that there are no electrophysiological actions of dibromo BAPTA concentrations below the visible threshold of corresponding concentrations of fura-2. If these assumptions are valid then the outer limits for the outward current generation are no greater than 75 μm from the recording site. This represents an extreme limit since, as mentioned above, the time course of outward current development may be governed by the activation process rather than chelator distribution. The current plateau at this point may represent the maximal available conductance but it is possible that distal regions are electrically isolated due to a shunting action of the additional conductance which sets a detection limit on current generated in more distal regions.
Since the pharmacology of the outward current suggests some identity with IsAHP, how does the location of IsAHP compare with the persistent current? The location of IsAHP is not well defined but some indication may be derived from the regions of [Ca2+]i elevation associated with this event. When this is defined using natural spiking activity (this study; Knöpfel & Gähwiler, 1992; Lasser-Ross et al. 1997), the soma and proximal apical dendrites are the most likely location, which is consistent with electrophysiological data showing IsAHP in apical dendrites (Andreasen & Lambert, 1995; Sah & Bekkers, 1996). Thus, the same areas of the cell are responsible for the chelator-induced outward current and IsAHP. In this context it is worth noting that the ability of EGTA to inhibit IsAHP generation within 1 min of recording (Fig. 7) suggests that the outward current contributing to IsAHP is generated by channels no greater than 50 μm from the site of recording (from Fig. 9C, assuming comparable diffusion of EGTA and fura-2), possibly including both somatic and immediately adjacent dendritic regions.
Functional implications for IsAHP
The pharmacology of the outward current is indicative of a tonically active sAHP current, although we do not exclude the formal possibility that it may be comprised in whole, or part, of a previously unidentified and separate current with the same pharmacological characteristics as IsAHP. The inhibition of this outward current via β-noradrenergic receptors and cAMP occurs in the absence of Ca2+ elevation or influx. The transduction mechanism, therefore, acts on targets which are downstream of voltage-dependent Ca2+ entry, possibly at the K+ channel itself in addition to noradrenergic actions on L-type Ca2+ channel reopening (Cloues et al. 1997; Marrion & Tavalin, 1998). Assuming that a persistently active IsAHP is responsible for the observations reported here, the activity of this current can be dissociated from [Ca2+]i changes. This raises the question of whether the persistent activation by chelators is recruiting part of the physiological mechanism of channel activation.
Ca2+ release following flash photolysis suggests rapid activation (Lancaster & Zucker, 1994), but recent experiments in the presence of apamin indicate that the rapid activation phase is followed by a slow component (Sah & Clements, 1999, their Fig. 4b) which was modelled by slow gating of the channel. A more complex regulation of this current has also been suggested to result from indirect, downstream, actions of Ca2+ (Schwindt et al. 1992a). Although there is some similarity of IsAHP to the time course of mean dendritic [Ca2+]i during spike trains (Helmchen et al. 1996), discrepancy between the time course of fluorescence signals and the current following depolarization has been noted (Lasser-Ross et al. 1997), which is exacerbated by the presence of BAPTA (Jahromi et al. 1999). Clearly, the early stages of volume-averaged Ca2+ signals are unlikely to report accurately the Ca2+ concentration changes in sub-membrane shells adjacent to membrane channels (Llinás et al. 1992; Monck et al. 1994; Eilers et al. 1995). This could account for early discrepancies in time course but is unlikely to be relevant during later stages of the response. Thus precedents exist for divorcing [Ca2+]i from IsAHP and the persistent current may be an interesting manifestation of a physiological mechanism but we have no direct evidence to support this possibility.
The much larger conductance seen with Ca2+-loaded dibromo BAPTA compared with IsAHP might be taken as evidence for a different current. Although these experiments were executed without K+ channel blockers and are comparable to IsAHP recorded following brief spike trains (Lancaster & Adams, 1986), supranormal IsAHP can be evoked in the presence of tetraethylammonium which causes spike broadening by blocking BK channels so Ca2+ influx is much greater than observed under normal conditions. This suggests that physiologically relevant spiking activity utilises a fraction of the available sAHP conductance, and the data with Ca2+-loaded dibromo BAPTA provide an estimate of the total conductance that is available in these cells (Fig. 11). The operational fraction of sAHP conductance is similar to the estimates obtained from noise analysis in dentate granule cells (Valiante et al. 1997). This apparently under-utilised conductance may be activated by synaptically mediated Ca2+ influx or during conditions such as anoxic hyperpolarization which is associated with Ca2+-activated K+ current (Yamamoto et al. 1997; Erdemli et al. 1998).
The location of outward current < 100 μm from the somatic recording is interposed between most dendritic excitatory input and the axonal output. Accumulation of [Ca2+]i is prominent in this area following high frequency spiking (Helmchen et al. 1996) and would be expected to activate IsAHP. The increased membrane conductance following short spike bursts will be anticipated to downgrade the influence of subsequent synaptic input from the whole apical dendritic tree. Conversely, transmitter inhibition of IsAHP is likely to enhance transfer of electrical signals between the soma and dendrites of pyramidal cells.
Acknowledgments
Financial support was received from the Wellcome Trust and the Sir Jules Thorn Charitable Trust.
References
- Adams SR, Kao JPY, Tsien RY. Biologically useful chelators that take up Ca2+ upon illumination. Journal of the American Chemical Society. 1989;111:7957–7968. [Google Scholar]
- Andreasen M, Lambert JDC. The excitability of CA1 pyramidal cell dendrites is modulated by a local Ca2+-dependent K+ conductance. Brain Research. 1995;698:193–203. doi: 10.1016/0006-8993(95)00910-i. [DOI] [PubMed] [Google Scholar]
- Barrett JN, Magleby KL, Pallotta B. Properties of single calcium activated potassium channels in cultured rat muscle. The Journal of Physiology. 1982;331:211–230. doi: 10.1113/jphysiol.1982.sp014370. [DOI] [PMC free article] [PubMed] [Google Scholar]
- Chiancone E, Thulin E, Boffi A, Forsen S, Brunori M. Evidence for the interaction between the calcium indicator 1,2-bis(o-aminophenoxy)ethane-N,N,N′,N′-tetraacetic acid and calcium-binding proteins. Journal of Biological Chemistry. 1986;261:16306–16308. [PubMed] [Google Scholar]
- Cloues RK, Tavalin SJ, Marrion NV. β-Adrenergic stimulation selectively inhibits long-lasting L-type calcium channel facilitation in hippocampal pyramidal neurons. Journal of Neuroscience. 1997;17:6493–6503. doi: 10.1523/JNEUROSCI.17-17-06493.1997. [DOI] [PMC free article] [PubMed] [Google Scholar]
- Eilers J, Callewaert G, Armstrong C, Konnerth A. Calcium signalling in a narrow somatic submembrane shell during synaptic activity in cerebellar Purkinje neurons. Proceedings of the National Academy of Sciences of the USA. 1995;92:10272–10276. doi: 10.1073/pnas.92.22.10272. [DOI] [PMC free article] [PubMed] [Google Scholar]
- Erdemli G, Xu YZ, Krnjevic K. Potassium conductance causing hyperpolarization of CA1 hippocampal neurons during hypoxia. Journal of Neurophysiology. 1998;80:2378–2390. doi: 10.1152/jn.1998.80.5.2378. [DOI] [PubMed] [Google Scholar]
- Grynkiewicz G, Poenie M, Tsien RY. A new generation of Ca2+ indicators with greatly improved fluorescence properties. Journal of Biological Chemistry. 1985;260:3440–3450. [PubMed] [Google Scholar]
- Helmchen F, Imoto K, Sakmann B. Ca2+ buffering and action potential-evoked Ca2+ signalling in dendrites of pyramidal neurons. Biophysical Journal. 1996;70:1069–1081. doi: 10.1016/S0006-3495(96)79653-4. [DOI] [PMC free article] [PubMed] [Google Scholar]
- Jahromi BS, Zhang L, Carlen PL, Pennefather P. Differential time course of slow afterhyperpolarizations and associated Ca2+ transients in rat CA1 pyramidal neurons: further dissociation by Ca2+ buffer. Neuroscience. 1999;88:719–726. doi: 10.1016/s0306-4522(98)00203-6. [DOI] [PubMed] [Google Scholar]
- Knöpfel T, Gähwiler BH. Activity-induced elevations of intracellular calcium concentration in pyramidal and nonpyramidal cells of the CA3 region of rat hippocampal slice cultures. Journal of Neurophysiology. 1992;68:961–963. doi: 10.1152/jn.1992.68.3.961. [DOI] [PubMed] [Google Scholar]
- Köhler M, Hirschberg B, Bond CT, Kinzie JM, Marrion NV, Maylie J, Adelman JP. Small-conductance calcium-activated potassium channels from mammalian brain. Science. 1996;273:1709–1714. doi: 10.1126/science.273.5282.1709. [DOI] [PubMed] [Google Scholar]
- Lancaster B, Adams PR. Calcium-dependent current generating the afterhyperpolarization of hippocampal neurons. Journal of Neurophysiology. 1986;55:1268–1282. doi: 10.1152/jn.1986.55.6.1268. [DOI] [PubMed] [Google Scholar]
- Lancaster B, Batchelor AM. Action of BAPTA-derived Ca2+ buffers on intrinsic membrane currents in CA1 neurones. Society for Neuroscience Abstracts. 1999;25:192. [Google Scholar]
- Lancaster B, Zucker RS. Photolytic manipulation of Ca2+ and the time course of slow Ca2+-activated K+ current in rat hippocampal neurons. The Journal of Physiology. 1994;475:229–239. doi: 10.1113/jphysiol.1994.sp020064. [DOI] [PMC free article] [PubMed] [Google Scholar]
- Lasser-Ross N, Ross WN, Yarom Y. Activity-dependent [Ca2+]i changes in guinea-pig vagal motoneurons: relationship to the slow afterhyperpolarization. Journal of Neurophysiology. 1997;78:825–834. doi: 10.1152/jn.1997.78.2.825. [DOI] [PubMed] [Google Scholar]
- Llinás R, Sugimori M, Silver B. Microdomains of high calcium concentration in a presynaptic terminal. Science. 1992;256:677–679. doi: 10.1126/science.1350109. [DOI] [PubMed] [Google Scholar]
- Madison DV, Nicoll RA. Cyclic adenosine 3′,5′-monophosphate mediates β-receptor actions of noradrenaline in rat hippocampal pyramidal cells. The Journal of Physiology. 1986;372:245–259. doi: 10.1113/jphysiol.1986.sp016007. [DOI] [PMC free article] [PubMed] [Google Scholar]
- Marrion NV, Tavalin SJ. Selective activation of Ca2+-activated K+ channels by co-localized Ca2+ channels in hippocampal neurons. Nature. 1998;395:900–905. doi: 10.1038/27674. [DOI] [PubMed] [Google Scholar]
- Monck JR, Robinson IM, Escobar AL, Vergara JL, Fernandez JM. Pulsed laser imaging of rapid Ca2+ gradients in excitable cells. Biophysical Journal. 1994;67:505–514. doi: 10.1016/S0006-3495(94)80554-5. [DOI] [PMC free article] [PubMed] [Google Scholar]
- Mulkey RM, Zucker RS. Calcium released by photolysis of DM-nitrophen triggers transmitter release at the crayfish neuromuscular junction. The Journal of Physiology. 1993;462:243–260. doi: 10.1113/jphysiol.1993.sp019553. [DOI] [PMC free article] [PubMed] [Google Scholar]
- Nathan T, Jensen MS, Lambert JDC. The slow inhibitory postsynaptic potential in rat hippocampal CA1 neurones is blocked by intracelluar injection of QX-314. Neuroscience Letters. 1990;110:309–313. doi: 10.1016/0304-3940(90)90865-7. [DOI] [PubMed] [Google Scholar]
- Neher E, Steinbach JH. Local anaesthetics transiently block currents through single acetylcholine receptor channels. The Journal of Physiology. 1978;277:153–176. doi: 10.1113/jphysiol.1978.sp012267. [DOI] [PMC free article] [PubMed] [Google Scholar]
- Oda M, Yoshida A, Ikemoto Y. Blockade by local anaesthetics of the single Ca2+-activated K+ channel in rat hippocampal neurones. British Journal of Pharmacology. 1992;105:63–70. doi: 10.1111/j.1476-5381.1992.tb14211.x. [DOI] [PMC free article] [PubMed] [Google Scholar]
- Pedarzani P, Storm JF. PKA mediates the effects of monoamine transmitters on the K+ current underlying the slow spike frequency adaptation in hippocampal neurons. Neuron. 1993;11:1023–1035. doi: 10.1016/0896-6273(93)90216-e. [DOI] [PubMed] [Google Scholar]
- Pedersen KA, Schrøder RL, Skaaning-Jensen B, Strøbaek D, Olesen S-P, Christophersen P. Activation of the human intermediate-conductance Ca2+-activated K+ channel by 1-ethyl-2-benzimidazolinone is strongly Ca2+-dependent. Biochimica et Biophysica Acta. 1999;1420:231–240. doi: 10.1016/s0005-2736(99)00110-8. [DOI] [PubMed] [Google Scholar]
- Perkins KL, Wong RKS. Intracellular QX-314 blocks the hyperpolarization-activated inward current Iq in hippocampal CA1 pyramidal cells. Journal of Neurophysiology. 1995;73:911–915. doi: 10.1152/jn.1995.73.2.911. [DOI] [PubMed] [Google Scholar]
- Pethig R, Kuhn M, Payne R, Adler E, Chen TH, Jaffe LF. On the dissociation constants of BAPTA-type calcium buffers. Cell Calcium. 1989;10:491–498. doi: 10.1016/0143-4160(89)90026-2. [DOI] [PubMed] [Google Scholar]
- Sah P, Bekkers JM. Apical dendritic location of slow afterhyperpolarization current in hippocampal pyramidal neurons: implications for the integration of long-term potentiation. Journal of Neuroscience. 1996;16:4537–4542. doi: 10.1523/JNEUROSCI.16-15-04537.1996. [DOI] [PMC free article] [PubMed] [Google Scholar]
- Sah P, Clements JD. Photolytic manipulation of [Ca2+]i reveals slow kinetics of potassium channels underlying the afterhyperpolarization in hippocampal pyramidal neurons. Journal of Neuroscience. 1999;19:3657–3664. doi: 10.1523/JNEUROSCI.19-10-03657.1999. [DOI] [PMC free article] [PubMed] [Google Scholar]
- Sah P, Mclachlan EM. Ca2+-activated K+ currents underlying the afterhyperpolarization in guinea pig vagal neurons: a role for Ca2+-activated Ca2+ release. Neuron. 1991;7:257–264. doi: 10.1016/0896-6273(91)90264-z. [DOI] [PubMed] [Google Scholar]
- Schiller J, Helmchen F, Sakmann B. Spatial profile of dendritic calcium transients evoked by action potentials in rat neocortical pyramidal neurones. The Journal of Physiology. 1995;487:583–600. doi: 10.1113/jphysiol.1995.sp020902. [DOI] [PMC free article] [PubMed] [Google Scholar]
- Schwindt PC, Spain WJ, Crill WE. Calcium-dependent potassium currents in neurons from cat sensorimotor cortex. Journal of Neurophysiology. 1992a;67:216–226. doi: 10.1152/jn.1992.67.1.216. [DOI] [PubMed] [Google Scholar]
- Schwindt PC, Spain WJ, Crill WE. Effects of intracellular calcium chelation on voltage-dependent and calcium-dependent currents in cat neocortical neurons. Neuroscience. 1992b;47:571–578. doi: 10.1016/0306-4522(92)90166-y. [DOI] [PubMed] [Google Scholar]
- Selyanko AA, Sim JA. Ca2+-inhibited non-inactivating K+ channels in cultured rat hippocampal pyramidal neurones. The Journal of Physiology. 1998;510:71–91. doi: 10.1111/j.1469-7793.1998.071bz.x. [DOI] [PMC free article] [PubMed] [Google Scholar]
- Stocker M, Krause M, Pedarzani P. An apamin-sensitive Ca2+-activated K+ current in hippocampal pyramidal neurons. Proceedings of the National Academy of Sciences of the USA. 1999;96:4662–4667. doi: 10.1073/pnas.96.8.4662. [DOI] [PMC free article] [PubMed] [Google Scholar]
- Talbot MJ, Sayer RJ. Intracellular QX-314 inhibits calcium currents in hippocampal CA1 pyramidal neurons. Journal of Neurophysiology. 1996;76:2120–2124. doi: 10.1152/jn.1996.76.3.2120. [DOI] [PubMed] [Google Scholar]
- Tanabe M, Gähwiler BH, Gerber U. L-type Ca2+ channels mediate the slow Ca2+-dependent afterhyperpolarization current in rat CA3 pyramidal cells in vitro. Journal of Neurophysiology. 1998;80:2268–2273. doi: 10.1152/jn.1998.80.5.2268. [DOI] [PubMed] [Google Scholar]
- Valiante TA, Abdul-Ghani MA, Carlen PL, Pennefather P. Analysis of current fluctations during after-hyperpolarization current in dentate granule neurones of the rat hippocampus. The Journal of Physiology. 1997;499:121–134. doi: 10.1113/jphysiol.1997.sp021915. [DOI] [PMC free article] [PubMed] [Google Scholar]
- Velumian AA, Carlen PL. Differential control of three after-hyperpolarizations in rat hippocampal neurones by intracellular calcium buffering. The Journal of Physiology. 1999;517:210–216. doi: 10.1111/j.1469-7793.1999.0201z.x. [DOI] [PMC free article] [PubMed] [Google Scholar]
- Xia X-M, Fakler B, Rivard A, Wayman G, Johnson-Pais T, Keen JE, Ishii T, Hirschberg B, Bond CT, Lutsenko S, Maylie J, Adelman JP. Mechanism of calcium-gating in small-conductance calcium-activated potasium channels. Nature. 1998;395:503–507. doi: 10.1038/26758. [DOI] [PubMed] [Google Scholar]
- Yamamoto S, Tanaka E, Higashi H. Mediation by intracellular calcium-dependent signals of hypoxic hyperpolarization in rat hippocampal CA1 neurons in vitro. Journal of Neurophysiology. 1997;77:386–392. doi: 10.1152/jn.1997.77.1.386. [DOI] [PubMed] [Google Scholar]
- Yoshida A, Oda M, Ikemoto Y. Kinetics of the Ca2+-activated K+ channels in rat hippocampal neurons. Japanese Journal of Physiology. 1991;41:297–315. doi: 10.2170/jjphysiol.41.297. [DOI] [PubMed] [Google Scholar]
- Zhang L, Pennefather P, Velumian A, Tymianski M, Charlton M, Carlen PL. Potentiation of a slow Ca2+-dependent K+ current by intracellular Ca2+ chelators in hippocampal CA1 neurons of rat brain slices. Journal of Neurophysiology. 1995;74:2225–2241. doi: 10.1152/jn.1995.74.6.2225. [DOI] [PubMed] [Google Scholar]
- Zhang L, Weiner JL, Valiante TA, Velumian A, Walson P, Jahromi SS, Schetzer S, Pennefather P, Carlen PL. Whole-cell recording of the Ca2+-dependent slow afterhyperpolarization in hippocampal neurones: effects of internally applied anions. Pflügers Archiv. 1994;426:247–253. doi: 10.1007/BF00374778. [DOI] [PubMed] [Google Scholar]