

Abstract
The effects of modulating Ca2+-induced Ca2+ release (CICR) in single cardiac myocytes were investigated using low concentrations of caffeine (< 500 μm) in reduced external Ca2+ (0.5 mm). Caffeine produced a transient potentiation of systolic [Ca2+]i (to 800 % of control) which decayed back to control levels.
Caffeine decreased the steady-state sarcoplasmic reticulum (SR) Ca2+ content. As the concentration of caffeine was increased, both the potentiation of the systolic Ca2+ transient and the decrease in SR Ca2+ content were increased. At higher concentrations, the potentiating effect decayed more rapidly but the rate of recovery on removal of caffeine was unaffected.
A simple model in which caffeine produces a fixed increase in the fraction of SR Ca2+ which is released could account qualitatively but not quantitatively for the above results.
The changes in total [Ca2+] during systole were obtained using measurements of the intracellular Ca2+ buffering power. Caffeine initially increased the fractional release of SR Ca2+. This was followed by a decrease to a level greater than that under control conditions. The fraction of systolic Ca2+ which was pumped out of the cell increased abruptly upon caffeine application but then recovered back to control levels. The increase in fractional loss is due to the fact that, as the cytoplasmic buffers become saturated, a given increase in systolic total[Ca2+] produces a larger increase in free [Ca2+] and thence of Ca2+ efflux.
These results confirm that modulation of the ryanodine receptor has no maintained effect on systolic Ca2+ and show the interdependence of SR Ca2+ content, cytoplasmic Ca2+ buffering and sarcolemmal Ca2+ fluxes. Such analysis is important for understanding the cellular basis of inotropic interventions in cardiac muscle.
The major source of Ca2+ that activates contraction in cardiac muscle is an internal store, the sarcoplasmic reticulum (SR). Ca2+ release from the SR occurs through the ryanodine receptors (RyRs) in the SR membrane and is initiated by the small amount of ‘trigger’ Ca2+ that enters the cell during the action potential. This is referred to as Ca2+-induced Ca2+ release (CICR) (Fabiato, 1983). The open probability of the cardiac RyR is regulated by cytoplasmic Ca2+ (Rousseau & Meissner, 1989; Schiefer et al. 1995; Sitsapesan et al. 1995b). In addition, a number of other endogenous ligands have been shown to affect RyR gating e.g. ATP, Mg2+, H+ and the pyridine nucleotide cyclic ADP-ribose (cADPR) (Zahradníková & Palade, 1993; Sitsapesan et al. 1995a; Xu et al. 1996; Rakovic et al. 1996). The RyR is also regulated by phosphorylation (Yoshida et al. 1992; Hohenegger & Suko, 1993). Recently, immunophilin receptors have been identified as being associated with the RyR and are believed to regulate gating both in vivo and in vitro (Brillantes et al. 1994; Marx et al. 1998). Finally, the open probability of the RyR has been suggested to decrease in cardiac hypertrophy due to decreased coupling to the sarcolemmal L-type current (Gómez et al. 1997).
We have shown, however, that agents that modulate CICR produce only transient effects on systolic contraction. Thus caffeine (O'Neill & Eisner, 1990; Trafford et al. 1998) and BDM (2,3-butanedione monoxime) (Adams et al. 1998), which stimulate CICR, produce a transient increase in systolic [Ca2+]i which decays to control levels. In contrast, tetracaine, which depresses CICR, results in a transient decrease in the systolic [Ca2+]i (Overend et al. 1998). The transient nature of these responses was shown to arise because, for example, the stimulation of CICR produced by caffeine results in a larger systolic Ca2+ transient, which increases the Ca2+ efflux from the cell, thereby decreasing the SR Ca2+ content. However, recent work continues to suggest that modification of the RyR, or its coupling to the trigger of Ca2+ entry, can produce a maintained effect on systolic [Ca2+]i (Wessely et al. 1998; Shorofsky et al. 1999). One criticism of our previous work could be that the magnitude of the initial increase in systolic [Ca2+]i produced by caffeine was generally only of the order of 10–20 % and it would not have been easy to see whether there was a small maintained component. The initial aim of the work in this paper was therefore to both increase the magnitude of the effect of caffeine and make more accurate measurements of the steady-state effect of caffeine.
From these observations, the major purpose of this paper was to then use experimental modification of SR Ca2+ release as a tool to study the control of both cytoplasmic and SR Ca2+. A full analysis requires the ability to measure not only [Ca2+]i but also the underlying sarcolemmal and SR Ca2+ fluxes. We have done this and have compared the results with those of a recently described simple quantitative model of the effects of stimulation of CICR (Eisner et al. 1998). The data show that during the transient potentiation of systolic [Ca2+]i produced by stimulation of the RyR there is an increase in both the fraction of Ca2+ released from the SR and the fraction of this Ca2+ which is pumped out of the cell.
METHODS
Experiments were performed on single cardiac myocytes isolated from rat ventricles using a collagenase digestion protocol. Briefly, 200 g Wistar rats of either sex were killed by stunning and cervical dislocation. The heart was rapidly excised and retrogradely perfused through the aorta with a nominally Ca2+-free solution containing (mM): NaCl, 134; glucose, 11; Hepes, 10; KCl, 4; NaH2PO4, 1.2; MgSO4, 1.2; and bovine serum albumin (BSA), 0.5 mg ml−1. Digestion of the heart was then performed by adding collagenase (1 mg ml−1, Type-H, Boehringer Mannheim, Germany) and 100 μm CaCl2 to the above solution. The solution was recirculated and the heart was perfused for approximately 6 min. The perfusate was then switched to a taurine-containing solution (mM): NaCl, 117; taurine, 50; glucose, 11; Hepes, 10; KCl, 4; NaH2PO4, 1.2; MgSO4, 1.2; CaCl2, 0.1; and BSA, 0.5 mg ml−1. Once the heart had been washed with this solution the ventricles were removed and minced. Single cells were dispersed by gentle trituration and stored in the taurine-containing solution until use.
Intracellular [Ca2+] measurements
Changes in [Ca2+]i were measured as described previously using epifluorescence microscopy with fluo-3 (Trafford et al. 1999). Fluo-3 (Molecular Probes, OR, USA) was loaded as the cell-permeant acetoxymethyl ester at 5 μm for 5 min. Cells were left for at least 30 min to allow dye de-esterification to occur before being placed in a recording chamber on the stage of an inverted microscope. Fluo-3 was excited at 488 nm and the emitted fluorescence was measured at 530 nm.
Calibration of fluo-3 records
Movement artefacts were avoided by measuring fluorescence from the entire cell and ensuring that the illumination intensity was uniform. Fluo-3 has the property that in the absence of Ca2+ the fluorescence is negligible. Thus [Ca2+]i can be calibrated by obtaining a value for the maximum fluorescence (Fmax) at the end of the experiment by damaging the cell with the micropipette (Trafford et al. 1999). Therefore:
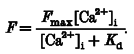 |
We have taken the Kd to be 400 nM (Cheng et al. 1993).
Voltage clamp measurements
Voltage clamp control was achieved using the perforated patch technique (Horn & Marty, 1988). Due to the relatively high access resistance of the perforated patch we used the switch clamp facility of the Axoclamp 2B voltage clamp amplifier (Axon Instruments, CA, USA). Pipettes (1–3 MΩ in resistance) were filled with the following solution (mM): KCH3O3S, 125; KCl, 20; NaCl, 10; Hepes, 10; MgCl2, 5; titrated to pH 7.2 with KOH. To reduce interference from outward currents, all voltage clamp experiments were done in the presence of 5 mm 4-aminopyridine and 0.1 mm BaCl2. Cells were bathed in a control solution of the following composition (mM): NaCl, 135; KCl, 4; Hepes, 10; glucose, 11; CaCl2, 0.5; MgCl2, 1; titrated to pH 7.4 with NaOH. All experiments were carried out at 23°C. The majority of experiments were performed under voltage clamp, but that illustrated in Fig. 2 involved field stimulation. To increase the effect of potentiating CICR upon [Ca2+]i, all experiments were performed at a reduced external Ca2+ concentration of 0.5 mm.
Figure 2. The effects of different concentrations of caffeine on systolic [Ca2+]i.

A, original records showing the effects of applying the indicated concentrations of caffeine for the periods shown. In this experiment the cells were field stimulated rather than voltage clamped. B, time course of change in the amplitude of the systolic Ca2+ transient (^). The continuous curves are first order exponentials fitted to the data with the indicated rate constants. C, histograms showing the relationship between caffeine concentration and various parameters. a, peak Ca2+ transient amplitude in caffeine divided by control; b, steady-state amplitude in caffeine divided by the amplitude of the smallest transient in the undershoot; c, rate constant of decay of potentiation in caffeine divided by the rate constant of recovery on removal of caffeine. Values are means ±s.e.m. for 9 experiments.
Measurement of SR Ca2+ content and sarcolemmal Ca2+ influx and efflux
The SR Ca2+ content was quantified in voltage clamped cells by discharging SR Ca2+ with 10 mm caffeine. The resulting Na+-Ca2+ exchange current was integrated, as described previously (Varro et al. 1993). Ca2+ efflux during the systolic Ca2+ transient was measured from the integral of the Na+-Ca2+ exchange current upon repolarisation (Negretti et al. 1995). Integration was begun at the end of the capacity current upon repolarisation. The baseline current was measured after [Ca2+]i had fully recovered.
When quantifying SR Ca2+ content and Ca2+ efflux it is necessary to first correct for that fraction of the efflux that is not produced by Na+-Ca2+ exchange and then relate the fluxes to cell volume. This is done by measuring the rate constant of decay of the caffeine response (i) under control conditions (kcont) and (ii) with Na+-Ca2+ exchange inhibited by 10 mm Ni2+ (kNi). Multiplying the flux by kcont/(kcont–kNi) gives the corrected flux. A correction factor of 1.5 was used in these experiments (Varro et al. 1993; Díaz et al. 1997). Ca2+ influx on the L-type Ca2+ current was measured by integrating the Ca2+ current from the end of the capacity current upon depolarisation until the end of the pulse. The zero current level was taken as the current level 200 ms before depolarisation. Cell volume was calculated from the cell membrane capacitance which was converted to volume taking a value of 6.76 pF pl−1 (Satoh et al. 1996). It should be noted that, as in our previous work, the SR Ca2+ content and Ca2+ efflux are expressed in relation to total cell volume and not SR or accessible cell volume.
Measurement of Ca2+ buffering and total [Ca2+]
This was done as described previously (Trafford et al. 1999). Briefly, Ca2+ was released from the SR using 10 mm caffeine. The corrected integral (see above) of the resulting Na+-Ca2+ exchange current gives a measure of changes in total [Ca2+] which can then be related to the simultaneously recorded free [Ca2+]. The buffering curve can then be used to calculate changes in total [Ca2+] from those of free [Ca2+] in the same cell. Since this method provides no direct information about buffering properties at levels of [Ca2+]i below the resting level, we have expressed total [Ca2+] measurements in terms of changes above resting (ΔTotal [Ca2+]).
Statistics
All data are presented as the means ± standard error of the mean for n experiments. Unless otherwise indicated, tests of significance were performed using Student's paired t test, at the 0.05 level.
RESULTS
The first series of experiments concentrated on the effects of caffeine on the systolic Ca2+ transient. In order to maximise the size of the effect, the experiments were carried out in solutions with a reduced Ca2+ concentration (0.5 mm). This decreases the fraction of the SR Ca2+ content that is released and therefore allows a larger increase in [Ca2+]i when caffeine is applied than is the case with normal external [Ca2+] (O'Neill & Eisner, 1990). In the experiment illustrated in Fig. 1a, application of 500 μm caffeine resulted in a transient increase in systolic [Ca2+]i. In the maintained presence of caffeine the systolic Ca2+ transient fell to control levels and, on removal of caffeine, there was an undershoot in the amplitude of the transient before it recovered. The effects of caffeine were reproducible as shown by the second exposure. Figure 1B shows expanded records of Ca2+ transients obtained before (i), at the peak of the caffeine response (ii) and during steady-state exposure to caffeine (iii). Transients i and iii are shown superimposed in Fig. 1C (left panel). It is clear that the systolic Ca2+ transient in the presence of caffeine was identical to the control transient in both amplitude and time course. This was despite the large transient potentiation observed upon caffeine application. On average, in seven cells, the amplitude of the steady-state systolic Ca2+ transient in 500 μm caffeine was 100 ± 2 % of that in control (not significantly different from 100 %, P > 0.8). Similar results were seen at lower caffeine concentrations (the amplitudes of the steady-state Ca2+ transients were, respectively, 98 ± 2 and 98 ± 2 % of the control in 100 and 250 μm caffeine). In contrast, the amplitude of the first Ca2+ transient in 500 μm caffeine was 852 ± 150 % of the control. If we assume that any maintained effect of caffeine is less than 2 % of the control magnitude then this is less than 0.27 % of the peak effect. The right-hand panel of Fig. 1C shows the first systolic transient in caffeine normalised to the control transient. In this experiment the transient at the peak of the caffeine response recovered more quickly than the control transient. On average (n = 7), the rate constant of decay of the Ca2+ transient was 5.81 ± 0.9 s−1 for the first pulse in caffeine, compared with 4.27 ± 0.6 s−1 for the control (P < 0.02). The increase in the rate constant of decay of the first pulse in caffeine may simply be due to the fact that it is larger and therefore occurs over a range of [Ca2+]i where the Ca2+ buffering power is reduced (Bers & Berlin, 1995).
Figure 1. The effects of caffeine on the amplitude and time course of systolic [Ca2+]i.

A, fluo-3 measurements of [Ca2+]i. The membrane potential was held at −40 mV and 100 ms duration depolarising pulses were applied to 0 mV at 0.5 Hz. Caffeine (500 μm) was applied for the periods shown by the filled bars. B, specimen transients obtained at the points indicated in A. The transient labelled ii is a single record whereas those labelled i and iii are averages of 5. C, left: superimposed (not normalised) records of transients i (continuous trace) and iii (dotted trace). Right: transients i and ii normalised to the same peak level.
The experiment illustrated in Fig. 1 also shows that the time course of decay of the potentiation produced by caffeine was faster than the recovery following the undershoot produced by the removal of caffeine. We have examined this phenomenon in more detail in the experiment of Fig. 2A. Here, three different concentrations of caffeine were applied: 100, 250 and 500 μm. It is clear that, the greater the concentration of caffeine, the greater the increase in systolic [Ca2+]i. Furthermore, on removal of caffeine, the undershoot of the amplitude was greater following exposure to higher caffeine concentrations. The amplitudes of the systolic Ca2+ transients were also fitted with exponentials (Fig. 2B). When cells were field stimulated, the rate constant of decay of the potentiation of the Ca2+ transient was faster at higher caffeine concentrations. In this particular experiment, the rate constant increased from 0.026 s−1 in 100 μm caffeine to 0.059 s−1 in 250 μm to 0.086 s−1 in 500 μm. In contrast, the rate constant of recovery of the Ca2+ transient on removal of caffeine was unaffected by the previous concentration of caffeine and was always slower than the rate constant of decay of the caffeine-evoked potentiation. On average (n = 9, field stimulated), the rate constants of decay of [Ca2+]i when caffeine was applied were 0.04 ± 0.008 s−1 (100 μm), 0.07 ± 0.009 s−1 (250 μm) and 0.11 ± 0.01 s−1 (500 μm). These values are all significantly different from each other (P < 0.05) when compared using the Student-Newman- Keuls method and one-way repeated measures ANOVA. The mean rate constants of recovery of the systolic Ca2+ transient upon removal of caffeine were 0.027 ± 0.004 s−1 (100 μm), 0.028 ± 0.001 s−1 (250 μm) and 0.023 ± 0.002 s−1 (500 μm) (n = 9). These values are not significantly different from each other when compared using one-way repeated measures ANOVA. The mean data are summarised in Fig. 2C which shows the dependence on caffeine concentration of the amplitude of the first systolic Ca2+ transient in caffeine (normalised to the control value; Fig. 2Ca), the amplitude of the steady-state systolic Ca2+ transient (normalised to that of the smallest transient obtained on removal of caffeine; Fig. 2Cb) and the rate constant of decay of the caffeine response (normalised to the rate constant of recovery on removal of caffeine; Fig. 2Cc). All these parameters increased with increasing caffeine concentration.
The effects of caffeine on SR Ca2+ content
The experiment illustrated in Fig. 3 was designed to measure the SR Ca2+ content either in control conditions or after stimulation in the presence of various concentrations of caffeine. A qualitative result is shown in Fig. 3A. The rise in [Ca2+]i produced by the addition of 10 mm caffeine was decreased by prior exposure to 500 μm caffeine. Quantitative measurements of SR Ca2+ content are presented in Fig. 3B. The integral of the Na+-Ca2+ exchange current was decreased by previous exposure to 500 μm caffeine. Figure 3C shows mean data for SR Ca2+ content as a function of caffeine concentration; it is clear that the higher the caffeine concentration, the greater the reduction of SR Ca2+ content. Exposure to caffeine reduced the SR Ca2+ content from a control value of 80 ± 9 μmol l−1 to 65 ± 7 μmol l−1 (100 μm), 47 ± 9 μmol l−1 (250 μm) and 36 ± 5 μmol l−1 (500 μm) (n = 5). These values are all significantly different from each other (P < 0.05) when compared using the Student-Newman-Keuls method and one-way repeated measures ANOVA. The data of Fig. 3D show the SR Ca2+ content plotted as a function of the time constant of decay of the caffeine response (obtained as in Fig. 2). This shows that the greater the reduction of SR Ca2+ content, the faster the decay of the caffeine response. This relationship is analysed quantitatively below.
Figure 3. The effects of caffeine (100–500 μm) on SR Ca2+ content.
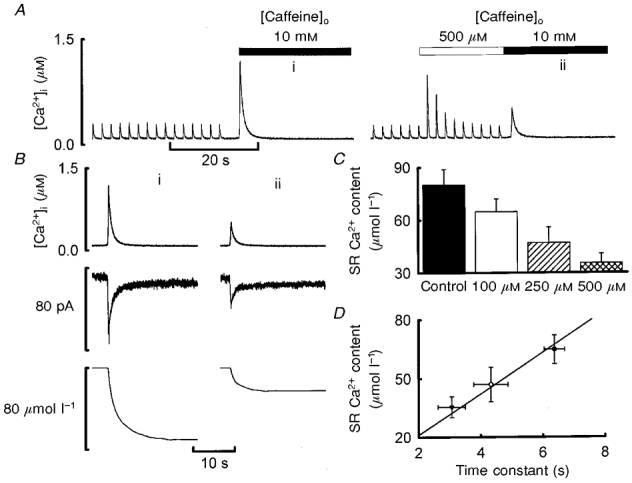
A, time course. In both parts of the record shown, the cell was first stimulated with 100 ms duration depolarising pulses from −40 to 0 mV at 0.5 Hz. Stimulation was then stopped and 10 mm caffeine applied (filled bar). In the right-hand record, 500 μm caffeine (open bar) was applied for the period shown before addition of 10 mm caffeine. B, measurement of SR Ca2+ content. Traces show (from top to bottom): [Ca2+]i, membrane current, integrated current. The records were obtained from the applications of 10 mm caffeine indicated in A. C, mean data showing the effects of different concentrations of caffeine on SR Ca2+ content. Values are means ±s.e.m. (n = 5 for all concentrations). D, graph of SR Ca2+ content as a function of the time constant of decay of the caffeine-evoked potentiation (see Fig. 2). Each symbol is from a different caffeine concentration (from left to right: 500, 250 and 100 μm).
The next part of this work involved comparing the data with the predictions of the model presented in our previous work (Eisner et al. 1998). We assume that the fraction of Ca2+ released from the SR is f and that this is independent of the degree of filling of the SR with Ca2+. The assumption of constant fractional release is not supported by previous work (Bassani et al. 1995; Janczewski et al. 1995; Spencer & Berlin, 1995; Trafford et al. 1997) but is convenient for present purposes. The Ca2+ content of the SR (in μmol l−1) before the nth stimulus is SRn, the amount of Ca2+ which enters the cell via the L-type current is iCa (in μmol l−1) and the fraction of the systolic Ca2+ which is pumped out of the cell (as opposed to being taken back into the SR) is r.
As shown previously, the SR Ca2+ content on the nth (SRn) and nth+ 1 (SRn+ 1) pulse are related by:
We now extend the model by differentiating the SR Ca2+ content with respect to time (‘SR’ now represents the SR Ca2+ content at time t).
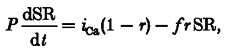 |
where P is the period between stimuli, 2 s.
This then has the solution:
 |
(1) |
where f1 is the fractional release before addition of caffeine and f the fractional release in the presence of caffeine.
Therefore the time constant is given by:
 |
(2) |
In other words the rate constant of decay of the SR Ca2+ content is proportional to f. Since, at least in this simple model, the fraction of Ca2+ released from the SR is constant and the contribution made by the L-type Ca2+ current is also fixed, then the time constant of decay of potentiation of the systolic Ca2+ transient will be the same as that of the decay of the SR Ca2+ content. This implies that the greater the fractional release of Ca2+, the greater will be the rate constant of relaxation of the caffeine response. This prediction is borne out by results such as those of Figs 1 and 2, which show that the rate constant of decay of the response in caffeine is faster than that of the recovery after caffeine removal and, furthermore, that the rate constant in caffeine increases with increasing caffeine concentration.
From the above, it can be shown that the SR Ca2+ content in the steady state in caffeine is given by:
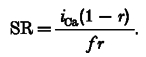 |
(3) |
This equation predicts that increasing f will decrease the SR Ca2+ content. This conclusion is supported by the data showing that the SR Ca2+ content decreased as a function of caffeine concentration (Fig. 3C).
Quantitative problems with the simple model
The problem is shown by calculating the value of fr in two different ways. (1) The rate constant of decay of the caffeine response can be used to calculate the value of fr. From eqn (2):
Under voltage clamp conditions, the mean rate constant for the decay of the caffeine response in 500 μm caffeine was 0.35 ± 0.05 s−1, therefore this gives a value of fr of 0.73 ± 0.09. If the fractional efflux from the cell was ∼0.1 (Negretti et al. 1993) this gives a value of f, the fractional release of Ca2+ from the SR, of greater than 1, which is clearly impossible. (2) The other approach is to calculate fr from the relationship between steady-state SR Ca2+ content and iCa. From eqn (3):
 |
In 500 μm caffeine, the steady-state SR Ca2+ content was 35.5 ± 5.4 μmol l−1 (n = 5) and the mean value of iCa/SR is therefore 0.052 ± 0.007 (n = 5) and, since (1 –r) must be less than 1.0, this means that fr must be less than 0.05. This value is much less than that calculated above from the time constant. The former analysis therefore suggests that the observed decay of the caffeine response occurs much more quickly than the model would predict.
Continuous measurements of fractional release and efflux
The fact that fr calculated from the decay of the caffeine response is greater than that calculated from the steady-state SR Ca2+ content could be due to either f or r being greater during the peak of the caffeine response than in the steady state. We have therefore measured these parameters directly using the approach illustrated in Fig. 4. Figure 4a shows the effects of caffeine on the systolic Ca2+ transient in a voltage clamped cell. The Ca2+ transients and associated current and flux records for both the control and the second transient in caffeine are shown in Fig. 4B. We have used the second pulse in caffeine in this case because there was an element of spontaneous release of Ca2+ from the SR associated with the first pulse; this therefore precludes proper analysis of the sarcolemmal Ca2+ fluxes via the L-type Ca2+ current and Na+-Ca2+ exchange during the voltage clamp pulse. The changes in total cytoplasmic [Ca2+] are shown in Fig. 4Bd. While the amplitude of the systolic free Ca2+ transient increased by a factor of 11.6 in caffeine, the total Ca2+ transient increased by a factor of only 4.6. The fractional increase in free Ca2+ is greater than that of the total because the buffering curve has a Kd of 0.58 μm (not shown, but see Fig. 6a for an example). The calculated changes in SR Ca2+ content for these two pulses are shown in Fig. 4Be. As expected, the application of caffeine resulted in a large increase in the fraction of SR Ca2+ which was released (f). The membrane current records of Fig. 4Bb show that the second pulse in caffeine was accompanied by a larger Na+-Ca2+ exchange current tail than was the control. This result is qualitatively similar to that shown previously (Trafford et al. 1998), but is quantitatively more marked because of the effect of decreased [Ca2+]o on f under control conditions. The integrated traces (Fig. 4Bc) show that in control the Ca2+ influx on the L-type Ca2+ current and the loss on Na+-Ca2+ exchange were equal with values of 1.37 μmol l−1. On the second pulse in caffeine, although the Ca2+ entry was unaffected, the loss was greatly increased (to 9.4 μmol l−1). This result accords with previous data (Trafford et al. 1998). In the present work we can compare the Ca2+ loss with the increase in total calcium. The amplitude of the total calcium transient has increased by a factor of 4.6 whereas the loss from the cell has increased by a factor of 6.9. In other words the fraction of the systolic Ca2+ which is pumped out of the cell is greater on the second pulse in caffeine. The data presented in Fig. 5 show similar calculations throughout the period of exposure to caffeine. Again, the cell was in net flux balance (Fig. 5C) in control. On application of caffeine the increase in systolic [Ca2+]i results in an increase in the Na+-Ca2+ exchange flux such that the cell loses Ca2+. As the systolic Ca2+ transient decreases so does the Na+-Ca2+ exchange flux until the cell regains flux balance. The trace in Fig. 5D shows measurements of total SR Ca2+ content during each systolic Ca2+ transient. The steady-state SR Ca2+ content at the start of the trace was obtained from the initial known level measured by applying 10 mm caffeine following steady-state stimulation (not shown). Subsequent estimates were made by taking the integrated Ca2+ fluxes and calculating the change in total cell [Ca2+] (Trafford et al. 1997) and thus SR Ca2+ content, as illustrated in Fig. 4. One correction has to be made. As shown previously (Trafford et al. 1998), the changes in SR Ca2+ content calculated from the sarcolemmal fluxes do not account for all of that measured from the change in content obtained directly by applying 10 mm caffeine. This is because some of the Ca2+ loss occurs continuously over the first few seconds after application of caffeine as a consequence of elevated resting [Ca2+]i. It does not therefore contribute to the Na+-Ca2+ exchange current relaxations on repolarisation. In this experiment, the loss of SR [Ca2+] calculated from the membrane currents on each pulse in caffeine was 33 μmol l−1, whereas that from the direct measurement obtained from a 10 mm caffeine application following steady-state stimulation in 500 μm caffeine was 51 μmol l−1 (not shown). On each pulse we have therefore multiplied the net sarcolemmal Ca2+ flux (Fig. 5C) by 51/33 before using these fluxes to calculate changes in SR Ca2+ content. It should be noted that the level of Ca2+ which remains in the SR at the end of systole (the lower values) is calculated to decrease initially on application of caffeine but to then recover partially, whereas the values at the end of diastole decrease monotonically in caffeine. Figure 5E shows that the fraction of Ca2+ pumped out of the cell (r) increased from 0.06 in control to a maximum value of 0.14 on the first pulse in caffeine before relaxing back to the control level. Upon removal of caffeine there was a transient reduction in the fractional loss of Ca2+ from the cell (r). This reduction in efflux facilitates the recovery of SR Ca2+ content back to control levels. Figure 5F also shows that the fraction of SR Ca2+ released, f, increased initially in caffeine but then relaxed to a lower value (still higher than that in control conditions).
Figure 4. Measurements of total and free cytoplasmic Ca2+ transients, SR Ca2+ content and sarcolemmal Ca2+ fluxes.

A, time course. Caffeine (500 μm) was applied for the period shown. B, specimen records taken from the transients indicated in A. a, [Ca2+]i; b, membrane current (Im); c, calculated sarcolemmal (SL) fluxes; d, total Ca2+ transients; e, calculated change in SR Ca2+ content.
Figure 6. Interdependence of SR Ca2+ content, total [Ca2+], [Ca2+]i and Ca2+ efflux.

A, Ca2+ buffering curve. This was obtained from the application of 10 mm caffeine. Total [Ca2+] is plotted as a function of [Ca2+]i. The continuous line through the data shows the fit to the data with maximal binding (Bmax) = 97 μmol l−1 and Kd= 0.49 μm. B, dependence of total [Ca2+] (•) and [Ca2+]i (^) on SR Ca2+ content. The curves through the data points have been fitted with the relationship: b+a(SR Ca2+ content)n (see text). The value of the exponent n for the total [Ca2+] relationship (continuous line) is 2.1 whilst that for the free [Ca2+] relationship (dashed line) is 5.7. C, Ca2+ efflux, calculated from the Na+-Ca2+ exchange currents on repolarisation, as a function of total [Ca2+] during caffeine application (▪) and upon caffeine washout (□). The value of the exponent for the curve fitted to the data is 1.6. D, Ca2+ efflux as a function of [Ca2+]i during caffeine application (▴) and upon caffeine washout (▵). The continuous line represents the best fit to the data with Vmax= 15.2 μmol l−1 and Km= 1.4 μm. The horizontal dashed line shows the Ca2+ influx on the L-type Ca2+ current. All the data were obtained from the same cell shown in Fig. 5. Data in B-D were taken from the period of the first caffeine application shown in Fig. 5A.
Figure 5. Pulse-by-pulse analysis of sarcolemmal and SR Ca2+ fluxes.
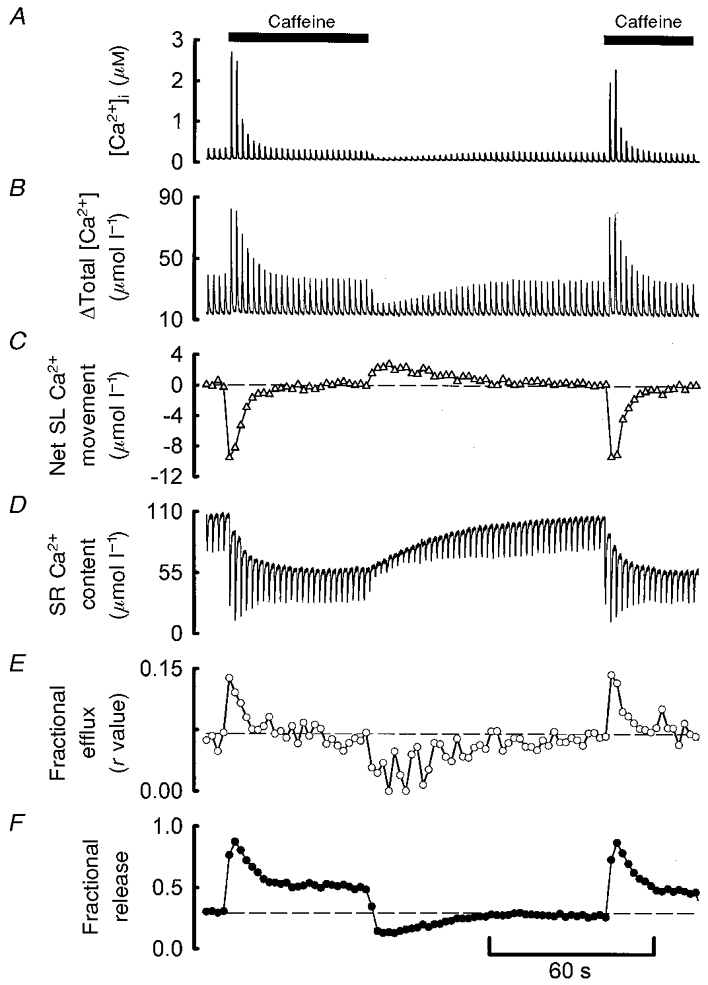
A, [Ca2+]i. B, total cytoplasmic [Ca2+]. C, net sarcolemmal Ca2+ flux calculated from Ca2+ entry on the L-type Ca2+ current and efflux on Na+-Ca2+ exchange. The dashed line represents zero net flux. D, SR Ca2+ content. E, fractional efflux (r in model) calculated as: Ca2+ efflux/amplitude of the total Ca2+ transient. F, fractional SR Ca2+ release (f in model) calculated as: (diastolic – systolic SR Ca2+ content)/diastolic SR Ca2+ content.
Data from the same experiment are summarised in Fig. 6. Figure 6a shows the Ca2+ buffering curve from this cell with a Kd of 0.49 μm. Figure 6B shows the magnitude of both the systolic change in free and total [Ca2+] as a function of the end-diastolic SR Ca2+ content. Both the free and total changes in [Ca2+] have been empirically fitted to a function of the form:
where a, b and n are parameters determined by a least-squares algorithm. In this experiment the exponent (n) was 2.1 for the total Ca2+ and 5.7 for the free Ca2+. In other words the free [Ca2+] depends considerably more steeply on SR Ca2+ content than does total [Ca2+]. On average (5 experiments), the value of n for the relationship between total [Ca2+] and SR Ca2+ content was 1.55 ± 0.20, whereas that for free [Ca2+] and SR Ca2+ content was 3.22 ± 0.6. The relationship between SR Ca2+ content and the change in total [Ca2+] reflects the fact that f increases with increasing SR Ca2+ content. The even steeper dependence of free Ca2+ on SR Ca2+ content is due to the fact that, at higher levels of [Ca2+]i, there is less Ca2+ buffering and therefore free [Ca2+] increases fractionally more for a given change in total [Ca2+]. If the data in the absence of caffeine are examined in a similar way, the relationships are less steep and similar for the free and total calcium (not shown). This is presumably because the buffering is linear for smaller Ca2+ transients. Figure 6C and D shows the Ca2+ efflux per pulse as a function of, respectively, total and free [Ca2+]. The data from the caffeine application and washout periods lie on the same curves. Ca2+ efflux is a steeply increasing function of the magnitude of the systolic increase in total [Ca2+] (Fig. 6C) but increases as a much more shallow (hyperbolic) function of free [Ca2+] (Fig. 6D). Again the difference between the two relationships can be ascribed to Ca2+ buffering.
DISCUSSION
The results of this paper show that low concentrations of caffeine produce a purely transient potentiation of the systolic Ca2+ transient accompanied by a decrease in the SR Ca2+ content. This paper extends our previous work: (i) by producing larger effects of caffeine thus enabling more accurate quantification and therefore more useful comparisons of various cellular Ca2+ fluxes; and (ii) by using the Ca2+ buffering properties obtained in the same cell it is then possible to calculate changes in total as well as free Ca2+. This, together with measurements of sarcolemmal Ca2+ fluxes allows (iii) calculation of the fractional release of Ca2+ from the SR during systole and (iv) the fraction of the total Ca2+ added to the cytoplasm which is pumped out of the cell (the fractional efflux). These measurements then allow us to compare the time course and magnitude of the effects of potentiating CICR with caffeine with those predicted by a simple model. The analysis shows that, during the transient potentiation of systolic [Ca2+]i, there are pronounced effects on both the fraction of the SR Ca2+ content which is released and the fractional efflux of Ca2+ from the cell during the contractile cycle. These results are of general relevance to studies investigating the mechanisms underlying many cardiac inotropic manoeuvres or the cellular basis of the effects of extrasystolic beats upon subsequent force generation in cardiac muscle.
The effects of caffeine on the systolic Ca2+ transient
The results of the present paper show, in agreement with our previous work (O'Neill & Eisner, 1990; Trafford et al. 1998), that low concentrations of caffeine have no steady-state effect on the amplitude of the systolic Ca2+ transient. We have examined this under conditions in which the magnitude of the transient effect was maximised by decreasing the external Ca2+ concentration. This decreases the trigger for Ca2+ release and therefore the fraction of the SR Ca2+ content which is released under control conditions (Bassani et al. 1995). Under these conditions, the application of caffeine greatly increases the fractional release of Ca2+ from the SR and therefore the magnitude of the effect, compared with our previous work (Trafford et al. 1998). Although the effects of caffeine were studied under similar conditions in a previous paper (O'Neill & Eisner, 1990), the use of indo-1 as an indicator precluded accurate measurements of the small Ca2+ transients in reduced external [Ca2+]. Furthermore, the absence of information regarding sarcolemmal Ca2+ fluxes, SR Ca2+ content and cellular Ca2+ buffering capacity did not allow measurements of the nature presented in this paper.
The present results show that, when CICR is potentiated with low concentrations of caffeine, the amplitude of the systolic Ca2+ transient returns to within less than 2 % of control. Any residual maintained effect is considerably less than 1 % of the peak effect. Furthermore, the results show that the time course of the steady-state Ca2+ transient in caffeine is identical to that of the control. This emphasises that those manoeuvres that affect only SR Ca2+ release will have no steady-state effect on the systolic Ca2+ transient or contraction in cardiac muscle. It is therefore difficult to see how modulation of the ryanodine receptor or its coupling to Ca2+ influx across the sarcolemma can be involved in the changes in contraction which occur in cardiac hypertrophy or failure, as has been suggested in previous work (Gómez et al. 1997; Wessely et al. 1998; Shorofsky et al. 1999). For completeness, it should be noted that the present analysis deals only with manoeuvres which affect systolic release of Ca2+. If an agent increases the diastolic leak of Ca2+ (as is the case for ryanodine; Bers et al. 1987), then this will result in a decrease in SR Ca2+ content and a maintained depression of contraction.
Quantitative analysis of the effects of caffeine
The results show that, the higher the caffeine concentration, the more short lived are its effects and the greater the decrease in the SR Ca2+ content. This parallel effect on the time course and SR Ca2+ content is predicted by a simple model in which we assume that a fraction of the SR Ca2+ content, f, is released during each systole, with f increasing with caffeine concentration. In addition a constant fraction of the systolic [Ca2+], r, is pumped out of the cell. However, the model fails to reproduce the data quantitatively. This is shown to occur because the product fr is greater at the peak of the caffeine response than in the steady state.
We have been able to obtain independent measurements of both f and r. The fractional release of Ca2+ from the SR, f, can be measured if both the SR Ca2+ content and the amount released are known (Bassani et al. 1995). The SR Ca2+ content was obtained by integrating the caffeine-evoked Na+-Ca2+ exchange current (Varro et al. 1993). The amount released was calculated by estimating the changes in total[Ca2+] during systole from the measured changes in [Ca2+]i and a knowledge of the buffering properties of the cell (Hove-Madsen & Bers, 1993; Berlin et al. 1994; Trafford et al. 1999). This method assumes, of course, that the measurements of Ca2+ buffering made during the slow time course of the relaxation of the increase in [Ca2+]i produced by 10 mm caffeine are valid during the briefer systolic Ca2+ transient.
The fractional efflux of Ca2+ from the cell, r, was obtained by dividing the amount pumped out of the cell on each pulse (measured from the Na+-Ca2+ exchange currents) by the increase in total systolic [Ca2+]. The results show that both f and r change in the presence of caffeine (Fig. 5). Following the initial increase due to caffeine, f decreases to a level that is still greater than control. Similarly, there is a transient increase in r upon caffeine application. However, unlike f the value of r recovers to the steady-state level seen under control conditions.
It is necessary to consider the origin of the changes in f and r during caffeine application. The most likely explanation of the secondary decrease in f during exposure to caffeine is that it is due to a decrease in SR Ca2+ content. Previous work has shown that increasing the SR Ca2+ content increases the fraction of the SR Ca2+ released during each pulse (Bassani et al. 1995; Janczewski et al. 1995; Spencer & Berlin, 1995; Trafford et al. 1997). This relationship is confirmed in Fig. 6B. It is less obvious why r (the fraction of the systolic Ca2+ transient which is pumped out of the cell, as opposed to being taken back into the SR) is higher during the initial phase of the caffeine response. A likely explanation is provided by the fact that the fractional increase in free systolic [Ca2+] is greater than that of total systolic [Ca2+] (compare graphs in Fig. 6C and D). This arises because, in the presence of caffeine, systolic Ca2+ rises to levels considerably greater than the Kd of the cytoplasmic Ca2+ buffers (Bers & Berlin, 1995). This large increase in free [Ca2+] will mean that Na+-Ca2+ exchange will be greatly activated and a larger amount of Ca2+ pumped out of the cell. This explanation requires that a given increase in [Ca2+]i produces a greater fractional increase in Na+-Ca2+ exchange than of SR Ca2+-ATPase activity (in other words that the Na+-Ca2+ exchange has a lower affinity for [Ca2+]i than does the SR Ca2+-ATPase). It is difficult to find data where this point has been examined under comparable conditions. However, the Km for the SR Ca2+-ATPase appears to be of the order of 0.5 μm (Carafoli, 1988), whereas the Na+-Ca2+ exchange activity appears to be linearly related to [Ca2+]i over a range up to 1.5 μm (Beuckelmann & Wier, 1989). These values therefore support this hypothesis.
Physiological implications
These data show that there is a steep relationship between SR Ca2+ content and the magnitude of the systolic increase in free [Ca2+]. On average this can be described by saying that the amplitude of the systolic free Ca2+ transient depends on the sixth power of the SR Ca2+ content. This arises because: (1) the total amount of Ca2+ released is a steep function of SR Ca2+ content and (2) the free Ca2+ concentration increases steeply with respect to total [Ca2+]. The steep increase in free [Ca2+] means that the efflux on the Na+-Ca2+ exchange is very steeply activated as a function of SR Ca2+ content. This will act to limit SR Ca2+ content. The graph of systolic [Ca2+] against Ca2+ efflux (Fig. 6D) shows how much Ca2+ is lost from the cell on each contraction. In the steady state this must be balanced by Ca2+ influx (when the Ca2+ efflux equals the influx, as shown by the horizontal dashed line). This relationship can therefore be used to calculate how much Ca2+ influx is required for the cell to produce a given amplitude of the systolic Ca2+ transient in the steady state. Specifically, to produce (in the experiment of Fig. 6D) a Ca2+ transient of amplitude 2.5 μm in the steady state would require a Ca2+ influx (via the L-type Ca2+ current) of approximately 10 μmol l−1. Furthermore, anything that changes the relationship between [Ca2+]i and Na+-Ca2+ exchange activity will produce an equivalent change in the relationship between Ca2+ influx and systolic [Ca2+]i. Finally, the absence of any steady-state effect on systolic [Ca2+]i, even in the presence of a large transient effect, shows that manoeuvres which simply affect the RyR will have no steady-state effect on systolic [Ca2+]i.
Comparison with the recirculation fraction
In previous work studying phenomena such as post extrasystolic potentiation, much use has been made of the ‘recirculation fraction’ (Wohlfart & Elzinga, 1982). This is the fraction of Ca2+ released on one contraction that is returned to the SR rather than being pumped out of the cell. Operationally, it is measured as: (magnitude of contraction n+ 1)/(magnitude of contraction n). It is worth noting that this value depends on the fraction of SR Ca2+ which is released (f) as well as on that fraction which is pumped out of the cell. If f is very small, the recirculation factor will be very large even if most of the released Ca2+ is pumped out of the cell. The present study provides independent measurements of f and r rather than lumping them together as one factor. It is also worth noting that, although the present data are reasonably well fitted by single exponentials, they cannot be fitted by fixed f and r. It is therefore likely that, in work on post extrasystolic potentiation etc., the apparent simple exponential behaviour (Wohlfart & Elzinga, 1982; Wier & Yue, 1986; Wohlfart & Khan, 1987; Kojima et al. 1995) may be produced by similarly complicated changes in f and r.
The data in this paper provide measurements of the systolic changes in total SR Ca2+ content. It is interesting to note the time course of change in the end-systolic SR Ca2+ content when caffeine is added. Although this initially decreases, it then partially recovers (Fig. 5D).
Conclusions
In this paper we have related changes in systolic [Ca2+]i and thus cardiac contractility to those in SR Ca2+ content, the fractional release of Ca2+ from the SR, sarcolemmal Ca2+ influx and the fractional efflux of Ca2+ during the contractile cycle. Since Ca2+ entry via the L-type Ca2+ current does not change once a steady state is reached in the presence of caffeine (Trafford et al. 1998), the results demonstrate that the increased fractional release of Ca2+ from the SR that occurs when CICR is potentiated is the mechanism by which the amplitude of systolic [Ca2+]i is maintained in the presence of a reduced SR Ca2+ content. The data also show that the properties of the intracellular Ca2+ buffers are important in determining the time course of the caffeine effect. At the start of the caffeine application the greater fractional release of Ca2+ from the SR leads to saturation of the buffers and a greater fractional increase in free [Ca2+]. This increase in free [Ca2+] then stimulates increased Ca2+ efflux from the cell leading to (i) the reduction in SR Ca2+ availability and (ii) the more rapid decay of the caffeine effect than that predicted simply by the model. These experiments show, therefore, that the inotropic effect of even a simple manoeuvre such as the application of caffeine (which only directly affects the RyR) depends on a combination of SR, sarcolemma and Ca2+ buffering. Similar analysis could be applied to other types of pharmacological interventions to determine the cellular basis of cardiac inotropy in normal and diseased states.
Acknowledgments
This work was supported by the British Heart Foundation and the Wellcome Trust.
References
- Adams WA, Trafford AW, Eisner DA. 2,3-Butanedione monoxime (BDM) decreases sarcoplasmic reticulum Ca content by stimulating Ca release in isolated rat ventricular myocytes. Pflügers Archiv. 1998;436:776–781. doi: 10.1007/s004240050701. [DOI] [PubMed] [Google Scholar]
- Bassani JWM, Yuan W, Bers DM. Fractional SR Ca release is regulated by trigger Ca and SR Ca content in cardiac myocytes. American Journal of Physiology. 1995;268:C1313–1329. doi: 10.1152/ajpcell.1995.268.5.C1313. [DOI] [PubMed] [Google Scholar]
- Berlin JR, Bassani JWM, Bers DM. Intrinsic cytosolic calcium buffering properties of single rat cardiac myocytes. Biophysical Journal. 1994;67:1775–1787. doi: 10.1016/S0006-3495(94)80652-6. [DOI] [PMC free article] [PubMed] [Google Scholar]
- Bers DM, Berlin JR. Kinetics of [Ca2+]i decline in cardiac myocytes depend on peak [Ca2+]i. American Journal of Physiology. 1995;268:C271–277. doi: 10.1152/ajpcell.1995.268.1.C271. [DOI] [PubMed] [Google Scholar]
- Bers DM, Bridge JH, Macleod KT. The mechanism of ryanodine action in rabbit ventricular muscle evaluated with Ca-selective microelectrodes and rapid cooling contractures. Canadian Journal of Physiology and Pharmacology. 1987;65:610–618. doi: 10.1139/y87-103. [DOI] [PubMed] [Google Scholar]
- Beuckelmann DJ, Wier WG. Sodium-calcium exchange in guinea-pig cardiac cells: exchange current and changes in intracellular Ca2+ The Journal of Physiology. 1989;414:499–520. doi: 10.1113/jphysiol.1989.sp017700. [DOI] [PMC free article] [PubMed] [Google Scholar]
- Brillantes A-MB, Ondrias K, Scott A, Kobrinsky E, Ondriasova E, Moschella MC, Jayaraman T, Landers M, Ehrlich BE, Marks AR. Stabilization of calcium release channel (ryanodine receptor) function by FK506-binding protein. Cell. 1994;77:513–523. doi: 10.1016/0092-8674(94)90214-3. [DOI] [PubMed] [Google Scholar]
- Carafoli E. Membrane transport of calcium: an overview. Methods in Enzymology. 1988;157:3–11. doi: 10.1016/0076-6879(88)57063-5. [DOI] [PubMed] [Google Scholar]
- Cheng H, Lederer WJ, Cannell MB. Calcium sparks: elementary events underlying excitation-contraction coupling in heart muscle. Science. 1993;262:740–744. doi: 10.1126/science.8235594. [DOI] [PubMed] [Google Scholar]
- Díaz ME, Trafford AW, O'neill SC, Eisner DA. Measurement of sarcoplasmic reticulum Ca2+ content and sarcolemmal Ca2+ fluxes in isolated rat ventricular myocytes during spontaneous Ca2+ release. The Journal of Physiology. 1997;501:3–16. doi: 10.1111/j.1469-7793.1997.003bo.x. [DOI] [PMC free article] [PubMed] [Google Scholar]
- Eisner DA, Trafford AW, Díaz ME, Overend CL, O'neill SC. The control of Ca release from the cardiac sarcoplasmic reticulum: regulation versus autoregulation. Cardiovascular Research. 1998;38:589–604. doi: 10.1016/s0008-6363(98)00062-5. [DOI] [PubMed] [Google Scholar]
- Fabiato A. Calcium-induced release of calcium from the cardiac sarcoplasmic reticulum. American Journal of Physiology. 1983;245:C1–14. doi: 10.1152/ajpcell.1983.245.1.C1. [DOI] [PubMed] [Google Scholar]
- Gómez AM, Valdivia HH, Cheng H, Lederer MR, Santana LF, Cannell MB, Mccune SA, Altschuld RA, Lederer WJ. Defective excitation-contraction coupling in experimental cardiac hypertrophy and heart failure. Science. 1997;276:800–806. doi: 10.1126/science.276.5313.800. [DOI] [PubMed] [Google Scholar]
- Hohenegger M, Suko J. Phosphorylation of the purified cardiac ryanodine receptor by exogenous and endogenous protein kinases. Biochemical Journal. 1993;296:303–308. doi: 10.1042/bj2960303. [DOI] [PMC free article] [PubMed] [Google Scholar]
- Horn R, Marty A. Muscarinic activation of ionic currents measured by a new whole-cell recording method. Journal of General Physiology. 1988;92:145–159. doi: 10.1085/jgp.92.2.145. [DOI] [PMC free article] [PubMed] [Google Scholar]
- Hove-Madsen L, Bers DM. Passive Ca buffering and SR Ca uptake in permeabilized rabbit ventricular myocytes. American Journal of Physiology. 1993;264:C677–686. doi: 10.1152/ajpcell.1993.264.3.C677. [DOI] [PubMed] [Google Scholar]
- Janczewski AM, Spurgeon HA, Stern MD, Lakatta EG. Effects of sarcoplasmic reticulum Ca2+ load on the gain function of Ca2+ release by Ca2+ current in cardiac cells. American Journal of Physiology. 1995;268:H916–920. doi: 10.1152/ajpheart.1995.268.2.H916. [DOI] [PubMed] [Google Scholar]
- Kojima S, Wu ST, Wikman-Coffelt J, Parmley WW. Contractile and intracellular Ca2+ decay in potentiated contractions following multiple extrasystolic beats. Cell Calcium. 1995;18:155–164. doi: 10.1016/0143-4160(95)90006-3. [DOI] [PubMed] [Google Scholar]
- Marx SO, Ondrias K, Marks AR. Coupled gating between individual skeletal muscle Ca2+ release channels (ryanodine receptors) Science. 1998;281:818–821. doi: 10.1126/science.281.5378.818. [DOI] [PubMed] [Google Scholar]
- Negretti N, O'neill SC, Eisner DA. The relative contributions of different intracellular and sarcolemmal systems to relaxation in rat ventricular myocytes. Cardiovascular Research. 1993;27:1826–1830. doi: 10.1093/cvr/27.10.1826. [DOI] [PubMed] [Google Scholar]
- Negretti N, Varro A, Eisner DA. Estimate of net calcium fluxes and sarcoplasmic reticulum calcium content during systole in rat ventricular myocytes. The Journal of Physiology. 1995;486:581–591. doi: 10.1113/jphysiol.1995.sp020836. [DOI] [PMC free article] [PubMed] [Google Scholar]
- O'neill SC, Eisner DA. A mechanism for the effects of caffeine on Ca2+ release during diastole and systole in isolated rat ventricular myocytes. The Journal of Physiology. 1990;430:519–536. doi: 10.1113/jphysiol.1990.sp018305. [DOI] [PMC free article] [PubMed] [Google Scholar]
- Overend CL, O'neill SC, Eisner DA. The effect of tetracaine on stimulated contractions, sarcoplasmic reticulum Ca2+ content and membrane current in isolated rat ventricular myocytes. The Journal of Physiology. 1998;507:759–769. doi: 10.1111/j.1469-7793.1998.759bs.x. [DOI] [PMC free article] [PubMed] [Google Scholar]
- Rakovic S, Galione A, Ashamu GA, Potter BVL, Terrar DA. A specific cyclic ADP-ribose antagonist inhibits cardiac excitation-contraction coupling. Current Biology. 1996;6:989–996. doi: 10.1016/s0960-9822(02)00643-7. [DOI] [PubMed] [Google Scholar]
- Rousseau E, Meissner G. Single cardiac sarcoplasmic reticulum Ca2+-release channel: activation by caffeine. American Journal of Physiology. 1989;256:H328–333. doi: 10.1152/ajpheart.1989.256.2.H328. [DOI] [PubMed] [Google Scholar]
- Satoh H, Delbridge LMD, Blatter LA, Bers DM. Surface:volume relationship in cardiac myocytes studied with confocal microscopy and membrane capacitance measurements: species-dependence and developmental effects. Biophysical Journal. 1996;70:1494–1504. doi: 10.1016/S0006-3495(96)79711-4. [DOI] [PMC free article] [PubMed] [Google Scholar]
- Schiefer A, Meissner G, Isenberg G. Ca2+ activation and Ca2+ inactivation of canine reconstituted cardiac sarcoplasmic reticulum Ca2+-release channels. The Journal of Physiology. 1995;489:337–348. doi: 10.1113/jphysiol.1995.sp021055. [DOI] [PMC free article] [PubMed] [Google Scholar]
- Shorofsky SR, Aggarwal R, Corretti M, Baffa JM, Strum JM, van Seikhan BA, Kobayashi YM, Jones LR, Wier WG, Balke CW. Cellular mechanisms of altered contractility in the hypertrophied heart: big hearts, big sparks. Circulation Research. 1999;84:424–434. doi: 10.1161/01.res.84.4.424. [DOI] [PubMed] [Google Scholar]
- Sitsapesan R, Mcgarry SJ, Williams AJ. Cyclic ADP-ribose, the ryanodine receptor and Ca2+ release. Trends in Pharmacological Sciences. 1995a;16:386–391. doi: 10.1016/s0165-6147(00)89080-x. [DOI] [PubMed] [Google Scholar]
- Sitsapesan R, Montgomery RAP, Williams AJ. New insights into the gating mechanisms of cardiac ryanodine receptors revealed by rapid changes in ligand concentration. Circulation Research. 1995b;77:765–772. doi: 10.1161/01.res.77.4.765. [DOI] [PubMed] [Google Scholar]
- Spencer CI, Berlin JR. Control of sarcoplasmic reticulum calcium release during calcium loading in isolated rat ventricular myocytes. The Journal of Physiology. 1995;488:267–279. doi: 10.1113/jphysiol.1995.sp020965. [DOI] [PMC free article] [PubMed] [Google Scholar]
- Trafford AW, Díaz ME, Eisner DA. Stimulation of Ca-induced Ca release only transiently increases the systolic Ca transient: measurements of Ca fluxes and sarcoplasmic reticulum Ca. Cardiovascular Research. 1998;37:710–717. doi: 10.1016/s0008-6363(97)00266-6. [DOI] [PubMed] [Google Scholar]
- Trafford AW, Díaz ME, Eisner DA. A novel, rapid and reversible method to measure Ca buffering and timecourse of total sarcoplasmic reticulum Ca content in cardiac ventricular myocytes. Pflügers Archiv. 1999;437:501–503. doi: 10.1007/s004240050808. [DOI] [PubMed] [Google Scholar]
- Trafford AW, Díaz ME, Negretti N, Eisner DA. Enhanced calcium current and decreased calcium efflux restore sarcoplasmic reticulum Ca content following depletion. Circulation Research. 1997;81:477–484. doi: 10.1161/01.res.81.4.477. [DOI] [PubMed] [Google Scholar]
- Varro A, Negretti N, Hester SB, Eisner DA. An estimate of the calcium content of the sarcoplasmic reticulum in rat ventricular myocytes. Pflügers Archiv. 1993;423:158–160. doi: 10.1007/BF00374975. [DOI] [PubMed] [Google Scholar]
- Wessely R, Klingel K, Santana LF, Dalton N, Hongo M, Lederer WJ, Kandolf R, Knowlton KU. Transgenic expression of replication-restricted enteroviral genomes in heart muscle induces defective excitation-contraction coupling and dilated cardiomyopathy. Journal of Clinical Investigation. 1998;102:1444–1453. doi: 10.1172/JCI1972. [DOI] [PMC free article] [PubMed] [Google Scholar]
- Wier WG, Yue DT. Intracellular calcium transients underlying the short-term force-interval relationship in ferret ventricular myocardium. The Journal of Physiology. 1986;376:507–530. doi: 10.1113/jphysiol.1986.sp016167. [DOI] [PMC free article] [PubMed] [Google Scholar]
- Wohlfart B, Elzinga G. Electrical and mechanical responses of the intact rabbit heart in relation to the excitation interval. A comparison with the isolated papillary muscle preparation. Acta Physiologica Scandinavica. 1982;115:331–340. doi: 10.1111/j.1748-1716.1982.tb07086.x. [DOI] [PubMed] [Google Scholar]
- Wohlfart B, Khan AR. Analysis of the inotropic effect of prenalterol in papillary muscles from guinea-pig hearts. Acta Physiologica Scandinavica. 1987;130:187–191. doi: 10.1111/j.1748-1716.1987.tb08127.x. [DOI] [PubMed] [Google Scholar]
- Xu L, Mann G, Meissner G. Regulation of cardiac Ca2+ release channel (ryanodine receptor) by Ca2+, H+, Mg2+, and adenine nucleotides under normal and simulated ischemic conditions. Circulation Research. 1996;79:1100–1109. doi: 10.1161/01.res.79.6.1100. [DOI] [PubMed] [Google Scholar]
- Yoshida A, Takahashi M, Imagawa T, Shigekawa M, Takisawa H, Nakamura T. Phosphorylation of ryanodine receptors in rat myocytes during β-adrenergic stimulation. Journal of Biochemistry. 1992;111:186–190. doi: 10.1093/oxfordjournals.jbchem.a123735. [DOI] [PubMed] [Google Scholar]
- Zahradníková A, Palade P. Procaine effects on single sarcoplasmic reticulum Ca2+ release channels. Biophysical Journal. 1993;64:991–1003. doi: 10.1016/S0006-3495(93)81465-6. [DOI] [PMC free article] [PubMed] [Google Scholar]