

Abstract
P2X2 channels are activated by extracellular ATP. Despite being commonly described as non-desensitizing, P2X2 receptors do desensitize or inactivate. In the unspliced, 472 amino acid isoform of the P2X2 receptor, inactivation required membrane disruption and the presence of extracellular Ca2+.
The ability to inactivate whole-cell currents developed slowly after breaking in. In contrast, currents from excised patches exhibited rapid (∼100 ms) inactivation with a dependence on extracellular Ca2+, ATP and voltage.
The inactivation rate increased with the fourth power of [Ca2+] suggesting that the functional channel may be a tetramer. Ca2+ had both a higher affinity and a larger Hill coefficient for inactivation than Mg2+, Ba2+ or Mn2+. Trivalent cations at concentrations up to the solubility product of ATP had no effect. The change in apparent co-operativity with ionic species suggests the presence of experimentally unresolved ligand-insensitive kinetic steps.
Based on the weak voltage dependence of inactivation and the lack of effect of intracellular Ca2+ buffers, the Ca2+-binding sites are probably located near the extracellular surface of the membrane.
The recovery from inactivation was slow, with a time constant of ∼7 min.
Ca2+-sensitive inactivation only appeared when the membrane was disrupted in some manner. Treatment with actin and microtubule reagents did not induce inactivation, suggesting that an intact cytoskeleton is not necessary.
Inactivation rates observed in different patch configurations suggest that the induction of Ca2+-dependent inactivation was due to the loss of a diffusible cofactor located in the membrane or the cytoplasm.
The first two P2X receptors, P2X1 and P2X2, were cloned from rat vas deferens and phaeochromocytoma (PC12) cells in 1994 (Valera et al. 1994; Brake et al. 1994). Seven members of the family have been cloned since then (Bo et al. 1995; Chen et al. 1995; Lewis et al. 1995; Seguela et al. 1996; Collo et al. 1996; Soto et al. 1996; Surprenant et al. 1996; Rassendren et al. 1997). Each member in the P2 receptor family encodes a ligand-gated non-selective cation channel that can be activated by extracellular ATP or its analogues. P2 family receptors have a distinctive motif for ligand-gated ion channels, with subunits containing two hydrophobic transmembrane domains (M1 and M2) with a large intervening hydrophilic extracellular loop, structurally different from nicotinic acetylcholine receptors and glutamate receptors (Brake et al. 1994). P2X receptors can be expressed functionally in heterologous cells such as Xenopus oocytes and human embryonic kidney (HEK 293) cells.
P2X receptors are permeable to monovalent cations such as Na+ and K+ as well as divalent cations such as Ca2+. The permeation of Ca2+ is of particular interest because of its role as an intracellular second messenger (Benham, 1990). The Ca2+ permeability of these channels has been measured by single channel recording, reversal potentials of whole-cell currents and changes in intracellular [Ca2+] (Benham et al. 1991; Rogers & Dani, 1995; Evans et al. 1996; Virginio et al. 1998). Although Ca2+ itself is permeant, extracellular Ca2+ reduces the single channel current carried by Na+. The sensitivity of single channel currents to Ca2+ was studied in different cell types (Nakazawa & Hess, 1993; Krishtal et al. 1988; Ding & Sachs, 1999b).
Here we report a different role of Ca2+ in modulating P2X2 channels. In the presence of millimolar concentrations of extracellular Ca2+, whole-cell currents and patch currents declined with time. Using the same intra- and extracellular solutions, currents from outside-out patches inactivated much faster than whole-cell currents. Because the rate of current decline was strongly dependent on the concentration of both ATP and Ca2+, we generally refer to this process as inactivation. Inactivation follows activation and thus involves liganded states and alternatively can be called desensitization. (We prefer the term inactivation since, as discussed below, the process involves cofactors.) Inactivation was caused by a concerted conformational change of the channel dependent on extracellular Ca2+ rather than by a diffusional block of the open channel by Ca2+. We observed similar phenomena with Mg2+, Ba2+ and Mn2+, but the Ca2+-induced inactivation exhibited higher affinity and co-operativity. The high order of co-operativity for Ca2+ (a Hill coefficient of 4) suggests that the channel has at least four Ca2+-binding sites while the kinetics of desensitization can be modelled with a simple state model involving Ca2+ binding to liganded channels and a concerted closure.
Based on studies of inactivation in different patch configurations, the development of Ca2+-dependent inactivation appears to involve a diffusional loss of a modulator or cofactor that normally protects the channel. While desensitization of P2X2 receptors has been previously reported in whole-cell mode, these studies were done with different isoforms having different lengths of the C terminus (Brandle et al. 1997; Koshimizu et al. 1998), but this process was not dependent on extracellular Ca2+.
METHODS
Electrophysiological recording
Recordings were performed at room temperature on HEK 293 cells stably transfected with P2X2 receptors (kindly provided by Dr Annmarie Surprenant, Geneva Biomedical Research Institute). For electrophysiological experiments, the HEK 293 cells were cultured at 37°C for 1–2 days after passage. The medium contained: 90 % Dulbecco's modified Eagle's medium (DMEM)/F12, 10 % heat-inactivated fetal calf serum and 300 μg ml−1 geneticin (G418). The medium was adjusted to pH 7.35 with NaOH and sterilized by filtration. To examine the potential role of cytoskeletal components in inactivation, the cells were treated with cytochalasin D, latrunculin B and colchicine.
The currents activated by ATP were measured in the four configurations of standard patch clamp recording (Hamill et al. 1981) using an Axopatch 200B amplifier. Recording pipettes were pulled from borosilicate glass (World Precision Instruments), coated with Sylgard and had resistances of 10–20 MΩ.
The composition of the pipette solution for the whole-cell and outside-out patches was (mM): 145 NaF, 11 EGTA and 10 Hepes, pH 7.4. The bath and control perfusion solutions were the same for all configurations and contained (mM): 145 NaCl, 2 KCl, 1 MgCl2, 1 CaCl2, 11 glucose and 10 Hepes, pH 7.4. ATP was added to the perfusion solution and applied to the outside-out patches by an ALA BPS-4 perfusion system (ALA Scientific Instruments, NY, USA). The concentration of divalent ions and ATP in the perfusion solution was varied while that of all other components was as for the bath solution. For cell-attached and inside-out patches, the pipette solution was as for the bath unless otherwise stated. Latrunculin B, and colchicine were purchased from Calbiotech (La Jolla, CA, USA). Caged ATP (DMNPE-caged ATP) was purchased from Molecular Probes. Other chemicals, including cytochalasin D and ATP (disodium salt), were purchased from Sigma Chemical Co. For some of the cell-attached and inside-out patch experiments, the caged ATP was photoreleased by unfiltered illumination with a 150 W Hg-Xe lamp (Oriel Corporation of America, Stamford, CN, USA) coupled to a 1 mm diameter quartz optical fibre positioned 5 mm from the pipette tip. The energy density at the pipette was ∼50 mW cm−2 as measured by a Laser Power Energy Meter (SensorPhysics, Redwood, CA, USA).
We used a double-pulse protocol to study the recovery from inactivation (Dilger & Liu, 1992). A 5 s pulse of 50 μM ATP plus 1 mM Ca2+ was applied to inactivate the channels. Then, an ATP-free solution was perfused for various time intervals before a second agonist pulse was applied. The ratio of the second ATP current response, I(t), to the first current response, I(0), was calculated and plotted as a function of the time interval. The data were fitted with a single exponential function:
| (1) |
where τr is the recovery time constant.
The data were stored on videotape using a VR-10A digital data recorder (Instrutech Corp., NY, USA). The currents from outside-out patches were filtered at 5 kHz and digitized at 10 kHz. Currents from cell-attached and inside-out patches were filtered at 2 kHz and digitized at 5 kHz, and the whole-cell currents were filtered at 1 kHz and digitized at 2 kHz, using a LabView data acquisition system (National Instruments).
Analysis
An outside-out patch from a stably transfected HEK 293 cell typically contained more than 50 channels, so the currents activated by 50 μM ATP appeared ‘macroscopic’. However, due to inactivation, single channel events were clearly visible at the end of agonist application. The inactivation phase was well fitted by a single exponential function plus an offset:
| (2) |
where τi is the time constant of inactivation, and I(0) and I∞ are the peak and steady-state currents. We defined the inactivation rate as ki= 1/τi. Due to the long recovery time, we did not wait for complete recovery before again testing the system since the rate of inactivation is unaffected by the number of active channels in the patch.
The relationship between ki and voltage was described by a Boltzmann equation:
| (3) |
where δ is the mean fractional electrical distance of the putative sensor, z is the valency of the sensing charge, kB is the Boltzmann constant and T is the absolute temperature. Note that z can refer to intrinsic charges of the protein that move in the field as well as to the valency of the mobile ions. We used MicrocalOrigin (Microcal Software, Inc., Northhampton, MA, USA) and Scientist (MicroMath Scientific Software, Inc.) software packages to simulate and fit current traces. Results are presented as means ±s.d.
RESULTS
Whole-cell currents are blocked and inactivated in the presence of extracellular Ca2+
Figure 1a shows whole-cell currents (WCCs) activated by a 2 s pulse of 50 μM ATP, in the presence of different extracellular Ca2+ concentrations. The experiments were performed shortly after the formation of the whole-cell configuration. Under these conditions, Ca2+ only slightly reduced the WCCs, with a Kd= 3.8 mM (Fig. 1B), and there was no significant inactivation. The result is consistent with the idea that extracellular Ca2+ produces a diffusional block of whole-cell and single channel currents in PC12 cell and cloned P2X2 receptors (Nakazawa & Hess, 1993; Evans et al. 1996; Virginio et al. 1998; Ding & Sachs, 1999a). The peak current recovered almost completely after washout of Ca2+. These experiments used short pulses of ATP applied shortly after forming the whole-cell configuration. However, when ATP was applied for longer periods, the WCCs slowly decreased, until only a small steady-state current was visible (Fig. 2a). This time-dependent decrease was remarkably non-exponential suggesting an intermediate saturating step in the process, but the half-time, t0.5, was 131 ± 47 s (n = 3). Recovery from inactivation was measured by applying short test pulses of ATP (5 s) after washout. The peak current recovered slowly, but the recovered fraction rapidly inactivated with a time constant of 1.7 ± 0.9 s (n = 5; Fig. 2B), much faster than that seen soon after breaking in (Fig. 1a). In the absence of Ca2+, the current not only did not inactivate, but actually increased slightly with recovery time (Fig. 2C). This increase in current was not due to non-selective pore dilatation since the currents inactivated in the presence of Ca2+ (Virginio et al. 1999; cf. Fig. 2B). These results suggest that the gain-of-function Ca2+ sensitivity occurs during intracellular dialysis. Since there was 11 mM EGTA in the pipette, the intracellular solution was basically Ca2+ free. As a check we also tried the faster associating chelator BAPTA at 10 mM and obtained the same results (data not shown). While one could argue for microdomains of Ca2+ accumulation about the cytoplasmic face of the channel, it appears simpler to consider that extracellular, and not intracellular, Ca2+ is required for inactivation. Since inactivation developed slowly with time after forming the whole-cell configuration, it is reasonable to postulate that the loss of a diffusible cofactor(s) is responsible. This is not a generic form of rundown, however, since the peak currents were not decreased and the cell gained the property of Ca2+-dependent inactivation.
Figure 1. WCCs activated by short pulses of ATP shortly after the formation of the whole-cell configuration are reduced but not inactivated by Ca2+.
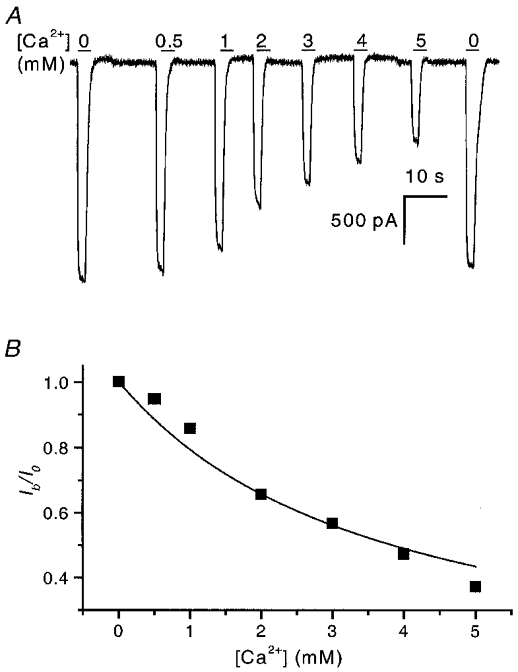
A, WCCs activated by 2 s pulses of 50 μM ATP at −120 mV were reduced in magnitude in the presence of Ca2+. Single channel studies show that the single channel current amplitude is reduced by partial block of open channels by Ca2+ (Nakazawa & Hess, 1993; Ding & Sachs, 1999b). The horizontal bars represent agonist and Ca2+ application, and the numbers above them refer to the concentration of Ca2+ (mM). The blockade almost completely recovered after the removal of Ca2+ (last current trace in figure). B, summary of the effect of Ca2+ on peak currents. The continuous line is a fit to the Woodhull equation (Woodhull, 1973): Ib/Io= 1/(1 +[Ca2+]/Kd), where Ib is the current after block, Io is the current without block, and Kd is the dissociation constant and is equal to 3.8 mM.
Figure 2. WCCs inactivate with extended application of ATP in the presence of Ca2+.
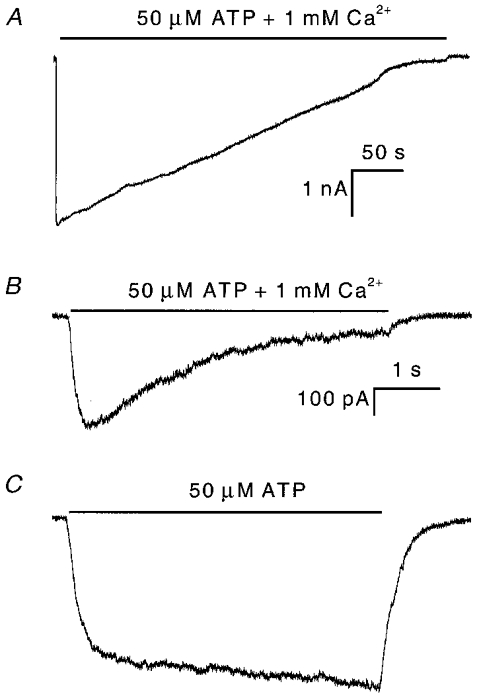
A, WCC recorded immediately after formation of the whole-cell configuration. The current inactivates slowly and reaches a steady-state level with a t0.5 of 131 ± 47 s (n = 3). B, WCC recorded following partial recovery from the inactivation shown in A. The current exhibits fast inactivation in the presence of Ca2+. The decay time constant was ∼1.7 ± 0.9 s (n = 5). C, the WCC does not exhibit inactivation in the absence of Ca2+ under the same conditions as in B. All three current traces were recorded from the same cell. Note, the current trace in C has the same scale bar as shown for B.
Time course of inactivation of outside-out patches by extracellular Ca2+
If a cofactor is lost from the whole-cell configuration, it should be lost quickly from outside-out patches. Figure 3 shows typical currents from outside-out patches activated by 50 μm ATP in the presence (Fig. 3a) and in the absence (Fig. 3B) of 1 mM extracellular Ca2+. The extra- and intracellular solutions were the same as in the whole-cell recordings (Figs 1 and 2). Figure 3a shows the rapid activation of an inward current followed by a slower inactivation. The decay phase was well fitted by a single exponential (dotted line). The steady-state current level of inactivation was less than 1.5 % of the peak current so that single channel currents can be resolved at the end of the record (expanded part of Fig. 3a). The inactivation time constant, τi, was ∼110 ms (n = 5) under these conditions, equivalent to an inactivation rate constant (ki= 1/τi) of ∼9 s−1 (Fig. 5a). The average inactivation rate constant from outside-out currents (OOCs) was about 15 times faster than from WCCs (Fig. 2B).
Figure 3. Typical ATP-activated currents from an outside-out patch in the presence and absence of extracellular Ca2+.
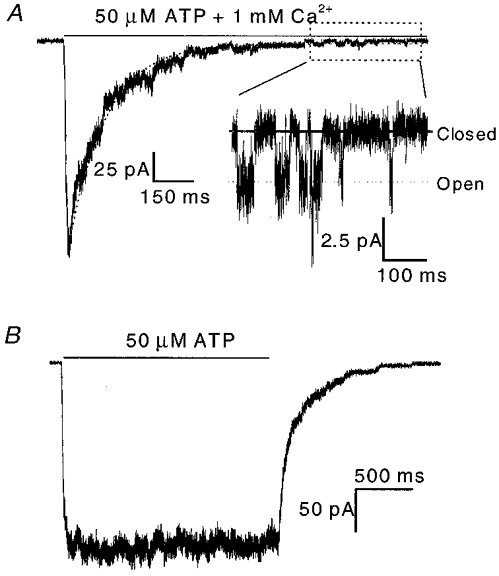
A, the outside-out current (OOC) has a rapid rising phase followed by a slow inactivation phase. Single channel events can be seen at the end of the pulse (expanded part). The superimposed dotted line is a fit to a single exponential function plus a constant. The horizontal bar above the current represents the time of ATP + Ca2+ application. B, OOC showing no inactivation under the same conditions as in A except that extracellular Ca2+ was omitted. Currents were recorded at −120 mV.
Figure 5. Dependence of the inactivation rate constant of OOCs on the concentration of Ca2+ (A), Mg2+ (B), Ba2+ (C) and Mn2+ (D).
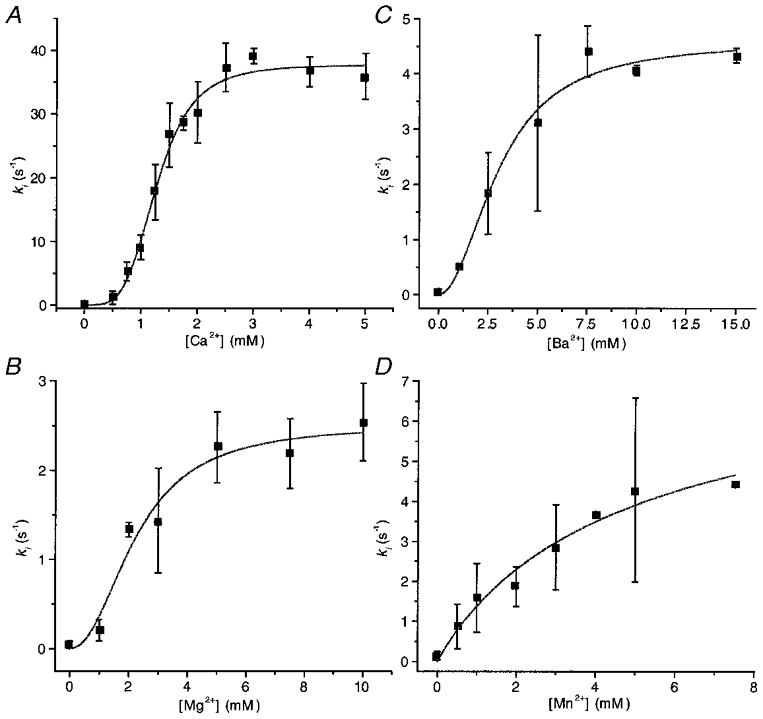
Each point is the mean of the parameters obtained from fitting exponentials to data obtained from three to five patches. The continuous lines are fits to the Hill equation, ki=ki,max/(1 + (EC50/[M2+])nH), where [M2+] represents the divalent ion concentration. The fitted parameter values are summarized in Table 1.
If Ca2+ can cause inactivation through unliganded closed states, then we should not expect to elicit currents when patches are exposed to Ca2+ prior to the application of ATP. However, we obtained the same activation with or without prior Ca2+ treatment, indicating that inactivation is driven by the occupancy of liganded channels – classic desensitization. We cannot yet tell whether the liganded states leading to desensitized states are open or closed.
The effect of divalent ion concentration on inactivation
Figure 4a shows multiple-channel OOCs at different concentrations of extracellular Ca2+ activated by a 2 s pulse of 50 μM ATP at −120 mV. The rate of activation was independent of Ca2+, but the rate of inactivation was strongly Ca2+ dependent. There was almost no inactivation in the absence of extracellular Ca2+ and no steady-state current in the presence of 2 mM Ca2+. The rapid shutdown of the current upon removal of ATP indicates that Ca2+ does not significantly affect the dissociation of ATP from active channels.
Figure 4. Outside-out patch currents inactivate in the presence of different concentrations of Ca2+ (A), Mg2+ (B), Ba2+ (C) and Mn2+ (D).
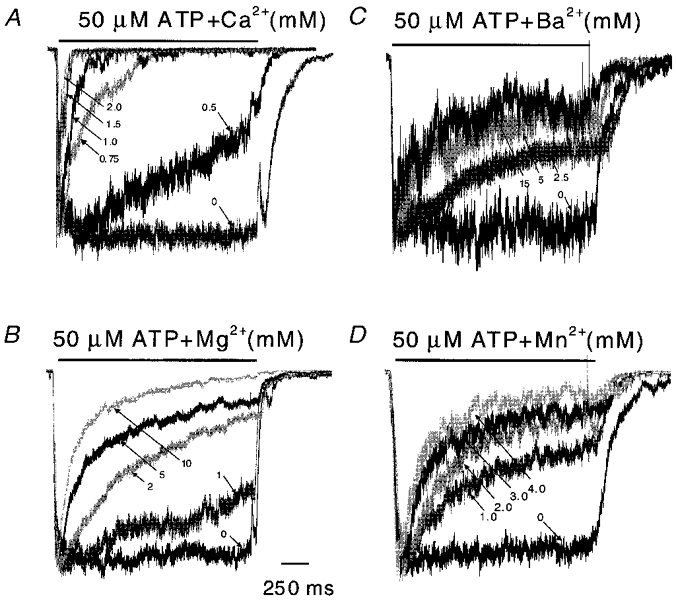
All traces were normalized to their peak currents to compare the time courses of inactivation (2 s pulses of 50 μM ATP at −120 mV). Of the four divalent cations tested, Ca2+ was the most effective for producing inactivation. The rise times may be limited by the perfusion system and may not reliably reflect the intrinsic channel kinetics. Some mixing artifacts can be seen in the off responses. For each trace, the divalent ion concentrations are indicated (mM; arrows). The horizontal bars above the currents represent the duration of ATP + divalent cation application.
Other divalent cations induced slower and less extreme inactivation than Ca2+ (Fig. 4). The inactivation rates are plotted as a function of divalent ion concentration in Fig. 5 along with fits to the Hill equation. The maximum inactivation rate (Table 1) for Ca2+ was 37.6 s−1, which is 15 times larger than for Mg2+, 8 times larger than for Ba2+ and 5 times larger than for Mn2+. The Hill coefficients for Ca2+, Mg2+, Ba2+ and Mn2+ were 4.1, 2.2, 2.0 and 1.0, respectively. These are the minimum numbers of binding sites required by any state model. The difference in the Hill coefficients for the different ions does not mean that they have different numbers of binding sites because the presence of concentration-independent steps in the reaction path can reduce the slope of the plot. The order of the EC50 values was Ca2+ > Mg2+ > Ba2+ > Mn2+, thus Ca2+ is more potent than Mg2+, Ba2+, or Mn2+. These results show that inactivation is not merely dependent on charge and hence cannot be explained by divalent interaction with a diffuse surface charge.
Table 1.
Summary of inactivation by divalent ions
| Ca2+ | Mg2+ | Ba2+ | Mn2+ | |
|---|---|---|---|---|
| Hill coefficient | 4.08 ± 0.50 | 2.25 ± 0.35 | 2.03 ± 0.48 | 0.96 ± 0.33 |
| EC50 (mm) | 1.27 ± 0.04 | 2.20 ± 0.72 | 3.06 ± 0.42 | 5.00 ± 5.61 |
| ki,max (s−1) | 37.61 ± 1.10 | 2.51 ± 0.25 | 4.60 ± 0.36 | 7.82 ± 4.10 |
The effect of ATP concentration on inactivation
To examine the effects of ATP on the inactivation of OOCs, we applied 2–50 μM ATP in the presence of 1 mM Ca2+ (Fig. 6a). The rate of activation increased with increasing ATP concentration. (Note, since we recorded these currents using our relatively slow ALA perfusion system, activation could not be measured accurately although the system was sufficiently fast to permit analysis of the inactivation rates.) Inactivation occurred at all concentrations of ATP, but with faster kinetics at high levels of ATP. As the rate constant of inactivation increased, the ratio of peak to steady-state current decreased. Figure 6B shows ki as a function of ATP concentration. The inactivation rate saturated at ATP concentrations higher than 50 μM as expected from the dose-response relationship for activation by ATP (Ding & Sachs, 1999b). A fit to the Hill equation of inactivation rate as a function of [ATP] yielded a Hill coefficient of 2.8, an EC50 of 18.7 μM and a ki,max of 10 s−1. Therefore, inactivation is co-operative and requires at least three ATP molecules. This result is consistent with our previous studies on the single channel stoichiometry (Ding & Sachs, 1999b).
Figure 6. Dependence of inactivation of OOCs on ATP concentration.
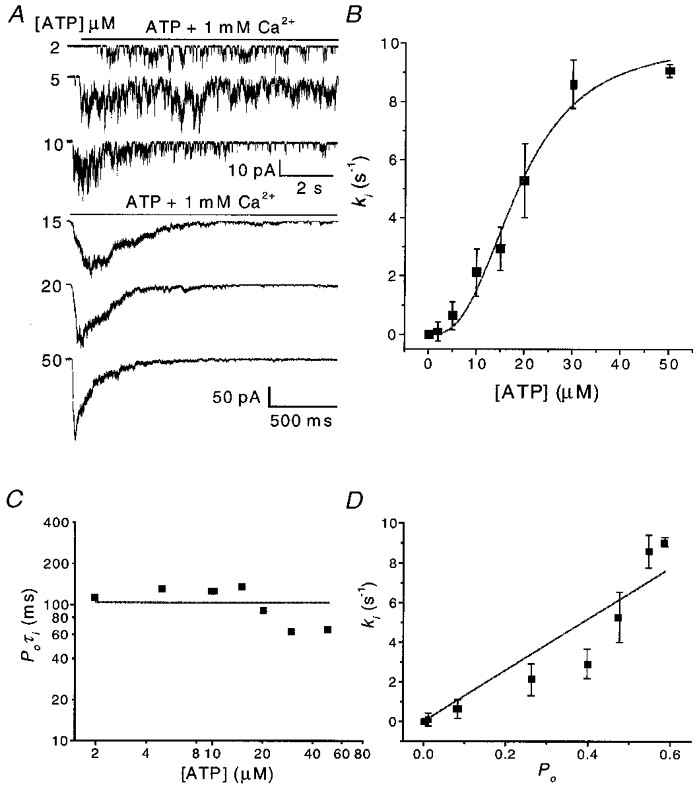
A, OOCs activated by different ATP concentrations in the presence of 1 mM Ca2+. Note that different time and current scales are used for the low and high ATP concentrations. Inactivation was faster and more complete in high ATP. Single channel openings are visible towards the end of agonist application. The rise time of activation became shorter with increasing ATP concentration and the plateau-to-peak ratio decreased. B, the inactivation rate (ki) as a function of ATP concentration. Each data point is the mean from three to five patches. The continuous line is a fit to the Hill equation with a Hill coefficient of 2.8, an EC50 of 18.7 μM and a ki,max of 10.0 s−1. C, the product of the probability of being open (Po) and the inactivation time constant (τi) (i.e. 1/ki) as a function of ATP concentration. The values of Po were taken from single channel data (Ding & Sachs, 1999b). D, ki as a function of Po showing correlation.
Over the concentration range 2–50 μM, ki increased ∼85-fold. However the product of the probability of being open and the inactivation time constant, Poτi, remained relatively constant, with an average value of ∼100 ms (Fig. 6C). This result is consistent with a relatively slow inactivation process leading out of rapidly interconverting liganded states. The values of Po were taken from our single channel current dose-response studies in the absence of Ca2+ (Ding & Sachs, 1999b). Stoichiometry and kinetic studies show that the channel has at least three binding sites (Nicke et al. 1998; Ding & Sachs, 1999b). Figure 6D shows the relationship between ki and Po over the same concentration range. While it is appealing to think that inactivation proceeds from the open state (Dilger & Liu, 1992), the correlation only supports inactivation from liganded states.
The effect of voltage on inactivation
The effect of voltage on inactivation of OOCs was investigated over the range −120 to −20 mV. Because the channel is an inward rectifier, it is difficult to work at more depolarized levels. Figure 7a shows OOCs activated by 50 μM ATP in the presence of 1 mM Ca2+ at different voltages. Hyperpolarization greatly accelerated inactivation and decreased the steady-state current. Figure 7B shows the inactivation rate, ki, and the activation rate, ka, at different voltages. The activation rate (54 s−1) did not change with voltage, consistent with the idea that activation and inactivation are independent. The dependence of ki on voltage was fitted with an Eyring equation, ki=ki(0)exp(ezδV/kBT) (where e is the electronic charge, z is the valency of the sensing group, δ is the fraction of the electrical field felt by the sensing group and kBT is the Boltzmann constant multiplied by the temperature in Kelvin). The fit yielded a slope of ezδ/kBT = 26 mV e−1 and ki(0) = 0.073 s−1. Thus, zδ= 0.96 and since the Hill coefficient of 4 indicates at least four Ca2+-binding sites, the net valency for four equivalent Ca2+ ions would be +8. This places the putative binding site 12 % of the way into the membrane field from the extracellular space with hyperpolarization increasing Ca2+ occupancy. However, it is possible that the field acts on the channel protein rather than on Ca2+. These alternatives could be distinguished by using ions of different valency. We did experiments in the outside-out configuration with 100 μM extracellular Gd3+ and La3+ but unfortunately saw no inactivation (Fig. 8). Higher concentrations of these ions caused the ATP to precipitate. While the voltage dependence would be consistent with an increased Ca2+ flux feeding an intracellular Ca2+-binding site, the low Ca2+ permeability of the channels (Ding & Sachs, 1999a), the equivalence of EGTA and BAPTA as intracellular buffers and the apparent surface electrical location of the sites suggest that the Ca2+ sites are extracellular.
Figure 7. The voltage dependence of inactivation.
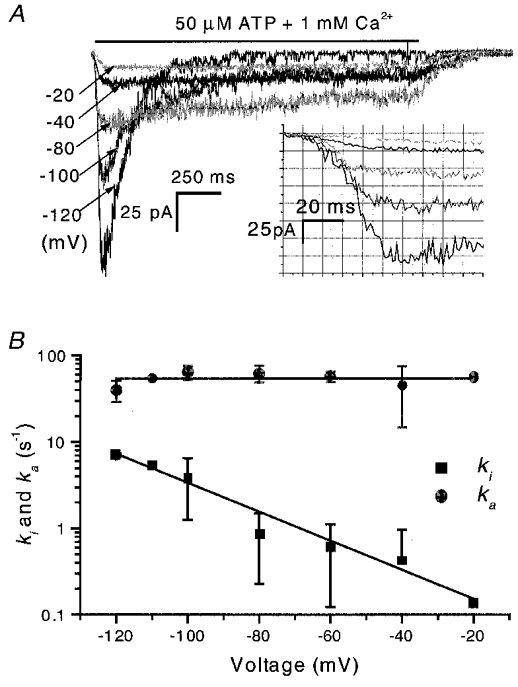
A, OOCs activated by 50 μM ATP in the presence of 1 mM Ca2+ at different membrane potentials. There was a gap of 5 min between test pulses to allow the channels to recover. The inactivation rate increased and the steady-state current decreased with hyperpolarization. The inset shows part of the initial activation process on an expanded scale. Note that the rise times of activation are similar at different potentials. B, the inactivation and activation rate constants as a function of voltage (n = 3). The inactivation rates decreased with depolarization, and fitting with an Eyring equation (eqn (3)) yielded ki= 26 mV e−1, and ki(0) = 0.073 s−1. The activation rate, ka, is voltage independent at 54 s−1. For a first approximation, we fitted the rising phase as shown in the inset of A with a Hodgkin and Huxley model (Hille, 1992): I =I∞(1 – exp(-t/τa))nH. Since the channel is at least a trimer (Nicke et al. 1998; Ding & Sachs, 1999b), we set nH= 3. I∞ is current at steady state and τa is the time constant of the rising phase and is equal to the inverse of the activation rate, i.e. ka= 1/τa. (Note, the experiments were done using the conventional perfusion system (see Methods) so the activation rates may be limited by the rate of solution exchange. However, we have checked the activation rise times with a rapid solution exchange system and found that the time constants were voltage independent.)
Figure 8. OOCs do not inactivate in the presence of extracellular trivalent ions.
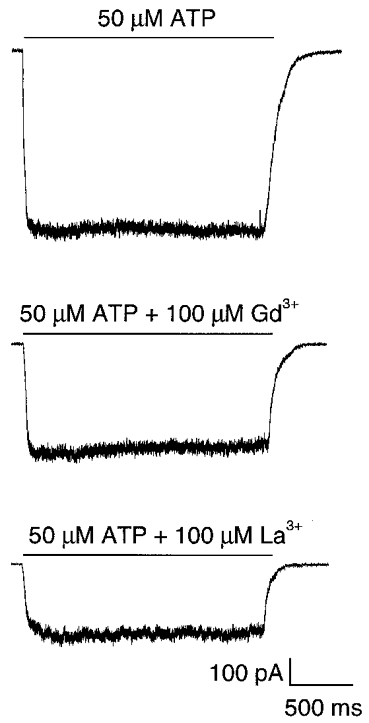
OOCs activated by 50 μM ATP at −120 mV without trivalent ions (upper panel), and in the presence of 100 μM extracellular Gd3+ (middle panel) and La3+ (bottom panel).
The time course of recovery from inactivation
The channels were able to recover from inactivation. Figure 9 shows the results from an experiment to determine the rate of recovery of OOCs from inactivation. A 5 s prepulse of ATP in the presence of Ca2+ inactivated the channels (Fig. 9a). After various time intervals, a test pulse was applied (Fig. 9B). The degree of recovery increased as the interval between pulses lengthened, with full recovery reached in ∼15 min. The recovery time course (Fig. 9C) was fitted to eqn (2) and the regression (continuous line) yielded a recovery time constant of 7.3 min.
Figure 9. The recovery from Ca2+ inactivation.
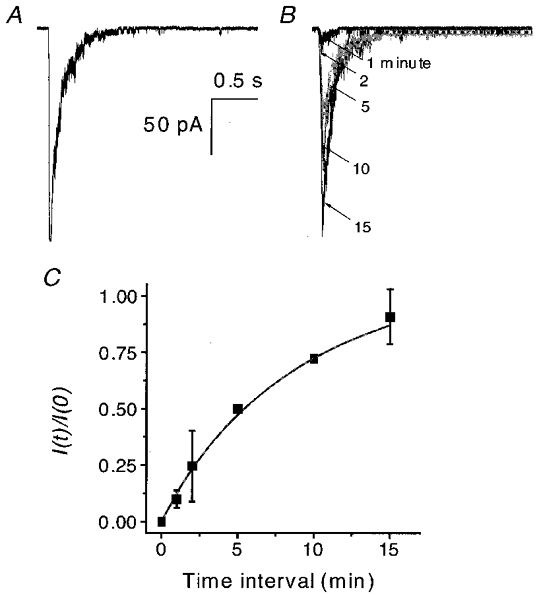
OOCs were recorded using a double-pulse protocol in the presence of 50 μM ATP and 1 mM Ca2+ at −120 mV. A, OOC inactivated by a 5 s prepulse. B, superimposed test OOCs recorded 1, 2, 5, 10 and 15 min after the beginning of the inactivation prepulse. The arrows indicate the time interval of each test pulse (in minutes). C, the time course of recovery from inactivation for the experiments shown in A and B (n = 2). The peak current ratio is plotted as a function of the recovery time interval. The continuous line is a fit of eqn (1) with a recovery time constant, τr, of 7.3 min.
Breakdown of the actin and microtubule cytoskeleton does not induce inactivation of WCCs
The different inactivation behaviour (i.e. different time constants) of WCCs and OOCs in the same solutions suggests that inactivation is not simply due to Ca2+ binding. One possibility is that the loss of a diffusible (aqueous or membrane-bound) cofactor(s) can modify accessibility to Ca2+-binding sites. Another possibility is that disruption of the cytoskeleton modifies the channels during the formation of excised patches. Since actin and tubulin are the main components of the cytoskeleton and are accessible to pharmacological agents, we tested whether their disruption could affect Ca2+ inactivation. Cells were pretreated with cytochalasin D and latrunculin B to disrupt actin microfilaments (Spector et al. 1983; Theodoropoulos et al. 1994) and colchicine to disrupt microtubules (Urbani et al. 1995). Figure 10 shows WCCs from pretreated cells shortly after the formation of the whole-cell configuration. None of the cytoskeletal reagents affected WCCs, either in the absence or in the presence of 1 mM Ca2+. Therefore, actin and tubulin are apparently not involved in the functioning of these channels. We believe that the loss of a diffusible cofactor(s) is the most plausible mechanism for inactivation.
Figure 10. Cytoskeleton-disrupting reagents do not induce inactivation in WCCs.
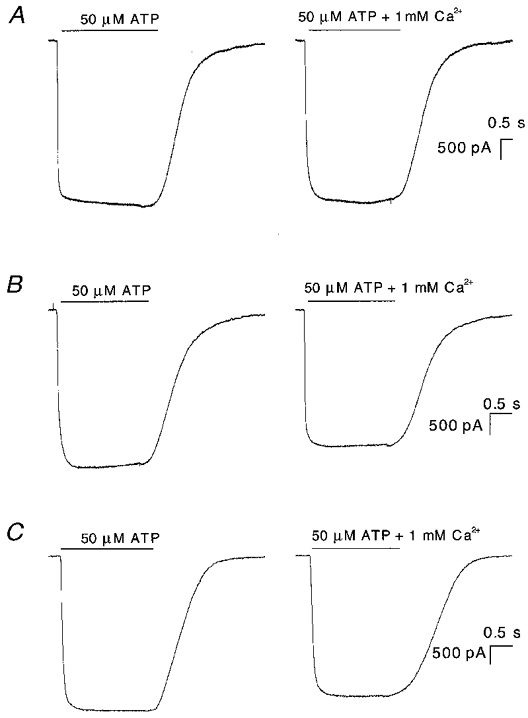
Currents were activated by 50 μM ATP at −120 mV with and without Ca2+. A, the cell was treated with 0.5 μM latrunculin B for 10 min and recorded in the absence (left) and presence (right) of 1 mM Ca2+. B, the cell was treated with 10 μM cytochalasin B for 50 min and recorded in the absence (left) and presence (right) of 1 mM Ca2+. C, the cell was treated with 10 μM colchicine for 2 h and recorded in the absence (left) and presence (right) of 1 mM Ca2+.
Effect of Ca2+ on currents from cell-attached patches
There are two pathways for a diffusible cofactor to leak away from the channels: the cytoplasm and the membrane. In a non-disrupted cell both pools should be maintained and the currents observed in cell-attached patches should not inactivate with Ca2+ present in the pipette. We tested this prediction. For technical reasons we had to change ATP levels in the pipette using 100 μM caged ATP as shown in Fig. 11A. Caged ATP allowed us to establish a baseline prior to the application of ATP (there was low level hydrolysis in the dark). Following UV illumination for 5 s (arrow in Fig. 11a), the channel activity increased. Compared with the currents activated by ATP perfusion (Figs 1 and 3), the caged ATP currents increased slowly, probably limited by the rate of photolysis. There was a slow, Ca2+-independent, decay phase of current following the peak, and significant steady-state activity persisted. The decay time constant to this plateau was 29 ± 18 s (n = 5), ∼250-fold slower than observed in OOCs (see Figs 3A and 5A), and ∼18-fold slower than observed in WCCs (Fig. 2B) under approximately the same conditions. Thus, extracellular Ca2+ does not rapidly inactivate currents from cell-attached patches.
Figure 11. Currents from cell-attached patches with 1 mM Ca2+ in the pipette solution (A), and changes produced by the excision of cell-attached patches in the presence (B) and absence (C) of 1 mM Ca2+ in the pipette solution.
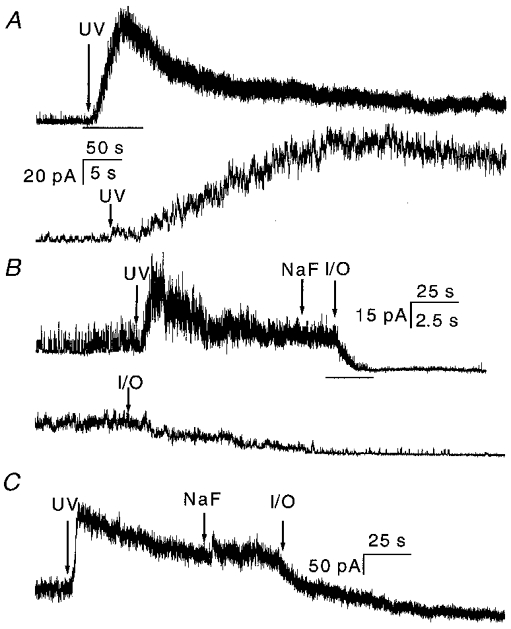
Upward deflections are inward current. The current was activated by 5 s UV illumination of 100 μM caged ATP at a holding potential of +100 mV. A, currents from cell-attached patches with a pipette solution of NaCl containing 1 mM Ca2+, the same composition as the perfusion solution used for the outside-out patch experiments. Note that the time constant of the decay phase was 29 ± 18 s (n = 5), which is 250 times larger than that in outside-out experiments under the same conditions. The bar indicates the expanded region shown below. The time scale is 50 s for the upper trace and 5 s for the lower trace. B, current from a cell-attached patch with 1 mM Ca2+ in the pipette. The pipette solution was changed from normal bath solution to NaF solution without divalent ions (indicated by NaF arrow), so that the solutions on the extracellular and intracellular sides were the same as those used for outside-out patch experiments. The patch was then excised to an inside-out patch (indicated by the I/O arrow). Following the excision, the current dropped rapidly with a time constant of 4.6 ± 1.1 s (n = 4). The bar indicates the expanded region shown below. The time scale is 25 s for the upper trace and 2.5 s for the lower trace. Notice that the single channel amplitude dropped because of the loss of resting potential, but the loss of potential was instantaneous with excision. C, inactivation of current from a cell-attached patch with no Ca2+ in the pipette solution. The experimental procedures were the same as in B. τ= 31 ± 3 s for the cell-attached current before excision. Excision of the patch caused a drop in current with a similar time constant of decay (τ= 34 ± 16 s, n = 3). As in B, a rapid drop in amplitude following excision (visible as a change in amplitude of the noise) was caused by the reduction in driving force due to removal of the resting potential. The data were sampled at 5 kHz and filtered at 2 kHz.
The decay of the peak current is apparently a different form of inactivation/desensitization since similar results were obtained in the absence of Ca2+ as shown in Fig. 11C (τ= 31 ± 3 s, n = 3). We do not think that the presence of the plateau was caused by insufficient release of ATP since continued illumination did not increase channel activity. These results suggest that P2X2 channels in cell-attached patches do not develop Ca2+-sensitive inactivation, supporting the idea of a diffusible cofactor.
The effect of Ca2+ on the inactivation of inside-out patch currents
If the inactivation is due to the loss of a cofactor, extracellular Ca2+ should inactivate the inside-out currents (IOCs). Figure 11B shows currents from a cell-attached patch activated by the release of 100 μM caged ATP in the pipette with normal saline containing 1 mM Ca2+. The current exhibited a slow decay process similar to that seen in Fig. 11A. To make sure that none of the effects we observed with excision could be due to different cytoplasmic solutions, we superfused the cell with NaF saline and then excised the patch forming an inside-out patch with intra- and extracellular solutions identical to those used for whole-cell and outside-out patch experiments. The current did not change when the intact cell was perfused with NaF (marked by an arrow in Fig. 11B). However, upon excision the current rapidly decreased to baseline with a time constant of 4.6 ± 1.1 s (n = 4). Although the time constant of IOCs was larger than that of OOCs under the same conditions, it was much more rapid than in cell-attached patches, and the time course may reflect depletion of the putative cofactor rather than the intrinsic rate of Ca2+-driven inactivation. In the absence of extracellular Ca2+, IOCs decayed slowly after excision (τ= 34 ± 16 s, n = 3, Fig. 11C), so excision itself did not cause the rapid inactivation. Rapid inactivation of IOCs, like that of OOCs, required extracellular Ca2+ (Fig. 12).
Figure 12. Currents from inside-out patches in the presence (A) and in the absence (B) of 1 mM Ca2+ in the pipette solution.
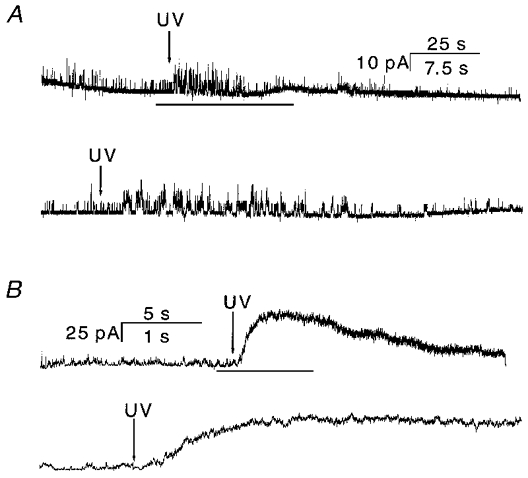
The inward current is upward. The arrows indicate the beginning of UV illumination, which lasted for 5 s. The inside-out patch was perfused with NaF without divalent ions (see Methods). In each case, the bottom panel is an expanded view of the portion of the upper panel indicated by the bar. A, UV illumination increased single channel activity which then inactivated (n = 4). If there were no Ca2+-driven inactivation, there should be a much larger current than seen in cell-attached patches (Fig. 11). This result is also confirmed by the considerably larger IOC observed in the absence of Ca2+ (B). Due to the slow release of caged ATP (see multiple-channel currents in Fig. 11), the current inactivated more slowly than observed during ATP perfusion (e.g. Fig. 3). The time scale is 25 s for the upper trace and 7.5 s for the lower trace. B, IOC activated by release of caged ATP under the same conditions as in A, except that Ca2+ was omitted from the pipette solution. The current amplitude was much larger than in the presence of Ca2+ (see A). The time constant of decay was τ= 13.5 ± 2.8 s (n = 3). The time scale is 5 s for the upper trace and 1 s for the lower trace. The data were sampled at 5 kHz and filtered at 2 kHz at a membrane potential of −100 mV.
We did one other test on the depletion model. Inside-out patches, which should be cofactor depleted, should have little activity in the presence of Ca2+. We made inside-out patches with 1 mM Ca2+ in the pipette, perfused the cytoplasmic face with NaF, and then illuminated the pipette to release the caged ATP (Fig. 12a). The activity did increase slightly with illumination but, based on cell-attached recordings, we should have seen a much larger peak current if there were no desensitization. IOCs recorded in the absence of Ca2+ further strengthened this conclusion. Figure 12B shows IOCs when Ca2+ was omitted from the pipette solution. The current increased dramatically after UV illumination, as it did in cell-attached patches (Fig. 11). This current decayed slowly with a time constant of ∼11.5 ± 2.8 s (n = 4) reminiscent of the Ca2+-independent inactivation seen in cell-attached patches. Thus, recordings of currents in any configuration in which the membrane integrity is breached exhibit Ca2+-dependent inactivation/desensitization.
Kinetics of inactivation
Classically, desensitization represents significant occupancy of liganded closed state(s). For inactivation of P2X2 receptors, besides the agonist, Ca2+ is also involved, making the kinetics more complex. A model for inactivation must account for the fact that inactivation can be fitted well with a single exponential and ki and Po are correlated. Most simply, inactivation proceeds directly from liganded states. The inactivation rate saturated at high Ca2+ concentrations (Fig. 5a), therefore there must exist a rate-limiting process that follows Ca2+ binding, and in the simplest model this is the open-closed transition. If we ignore the recovery rate (0.0023 s−1, Fig. 9C) and assume that inactivation proceeds from the open state, we can model inactivation as shown in Scheme 1:
Scheme 1.
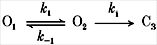
In this model, there is only one time constant of inactivation, consistent with the single exponential decay of the experimental data. O1 is the open state without Ca2+ bound, O2 is the open state with Ca2+ bound, and C3 is the inactivated state. k1 is the Ca2+ association rate, k-1 is the Ca2+ dissociation rate, and ki is the inactivation rate. ki is obtained from the high Ca2+ concentration limit of the decay rate, and is equal to 37.6 s−1 (Table 1). Since the Hill coefficient of Ca2+ inactivation is 4 (see Fig. 5), we had to find a simple way to model this co-operativity. While there are at least four sequential binding steps, for simplicity we assumed that the Ca2+-binding steps were fast, behaving kinetically as a single step, so the association rates can be summarized as:
| (5) |
Scheme 1 is governed by the following differential equations:
| (6) |
| (7) |
| (8) |
| (9) |
where G is the maximal conductance and V is the driving force. These equations were used to fit the decay phase of the current activated by 50 μM ATP in the presence of 1 mM Ca2+ together with ki= 37.6 s−1. The fit converged with k1(0) = 350 s−1 and k-1= 1500 s−1.
In order to determine whether the calculated rate constants could mimic the real currents, we simulated data for different Ca2+ concentrations with eqns (5)–(9) using the values of k1(0) and k-1 obtained from fitting. Figure 13a shows simulated decay currents activated by 50 μM ATP in the presence of different Ca2+ concentrations. The inactivation rate increased with Ca2+ concentration and saturated at high Ca2+ concentrations similar to the experimental data shown in Fig. 4A. We fitted the simulated data in the same way as the experimental data, i.e. with a single exponential plus a constant. The inverse of the time constant was plotted as a function of the Ca2+ concentration (Fig. 13B, □) and the data fitted with the Hill equation (continuous line). We obtained a Hill coefficient of 4.0, a ki,max of 38.0 s−1 and an EC50 for Ca2+ of 1.45 mM. These results were close to the experimental data (Fig. 13B, ^) and their fit to the Hill equation (dotted line in Fig. 13B; also see Table 1), suggesting that this simple model is adequate at the resolution of macroscopic currents.
Figure 13. The predicted time courses of macroscopic currents with different [Ca2+].
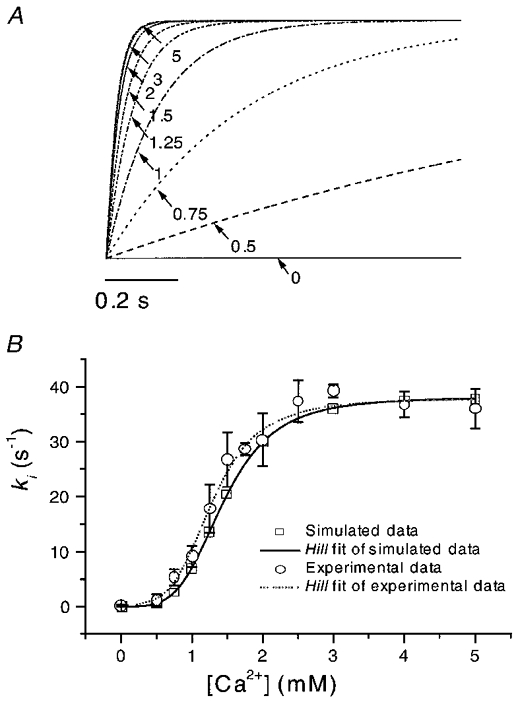
A, the currents were simulated according to Scheme 1 with the inactivation rate constants k1=k1(0)[Ca2+]4= 350[Ca2+]4, k-1= 1500 s−1 derived from fitting of the decay phase of current activated by 50 μM ATP at −120 mV in the presence of 1 mM Ca2+ (see Figs 3A and 4A), and ki= 37.8 s−1. The decay phases overlapped at high Ca2+ concentrations, similar to the saturation observed in the experimental data. The currents have been normalized to the same steady-state values. The numbers and arrows indicate the Ca2+ concentration (mM). Inward current is downward. B, the inactivation rate (□) from the simulated data as a function of Ca2+ concentration and a fit to the Hill equation (continuous line) with a Hill coefficient of 4.0, a ki,max of 38.0 s−1 and an EC50 for Ca2+ of 1.45 mM. The inactivation rates from the experimental data (^) and their Hill fit (dotted line taken from Fig. 5A) are superimposed for comparison. The simulated and experimental results were quite similar (also see Fig. 5A and Table 1).
DISCUSSION
Most ion channels close with prolonged exposure to high concentrations of agonist. This phenomenon is called desensitization and was first recognized and characterized in nicotinic acetylcholine receptors (Katz & Thesleff, 1957). Contrary to reports in the literature, the current from P2X2 receptors declines with time in a Ca2+-dependent manner. To avoid confusion, we have termed this decline ‘inactivation’ instead of desensitization since both ATP and Ca2+ are involved. Inactivation apparently involves priming of the receptor by loss of a diffusible cofactor.
Dependence of inactivation of OOCs on Ca2+ and ATP concentration
A number of studies have been done on the block of P2 receptors by Ca2+ using whole-cell and single channel currents. Extracellular Ca2+ blocks ATP-activated single channel currents in PC12 cells with an affinity of ∼6 mM (Neuhaus et al. 1991; Nakazawa & Hess, 1993). The studies by Virginio et al. (1998) on whole-cell currents of cloned P2X2 receptors show that extracellular Ca2+ inhibits the current with a half-maximal concentration of 5 mM, a value similar to that obtained in the present study (Fig. 1). No report is available on the block of P2X2 channels at the single channel level except our own (Ding & Sachs, 1999a), which showed that Ca2+ blocks Na+ currents through the channel with an affinity of 3.4 mM. The standard short-lived open channel block mechanism reduces the mean single channel amplitude and can be fitted with the Woodhull equation (Woodhull, 1973). The role of Ca2+ in inactivation is different; it decreases the probability of the channel being open.
Our results show that P2X2 inactivation is most probably caused by binding of extracellular divalent ions and the channels can only be inactivated from the liganded state. The extracellular location of the site is based primarily on the lack of effect of intracellular Ca2+ buffers and the low voltage dependence. Extracellular binding site(s) for Ca2+ have been found in other P2X receptors. Cook et al. (1998) showed that the binding of Ca2+ or some polyvalent cations to extracellular sites on P2X3 receptors increased the current more than 10-fold and Ca2+ speeded the recovery of the receptor from desensitization.
For P2X2 channels, the inactivation rate constant (for OOCs) increased with the fourth power of [Ca2+] (Fig. 5a) The reverse rate was very slow so that the steady-state current was small. The binding of Ca2+ was necessary for inactivation, but the binding sites are probably not in the pore since single channel activity was visible in Ca2+-containing media and Ca2+ itself is probably slightly permeant (Benham, 1992). Furthermore, since the Hill coefficient is 4, there are at least four Ca2+-binding sites and it is hard to imagine how to accommodate four Ca2+ ions in a pore. The possibility of multiple binding sites, perhaps one per subunit, is compatible with the Hill coefficient of 2.8 seen for the ATP dose-response curve (Fig. 6B). The Hill coefficient of 4 supports the idea of a tetrameric channel, although we cannot dismiss more complicated models with multiple Ca2+-binding sites per subunit. Kinetic studies of single P2X2 channels showed that they activate in a concerted manner and that ATP binding to the subunits is not independent (Ding & Sachs, 1999b). This co-operative nature of channel activation fits with a co-operative nature of inactivation.
Kim et al. (1997) predicted that the naturally assembled form of the P2X2 receptor may be tetrameric based on folding studies of the P2X2 extracellular domain. Lewis et al. (1995) and Torres et al. (1999) find that P2X2 coexpressed with P2X3, and P2X1 coexpressed with P2X5 can form new heteropolymeric channels, providing additional evidence that P2X receptors are multimers. More recently, Nicke et al. (1998) studied the stoichiometry of P2X1 and P2X3 receptors expressed in Xenopus oocytes using chemical cross-linking methods. Their results indicate that these channels are trimeric rather than tetrameric. Since the results of Nicke et al. (1998) were obtained from cloned P2X receptors expressed in Xenopus oocytes in a membrane environment rather than extracellular domains in aqueous solution, they may be more reliable indicators of the native stoichiometry.
Our data cannot distinguish between such extreme models as each subunit having four Ca2+-binding sites (where full occupancy of one subunit causes channel closure) or each subunit having one binding site (where occupancy of all four subunits is required for closure). Nor can we tell whether partial ligand binding contributes significantly to desensitization. What is clear, however, is that there is a minimum of four binding sites and these are probably in the extracellular domain.
Increasing the ATP concentration increased the inactivation rate in the presence of Ca2+ (Fig. 6), saturating at ∼10 s−1. The Hill equation relative to ATP gave a Hill coefficient of 2.8 and an EC50 of 18.7 μM. The Hill coefficient and EC50 values are similar to the activation kinetics results obtained from whole-cell currents (Brake et al. 1994) and our own single channel dose-response studies (Ding & Sachs, 1999b). The saturation of inactivation with both Ca2+ and ATP implies that channel closing rate becomes rate limiting. We do not know whether open or closed states lead directly to inactivated states, only that the states are liganded. The decay rate is proportional to the probability of occupancy of all the states leading to inactivation (Dilger & Liu, 1992), if those states are rapidly interconverting, i.e. close to equilibrium (Auerbach & Akk, 1998). This interpretation is consistent with our result that Po and ki are strongly correlated.
The Ca2+-binding sites of P2X2 receptors have a low affinity (millimolar) compared to that of many other Ca2+-binding proteins (micromolar) such as the Ca2+-ATPase (Mani & Kay, 1990; Antipenko et al. 1997; Soler et al. 1998), high-affinity Ca2+-binding proteins (Van et al. 1989), and the EF-hand family of Ca2+-modulated proteins (Persechini et al. 1989; Nakayama & Kretsinger, 1994). However, the affinity of the P2X2 Ca2+-binding sites is comparable to those of calsequestrin (Yano & Zarain-Herzberg, 1994).
Our proposed three-state inactivation kinetics model has a strong predictive power for the inactivation process as shown in Figs 13A and B. Based on macroscopic currents, however, it is difficult to construct a complete model that includes ATP binding, channel gating and inactivation.
Ionic selectivity of the Ca2+ inactivation site
Ca2+ was the most potent divalent cation and the trivalent cations proved ineffective at exploitable concentrations. The difference in potency between ions with the same charge indicates that a diffuse surface charge cannot be the ‘binding site’. More curious than differences in affinity are the marked differences in the Hill coefficients (Table 1). If there is one divalent ion site per subunit, and the transition is co-operative, why does Mn2+ have a Hill coefficient of 1, while Ca2+ has a coefficient of 4? The Hill coefficient is a minimal estimate of the number of ligands involved. The apparent co-operativity of a reaction scheme can be suppressed by introducing more concentration-independent steps. The variable Hill coefficients lead us to conclude that inactivation must be more complicated than the reaction of Scheme 1 – more states are needed. If we allow each bound subunit to have two conformations, only one of which leads to inactivation, then there are three states per active subunit: unbound, Ca2+-bound state 1 and Ca2+-bound state 2. For four subunits this would involve 34 states, although some of these are degenerate because of symmetry.
Voltage dependence of OOC inactivation
Inactivation is caused by a conformational change due to the binding of four or more Ca2+ ions to a liganded channel. It is voltage dependent with inactivation rates increasing with hyperpolarization (Fig. 7). Assuming that the field acts on the four Ca2+ ions, which have a combined charge of +8, the electrical distance of the binding sites is about 0.12 from the extracellular surface – nearly outside the membrane and well inside the Debye layer. If the field acts on the ligands, cations of higher valency should have a steeper voltage dependence, but at the limiting concentrations, set by the ATP solubility product, 0.1 mM Gd3+ and La3+ had no effect. Since 0.1 mM Ca2+ does not inactive the channels (Fig. 5), either the trivalent cations have no effect on inactivation or the concentration is too low. In contrast to these results, micromolar concentrations of trivalent cations have been reported to strongly inhibit the steady-state whole-cell currents of native P2X2 channels from PC12 cells and cloned P2X1 and P2X2 channels expressed in Xenopus oocytes (Nakazawa et al. 1997). The trivalent cation effects seemed to consist of an open channel block reducing the mean single channel amplitude. However, these authors observed no time-dependent inactivation in the presence of Ca2+, perhaps because the oocytes are so large that diffusional loss of the putative cofactor was too slow to be observed.
The recovery from inactivation of OOCs
The time constant for recovery from inactivation, ∼7 min (Fig. 9C), is slow compared to that of ACh receptors, which recover in ∼300 ms (Dilger & Liu, 1992), but it is comparable to results from desensitization studies performed on native or cloned purinergic receptors. The recovery time constant for P2X3 receptors expressed in HEK 293 cells was ∼5 min (Cook et al. 1998) and 2 min in muscle cells from the rat vas deferens (Friel, 1988). Similarly, in rabbit ear arterial muscle cells, frog atrial cells, and rat neurons, recovery required a few minutes (Krishtal et al. 1983; Friel & Bean, 1988; Benham et al. 1987).
The recovery process requires a loss of bound Ca2+. It is reasonable that a concerted structural transition involving four or more binding sites would result in a stable state with a slow rate of recovery. Based on the voltage dependence of inactivation, depolarization should accelerate recovery. Unfortunately, because the recovery rate is so slow, it was not possible to test this prediction. It would be interesting to use cysteine scanning to locate the residues that become inaccessible in this transition.
Mechanism of Ca2+-dependent inactivation
The behaviour of channels is known to change under different recording configurations, but explanations for such patching artifacts are rarely known. In whole-cell recordings, Ca2+ influx causes significant rundown of NMDA channels, but in inside-out patches these channels are insensitive to Ca2+, suggesting that a calcium-dependent component is lost in the excised patches. Whole-cell dialysis with an actin stabilizer completely prevented rundown suggesting that an intact cytoskeleton is required for Ca2+-dependent rundown (Rosenmund & Westbrook, 1993). Other studies have shown that the state of actin can modify channel activity. Neuronal NMDA receptors (Johnson & Byerly, 1993, 1994), Na+ channels in renal epithelial cells (Cantiello et al. 1991; Prat et al. 1993), Cl− channels in renal cortical collecting duct cells (Schwiebert et al. 1994), cystic fibrosis transmembrane conductance regulator (CFTR) anion channels (Cantiello, 1996) and K+ channels (Wang et al. 1994; Maguire et al. 1998) are all modified by alterations in f-actin. Recently, Parker (1998) observed that channel activation and desensitization were affected by the disruption and re-assembly of the cytoskeleton. Little is known about the molecular mechanisms linking ion channel activity and the cytoskeleton. Disruption might have direct effects or it could lead to dissociation of bound enzymes and alterations in a host of second messenger pathways.
Johnson & Byerly (1993) reported that ATP and the actin stabilizers taxol and phalloidin significantly reduced inactivation in inside-out patches, and that disruption of both f-actin and microtubules increased rundown. A striking example of the patch configuration changing channel behaviour comes from studies on ATP-dependent K+ (KATP) channels (Shyng & Nichols, 1998; Baukrowitz et al. 1998). In these channels, ATP inhibited the channel activity with an affinity of ∼1 mM in intact cells, but the affinity increased to ∼10 μM in excised patches due to a loss of phosphatidylinositol-4,5-bisphosphate (PIP2).
Ca2+-dependent inactivation of P2X2 receptors is not very sensitive to the state of the cytoskeleton. However, because cytoskeletal components with slow turnover are not affected by the drugs we used, and there are many other cytoskeletal components that remain unaffected (such as intermediate filaments, spectrin and dystrophin), we cannot rule out involvement of the cytoskeleton.
We do not know how Ca2+ produces inactivation in P2X2 channels. The cofactor might normally block the Ca2+-binding site or act via an allosteric process. In NMDA receptors, both intra- and extracellular Ca2+ enhance inactivation (Legendre et al. 1993) by binding to either the channel or a nearby regulatory protein. It has been proposed that Ca2+ entry through ACh receptor channels can activate protein kinase C, leading to channel phosphorylation and desensitization (Huganir & Greengard, 1990). In L-type calcium channels, inactivation by intracellular Ca2+ appears to result from Ca2+-dependent dephosphorylation (Chad et al. 1984; Chad, 1989). Although the kinetic behaviour of Ca2+-dependent inactivation of P2X2 currents is similar to that of these other channels in many respects, it apparently involves different mechanisms.
The role of a diffusible cofactor(s)
Since Ca2+ inactivation develops much more rapidly in excised patches than in whole cells, a diffusible factor(s) is probably involved. By simulation we examined whether the difference in desensitization rates in whole-cell recordings (∼5 min, Fig. 2a) and following excision (∼4 s, Fig. 11B) could be explained by diffusion of a cofactor. One possibility is that the modulator is water soluble and exists in the cytoplasm. We did finite element modelling of this diffusion problem (PDEase, MACSYMA Inc., Arlington, MA, USA) using a 20 μm diameter cell and a conical pipette 1 mm in diameter tapering to a 2 μm diameter tip over a distance of 5 mm. For a diffusion constant of 10−5 cm2 s−1, the cytoplasmic concentration would fall ∼10-fold in 200 s, or about 3 min. This roughly matches the data if we make the (totally arbitrary) assumption that a 10-fold reduction in cofactor concentration will make most of the channels sensitive to Ca2+. Similar modelling of an inside-out patch located 10 μm back from the pipette tip predicts that following excision at t = 0, the concentration of cofactor would fall 10-fold in ∼200 ms. With the same arbitrary assumption that 10 times cofactor depletion makes the channels Ca2+ sensitive, this is about 10-fold too fast. For both geometries, the decay rate scales proportionally to the diffusion constant. Regardless of the affinity of the channel for the cofactor or the diffusion constant, we can compare the predicted depletion rates for the whole-cell configuration and inside-out configuration. The calculated ratio of the whole-cell depletion rate to the excised-patch depletion rate (1:100) is quite different from the experimentally observed value of 1:10.
If the cofactor were membrane bound we get different diffusion geometry. We assumed that the cofactor sticks to the pipette or leaks from the edges of excised patches. We simulated this situation for patches and for whole cells using a typical small molecule membrane diffusion constant of 10−7 cm2 s−1 and treating the wall of the pipette as a sink. In this case, following break-in, the mean concentration of the cofactor in the whole-cell configuration fell ∼10-fold in 130 s (after an initial non-exponential relaxation). For a 2 μm diameter patch, the time to fall 10-fold was 0.3 s, much faster than that observed experimentally. The ratio of whole-cell depletion rate to patch depletion rate was about 1:500, in the same range calculated for volume diffusion. Thus it appears that this simple modelling is unable predict the localization of the modulator. However, neither of these diffusion models explains the striking linear (rather than exponential) decay of current observed in the whole-cell mode (Fig. 2a). A non-linear flux-limiting element would need to be added to the whole-cell models.
The chemical nature of this postulated modulator is not known, but the role of Ca2+ in inactivation is striking. It is interesting that the rate of inactivation of WCCs after partial dialysis was much slower (time constant of ∼1.7 s) than that seen in outside-out patches. This may reflect the redistribution time of the partially depleted cofactor rather than the much more rapid Ca2+-driven desensitization rate seen in outside-out patches.
Acknowledgments
We would like to thank Dr Annmarie Surprenant (Glaxo and University of Sheffield, UK) for providing stably transfected cell lines, Dr R. Horn for advice and Dr Tao Zeng (Department of Physiology and Biophysics, SUNY, Buffalo, NY, USA) for assistance with the LabView programs. This work was supported by the NIH (F.S.).
References
- Antipenko AY, Spielman AI, Kirchberger MA. Comparison of the effects of phospholamban and jasmone on the calcium pump of cardiac sarcoplasmic reticulum. Evidence for modulation by phospholamban of both Ca2+ affinity and Vmax (Ca) of calcium transport. Journal of Biological Chemistry. 1997;272:2852–2860. doi: 10.1074/jbc.272.5.2852. [DOI] [PubMed] [Google Scholar]
- Auerbach A, Akk G. Desensitization of mouse nicotinic acetylcholine receptor channels. A two-gate mechanism. Journal of General Physiology. 1998;112:181–197. doi: 10.1085/jgp.112.2.181. [DOI] [PMC free article] [PubMed] [Google Scholar]
- Baukrowitz T, Schulte U, Oliver D, Herlitze S, Krauter T, Tucker SJ, Ruppersberg JP, Fakler B. PIP2 and PIP as determinants for ATP inhibition of KATP channels. Science. 1998;282:1141–1144. doi: 10.1126/science.282.5391.1141. [DOI] [PubMed] [Google Scholar]
- Benham CD. ATP-gated channels in vascular smooth muscle cells. Annals of the New York Academy of Sciences. 1990;603:275–285. doi: 10.1111/j.1749-6632.1990.tb37679.x. [DOI] [PubMed] [Google Scholar]
- Benham CD. ATP-gated cation channels in vascular smooth muscle cells. Japanese Journal of Pharmacology. 1992;58(suppl. 2):179–184P. [PubMed] [Google Scholar]
- Benham CD, Bolton TB, Byrne NG, Large WA. Action of externally applied adenosine triphosphate on single smooth muscle cells dispersed from rabbit ear artery. The Journal of Physiology. 1987;387:473–488. doi: 10.1113/jphysiol.1987.sp016585. [DOI] [PMC free article] [PubMed] [Google Scholar]
- Benham CD, Bouvier MM, Evans ML. Changes in cytoplasmic calcium induced by purinergic P2X receptor activation in vascular smooth muscle cells and sensory neurons. Advances in Experimental Medicine and Biology. 1991;304:229–239. doi: 10.1007/978-1-4684-6003-2_19. [DOI] [PubMed] [Google Scholar]
- Bo X, Zhang Y, Nassar M, Burnstock G, Schoepfer R. A P2X purinoceptor cDNA conferring a novel pharmacological profile. FEBS Letters. 1995;375:129–133. doi: 10.1016/0014-5793(95)01203-q. [DOI] [PubMed] [Google Scholar]
- Brandle U, Spielmanns P, Osteroth R, Sim J, Surprenant A, Buell G, Ruppersberg JP, Plinkert PK, Zenner HP, Glowatzki E. Desensitization of the P2X(2) receptor controlled by alternative splicing. FEBS Letters. 1997;404:294–298. doi: 10.1016/s0014-5793(97)00128-2. [DOI] [PubMed] [Google Scholar]
- Brake AJ, Wagenbach MJ, Julius D. New structural motif for ligand-gated ion channels defined by an ionotropic ATP receptor. Nature. 1994;371:519–523. doi: 10.1038/371519a0. [DOI] [PubMed] [Google Scholar]
- Cantiello HF. Role of the actin cytoskeleton in the regulation of the cystic fibrosis transmembrane conductance regulator. Experimental Physiology. 1996;81:505–514. doi: 10.1113/expphysiol.1996.sp003953. [DOI] [PubMed] [Google Scholar]
- Cantiello HF, Stow JL, Prat AG, Ausiello DA. Actin filaments regulate epithelial Na+ channel activity. American Journal of Physiology. 1991;261:C882–888. doi: 10.1152/ajpcell.1991.261.5.C882. [DOI] [PubMed] [Google Scholar]
- Chad J. Inactivation of calcium channels. Comparative Biochemistry and Physiology. 1989;A 93:95–105. doi: 10.1016/0300-9629(89)90196-5. [DOI] [PubMed] [Google Scholar]
- Chad J, Eckert R, Ewald D. Kinetics of calcium-dependent inactivation of calcium current in voltage-clamped neurones of Aplysia californica. The Journal of Physiology. 1984;347:279–300. doi: 10.1113/jphysiol.1984.sp015066. [DOI] [PMC free article] [PubMed] [Google Scholar]
- Chen CC, Akopian AN, Sivilotti L, Colquhoun D, Burnstock G, Wood JN. A P2X purinoceptor expressed by a subset of sensory neurons. Nature. 1995;377:428–431. doi: 10.1038/377428a0. [DOI] [PubMed] [Google Scholar]
- Collo G, North RA, Kawashima E, Merlo-Pich E, Neidhart S, Surprenant A, Buell G. Cloning of P2X5 and P2X6 receptors and the distribution and properties of an extended family of ATP-gated ion channels. Journal of Neuroscience. 1996;16:2495–2507. doi: 10.1523/JNEUROSCI.16-08-02495.1996. [DOI] [PMC free article] [PubMed] [Google Scholar]
- Cook SP, Rodland KD, Mccleskey ED. A memory for extracellular Ca2+ by speeding recovery of P2X receptors from desensitization. Journal of Neuroscience. 1998;18:9238–9244. doi: 10.1523/JNEUROSCI.18-22-09238.1998. [DOI] [PMC free article] [PubMed] [Google Scholar]
- Dilger JP, Liu Y. Desensitization of acetylcholine receptors in BC3H-1 cells. Pflügers Archiv. 1992;420:479–485. doi: 10.1007/BF00374622. [DOI] [PubMed] [Google Scholar]
- Ding S, Sachs F. Ion permeation and block of P2X2 purinoceptors: A single channel study. Journal of Membrane Biology. 1999a;172:215–223. doi: 10.1007/s002329900598. [DOI] [PubMed] [Google Scholar]
- Ding S, Sachs F. Single channel properties of P2X2 purinoceptors. Journal of General Physiology. 1999b;113:695–720. doi: 10.1085/jgp.113.5.695. [DOI] [PMC free article] [PubMed] [Google Scholar]
- Evans RJ, Lewis C, Virginio C, Lundstrom K, Buell G, Surprenant A, North RA. Ionic permeability of, and divalent cation effects on, two ATP-gated cation channels (P2X receptors) expressed in mammalian cells. The Journal of Physiology. 1996;497:413–422. doi: 10.1113/jphysiol.1996.sp021777. [DOI] [PMC free article] [PubMed] [Google Scholar]
- Friel DD. An ATP-sensitive conductance in single smooth muscle cells from the rat vas deferens. The Journal of Physiology. 1988;401:361–380. doi: 10.1113/jphysiol.1988.sp017167. [DOI] [PMC free article] [PubMed] [Google Scholar]
- Friel DD, Bean BP. Two ATP-activated conductances in bullfrog atrial cells. Journal of General Physiology. 1988;91:1–27. doi: 10.1085/jgp.91.1.1. [DOI] [PMC free article] [PubMed] [Google Scholar]
- Hamill OP, Marty A, Neher E, Sakmann B, Sigworth FJ. Improved patch-clamp techniques for high-resolution current recording from cells and cell-free membrane patches. Pflügers Archiv. 1981;391:85–100. doi: 10.1007/BF00656997. [DOI] [PubMed] [Google Scholar]
- Hille B. Ionic Channels of Excitable Membranes. 2. Sunderland, MA, USA: Sinauer Associates Inc.; 1992. [Google Scholar]
- Huganir RL, Greengard P. Regulation of neurotransmitter receptor desensitization by protein phosphorylation. Neuron. 1990;5:555–567. doi: 10.1016/0896-6273(90)90211-w. [DOI] [PubMed] [Google Scholar]
- Johnson BD, Byerly L. A cytoskeletal mechanism for Ca2+ channel metabolic dependence and inactivation by intracellular Ca2+ Neuron. 1993;10:797–804. doi: 10.1016/0896-6273(93)90196-x. [DOI] [PubMed] [Google Scholar]
- Johnson BD, Byerly L. Ca2+ channel Ca(2+)-dependent inactivation in a mammalian central neuron involves the cytoskeleton. Pflügers Archiv. 1994;429:14–21. doi: 10.1007/BF02584025. [DOI] [PubMed] [Google Scholar]
- Katz B, Thesleff S. A study of the ‘desensitization’ produced by acetylcholine at the motor end-plate. The Journal of Physiology. 1957;138:63–80. doi: 10.1113/jphysiol.1957.sp005838. [DOI] [PMC free article] [PubMed] [Google Scholar]
- Kim M, Yoo OJ, Choe S. Molecular assembly of the extracellular domain of P2X2, an ATP-gated ion channel. Biochemical and Biophysical Research Communications. 1997;240:618–622. doi: 10.1006/bbrc.1997.7713. [DOI] [PubMed] [Google Scholar]
- Koshimizu T, Tomic M, Koshimizu M, Stojilkovic SS. Identification of amino acid residues contributing to desensitization of the P2X2 receptor channel. Journal of Biological Chemistry. 1998;273:12853–12857. doi: 10.1074/jbc.273.21.12853. [DOI] [PubMed] [Google Scholar]
- Krishtal OA, Marchenko SM, Obukhov AG. Cationic channels activated by extracellular ATP in rat sensory neurons. Neuroscience. 1988;27:995–1000. doi: 10.1016/0306-4522(88)90203-5. [DOI] [PubMed] [Google Scholar]
- Krishtal OA, Marchenko SM, Pidoplichko VI. Receptor for ATP in the membrane of mammalian sensory neurons. Neuroscience Letters. 1983;35:41–45. doi: 10.1016/0304-3940(83)90524-4. [DOI] [PubMed] [Google Scholar]
- Legendre P, Rosenmund C, Westbrook GL. Inactivation of NMDA channels in cultured hippocampal neurons by intracellular calcium. Journal of Neuroscience. 1993;13:674–684. doi: 10.1523/JNEUROSCI.13-02-00674.1993. [DOI] [PMC free article] [PubMed] [Google Scholar]
- Lewis C, Neidhart S, Holy C, North RA, Buell G, Surprenant A. Coexpression of P2X2 and P2X3 receptor subunits can account for ATP-gated currents in sensory neurons. Nature. 1995;377:432–435. doi: 10.1038/377432a0. [DOI] [PubMed] [Google Scholar]
- Maguire G, Connaughton V, Prat AG, Jackson GR, Jr, Cantiello HF. Actin cytoskeleton regulates ion channel activity in retinal neurons. NeuroReport. 1998;9:665–670. doi: 10.1097/00001756-199803090-00019. [DOI] [PubMed] [Google Scholar]
- Mani RS, Kay CM. Isolation and characterization of a novel molecular weight 11,000 Ca2+-binding protein from smooth muscle. Biochemistry. 1990;29:1398–1404. doi: 10.1021/bi00458a009. [DOI] [PubMed] [Google Scholar]
- Nakayama S, Kretsinger RH. Evolution of the EF-hand family of proteins. Annual Review of Biophysics and Biomolecular Structure. 1994;23:473–507. doi: 10.1146/annurev.bb.23.060194.002353. [DOI] [PubMed] [Google Scholar]
- Nakazawa K, Hess P. Block by calcium of ATP-activated channels in pheochromocytoma cells. Journal of General Physiology. 1993;101:377–392. doi: 10.1085/jgp.101.3.377. [DOI] [PMC free article] [PubMed] [Google Scholar]
- Nakazawa K, Liu M, Inoue K, Ohno Y. Potent inhibition by trivalent cations of ATP-gated channels. European Journal of Pharmacology. 1997;325:237–243. doi: 10.1016/s0014-2999(97)00120-9. [DOI] [PubMed] [Google Scholar]
- Neuhaus R, Reber FX, Reuter H. Regulation of bradykinin- and ATP-activated Ca2+-permeable channels in rat pheochromocytoma (PC12) cells. Journal of Neuroscience. 1991;11:3984–3990. doi: 10.1523/JNEUROSCI.11-12-03984.1991. [DOI] [PMC free article] [PubMed] [Google Scholar]
- Nicke A, Baumert HG, Rettinger J, Eichele A, Lambrecht G, Mutschler E, Schmalzing G. P2X1 and P2X3 receptors form stable trimers: a novel structural motif of ligand-gated ion channels. EMBO Journal. 1998;17:3016–3028. doi: 10.1093/emboj/17.11.3016. [DOI] [PMC free article] [PubMed] [Google Scholar]
- Parker KE. Modulation of ATP-gated non-selective cation channel (P2X1 receptor) activation and desensitization by the actin cytoskeleton. The Journal of Physiology. 1998;510:19–25. doi: 10.1111/j.1469-7793.1998.019bz.x. [DOI] [PMC free article] [PubMed] [Google Scholar]
- Persechini A, Moncrief ND, Kretsinger RH. The EF-hand family of calcium-modulated proteins. Trends in Neurosciences. 1989;12:462–467. doi: 10.1016/0166-2236(89)90097-0. [DOI] [PubMed] [Google Scholar]
- Prat AG, Bertorello AM, Ausiello DA, Cantiello HF. Activation of epithelial Na+ channels by protein kinase A requires actin filaments. American Journal of Physiology. 1993;265:C224–233. doi: 10.1152/ajpcell.1993.265.1.C224. [DOI] [PubMed] [Google Scholar]
- Rassendren F, Buell GN, Virginio C, Collo G, North RA, Surprenant A. The permeabilizing ATP receptor, P2X7. Cloning and expression of a human cDNA. Journal of Biological Chemistry. 1997;272:5482–5486. doi: 10.1074/jbc.272.9.5482. [DOI] [PubMed] [Google Scholar]
- Rogers M, Dani JA. Comparison of quantitative calcium flux through NMDA, ATP, and ACh receptor channels. Biophysical Journal. 1995;68:501–506. doi: 10.1016/S0006-3495(95)80211-0. [DOI] [PMC free article] [PubMed] [Google Scholar]
- Rosenmund C, Westbrook GL. Calcium-induced actin depolymerization reduces NMDA channel activity. Neuron. 1993;10:805–814. doi: 10.1016/0896-6273(93)90197-y. [DOI] [PubMed] [Google Scholar]
- Schwiebert EM, Mills JW, Stanton BA. Actin-based cytoskeleton regulates a chloride channel and cell volume in a renal cortical collecting duct cell line. Journal of Biological Chemistry. 1994;269:7081–7089. [PubMed] [Google Scholar]
- Seguela P, Haghighi A, Soghomonian JJ, Cooper E. A novel neuronal P2X ATP receptor ion channel with widespread distribution in the brain. Journal of Neuroscience. 1996;16:448–455. doi: 10.1523/JNEUROSCI.16-02-00448.1996. [DOI] [PMC free article] [PubMed] [Google Scholar]
- Shyng SL, Nichols CG. Membrane phospholipid control of nucleotide sensitivity of KATP channels. Science. 1998;282:1138–1141. doi: 10.1126/science.282.5391.1138. [DOI] [PubMed] [Google Scholar]
- Soler F, Plenge-Tellechea F, Fortea I, Fernandez-Belda F. Cyclopiazonic acid effect on Ca2+-dependent conformational states of the sarcoplasmic reticulum ATPase. Implication for the enzyme turnover. Biochemistry. 1998;37:4266–4274. doi: 10.1021/bi971455c. [DOI] [PubMed] [Google Scholar]
- Soto F, Garcia-Guzman M, Gomez-Hernandez JM, Hollmann M, Karschin C, Stuhmer W. P2X4: an ATP-activated ionotropic receptor cloned from rat brain. Proceedings of the National Academy of Sciences of the USA. 1996;93:3684–3688. doi: 10.1073/pnas.93.8.3684. [DOI] [PMC free article] [PubMed] [Google Scholar]
- Spector I, Shochet NR, Kashman Y, Groweiss A. Latrunculins: novel marine toxins that disrupt microfilament organization in cultured cells. Science. 1983;219:493–495. doi: 10.1126/science.6681676. [DOI] [PubMed] [Google Scholar]
- Surprenant A, Rassendren F, Kawashima E, North RA, Buell GN. The cytolytic P2Z receptor for extracellular ATP identified as a P2X receptor (P2X7) Science. 1996;272:735–738. doi: 10.1126/science.272.5262.735. [DOI] [PubMed] [Google Scholar]
- Theodoropoulos PA, Gravanis A, Tsapara A, Margioris AN, Papadogiorgaki E, Galanopoulos V, Stournaras C. Cytochalasin B may shorten actin filaments by a mechanism independent of barbed end capping. Biochemical Pharmacology. 1994;47:1875–1881. doi: 10.1016/0006-2952(94)90318-2. [DOI] [PubMed] [Google Scholar]
- Torres GE, Egan TM, Voigt MM. Hetero-oligomeric assembly of P2X receptor subunits. Specificities exist with regard to possible partners. Journal of Biological Chemistry. 1999;274:6653–6659. doi: 10.1074/jbc.274.10.6653. [DOI] [PubMed] [Google Scholar]
- Urbani L, Sherwood SW, Schimke RT. Dissociation of nuclear and cytoplasmic cell cycle progression by drugs employed in cell synchronization. Experimental Cell Research. 1995;219:159–168. doi: 10.1006/excr.1995.1216. [DOI] [PubMed] [Google Scholar]
- Valera S, Hussy N, Evans RJ, Adami N, North RA, Surprenant A, Buell G. A new class of ligand-gated ion channel defined by P2X receptor for extracellular ATP. Nature. 1994;371:516–519. doi: 10.1038/371516a0. [DOI] [PubMed] [Google Scholar]
- Van PN, Peter F, Soling HD. Four intracisternal calcium-binding glycoproteins from rat liver microsomes with high affinity for calcium. No indication for calsequestrin-like proteins in inositol 1,4,5-trisphosphate-sensitive calcium sequestering rat liver vesicles. Journal of Biological Chemistry. 1989;264:17494–17501. [PubMed] [Google Scholar]
- Virginio C, Surprenant A, North RA. Calcium permeability and block at homomeric and heteromeric P2X2 and P2X3 receptors, and P2X receptors in rat nodose neurones. The Journal of Physiology. 1998;510:27–35. doi: 10.1111/j.1469-7793.1998.027bz.x. [DOI] [PMC free article] [PubMed] [Google Scholar]
- Virginio C, Mackenzie A, Rassendren FA, North RA, Surprenant A. Pore dilation of neuronal P2X receptor channels. Nature Neuroscience. 1999;2:315–321. doi: 10.1038/7225. [DOI] [PubMed] [Google Scholar]
- Wang WH, Cassola A, Giebisch G. Involvement of actin cytoskeleton in modulation of apical K channel activity in rat collecting duct. American Journal of Physiology. 1994;267:F592–598. doi: 10.1152/ajprenal.1994.267.4.F592. [DOI] [PubMed] [Google Scholar]
- Woodhull AM. Ionic blockage of sodium channels in nerve. Journal of General Physiology. 1973;61:687–708. doi: 10.1085/jgp.61.6.687. [DOI] [PMC free article] [PubMed] [Google Scholar]
- Yano K, Zarain-Herzberg A. Sarcoplasmic reticulum calsequestrins: structural and functional properties. Molecular and Cellular Biochemistry. 1994;135:61–70. doi: 10.1007/BF00925961. [DOI] [PubMed] [Google Scholar]