

Abstract
The Ca2+-sensitive fluorescent indicator rhod-2 was used to monitor mitochondrial Ca2+ concentration ([Ca2+]m) in gastric smooth muscle cells from Bufo marinus. In some studies, fura-2 was used in combination with rhod-2, allowing simultaneous measurement of cytoplasmic Ca2+ concentration ([Ca2+]i) and [Ca2+]m, respectively.
During a short train of depolarizations, which causes Ca2+ influx from the extracellular medium, there was an increase in both [Ca2+]i and [Ca2+]m. The half-time (t½) to peak for the increase in [Ca2+]m was considerably longer than the t½ to peak for the increase in [Ca2+]i. [Ca2+]m remained elevated for tens of seconds after [Ca2+]i had returned to its resting value.
Stimulation with caffeine, which causes release of Ca2+ from the sarcoplasmic reticulum (SR), also produced increases in both [Ca2+]i and [Ca2+]m. The values of t½ to peak for the increase in [Ca2+] in both cytoplasm and mitochondria were similar; however, [Ca2+]i returned to baseline values much faster than [Ca2+]m.
Using a wide-field digital imaging microscope, changes in [Ca2+]m were monitored within individual mitochondria in situ, during stimulation of Ca2+ influx or Ca2+ release from the SR.
Mitochondrial Ca2+ uptake during depolarizing stimulation caused depolarization of the mitochondrial membrane potential. The mitochondrial membrane potential recovered considerably faster than the recovery of [Ca2+]m.
This study shows that Ca2+ influx from the extracellular medium and Ca2+ release from the SR are capable of increasing [Ca2+]m in smooth muscle cells. The efflux of Ca2+ from the mitochondria is a slow process and appears to be dependent upon the amount of Ca2+ in the SR.
Application of a contractile stimulus to smooth muscle produces an elevation in the free cytoplasmic Ca2+ concentration ([Ca2+]i), which subsequently leads to activation of the contractile machinery (Kamm & Stull, 1985). Depending upon the nature of the contractile stimulus, the increase in [Ca2+]i may reflect influx of Ca2+ from the extracellular medium, and/or release of Ca2+ from the sarcoplasmic reticulum (SR). Influx of Ca2+ from the extracellular medium can occur through voltage-operated or receptor-operated Ca2+ channels in the plasma membrane (Benham & Tsien, 1987; Hess, 1990). Ca2+ may be released from the SR through the inositol 1,4,5-trisphosphate (InsP3) receptor (Somlyo et al. 1985; Berridge, 1993) and/or the ryanodine receptor (Fabiato, 1989). While much attention has been given to the processes controlling Ca2+ entry into the cytoplasm, less is known about the processes which are responsible for restoring [Ca2+]i to its resting level, thereby bringing about relaxation. As is the case for most other cells, several processes are thought to be involved in the removal of Ca2+ from the cytoplasm of smooth muscle cells. These are: the ATP-dependent Ca2+ pumps in the SR and plasma membrane (Missiaen et al. 1991); the plasma membrane Na+-Ca2+ exchanger (McCarron et al. 1994); and the mitochondria (Drummond & Fay, 1996; McGeown et al. 1996).
The role of mitochondria in regulating [Ca2+]i in smooth muscle cells remains an unsettled issue. While there are several studies indicating mitochondrial Ca2+ uptake during stimulation with high K+ in smooth muscle (Karaki & Weiss 1981), there are others reporting no change in the level of mitochondrial Ca2+ during depolarization (Somlyo et al. 1979). We have previously shown that under conditions where mitochondrial Ca2+ uptake is impaired, by carbonyl cyanide p-(trifluoromethoxy)phenylhydrazone (FCCP) or cyanide, the rates of Ca2+ removal from the cytoplasm following depolarizing voltage steps were significantly reduced during tight-seal, whole-cell recording (Drummond & Fay, 1996). This effect did not appear to be due to ATP insufficiency, since ATP was included in the patch pipette, and similar reduction of cytoplasmic Ca2+ removal was observed when Ruthenium Red was used to block the mitochondrial Ca2+ uniporter. Further indirect evidence that mitochondria are involved in Ca2+ homeostasis in smooth muscle cells has been provided by studies where the decay time constant of a Ca2+-dependent Cl− current was found to be prolonged under conditions where mitochondrial Ca2+ uptake was inhibited (Greenwood et al. 1997). More recently, direct demonstration of mitochondrial Ca2+ uptake in smooth muscle was provided by two studies, where mitochondrial [Ca2+] ([Ca2+]m) was monitored with the Ca2+ sensitive fluorescent indicator rhod-2 (Drummond & Tuft, 1999; McCarron & Muir, 1999). These studies revealed that release of Ca2+ from the SR (Drummond & Tuft, 1999), or influx from the extracellular medium through voltage-sensitive Ca2+ channels (McCarron & Muir, 1999), resulted in an increase in [Ca2+]m. Increases in [Ca2+]m were also detected using rhod-2 during agonist stimulation of cultured smooth muscle cells (Monteith & Blaustein, 1999).
The objective of the present study was to employ recently developed methodology for monitoring [Ca2+]m, to substantiate and advance our previous pharmacological studies on the involvement of mitochondrial Ca2+ uptake during depolarizing stimulation of smooth muscle cells (Drummond & Fay, 1996; McGeown et al. 1996). Specifically, by using rhod-2 to monitor [Ca2+]m directly, we set out to establish whether [Ca2+]m increased following depolarization- induced stimulation of Ca2+ influx from the extracellular medium or caffeine-induced release of Ca2+ from the SR. Two approaches were employed. First, [Ca2+]m was monitored using a high speed multi-wavelength microfluorimeter which allowed simultaneous monitoring of both [Ca2+]m and [Ca2+]i with high temporal resolution (Drummond & Tuft, 1999). This approach provided detailed kinetic information about the time course of the Ca2+ changes in each of these cellular compartments. Second, the use of a wide-field, high-speed, digital imaging microscope, allowed us to monitor changes in [Ca2+]m at the level of individual mitochondria in situ. It was found that stimulation of either Ca2+ influx, or Ca2+ release from the SR were capable of producing an increase in [Ca2+]m. While [Ca2+]i normally returned to baseline values within 20 s following either form of stimulation, [Ca2+]m was restored to baseline values at a considerably slower rate which appeared to vary depending on the level of Ca2+ in the SR.
METHODS
Cell isolation
The methods used have been described in detail elsewhere (Fay et al. 1982; McGeown et al. 1996) and will only be described briefly herein. Adult toads (Bufo marinus) were killed by decapitation using a small animal guillotine, as approved by the University of Massachusetts Medical Center Animal Care Committee, following guidelines of the US Department of Agriculture, and Health and Human Services. Single smooth muscle cells were freshly isolated from the stomach by enzymatic dissociation as previously described (Fay et al. 1982; McGeown et al. 1996). Experiments were carried out using the following solutions. Extracellular (mM): NaCl, 94; KCl, 3; MgCl2, 1; tetraethylammonium (TEA), 10; Hepes, 5; CaCl2, 20; pH adjusted to 7.4 with NaOH. Pipette (mM): CsCl, 140; MgCl2, 1; Na2ATP, 3.6; Hepes, 20; pH adjusted to 7.15-7.2 with CsOH. All experiments were carried out at room temperature.
Simultaneous measurement of mitochondrial and cytoplasmic [Ca2+]
To monitor [Ca2+] in the cytoplasm and mitochondria simultaneously, fluorescence was measured using a custom built multi-wavelength microfluorimeter (Drummond & Tuft, 1999). Briefly, the system consisted of a Zeiss IM-35 inverted microscope (Nikon ×40, 1.3NA) with a specially designed excitation path and photomultiplier tube (Thorn EMI type 9954A, Thorn EMI, Rockaway, NJ, USA). The excitation path comprised a series of dichroic mirrors and a ‘chopper’ wheel, which permitted excitation of up to four wavelengths every 20 ms. In the present study, the excitation wavelengths for fura-2 were 340 nm and 380 nm (∼10 nm bandwidth), and for rhod-2 the excitation wavelength was 500 nm (∼10 nm bandwidth). A 560 nm (∼80 nm bandwidth) emission filter was used for both fura-2 and rhod-2 emission. An image mask was used to exclude the field beyond the cell, thereby reducing the background contribution to the fluorescence signal.
In order to monitor [Ca2+]m, isolated smooth muscle cells were incubated with the Ca2+ sensitive fluorescent indicator rhod-2 AM (1–1.5 μM), for at least 1 h at room temperature. Rhod-2 has been used by several different laboratories to monitor changes in [Ca2+] within the mitochondrial matrix, in many different cell types (Mix et al. 1994; Sheu & Jou, 1994; Rutter et al. 1996; Babcock et al. 1997; Trollinger et al. 1997; Drummond & Tuft, 1999; McCarron & Muir, 1999). Binding of Ca2+ to rhod-2 increases its fluorescence; however, since there is no significant shift in excitation or emission wavelengths upon Ca2+ binding, it cannot be used for ratio imaging. Thus, to avoid potential artifacts resulting from cell movement, contraction was blocked with wortmannin (100 μM in the extracellular solution) (Nakanishi et al. 1992) in all studies involving rhod-2. Comparison with previous studies in our laboratory indicated that wortmannin did not have any effect on the cytoplasmic Ca2+ signal in these cells. Due to uncertainties concerning the Kd of the indicator within the mitochondrial matrix, and the accuracy of establishing fluorescence in the absence of Ca2+ (Fmin) and that in the presence of saturating Ca2+ (Fmax), mitochondrial rhod-2 fluorescence was not converted to [Ca2+]. Rather, rhod-2 fluorescence is reported as 100ΔF/Fo, where F is the measured fluorescence, and Fo is the fluorescence before application of either the depolarizing stimulus or caffeine. In discussing results, we refer to an increase or decrease in rhod-2 fluorescence as an increase or decrease in [Ca2+]m. [Ca2+]i was monitored with fura-2 (50 μM), which was included as the free acid in the patch pipette solution. Fura-2 ratios were converted to [Ca2+]i using the method described by Grynkiewicz et al. (1985) and an assumed Ca2+-fura-2 Kd of 200 nM. The fluroescence ratio in saturating Ca2+ (Rmax) and that in the absence of Ca2+ (Rmin), and the fluorescence ratio (Ca2+ free/saturating Ca2+) for dye excited at 380 nm (β) were determined as previously described (Drummond & Fay, 1996).
Imaging changes in [Ca2+] within individual mitochondria
Mitochondria labelled with rhod-2 (as described above) were imaged using an high-speed, wide-field digital imaging microscope (see ZhuGe et al. 1999 for a complete description of this system). Briefly, the system is based on a custom built inverted microscope. An objective (Nikon × 60, 1.4 NA), which can be rapidly focussed by the 20 μm total travel piezoelectric translator, forms a real image on a 128 pixel × 128 pixel frame transfer charge-coupled device (CCD). The 128 × 128 image on the CCD is then transferred in 50 μs to the 128 × 128 storage frame, leaving the image frame cleared for the next image. The storage frame is then read out to computer memory in 1.8 ms, allowing a maximum image rate of 543 s−1. The pixel size used in the present study was 333 nm × 333 nm, giving an area of coverage 42.6 μm × 42.6 μm. The CCD camera was developed in conjunction with Lincoln Laboratory at Massachusetts Institute of Technology (Lexington, MA, USA). The 514 nm line of a multi-line argon-krypton laser was expanded to provide wide-field illumination for rhod-2 excitation. A laser shutter controlled the exposure duration and a 550 nm long pass emission filter was used for rhod-2 emission. A rapid nine image through-focus series was taken at Z=−2.0, −1.5, −1, −0.5, 0, 0.5, 1, 1.5, 2.0 μm. Using 5–7 ms exposures, with 10 ms between exposures to allow for the piezoelectric translator to move the objective, meant that a nine image through-focus series could be acquired in 125–143 ms. A through-focus image set was acquired before stimulation; ten through-focus sets were then acquired at 1 s intervals commencing 0.5 s after initiating the depolarizing or caffeine stimulus. An additional nine through-focus sets were then acquired at 15 s intervals.
Image processing and data analysis
Although there should be no rhod-2 outside the cell boundary, and very little in the cytoplasm, fluorescence is seen in these regions because of blurred fluorescence from mitochondria beyond the plane of focus. Thus, image restoration is essential to enable accurate data analysis. To reverse the distortion, the data were processed using a constrained deconvolution algorithm based on regularization theory as described by Carrington et al. (1990). This requires that a quantitative calibration of the optical characteristics of the microscope be carried out. This is achieved by acquiring a 3-D image of a sub-resolution fluorescence bead (Molecular Probes, OR, USA). Prior to image restoration, the data are digitally corrected for background intensity and small heterogeneities in the CCD sensitivity (Carrington et al. 1990).
Image processing and data analysis were performed using custom designed software, running on a SiliconGraphics work station. The fluorescence of an individual mitochondrion is represented by the pixel of maximum intensity. The brightest pixel presumably is the most in-focus portion of the mitochondrion. Interactive analysis and visualization software enabled determination of the brightest pixel for each mitochondrion. Twenty to thirty mitochondria were randomly chosen for each cell and followed through time. Values for each mitochondrion were normalized to the pre-stimulus fluorescence value, and in turn averaged to obtain a measure of the fluorescence of mitochondria in response to depolarizing or caffeine stimulation.
Measurement of mitochondrial membrane potential
In order to monitor any change in mitochondrial membrane potential which occurs following influx of Ca2+ into the matrix, tetramethylrhodamine ethyl ester (TMRE) was used (Ehrenberg et al. 1988; Loew et al. 1994; Duchen et al. 1998). Smooth muscle cells were exposed to 100 nM TMRE for at least 10 min. At this concentration, the potential-dependent accumulation of TMRE within mitochondria produces a quench of fluorescence, which is relieved by redistribution of the dye when the mitochondrial membrane potential is depolarized: thus, an increase in TMRE fluorescence is indicative of mitochondrial depolarization. TMRE fluorescence was monitored using the multi-wavelength microfluorimeter described above, with the same excitation and emission filters as used for rhod-2. This approach allowed for simultaneous measurement of the mitochondrial membrane potential and [Ca2+]i.
Electrophysiology
Whole-cell membrane currents were recorded during all experimental protocols using thin walled borosilicate patch electrodes (3–5 MΩ) (World Precision Instruments, FL, USA) with an Axopatch-1D patch-clamp amplifier (Axon Instruments, Foster City, CA, USA). Following rupture of the membrane patch, 20–30 min were allowed for dialysis of the cytoplasm before commencing any experimental protocols. This extended period of dialysis facilitated removal of any residual rhod-2 from the cytoplasm. Data were digitally stored on an IBM compatible PC, at a frequency of 1 kHz after being filtered with a low-pass filter (200 Hz cut-off), for subsequent off-line analysis.
Reagents and data analysis
Rhod-2 AM, fura-2, and TMRE were obtained from Molecular Probes (Eugene, OR, USA). Rhod-2 AM and TMRE were prepared as 1 mM stock solutions in DMSO. Fura-2 was prepared as a 10 mM stock solution in ultra pure water. Wortmannin, carbonyl cyanide p-(trifluoromethoxy)phenylhydrazone (FCCP), caffeine and all other reagents were from Sigma (St Louis, MO, USA). Wortmannin and FCCP were prepared as 100 mM and 1 mM stock solutions in DMSO, respectively. Caffeine was applied from a pressure ejection pipette, positioned approximately 100 μm from the cell, using a picospritzer II (General Valve, Fairfield, NJ, USA).
Data are shown as means ± standard error of the mean (s.e.m.), and n refers to the number of cells. Statistical tests of difference were made using Student's t tests for paired and unpaired observations. The Kolmogorov-Smirnov test was used to test for differences in the frequency histograms for depolarizing and caffeine stimulation. P < 0.05 was considered to be statistically significant.
RESULTS
Mitochondrial labelling with rhod-2
Figure 1 shows a gastric smooth muscle cell from Bufo marinus, which has been incubated with 1 μM of the Ca2+ sensitive fluorescent indicator rhod-2 AM for 1 h at room temperature. Note the accumulation of rhod-2 within the mitochondria, and the characteristic rod-like appearance of this organelle. The subcellular localization of the mitochondria is very similar to that observed in electron microscopy studies of these same cells (R. W. Craig, personal communication), and is similar to that observed when TMRE was used to monitor the mitochondrial membrane potential (Drummond & Fay, 1996).
Figure 1. Mitochondria in a Bufo marinus gastric myocyte labelled with rhod-2.
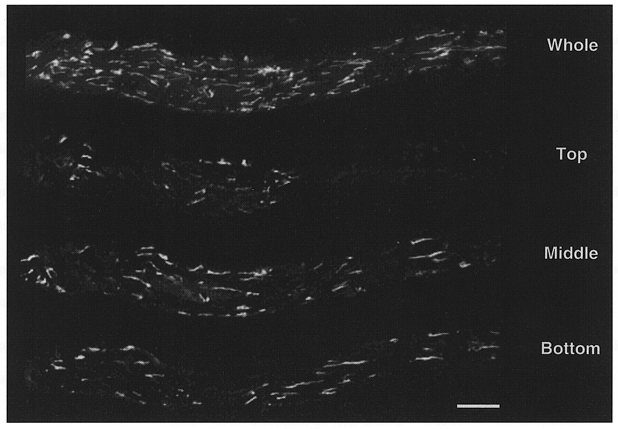
Smooth muscle cells were loaded with 1–1.5 μM rhod-2 AM for 1 h. The positive charge on rhod-2 AM results in significant accumulation of this indicator within the mitochondrial matrix. Following hydrolysis of the acetoxymethylester group, rhod-2 becomes trapped in the mitochondrial matrix. The image showing the whole cell reflects a maximum intensity projection of the entire through-focus data set. The images labelled top, middle and bottom reflect 0.25 μm optical sections from the respective locations within the cell. The cell was imaged using a digital imaging microscope (Moore et al. 1993) and processed using a constrained deconvolution algorithm (Carrington et al. 1990). Scale bar represents 10 μm.
Simultaneous measurement of cytoplasmic and mitochondrial [Ca2+] during depolarizing stimulation
The resting [Ca2+]i in these smooth muscle cells, as measured with fura-2, was 119 ± 8 nM. During a 5 s train of depolarizing pulses (-110 to +10 mV, 250 ms, 2 Hz), [Ca2+]i increased to 784 ± 87 nM (n= 9; Fig. 2A). The total time to peak for the increase in [Ca2+]i was 4.1 ± 0.2 s and the half-time (t½) for recovery following the end of the depolarizing train was 4.3 ± 0.2 s (Fig. 2C). The same stimulus also increased mitochondrial [Ca2+] as indicated by the 49 ± 7 % increase in rhod-2 fluorescence. When the cytoplasmic and mitochondrial [Ca2+] records from the same cell are viewed on an expanded time scale, it can clearly be seen that [Ca2+]i increased faster than [Ca2+]m, and that [Ca2+]m continues to increase even after [Ca2+]i has reached a plateau (Fig. 2B). The t½ to peak for the increase in rhod-2 fluorescence was 2.6 ± 0.3 s, which was significantly slower than the t½ to peak for the increase in [Ca2+]i (720 ± 50 ms) (P < 0.003). The t½ for recovery of rhod-2 fluorescence to its baseline value was 46.7 ± 11.3 s which was an order of magnitude longer than the t½for [Ca2+]i recovery (4.3 ± 0.2 s; P < 0.006; Fig. 2C).
Figure 2. Simultaneous measurement of cytoplasmic and mitochondrial [Ca2+] during depolarizing stimulation.
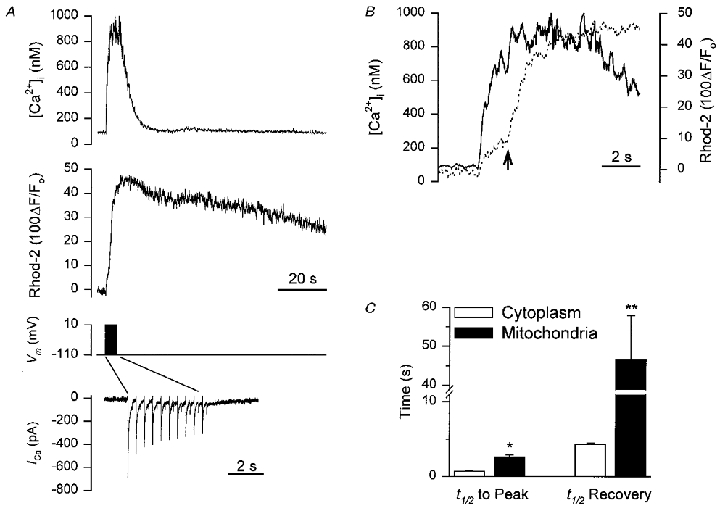
Smooth muscle cells were loaded with 1–1.5 μM rhod-2 AM for 1 h to enable monitoring of [Ca2+]m and fura-2 was included in the patch pipette to allow simultaneous monitoring of [Ca2+]i. A, representative recording showing: top trace, the [Ca2+]i transient during a 5 s train of depolarizing pulses (from −110 to +10 mV, 250 ms duration, 2 Hz); middle trace, the corresponding change in [Ca2+]m during the depolarizing train; bottom traces show the membrane potential and the membrane current, during the depolarizing train. Note the change in time scale for the membrane current. B, overlay of [Ca2+]i and [Ca2+]m records from A re-plotted on an expanded time scale (continuous line, [Ca2+]i; dashed line, [Ca2+]m). Arrow indicates the secondary increase in the rate of mitochondrial Ca2+ uptake which occurs approximately 2 s after initiating the depolarizing train. C, summary data of the half-time (t½) to peak for the increase in [Ca2+]i and [Ca2+]m and also the t½ for the recovery of [Ca2+]i and [Ca2+]m (n= 9). *P < 0.003, **P < 0.006.
A consistent finding, which can be seen in the expanded time scale of the [Ca2+]m record (Fig. 2B), is that while mitochondrial Ca2+ uptake begins immediately following initiation of the depolarizing stimulus there is an apparent slowing down of the rate of Ca2+ uptake soon afterwards. This is followed by a secondary increase in the rate of mitochondrial Ca2+ uptake (indicated by the arrow in Fig. 2B). The secondary increase in the rate of mitochondrial Ca2+ uptake occurred 2.9 ± 0.9 s after the beginning of the depolarizing train. Both phases of the increase in [Ca2+]m were abolished by FCCP (1 μM; n= 4), indicating that the first phase was not due to contamination from residual cytoplasmic rhod-2.
Simultaneous measurement of cytoplasmic and mitochondrial [Ca2+] during caffeine-induced release of Ca2+ from the SR
Caffeine is capable of releasing Ca2+ from the SR in smooth muscle, by increasing the sensitivity of the ryanodine receptor to Ca2+, thereby promoting Ca2+-induced Ca2+ release. During a 5 s application of caffeine (20 mM), applied from a pressure ejection pipette positioned close to the cell, [Ca2+]i increased from a resting level of 113 ± 24 nM to 523 ± 90 nM (n= 6; Fig. 3A). The time to peak for the increase in [Ca2+]i was 2.1 ± 0.3 s, and the t½ for recovery was 4.8 ± 0.4 s. Stimulation with caffeine also produced an increase in rhod-2 fluorescence, indicative of an increase in [Ca2+]m. In contrast to the results shown in Fig. 2B, [Ca2+]m increased with a similar time course to the increase in [Ca2+]i during stimulation with caffeine (Fig. 3B). The rhod-2 fluorescence increased by 51 ± 18 % with a t½ to peak of 1.0 ± 0.2 s (Fig. 3A and C) and the t½ for recovery was 20.9 ± 6.6 s (Fig. 3C). The t½ to peak for the increase in [Ca2+]m was not significantly different from that of the cytoplasm (1.1 ± 0.3 s). As with depolarizing stimulation, [Ca2+]m recovery back to baseline values was consistently slower than the recovery of [Ca2+]i.
Figure 3. Simultaneous measurement of cytoplasmic and mitochondrial [Ca2+] during caffeine-induced release of Ca2+ from the SR.
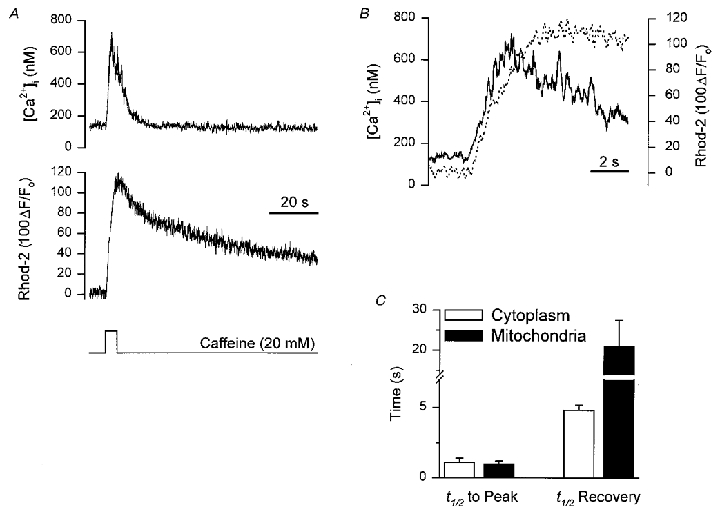
Smooth muscle cells were loaded with 1–1.5 μM rhod-2 AM for 1 h to enable monitoring of [Ca2+]m and fura-2 was included in the patch pipette to allow simultaneous monitoring of [Ca2+]i. A, representative recording showing: top trace, the [Ca2+]i transient in response to a 5 s application of caffeine (20 mM); middle trace, the corresponding change in [Ca2+]m during the stimulation with caffeine; bottom trace the period of caffeine application. B, overlay of [Ca2+]i and [Ca2+]m records from A re-plotted on an expanded time scale (continuous line, [Ca2+]i; dashed line, [Ca2+]m). C, summary data of the t½ to peak for the increase in [Ca2+]i and [Ca2+]m and also the t½ for the recovery of [Ca2+]i and [Ca2+]m (n= 6).
Subcellular imaging of the increase in mitochondrial [Ca2+] during depolarizing stimulation
One advantage of using rhod-2 to monitor [Ca2+]m, as opposed to the use of mitochondrially targeted aequorin (Rizzuto et al. 1992), is the ability to resolve changes in [Ca2+] within individual mitochondria in situ (but see Rutter et al. 1996). Thus, we used rhod-2 in combination with a high-speed digital imaging microscope to examine whether there were any marked differences in the responses of individual mitochondria to depolarizing stimulation, or following release of Ca2+ from the SR. During a 5 s train of depolarizing pulses (-110 to +10 mV, 250 ms, 2 Hz), which as indicated earlier would be expected to increase [Ca2+]i to ∼1 μM, there was a significant increase in mitochondrial rhod-2 fluorescence, indicative of mitochondrial Ca2+ uptake. Shown in pseudocolour in Fig. 4 is the change in rhod-2 fluorescence for individual mitochondria, within a 1.5 μm optical section from the through-focus set. The images represent the maximum intensity projection of three adjacent optical sections, which were near the central focus plane. Through-focus sets were acquired every 1 s during the depolarizing train, commencing 0.5 s after the start of the stimulus.
Figure 4. Subcellular imaging of the increase in mitochondrial [Ca2+] during depolarizing stimulation.
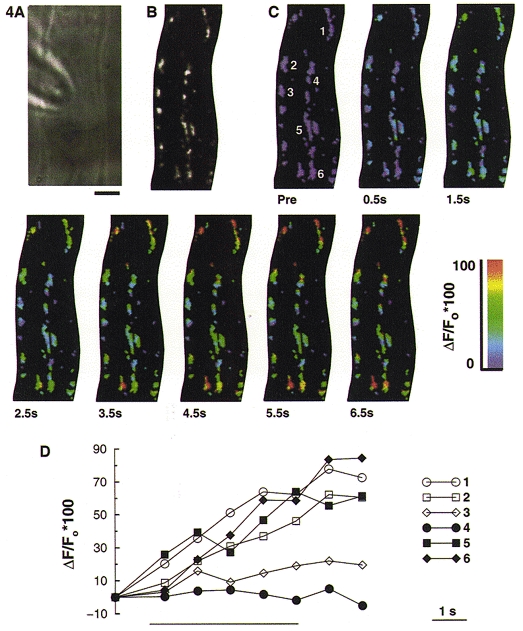
Smooth muscle cells were loaded with 1–1.5 μM rhod-2 AM for 1 h to enable monitoring of [Ca2+]m. A, bright field image of a Bufo marinus gastric smooth muscle cell from which the subsequent fluorescence images in this figure were obtained. Scale bar represents 5 μm and is applicable to all the images shown. B, grey scale image of rhod-2 labelled mitochondria. The image represents a 1.5 μm thick optical section from the through-focus data set, which has been processed using a constrained deconvolution algorithm (Carrington et al. 1990). C, shown in pseudocolour is the increase in [Ca2+]m, for the same optical section as in B, during a 5 s depolarizing train (from −110 to +10 mV, 250 ms duration, 2 Hz). ‘Pre’ indicates the image acquired before applying the depolarizing train. Thereafter, through-focus image sets were acquired every 1 s for the next 10 s, commencing 0.5 s after the beginning of the depolarizing train. D, rhod-2 fluorescence for the six individual mitochondria numbered in the first image of C, selected from regions close to the membrane (open symbols) or more centrally located (filled symbols), in the 3-D data set. Each mitochondrion is represented by the fluorescence of its brightest pixel, and was normalized to the pre-stimulation value. The bar beneath the graph indicates the period of depolarizing stimulation.
The high-speed digital imaging microscope provides the opportunity to examine the Ca2+ uptake properties of individual mitochondria, within specific cellular locations. In Fig. 4D, the rhod-2 fluorescence for six individual mitochondria, selected from within the 1.5 μm optical section, is shown. Each mitochondrion is represented by its pixel of maximum intensity. Three of the mitochondria were located close to the plasma membrane (open symbols), and the other three were located in the centre of the cell (closed symbols). Two of the six mitochondria showed no increase, or only a small (∼10 %) increase in rhod-2 fluorescence in response to the depolarizing stimulus. At the end of the depolarizing train, the mitochondrial rhod-2 fluorescence had increased by 53 ± 4 % (n= 7 cells, 159 mitochondria).
Since the uptake of Ca2+ into the mitochondria is dependent upon the potential gradient across the inner membrane, collapsing this gradient should prevent mitochondria from taking up Ca2+, thereby preventing the increase in rhod-2 fluorescence. When cells were exposed to the protonophore carbonyl cyanide p-(trifluoromethoxy)phenylhydrazone (FCCP; 1 μM), for 2–3 min before delivering the train of depolarizations, the increase in mitochondrial fluorescence was abolished (Fig. 5). In Fig. 5D, the rhod-2 fluorescence for six individual mitochondria which are located either close to the membrane (open symbols) or in the centre of the cell (closed symbols) is shown. We have previously shown that FCCP did not affect the magnitude of the [Ca2+]i transient produced by depolarizing stimulation; however, it significantly slowed recovery of [Ca2+]i back to its resting level (Drummond & Fay, 1996).
Figure 5. FCCP blocks the increase in mitochondrial [Ca2+] during depolarizing stimulation.
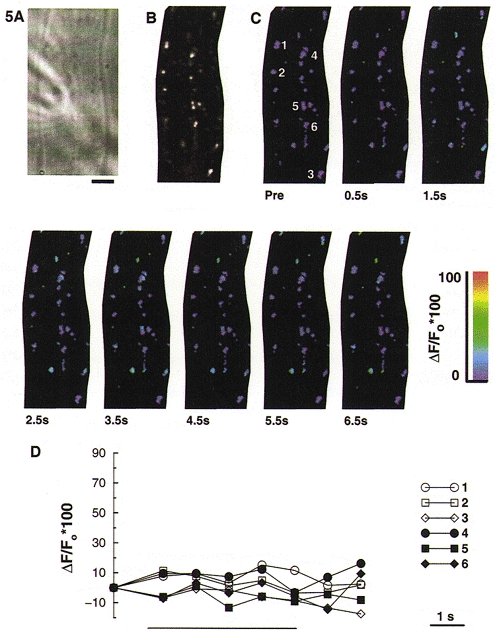
Smooth muscle cells were loaded with 1–1.5 μM rhod-2 AM for 1 h to enable monitoring of [Ca2+]m. A, bright field image of a Bufo marinus gastric smooth muscle cell from which the subsequent fluorescence images in this figure were obtained. Scale bar represents 5 μm and is applicable to all the images shown. B, grey scale image of rhod-2 labelled mitochondria. This image represents a 1.5 μm thick optical section of the through-focus data set. FCCP (1 μM) was applied to the cell approximately 3 min prior to delivering the depolarizing train. C, pseudocolour images of the same optical section as shown in B during a 5 s depolarizing train (from −110 to +10 mV, 250 ms duration, 2 Hz). ‘Pre’ indicates the image acquired before applying the depolarizing train. D, rhod-2 fluorescence for the six individual mitochondria numbered in the first image of C, selected from regions close to the membrane (open symbols) or more centrally located (filled symbols). Each mitochondrion is represented by the fluorescence of its brightest pixel, and was normalized to the pre-stimulation value. The bar beneath the graph indicates the period of depolarizing stimulation.
Subcellular imaging of the increase in mitochondrial [Ca2+] during caffeine-induced release of Ca2+ from the SR
Application of caffeine to these smooth muscle cells typically produces a transient increase in [Ca2+]i, to approximately 500–750 nM, which normally returns to baseline values within 10–15 s (see above). During a 5 s application of caffeine (20 mM), which was applied from a pressure ejection pipette positioned close to the cell, mitochondrial rhod-2 fluorescence increased, which is indicative of mitochondrial Ca2+ uptake. Shown in pseudocolour in Fig. 6 is the change in rhod-2 fluorescence for individual mitochondria within a 1.5 μm optical section from the through-focus set. The images represent the maximum intensity projection of three adjacent optical sections, which were near the central focus plane. Through-focus sets were acquired every 1 s during the application of caffeine, commencing 0.5 s after the start of the stimulus.
Figure 6. Subcellular imaging of the increase in mitochondrial [Ca2+] during caffeine-induced release of Ca2+ from the SR.
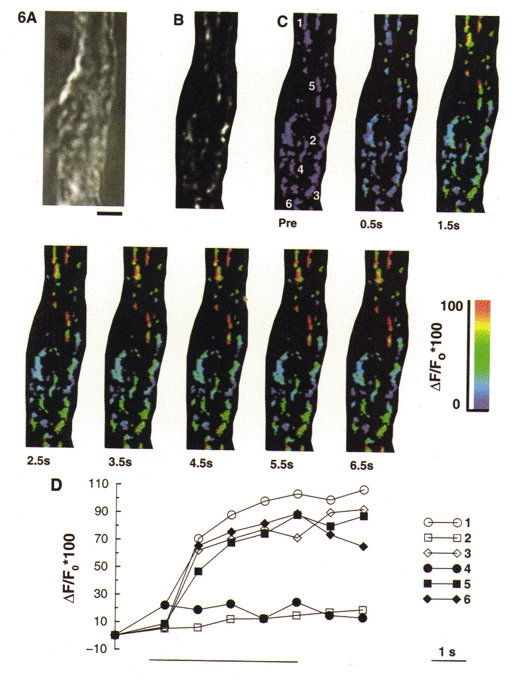
Smooth muscle cells were loaded with 1–1.5 μM rhod-2 AM for 1 h to enable monitoring of [Ca2+]m. A, bright field image of a Bufo marinus gastric smooth muscle cell from which the subsequent fluorescence images in this figure were obtained. Scale bar represents 5 μm and is applicable to all the images shown. B, grey scale image of rhod-2 labelled mitochondria. This image represents a 1.5 μm thick optical section of the through-focus data set. C, pseudocolour images of the same optical section as shown in B during a 5 s application of caffeine (20 mM). ‘Pre’ indicates the image acquired before application of caffeine. D, rhod-2 fluorescence for the six individual mitochondria numbered in the first image of C, selected from regions close to the membrane (open symbols) or more centrally located (filled symbols). Each mitochondrion is represented by the fluorescence of its brightest pixel, and was normalized to the pre-stimulation value. The bar beneath the graph indicates the period of caffeine application.
In Fig. 6D, the rhod-2 fluorescence for six individual mitochondria, selected from within the 1.5 μm optical section, is shown. Each mitochondrion is represented by its pixel of maximum intensity. Three of the mitochondria were located close to the plasma membrane (open symbols), and the other three were located in the centre of the cell (closed symbols). At the end of the 5 s caffeine application, the mitochondrial rhod-2 fluorescence had increased by 55 ± 4 % (n= 5 cells, 115 mitochondria).
Time course of the depolarization- and caffeine-induced change in mitochondrial [Ca2+]
Figure 7A shows the time course of the depolarization-induced change in rhod-2 fluorescence, determined from the images of 159 individual mitochondria in situ (n= 7 cells). At the end of the depolarizing train, rhod-2 fluorescence had increased by 53 ± 4 %, with approximately 80 % of the mitochondria showing a ≥ 10 % increase in rhod-2 fluorescence. A further 19.5 s after the end of the stimulus, when [Ca2+]i would normally be back at its resting level, mitochondrial rhod-2 fluorescence remained elevated by 47 ± 4 %. Even at 139.5 s following the end of the depolarizing stimulus, mitochondrial rhod-2 fluorescence was still elevated by 29 ± 5 %. Also shown in Fig. 7A are frequency histograms of the rhod-2 fluorescence change for individual mitochondria at t= 5.5 s (Fig. 7Ab) which is 0.5 s after the end of the depolarizing train; at t= 24.5 s (Fig. 7Ac) which is 19.5 s after the end of the stimulus; and at t= 144.5 s (Fig. 7Ad) which is at the end of the recording period.
Figure 7. Time course of depolarization- and caffeine-induced change in rhod-2 fluorescence.

Smooth muscle cells were loaded with 1–1.5 μM rhod-2 AM for 1 h to enable monitoring of [Ca2+]m. Aa, time course of the change in mitochondrial rhod-2 fluorescence during a brief train of depolarizations. Approximately 20–30 mitochondria were selected in each cell and the brightest pixel was then followed through time (n= 7 cells, 159 mitochondria). The bar beneath the graph represents the period of depolarizing stimulation. Ab-d, histograms of the change in rhod-2 fluorescence at t= 5.5, 24.5 and 144.5 s for the depolarizing stimulus. Ba, time course of the change in mitochondrial rhod-2 fluorescence during a 5 s caffeine application. Approximately 20–30 mitochondria were selected in each cell and the brightest pixel was then followed through time (n= 5 cells, 115 mitochondria). The bar beneath the graph represents the period of caffeine stimulation. Bb-d, histograms of the change in rhod-2 fluorescence at t= 5.5, 24.5 and 144.5 s for stimulation with caffeine.
Figure 7B shows the time course of caffeine-induced change in rhod-2 fluorescence, determined from the images of 115 individual mitochondria in situ (n= 5). At the end of the 5 s application of caffeine, mitochondrial fluorescence had increased by 55 ± 4 %, with approximately 82 % of the mitochondria showing a ≥ 10 % increase in rhod-2 fluorescence at this time. At 19.5 s post-caffeine application, when [Ca2+]i would be back at baseline levels, mitochondrial rhod-2 fluorescence was still elevated by 30 ± 4 %. The mitochondrial rhod-2 fluorescence was restored to baseline values approximately 60 s after stimulation with caffeine. Figure 7B shows frequency histograms of the rhod-2 fluorescence change for individual mitochondria at t= 5.5 s (Fig. 7Bb) which is 0.5 s after the end of the period of caffeine application; at t= 24.5 s (Fig. 7Bc) which is 19.5 s after the end of the stimulus; and at t= 144.5 s (Fig. 7Bd) which is at the end of the recording period.
Simultaneous measurement of cytoplasmic [Ca2+] and mitochondrial membrane potential
The lipophilic cation TMRE was used to monitor the mitochondrial membrane potential during depolarizing stimulation, while simultaneously monitoring [Ca2+]i with fura-2. During a train of depolarizing pulses (-110 to +10 mV, 250 ms, 2 Hz), [Ca2+]i increased from 126 ± 11 nM to 637 ± 66 nM with a t½ to peak of 170 ± 20 ms (n= 6). The t½ for recovery of [Ca2+]i to baseline values following the end of the depolarizing train was 3.9 ± 0.4 s. Simultaneous measurement of TMRE fluorescence indicated a depolarization of the mitochondrial membrane potential. This is manifest as an increase in TMRE fluorescence, as depolarization of the mitochondria membrane potential leads to redistribution of TMRE into the cytoplasm, and relief of fluorescence quenching (Duchen et al. 1998; Boitier et al. 1999). Confirmation of this effect was provided by application of FCCP (1 μM) which caused a 132 ± 10 % increase in TMRE fluorescence. During the depolarizing train TMRE fluorescence increased by 48 ± 11 %, with a t½ to a peak of 1.7 ± 0.3 s (Fig. 8A). The TMRE fluorescence recovered to baseline values with a t½ of 4.5 ± 1.3 s.
Figure 8. Simultaneous measurement of cytoplasmic [Ca2+] and mitochondrial membrane potential during depolarizing stimulation.
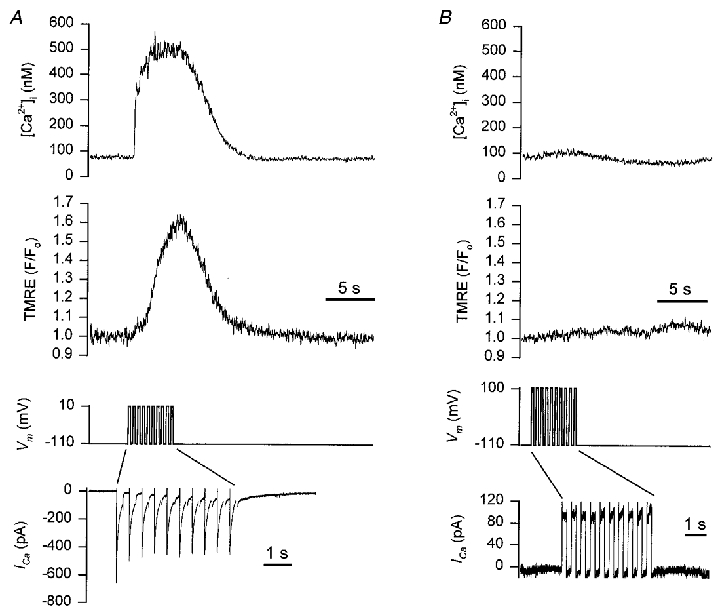
Smooth muscle cells were loaded with 100 nM TMRE for 10 min to enable monitoring of the mitochondrial membrane potential. Fura-2 was included in the patch pipette to allow simultaneous monitoring of [Ca2+]i. A, representative recording showing: top trace, the [Ca2+]i transient during a 5 s train of depolarizing pulses (from −110 to +10 mV, 250 ms duration, 2 Hz); middle trace, the corresponding change in mitochondrial membrane potential. An increase in TMRE fluorescence signals depolarization of the mitochondrial membrane potential; bottom traces show the membrane potential and the membrane current, during the depolarizing train. Note the change in the time scale for the membrane current. B, the same cell as shown in A, with the membrane potential in this sequence pulsed to +100 mV during the depolarizing train.
Two further observations support the notion that the change in mitochondrial membrane potential results from the influx of Ca2+ into the matrix and consequent membrane depolarization. Firstly, when 10 mM BAPTA was included in the patch pipette, the increase in [Ca2+]i normally seen during the depolarizing train was prevented and there was no change in TMRE fluorescence (data not shown). Secondly, when the membrane potential was stepped to +100 mV during the depolarizing train, so as to prevent Ca2+ entry, there was no increase in [Ca2+]i and also no increase in TMRE fluorescence (Fig. 8B). It should be noted that while [Ca2+]m required tens of seconds to recover to its baseline value (Fig. 2C), the mitochondrial membrane potential recovered much more rapidly following the train of depolarizing pulses.
DISCUSSION
Over the past several years, there have been an increasing number of studies indicating mitochondrial involvement in [Ca2+]i regulation in a variety of cell types including: neurons (Duchen et al. 1990; Thayer & Miller, 1990; Friel & Tsien, 1994); chromaffin cells (Herrington et al. 1996); cardiac myocytes (Bassani et al. 1992); and smooth muscle cells (Drummond & Fay, 1996). While many of these studies utilized pharmacological approaches to implicate mitochondrial involvement in [Ca2+]i regulation, they have been substantiated recently by using techniques which allow direct monitoring of mitochondrial [Ca2+]. While perhaps the most elegant approach utilized has been that of recombinant DNA technology to target the Ca2+-sensitive photoprotein aequorin to the mitochondria (Rizzuto et al. 1992), there are some disadvantages associated with this technique. First, the cells being studied often have to be maintained in culture to enable transfection with the mitochondrially targeted aequorin. Thus, this approach cannot easily be applied to freshly dissociated cells. Second, aequorin is consumed upon binding Ca2+ and it is also sensitive to changes in the Mg2+ concentration. Third, using this approach, it is difficult to make measurements from single cells (but see Rutter et al. 1996); hence, resolution at the level of individual mitochondria is not possible.
An alternative methodology to monitor [Ca2+]m, which has been used successfully by an increasing number of laboratories, is the Ca2+ sensitive fluorescent indicator rhod-2 (Mix et al. 1994; Sheu & Jou, 1994; Hajnöczky et al. 1995; Babcock et al. 1997; Drummond & Tuft, 1999). The acetoxymethyl (AM) ester of rhod-2 is the only cell-permeant Ca2+ indicator which has a net positive charge. This property readily promotes compartmentalization of rhod-2 AM into the mitochondrial matrix, most likely via mitochondrial membrane potential driven uptake when cells are exposed to the AM ester. Once inside the mitochondrial matrix, esterases hydrolyse the AM group leaving the Ca2+-sensitive form of rhod-2 trapped by virtue of its membrane impermeability. One major advantage of the approach of using rhod-2 to monitor [Ca2+]m, as opposed to aequorin, is the ability to make measurements of [Ca2+]m not only at the single cell level, but also from individual mitochondria in situ.
Kinetics of mitochondrial [Ca2+] increase relative to the increase in cytoplasmic [Ca2+]
By simultaneously monitoring cytoplasmic and mitochondrial [Ca2+] with high temporal resolution, it is possible to obtain kinetic information pertaining to the [Ca2+] changes within these two compartments. Thus, during a brief train of depolarizing pulses, which promotes Ca2+ influx from the extracellular medium, there was a rapid increase in both [Ca2+]i and [Ca2+]m. When the t½ to peak for the increase in [Ca2+]i was compared with that of the increase in [Ca2+]m, it was found that the [Ca2+] increased more rapidly in the cytoplasm than in the mitochondria. When cells were stimulated with caffeine, which promotes release of Ca2+ from the SR via the ryanodine receptor, there was also an increase in both [Ca2+]i and [Ca2+]m. However, unlike the depolarizing stimuli, there was no significant difference between the t½ to peak for the increase in [Ca2+]i or [Ca2+]m. Although depolarization and caffeine stimulation produced increases in rhod-2 fluorescence with different time courses, the magnitude of the increase was the same for both.
Since the train of depolarizations produced a significantly higher increase in [Ca2+]i than that produced by caffeine stimulation, bulk cytoplasmic [Ca2+] does not appear to be a good predictor of either the magnitude or kinetics of mitochondrial Ca2+ uptake in these cells. Rather, the differences in mitochondrial Ca2+ uptake may relate to the subcellular location of mitochondria relative to the sites of Ca2+ influx or Ca2+ release (Rizzuto et al. 1993; Lawrie et al. 1996; Rizzuto et al. 1998). In this respect, it is known from electron microscopy studies in smooth muscle that mitochondria are closely apposed to the SR, with the distance between these two organelles being approximately 20 nm (Nixon et al. 1994). Consequently, for a brief period of time after the SR Ca2+ release channels have been activated, mitochondria could be exposed to much higher Ca2+ concentrations than that observed in the bulk cytoplasm (Rizzuto et al. 1993; Rizzuto et al. 1998), leading to rapid accumulation of Ca2+ by the mitochondria. Clearly, further studies would have to be carried out using this particular cell type to determine the subcellular localization of mitochondria relative to the SR and plasma membrane, in order to substantiate this hypothesis.
Differences in the magnitude and kinetics of mitochondrial Ca2+ uptake have been observed in other cell types, depending upon the source of Ca2+ mobilized by the excitatory stimulus. Specifically, in endothelial cells, stimulation by extracellular application of ATP causes a long lasting increase in [Ca2+]m that largely depends on Ca2+ influx. Release of stored Ca2+ is ineffective at increasing [Ca2+]m in these endothelial cells (Lawrie et al. 1996). This is in contrast to studies in HeLa cells where Ca2+ release from intracellular stores was found to be more effective at increasing [Ca2+]m, compared with Ca2+ influx following depletion of the intracellular Ca2+ stores (Rizzuto et al. 1993). For the smooth muscle cells used in the present study, both depolarization-induced stimulation of Ca2+ influx and caffeine-induced release of Ca2+ from the SR were effective at increasing rhod-2 fluorescence, indicative of mitochondrial Ca2+ uptake. As mentioned earlier, however, differences in the kinetics of mitochondrial Ca2+ uptake were apparent, depending upon the mode of stimulation.
A consistent finding observed during depolarizing stimulation was that while Ca2+ uptake into mitochondria occurred immediately upon initiating the depolarizing train, soon afterwards it appeared to slow down. At approximately 2 s into the depolarizing train, however, there was a secondary increase in the rate of mitochondrial Ca2+ uptake. Since both phases of the response were abolished by FCCP, it is unlikely that the first phase is due to contamination of the fluorescence signal by cytoplasmic rhod-2. Such discrete phases of mitochondrial Ca2+ uptake were not observed during stimulation of these cells with caffeine. Although it is not clear what is responsible for the different phases of mitochondrial Ca2+ uptake, similar findings have been reported for endothelial cells (Donnadieu & Bourguignon, 1996) and cultured smooth muscle cells (Monteith & Blaustein, 1999). It could be that the initial phase of mitochondrial uptake reflects the activity of a previously described rapid mode of Ca2+ uptake (Sparagna et al. 1995), and that the secondary increase in mitochondrial Ca2+ uptake represents an allosteric activation of the uniporter by Ca2+ (Gunter & Pfeiffer, 1990). It is also possible that the initial phase reflects Ca2+ uptake by relatively few mitochondria, responding to local domains of high [Ca2+]. It is interesting to note that a previous study in these same smooth muscle cells, describing a Ca2+-calmodulin-dependent protein kinase II-mediated acceleration of Ca2+ removal processes, determined that the upregulation developed with a latency of 1–2 s (McGeown et al. 1996, 1998).
Imaging changes in mitochondrial [Ca2+]in situ
The use of rhod-2 as an indicator of [Ca2+]m enables monitoring of matrix [Ca2+] at the level of individual mitochondria. Thus, when mitochondria were imaged during a train of depolarizations, or stimulation with caffeine, an increase in [Ca2+] within individual mitochondria could be observed. At the end of the 5 s stimulus, approximately 44 and 38 % of the mitochondria had shown a ≥ 50 % increase in rhod-2 fluorescence for depolarization and caffeine stimulation, respectively. This increase in [Ca2+]m during the depolarizing train was abolished by FCCP, indicating that rhod-2 was reliably monitoring the matrix [Ca2+]. When the frequency histograms, representing mitochondrial rhod-2 fluorescence at the end of the 5 s stimulus, were compared for both depolarizing and caffeine stimulation, they were found to be similar according to the Kolmogorov-Smirnov test. It is evident from the frequency histograms that some mitochondria show only a small (< 20 %) increase in rhod-2 fluorescence during either form of stimulation. Since Ca2+ uptake by mitochondria is dependent upon the mitochondrial membrane potential, one explanation why some mitochondria show only a small increase in [Ca2+]m is that they are more depolarized and thus, less effective at taking up Ca2+. To verify this possibility, it would be necessary to monitor mitochondrial membrane potential and [Ca2+]m simultaneously. However, the similarity in fluorescence spectra for rhod-2 and TMRE limits our ability to use these two indicators simultaneously at the present time. It is also possible that the mitochondria showing small responses have normal membrane potential, and that the lack of Ca2+ uptake reflects exposure to radically different Ca2+ levels during stimulation. Further studies are required in order to determine the nature of the heterogeneous mitochondrial Ca2+ responses.
Recently it has been shown that focal Ca2+ release from the SR, commonly referred to as Ca2+ sparks (Cheng et al. 1993), can cause transient mitochondrial membrane depolarizations in rat cardiac myocytes (Duchen et al. 1998). We have also observed individual mitochondria, within Bufo marinus gastric smooth muscle cells, showing transient depolarizations in membrane potential under resting conditions (data not shown). Since Ca2+ sparks have been observed in these cells (ZhuGe et al. 1999) a similar phenomenon may be occurring as that observed in cardiac myocytes (Duchen et al. 1998), which may explain why some mitochondria are less effective at taking up Ca2+. When the time course of the change in [Ca2+]m was compared for mitochondria in the periphery versus the centre of the cell, the responses were remarkably similar (see Figs 3 and 5). Thus, the difference between mitochondria which were observed to be effectively taking up Ca2+, and those which were less effective, does not appear to be related to their subcellular localization.
Kinetics of mitochondrial efflux
It is not clear why the efflux of Ca2+ from the mitochondria is so slow, relative to the rate of removal of cytoplasmic Ca2+. From Figs 2 and 3 it is evident that [Ca2+]i returns to its baseline value considerably faster than the decline in rhod-2 fluorescence. This finding is consistent with several other studies in smooth muscle cells (Drummond & Tuft, 1999; McCarron & Muir, 1999; Monteith & Blaustein, 1999). The slow rate of mitochondrial Ca2+ efflux observed in smooth muscle cells is in marked contrast to studies in hepatocytes, where [Ca2+]m was found to be restored to resting levels while [Ca2+]i remained elevated (Hajnöczky et al. 1995). However, a recent study in astrocytes showed that [Ca2+]m can take approximately 30 min to return to its baseline value following stimulation with extracellular application of ATP (Boitier et al. 1999). Thus, there appear to be significant differences in the kinetics of mitochondrial Ca2+ efflux, which possibly reflect specific cell type variations and which may be related to the characteristics of the cytoplasmic Ca2+ response typically seen in a given cell (see Hajnöczky et al. 1995).
The slow rate of mitochondrial Ca2+ efflux was also observed when rhod-2 was used to monitor the [Ca2+]m of individual mitochondria in situ. Specifically, at 19.5 s after the depolarizing train or caffeine application, a ≥ 50 % increase in rhod-2 fluorescence was still evident in 81 and 34 % of the mitochondria for the respective stimuli. Studies on mitochondria isolated from smooth muscle have shown that, unlike most other cell types, they do not have a Na+-dependent Ca2+ efflux mechanism (Crompton et al. 1978), which may account in part for the slow rate of efflux. In this respect a brief increase in [Ca2+]i in smooth muscle could produce a more prolonged increase in [Ca2+]m, which may have important consequences for stimulation of oxidative phosphorylation (McCormack et al. 1990).
The present study has also shown that the recovery of [Ca2+]m to resting values is quicker when the source of Ca2+ is the SR as opposed to the extracellular medium. Specifically, at the end of the recording period, a ΔF/Fo≥ 50 % was still evident in 26 % of the mitochondria following depolarizing stimulation, compared with 8 % of the mitochondria following stimulation with caffeine. In this regard we offer the following hypothesis. When Ca2+ release from the SR is stimulated, the mitochondria will take up Ca2+ and the SR will be depleted. If the mitochondria and SR are closely coupled in these cells, as suggested for other smooth muscle cells (Nixon et al. 1995), then efflux of Ca2+ from the mitochondria to a depleted SR may provide an efficient mechanism for restoring [Ca2+]m to its resting value. In response to depolarizing stimulation, mitochondria will take up Ca2+ but the SR is not significantly depleted (Mlinar et al. 1995). Thus, efflux of Ca2+ from the mitochondria back to the SR under these conditions may not be as effective a mechanism. This notion is in agreement with a previous study in cardiac myocytes, showing that the mitochondria are capable of supplying Ca2+ which is utilized to replenish the SR (Bassani et al. 1993).
Effect of mitochondrial Ca2+ uptake on mitochondrial membrane potential
Since Ca2+ uptake into mitochondria during physiological stimulation has been shown to cause depolarization of the mitochondrial membrane potential (Loew et al. 1994) we were interested to determine whether a similar effect can be observed in smooth muscle. Indeed, Ca2+ influx during the depolarizing train caused a transient change in the mitochondrial membrane potential. Since the activity of the ATP synthetase is dependent upon the mitochondrial membrane potential, depolarization of the mitochondria would lead to a decrease in ATP production. Thus, it is important for the cell to maintain the mitochondrial membrane potential, but how this is achieved is unknown at the present time. Possibilities are that the electron transport chain is stimulated thereby re-establishing the mitochondrial membrane potential, or ATP is consumed by the ATP synthetase in order to pump protons across the mitochondrial membrane and maintain the potential.
It is interesting to note that whereas the change in mitochondrial membrane potential during the depolarizing train is somewhat transient in nature, with a time course very similar to the change in [Ca2+]i, Ca2+ in the mitochondria remains elevated for a considerably longer period of time. Since the mitochondrial membrane potential is required in order for the ATP synthetase to function, this may be the reason why the change in mitochondrial membrane potential is transient in nature. The more prolonged elevation in [Ca2+]m could conceivably lead to a prolonged activation of oxidative phosphorylation, through the stimulatory effect of Ca2+ on several mitochondrial dehydrogenases as mentioned earlier.
The results of the present study further support and extend our previous findings that mitochondria in smooth muscle cells are capable of contributing to cytoplasmic Ca2+ removal, by taking up Ca2+ which has entered the cytoplasm following depolarizing stimulation (Drummond & Fay, 1996), or activation of SR Ca2+ release. Specifically, using the Ca2+-sensitive fluorescent indicator rhod-2 we were able to observe changes in [Ca2+]m not only at the single cell level, but also at the level of individual mitochondria in situ. Our findings are in agreement with several other studies in smooth muscle, showing increases in [Ca2+]m following the increase in [Ca2+]i produced by depolarization of the plasma membrane and Ca2+ influx (McCarron & Muir, 1999), or agonist induced release of Ca2+ from the SR (Drummond & Tuft, 1999; Monteith & Blaustein, 1999).
Acknowledgments
This work was supported by a Grant-In-Aid from the American Heart Association (Massachusetts Affiliate) to R.M.D., HL 47530 and HL 61297–01 (J.V.W.) from NIH. T.C.H.M. was the recipient of a Howard Hughes Medical Institute Research Fellowship for Medical Students. We would like to thank Douglas Bowman, Kevin Fogarty and Lawrence Lifshitz for providing custom acquisition, visualization and analysis software and Jeffrey Carmichael for excellent technical assistance.
References
- Babcock DF, Herrington J, Goodwin PC, Park YB, Hille B. Mitochondrial participation in the intracellular Ca2+ network. Journal of Cell Biology. 1997;136:833–844. doi: 10.1083/jcb.136.4.833. [DOI] [PMC free article] [PubMed] [Google Scholar]
- Bassani JW, Bassani RA, Bers DM. Ca2+ cycling between sarcoplasmic reticulum and mitochondria in rabbit cardiac myocytes. The Journal of Physiology. 1993;460:603–621. doi: 10.1113/jphysiol.1993.sp019489. [DOI] [PMC free article] [PubMed] [Google Scholar]
- Bassani RA, Bassani JWM, Bers DM. Mitochondrial and sarcolemmal Ca2+ transport reduce [Ca2+]i during caffeine contractures in rabbit cardiac myocytes. The Journal of Physiology. 1992;453:591–608. doi: 10.1113/jphysiol.1992.sp019246. [DOI] [PMC free article] [PubMed] [Google Scholar]
- Benham CD, Tsien RW. A novel receptor-operated Ca2+-permeable channel activated by ATP in smooth muscle. Nature. 1987;328:275–278. doi: 10.1038/328275a0. [DOI] [PubMed] [Google Scholar]
- Berridge MJ. Inositol trisphosphate and calcium signalling. Nature. 1993;361:315–325. doi: 10.1038/361315a0. [DOI] [PubMed] [Google Scholar]
- Boitier E, Rea R, Duchen MR. Mitochondria exert a negative feedback on the propagation of intracellular Ca2+ waves in rat cortical astrocytes. Journal of Cell Biology. 1999;145:795–808. doi: 10.1083/jcb.145.4.795. [DOI] [PMC free article] [PubMed] [Google Scholar]
- Carrington WA, Fogarty KE, Fay FS. 3D fluorescence imaging of single cells using image restoration. In: Foster K, editor. Non-Invasive Techniques in Cell Biology. New York: Wiley-Liss; 1990. pp. 53–72. [Google Scholar]
- Cheng H, Lederer WJ, Cannell MB. Calcium sparks: elementary events underlying excitation-contraction coupling in heart muscle. Science. 1993;262:740–744. doi: 10.1126/science.8235594. [DOI] [PubMed] [Google Scholar]
- Crompton M, Moser R, Lüdi H, Carafoli E. The interactions between the transport of sodium and calcium in mitochondria of various mammalian tissues. European Journal of Biochemistry. 1978;82:25–31. doi: 10.1111/j.1432-1033.1978.tb11993.x. [DOI] [PubMed] [Google Scholar]
- Donnadieu E, Bourguignon LYW. Ca2+ signaling in endothelial cells stimulated by bradykinin: Ca2+ measurement in the mitochondria and the cytosol by confocal microscopy. Cell Calcium. 1996;20:53–61. doi: 10.1016/s0143-4160(96)90050-0. [DOI] [PubMed] [Google Scholar]
- Drummond RM, Fay FS. Mitochondria contribute to Ca2+ removal in smooth muscle cells. Pflügers Archiv. 1996;431:473–482. doi: 10.1007/BF02191893. [DOI] [PubMed] [Google Scholar]
- Drummond RM, Tuft RA. Release of Ca2+ from the sarcoplasmic reticulum increase mitochondrial [Ca2+] in rat pulmonary artery smooth muscle cells. The Journal of Physiology. 1999;516:139–147. doi: 10.1111/j.1469-7793.1999.139aa.x. [DOI] [PMC free article] [PubMed] [Google Scholar]
- Duchen MR, Leyssens A, Crompton M. Transient mitochondrial depolarizations reflect focal sarcoplasmic reticular calcium release in single rat cardiomyocytes. Journal of Cell Biology. 1998;142:975–988. doi: 10.1083/jcb.142.4.975. [DOI] [PMC free article] [PubMed] [Google Scholar]
- Duchen MR, Valdeolmillos M, O'Neill SC, Eisner DA. Effects of metabolic blockade on the regulation of intracellular calcium in dissociated mouse sensory neurones. The Journal of Physiology. 1990;424:411–426. doi: 10.1113/jphysiol.1990.sp018074. [DOI] [PMC free article] [PubMed] [Google Scholar]
- Ehrenberg B, Montana V, Wei M-D, Wuskell JP, Loew LM. Membrane potential can be determined in individual cells from Nernstian distribution of cationic dyes. Biophysical Journal. 1988;53:785–794. doi: 10.1016/S0006-3495(88)83158-8. [DOI] [PMC free article] [PubMed] [Google Scholar]
- Fabiato A. Appraisal of the physiological relevance of two hypothesis for the mechanism of calcium release from the mammalian cardiac sarcoplasmic reticulum: calcium-induced release versus charge-coupled release. Molecular and Cellular Biochemistry. 1989;89:135–140. doi: 10.1007/BF00220765. [DOI] [PubMed] [Google Scholar]
- Fay FS, Hoffman R, LeClair S, Merriam P. Preparation of individual smooth muscle cells from the stomach of Bufo marinus. Methods in Enzymology. 1982;85:284–292. doi: 10.1016/0076-6879(82)85027-1. [DOI] [PubMed] [Google Scholar]
- Friel DD, Tsien RY. An FCCP-sensitive Ca2+ store in bullfrog sympathetic neurons and its participation in stimulus-evoked changes in [Ca2+]i. Journal of Neuroscience. 1994;14:4007–4024. doi: 10.1523/JNEUROSCI.14-07-04007.1994. [DOI] [PMC free article] [PubMed] [Google Scholar]
- Greenwood IA, Heliwell RM, Large WA. Modulation of Ca2+-activated Cl− currents in rabbit portal vein smooth muscle by an inhibitor of mitochondrial Ca2+ uptake. The Journal of Physiology. 1997;505:53–64. doi: 10.1111/j.1469-7793.1997.053bc.x. [DOI] [PMC free article] [PubMed] [Google Scholar]
- Grynkiewicz G, Poenie M, Tsien RY. A new generation of Ca2+ indicators with greatly improved fluorescence properties. Journal of Biological Chemistry. 1985;260:3440–3450. [PubMed] [Google Scholar]
- Gunter TE, Pfeiffer DR. Mechanisms by which mitochondria transport calcium. American Journal of Physiology. 1990;258:C755–786. doi: 10.1152/ajpcell.1990.258.5.C755. [DOI] [PubMed] [Google Scholar]
- Hajnöczky G, Robb-Gaspers LD, Seitz MB, Thomas AP. Decoding of cytosolic calcium oscillations in the mitochondria. Cell. 1995;82:415–424. doi: 10.1016/0092-8674(95)90430-1. [DOI] [PubMed] [Google Scholar]
- Herrington J, Park YB, Babcock DF, Hille B. Dominant role of mitochondria in clearance of large Ca2+ loads from rat adrenal chromaffin cells. Neuron. 1996;16:219–228. doi: 10.1016/s0896-6273(00)80038-0. [DOI] [PubMed] [Google Scholar]
- Hess P. Ca2+ channels in vertebrate cells. Annual Review of Neuroscience. 1990;13:337–356. doi: 10.1146/annurev.ne.13.030190.002005. [DOI] [PubMed] [Google Scholar]
- Kamm KE, Stull JT. The function of myosin and myosin light chain kinase phosphorylation in smooth muscle. Annual Review of Pharmacology and Toxicology. 1985;25:593–620. doi: 10.1146/annurev.pa.25.040185.003113. [DOI] [PubMed] [Google Scholar]
- Karaki H, Weiss GB. Inhibitors of mitochondrial Ca2+ uptake dissociate potassium-induced tension responses from increased 45Ca retention in rabbit aortic smooth muscle. Blood Vessels. 1981;18:28–35. doi: 10.1159/000158335. [DOI] [PubMed] [Google Scholar]
- Lawrie AM, Rizzuto R, Pozzan T, Simpson AWM. A role for calcium influx in the regulation of mitochondrial calcium in endothelial cells. Journal of Biological Chemistry. 1996;271:10753–10759. doi: 10.1074/jbc.271.18.10753. [DOI] [PubMed] [Google Scholar]
- Loew LM, Carrington W, Tuft RA, Fay FS. Physiological cytosolic Ca2+ transients evoke concurrent mitochondrial depolarizations. Proceedings of the National Academy of Sciences of the USA. 1994;91:12579–12583. doi: 10.1073/pnas.91.26.12579. [DOI] [PMC free article] [PubMed] [Google Scholar]
- McCarron JG, Muir TC. Mitochondrial regulation of the cytosolic Ca2+ concentration and the InsP3-sensitive Ca2+ store in guinea-pig smooth muscle. The Journal of Physiology. 1999;516:149–161. doi: 10.1111/j.1469-7793.1999.149aa.x. [DOI] [PMC free article] [PubMed] [Google Scholar]
- McCarron JG, Walsh JV, Jr, Fay FS. Sodium/calcium exchange regulates cytoplasmic calcium in smooth muscle cells. Pflügers Archiv. 1994;426:199–205. doi: 10.1007/BF00374772. [DOI] [PubMed] [Google Scholar]
- McCormack JG, Halestrap AP, Denton RM. Role of calcium ions in regulation of mammalian intramitochondrial metabolism. Physiological Reviews. 1990;70:391–425. doi: 10.1152/physrev.1990.70.2.391. [DOI] [PubMed] [Google Scholar]
- McGeown JG, Drummond RM, McCarron JG, Fay FS. The temporal profile of calcium transients in voltage clamped gastric myocytes from Bufo marinus. The Journal of Physiology. 1996;497:321–336. doi: 10.1113/jphysiol.1996.sp021771. [DOI] [PMC free article] [PubMed] [Google Scholar]
- McGeown JG, McCarron JG, Drummond RM, Fay FS. Calcium-calmodulin-dependent mechanisms accelerate calcium decay in gastric myocytes from Bufo marinus. The Journal of Physiology. 1998;506:95–107. doi: 10.1111/j.1469-7793.1998.095bx.x. [DOI] [PMC free article] [PubMed] [Google Scholar]
- Missiaen L, Wuytack F, Raemaekers L, van Smedt H, Droogmans G, Declerc I, Casteels R. Ca2+ extrusion across the plasma membrane and Ca2+ uptake by intracellular stores. Pharmacology and Therapeutics. 1991;50:191–232. doi: 10.1016/0163-7258(91)90014-d. [DOI] [PubMed] [Google Scholar]
- Mix TCH, Drummond RM, Tuft RA, Fay FS. Mitochondria in smooth muscle cells sequester Ca2+ following stimulation of cell contraction. Biophysical Journal. 1994;66:A97. [Google Scholar]
- Mlinar B, Fay FS. Recording of free calcium and magnesium in intracellular stores in patch clamped smooth muscle cells. Biophysical Journal. 1995;68:A113. [Google Scholar]
- Monteith GR, Blaustein MP. Heterogeneity of mitochondrial matrix free Ca2+: resolution of Ca2+ dynamics in individual mitochondria in situ. American Journal of Physiology. 1999;276:C1193–1204. doi: 10.1152/ajpcell.1999.276.5.C1193. [DOI] [PubMed] [Google Scholar]
- Moore EDW, Etter EF, Philipson KD, Carrington WA, Fogarty KE, Lifshitz LM, Fay FS. Coupling of the Na+/Ca2+ exchanger, Na+/K+ pump and sarcoplasmic reticulum in smooth muscle. Nature. 1993;365:657–660. doi: 10.1038/365657a0. [DOI] [PubMed] [Google Scholar]
- Nakanishi S, Kakita S, Takahashi I, Kawahara K, Tsukuda E, Sano T, Yamada K, Yoshida M, Kase H, Matsuda Y. Wortmannin, a microbial product inhibitor of myosin light chain kinase. Journal of Biological Chemistry. 1992;267:2157–2163. [PubMed] [Google Scholar]
- Nixon GF, Mignery GA, Somlyo AV. Immunogold localization of inositol 1,4,5-trisphosphate receptors and characterization of ultrastructural features of the sarcoplasmic reticulum in phasic and tonic smooth muscle. Journal of Muscle Research and Cell Motility. 1994;15:682–700. doi: 10.1007/BF00121075. [DOI] [PubMed] [Google Scholar]
- Rizzuto R, Brini M, Murgia M, Pozzan T. Microdomains with high Ca2+ close to IP3-sensitive channels that are sensed by neighboring mitochondria. Science. 1993;262:744–747. doi: 10.1126/science.8235595. [DOI] [PubMed] [Google Scholar]
- Rizzuto R, Pinton P, Carrington W, Fay FS, Fogarty KE, Lifshitz LM, Tuft RA, Pozzan T. Close contacts with the endoplasmic reticulum as determinants of mitochondrial Ca2+ responses. Science. 1998;280:1763–1766. doi: 10.1126/science.280.5370.1763. [DOI] [PubMed] [Google Scholar]
- Rizzuto R, Simpson AWM, Brini M, Pozzan T. Rapid changes of mitochondrial Ca2+ revealed by specifically targeted recombinant aequorin. Nature. 1992;358:325–327. doi: 10.1038/358325a0. [DOI] [PubMed] [Google Scholar]
- Rutter GA, Burnett P, Rizzuto R, Brini M, Murgia M, Pozzan T, Tavare JM, Denton RM. Subcellular imaging of intramitochondrial Ca2+ with recombinant targeted aequorin: significance for the regulation of pyruvate dehydrogenase activity. Proceedings of the National Academy of Sciences of the USA. 1996;93:5489–5494. doi: 10.1073/pnas.93.11.5489. [DOI] [PMC free article] [PubMed] [Google Scholar]
- Sheu S-S, Jou MJ. Mitochondrial free Ca2+ concentration in living cells. Journal of Bioenergetics and Biomembranes. 1994;26:487–493. doi: 10.1007/BF00762733. [DOI] [PubMed] [Google Scholar]
- Somlyo AV, Bond M, Somlyo AP, Scarpa A. Inositol trisphosphate-induced calcium release and contraction in vascular smooth muscle. Proceedings of the National Academy of Sciences of the USA. 1985;82:5231–5235. doi: 10.1073/pnas.82.15.5231. [DOI] [PMC free article] [PubMed] [Google Scholar]
- Somlyo AP, Somlyo AV, Shuman H. Electron probe analysis of vascular smooth muscle. Composition of mitochondria, nuclei and cytoplasm. Journal of Cell Biology. 1979;81:316–335. doi: 10.1083/jcb.81.2.316. [DOI] [PMC free article] [PubMed] [Google Scholar]
- Sparagna GC, Gunter KK, Sheu S-S, Gunter TE. Mitochondrial calcium uptake from physiological-type pulses of calcium. A description of the rapid uptake mode. Journal of Biological Chemistry. 1995;270:27510–27515. doi: 10.1074/jbc.270.46.27510. [DOI] [PubMed] [Google Scholar]
- Thayer SA, Miller RJ. Regulation of the intracellular free calcium concentration in single rat dorsal root ganglion neurones in vitro. The Journal of Physiology. 1990;425:85–115. doi: 10.1113/jphysiol.1990.sp018094. [DOI] [PMC free article] [PubMed] [Google Scholar]
- Trollinger DR, Cascio WE, Lemasters JJ. Selective loading of Rhod 2 into mitochondria shows mitochondrial Ca2+ transients during the contractile cycle in adult rabbit cardiac myocytes. Biochemical and Biophysical Research Communications. 1997;236:738–742. doi: 10.1006/bbrc.1997.7042. [DOI] [PubMed] [Google Scholar]
- ZhuGe R, Tuft RA, Fogarty KE, Bellvé K, Fay FS, Walsh JV., Jr The influence of sarcoplasmic reticulum Ca2+ concentration on Ca2+ sparks and spontaneous transient outward currents in single smooth muscle cells. Journal of General Physiology. 1999;113:215–228. doi: 10.1085/jgp.113.2.215. [DOI] [PMC free article] [PubMed] [Google Scholar]