Abstract
We measured activity-dependent changes in [K+]o with K+-selective microelectrodes in adult rat optic nerve, a CNS white matter tract, to investigate the factors responsible for post-stimulus recovery of [K+]o.
Post-stimulus recovery of [K+]o followed a double-exponential time course with an initial, fast time constant, τfast, of 0.9 ± 0.2 s (mean ±s.d.) and a later, slow time constant, τslow, of 4.2 ± 1 s following a 1 s, 100 Hz stimulus. τfast, but not τslow, decreased with increasing activity-dependent rises in [K+]o. τslow, but not τfast, increased with increasing stimulus duration.
Post-stimulus recovery of [K+]o was temperature sensitive. The apparent temperature coefficients (Q10, 27–37°C) for the fast and slow components following a 1 s, 100 Hz stimulus were 1.7 and 2.6, respectively.
Post-stimulus recovery of [K+]o was sensitive to Na+ pump inhibition with 50 μM strophanthidin. Following a 1 s, 100 Hz stimulus, 50 μM strophanthidin increased τfast and τslow by 81 and 464%, respectively. Strophanthidin reduced the temperature sensitivity of post-stimulus recovery of [K+]o.
Post-stimulus recovery of [K+]o was minimally affected by the K+ channel blocker Ba2+ (0.2 mm). Following a 10 s, 100 Hz stimulus, 0.2 mm Ba2+ increased τfast and τslow by 24 and 18%, respectively.
Stimulated increases in [K+]o were followed by undershoots of [K+]o. Post-stimulus undershoot amplitude increased with stimulus duration but was independent of the peak preceding [K+]o increase.
These observations imply that two distinct processes contribute to post-stimulus recovery of [K+]o in central white matter. The results are compatible with a model of K+ removal that attributes the fast, initial phase of K+ removal to K+ uptake by glial Na+ pumps and the slower, sustained decline to K+ uptake via axonal Na+ pumps.
The classic work of Frankenhaeuser & Hodgkin (1956) introduced the concept that potassium ions leaving axons during the repolarising phase of an action potential accumulate in the extracellular space (ECS) to an appreciable extent. Numerous studies have since demonstrated that extracellular accumulation of K+ during physiological (Orkand et al. 1966; Kelly & van Essen, 1974; Singer & Lux, 1975) or electrical stimulation (Lux & Neher, 1973; Connors et al. 1982) is a universal property of nervous tissue and other excitable tissues (Morad, 1980; Katz & Miledi, 1982; for review, see Newman, 1995). In non-myelinated invertebrate nerve fibres, a single action potential is believed to increase the extracellular K+ concentration, [K+]o, by ∼0.8-1 mM (Frankenhaeuser & Hodgkin, 1956; Baylor & Nicholls, 1969) and this may be much larger in myelinated mammalian nerve fibres (Chiu, 1991). [K+]o affects the resting potentials of both glia and neurones, synaptic transmission (Poolos & Koscis, 1990; Szatkowski et al. 1990), cerebral blood flow (Knot et al. 1996), energy metabolism (Salem et al. 1975; Lewis & Schuette, 1975a), and intracellular and extracellular pH (Pappas & Ransom, 1994; Rose & Deitmer, 1994). Tight regulation of brain [K+]o therefore is of paramount importance for normal electrical signalling and to avoid potential pathologies.
The optic nerve has been a valuable preparation for studying activity-dependent changes in the ECS, as these are uncomplicated by the presence of synapses in this simple structure that is composed of only axons and glia (Ransom & Orkand, 1996). In the developing rat optic nerve, dramatic changes in the effects of electrical stimulation on the ECS occur during the first two postnatal weeks: the size of [K+]o transients is reduced, [K+]o transients are evoked only with greater intensity stimuli, and activity-dependent shrinkage of the ECS develops (Connors et al. 1982; Ransom et al. 1985). The time course of these changes in the effects of electrical stimulation on the dimensions and ionic composition of the ECS of rat optic nerve parallels gliogenesis in this structure. Thus, powerful mechanisms for limiting activity-dependent changes in [K+]o appear concomitantly with glial cells.
Neurones and axons that lose K+ to the ECS must eventually recover this K+ and are believed to do so via their Na+,K+-ATPase. Glial cells possess a variety of mechanisms that allow them to transiently accumulate K+ intracellularly or redistribute it throughout the ECS following a volley of action potentials (Ballanyi, 1995; Newman, 1995). However, the relative contribution of these glial mechanisms to [K+]o regulation in brain, and their importance relative to neuronal/axonal K+ uptake, has not been firmly established. In the present study, we measured activity-dependent changes in [K+]o with K+-selective microelectrodes to investigate the processes responsible for the rapid recovery of [K+]o following electrical stimulation of adult (> 30 days old) rat optic nerve. Of primary interest was the relative role of energy-dependent versus passive processes in influencing post-stimulus recovery of [K+]o, assessed by varying the temperature of nerves. We present and discuss data that suggest multiple mechanisms contribute to post-stimulus recovery of [K+]o. Specifically, the Na+,K+-ATPases of both glia and axons contribute to the recovery of activity-dependent increases in [K+]o with the glial uptake establishing the initial, rapid fall in [K+]o and the axonal uptake dominating during the later, slower period of post-stimulus recovery of [K+]o.
METHODS
Optic nerve preparation
Optic nerves were obtained from male Long-Evans rats aged 31–99 days. The majority of the data was obtained from rats aged 40–60 days. Rats were rendered unconscious with an 80 % CO2- 20 % O2 mixture in a modified cage prior to decapitation with a small-animal guillotine (Harvard Instruments, Cambridge, MA, USA). Brains were dissected from the skull and the optic nerves were removed at the chiasm, immediately placed in a brain-slice interface chamber (Medical Systems, Greenvale, NY, USA) and superfused with artificial cerebrospinal fluid (ACSF, see below) in a humidified atmosphere of 95 % O2-5 % CO2 gas. The ends of the nerve were trimmed and the dura and superficial arachnoid membranes were removed. The spare nerve was stored at room temperature (typically 23°C) in a brain slice pre-chamber (Medical Systems) containing ACSF bubbled with 95 % O2-5 % CO2 for later use. All experiments were carried out within the guidelines of the Institutional Animal Care and Use Committee of the University of Alabama, Birmingham (animal protocol no. 990703775).
The temperature of the brain-slice interface chamber was monitored with a thermistor and controlled by a TC-102 temperature controller (Medical Systems) that warmed the water jacket of the interface chamber until the temperature measured at the thermistor, located near the nerve in the recording chamber, reached its set point. Temperature changes from 27 to 37°C were complete within 15 min. Calibration and testing of this thermistor showed temperature measurements to be accurate within ±0.4°C.
Solutions
Nerves were constantly superfused with ACSF of the following composition (mM): 3 KCl, 124 NaCl, 2 CaCl2, 2 MgSO4, 1.25 NaH2PO4, 10 glucose, 24 NaHCO3. This ACSF had an osmolarity of ∼300 mosmol l−1. NaH2PO4 was omitted from Ba2+-containing solutions to avoid precipitation. Experimental solutions containing 50–3000 μM strophanthidin or 200 μM BaCl2 were not corrected for osmolarity. All chemicals were purchased from Sigma unless otherwise specified.
Electrophysiology
Two suction electrodes were employed to stimulate the nerve as a whole and record the compound action potential), as previously described (Stys, 1993). Suction electrodes were constructed from 50 μl glass pipettes (Drummond Scientific, Broomall, PA, USA) and filled with ACSF. An isolated pulse stimulator (model 2100, A-M systems, Carlsborg, WA, USA) was used to deliver trains of uniphasic 50 μs stimuli to the nerve via a bipolar suction electrode. Stimulus intensity was adjusted to produce the largest possible compound action potential and then increased by 25 % to ensure ‘supramaximal’ stimulation. The recording suction electrode was double barrelled to allow subtraction of the stimulus artefact. The stimulus artefact was subtracted and the compound action potential signal amplified 10 times with a DAM-50 DC amplifier (WPI, Sarasota, FL, USA). This signal was further amplified 100 times with an instrumentation amplifier (Brown-Lee Precision Instruments, Santa Clara, CA, USA) to maximise the use of the dynamic range of our acquisition system. Data were recorded on line with an IBM-compatible PC (Gateway, Sioux City, ND, USA) running Axon Instruments software (Axotape 2) using a TL-1 A-D interface board (Axon Instruments). Ion-sensitive electrode data were acquired at 200 Hz and low-pass filtered at 50 Hz. Compound action potential data were acquired at 30 kHz and filtered at 10 kHz.
Ion-sensitive microelectrodes
Ion-sensitive microelectrodes were fabricated from double-barrelled pipette glass (PB150F-6, WPI) pulled to a combined tip diameter of ∼1 μm with a Narishige vertical pipette puller (PP-83, Narishige Instruments, Tokyo, Japan). The ion-sensitive barrel was silanised by overnight exposure to vapours of dimethylsilazane (Fluka Chemie, Buchs, Switzerland). The reference barrel was backfilled with Hepes-buffered 150 mM NaCl solution (pH 7.4) and the ion-sensitive barrel was backfilled with 100 mM KCl. Silanisation prevented the solution from filling the tip of the ion-sensitive barrel so positive pressure was applied to the back of this barrel while the tip was bevelled using a micropipette beveller (Sutter Instruments, San Francisco, CA, USA) until solution could be seen to fill the tip. These pipettes had a combined tip diameter of < 3 μm after bevelling. Bevelling the pipettes produced a sharp tip, which eased the impalement of rat optic nerves. Finally, the ion-sensitive barrel was front-filled with a 100–150 μm column of a valinomycin-based K+ ion-exchanger resin (potassium ionophore 1-cocktail B, Fluka Chemie). Ag-AgCl wires were introduced into both barrels and held in place with wax. These wires were connected to the headstages of an Axoprobe intracellular amplifier (Axon Instruments). Data were recorded directly to disk with the acquisition system detailed above. Electrodes were calibrated using a two-point calibration with solutions containing 150 mM NaCl and 3 or 30 mM KCl before and after experiments (the final calibration was used to convert voltage to K+ activity). Electrodes used in experiments displayed voltage responses of 50–59 mV per decade increase in K+ concentration. Response times of four typical electrodes were determined in detail using an array of gravity-fed flow pipes mounted on a piezoelectric fast application device (courtesy of Dr Robin A. J. Lester) which gave 20–80 % solution exchange in < 100 μs (Lester & Jahr, 1992). The electrodes were placed in the line of the control flow pipe containing 3 mM KCl followed by fast application of 30 mM KCl solution (Fig. 1). All electrodes tested in this manner displayed 90 % response times of < 100 ms.
Figure 1. Response of a representative K+-selective microelectrode to a rapid change in [K+].
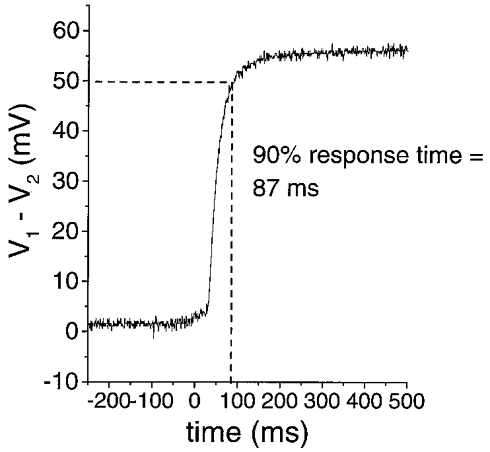
Continuously flowing solutions from an array of two flow pipes bathed the electrode tip. A piezoelectric device stepped the flow pipe bathing the electrode tip from one containing a solution with 3 mM KCl to one containing a solution with 30 mM KCl. Both solutions contained 150 mM NaCl. All electrodes tested in this manner (n = 4) had 90 % response times < 100 ms. These experiments were done at room temperature (≈23 °C). The ordinate is the difference between the ion-sensitive barrel, V1, and the reference barrel, V2, of the double-barrelled ion-sensitive electrode.
Analysis
Data were analysed off-line using the graphical analysis software Origin (version 4.0, Microcal Software, Northampton, MA, USA). The voltage signal from K+-selective electrodes was converted to potassium activity (mM) using the following relationship (Carlini & Ransom, 1990):
where aKe is the extracellular K+ activity, 3 represents the K+ concentration (mM) at 0 mV, Velec is the subtracted K+-selective electrode potential, and Slope is the voltage change per decade increase in K+ concentration. Although we are strictly measuring K+ activity with our electrodes, we use the terms activity and concentration interchangeably (as well as the abbreviations aKe and [K+]o).
Because we were mainly interested in processes involved in the removal of accumulated potassium ions following stimulation we chose to analyse in detail the post-stimulus decay from peak [K+]o accumulation to the trough of the undershoot. This portion of the data was fitted using a least-squares fitting routine to either a first- or second-order exponential function of the form:
where A1 and A2 are the starting amplitudes of each exponential. The computer-generated parameters of these fits were recorded in a spreadsheet for further analysis (Excel, Microsoft Software, Bellevue, WA, USA). Since our aKe records often had a transient artefact at the cessation of the stimulus train, care was taken not to include this portion of the curve in our analysis.
Statistics
Data were examined for statistical significance using Student's two-tailed t test with an alpha value of P < 0.01. Statistical analysis was performed using Excel.
RESULTS
Over 50 rat optic nerves from animals aged 31–99 days were impaled with K+-selective microelectrodes and the records from 35 of these nerves were analysed in detail. The average peak change in [K+]o (Δ[K+]o) of 3.1 ± 1 mM (these and subsequent values given as means ±s.d.) seen with 10 s, 100 Hz supramaximal stimulus trains is in excellent agreement with values previously reported for adult rat optic nerve by Connors et al. (1982), although the absolute values differ since their study used ACSF containing 5 mM K+ while our ACSF contained 3 mM K+.
The time course of decay of stimulus-evoked increases in [K+]o
In this study we were primarily interested in those processes returning [K+]o to its resting value after a volley of action potentials. Therefore, we analysed the decay phase of activity-dependent extracellular K+ accumulation in detail (see Fig. 2). We define the decay phase of [K+]o accumulation as the time period beginning at the end of a stimulus train and ending when [K+]o fell to its lowest value; often this was during an undershoot period. As previously described (Connors et al. 1982; Forstl et al. 1982), activity-dependent increases in [K+]o recovered over a period of 10–30 s and often undershot the baseline level (Fig. 2B).
Figure 2. Recovery of [K+]o increase following a stimulus train in rat optic nerve follows a double-exponential time course.
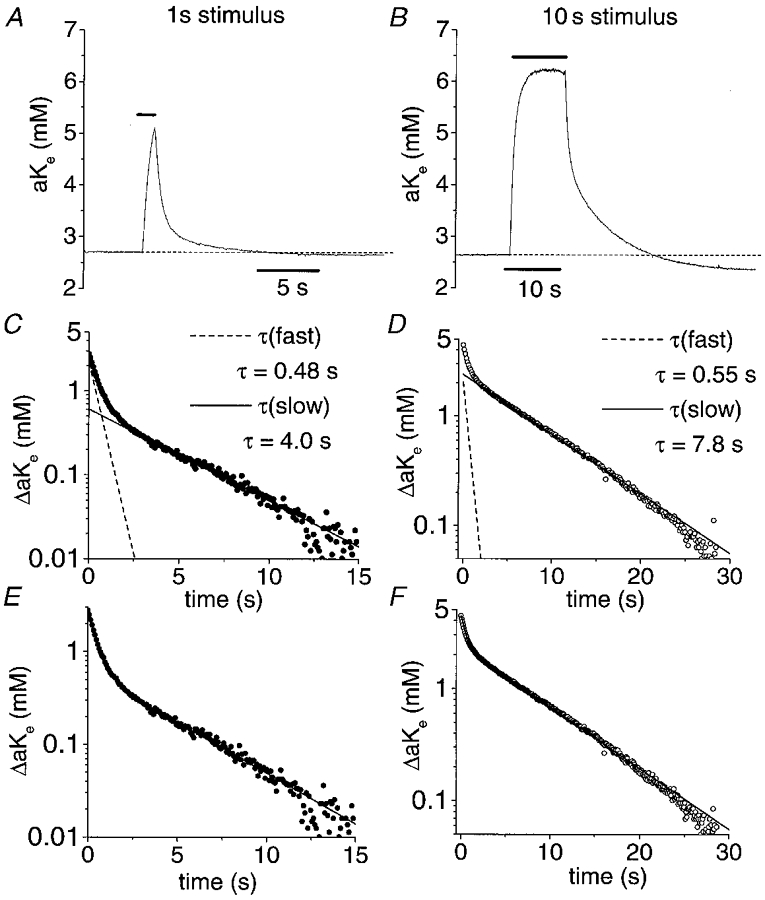
A, change in [K+]o following a 1 s stimulus train at 100 Hz (temperature, 37 °C). The horizontal bars indicate the period of stimulation in this and subsequent figures. B, change in [K+]o following a 10 s stimulus train at 100 Hz. C, semilogarithmic plot of the decay phase of a representative [K+]o transient following a 1 s, 100 Hz stimulus (•; from the data in A). Two distinct phases of [K+]o decline can be seen: an early, rapid decline and a later, slower decline. Two exponential components contribute to this decay and are plotted individually with the data. The decay phase has a fast time constant, τfast, of 0.48 s and a slow time constant, τslow, of 4.0 s following a 1 s stimulus. D, semilogarithmic plot of the decay phase of an [K+]o transient following a 10 s, 100 Hz stimulus (○; from the data in B). As with the decline of [K+]o following a 1 s stimulus, the [K+]o decay following a 10 s stimulus consisted of two components (individually illustrated as in C). τfast was 0.55 s and τslow was 7.8 s. The starting amplitude of τfast was relatively invariant as stimulus duration was increased from 1 to 10 s while the starting amplitude of τslow increased; the relative amplitude of τslow in the fits to the data in C and D was 0.25 and 0.55, respectively. E, semilogarithmic plot of the decay phase from the data illustrated in A. The sum (continuous line) of the individual components illustrated in C provides an excellent fit of the data. F, semilogarithmic plot of the decay phase from the data illustrated in B. The sum of the individual components illustrated in D (continuous line) provides an excellent fit of the data. The number of data points in the decay phase plots (C–F) has been reduced for clarity in this and subsequent figures.
In adult rat optic nerve, the recovery of [K+]o had two phases. There was a brief, initial phase during which [K+]o fell rapidly, followed by a second, more prolonged phase during which [K+]o fell more slowly. These phases were discernible by inspection and could be deconvoluted by curve-fitting techniques (see below). The half-times, t½, for K+ removal (measured at the midpoint from peak accumulation to the trough of the undershoot) were 1.4 ± 0.8 s (n = 33) and 2.9 ± 2 s (n = 35) for a 1 s and a 10 s stimulus train (100 Hz), respectively. On average, the inflection point in the fall of [K+]o which marked the shift from fast to slow [K+]o decline occurred after a greater than 50 % fall in peak [K+]o for the 1 s stimulus train and after a slightly less than 50 % fall in [K+]o for the 10 s stimulus train. Thus, 50 % of the accumulated potassium ions were apparently cleared in the initial phase of decay during a period of only a few seconds. The second half of K+ decay was considerably slower. The times from half-maximal decay to the trough of the undershoot, t–t½, were 10.3 ± 4 s (n = 33) and 21 ± 10 s (n = 35) for a 1 s, 100 Hz and a 10 s, 100 Hz stimulus, respectively. On average, the overall rate of decay of a K+ transient evoked by a 1 s stimulus at 37°C was 0.12 ± 0.07 mM s−1. During the first half of the decay phase, the rate of K+ decline was 0.78 ± 0.7 mM s−1 and during the second half it was 0.061 ± 0.04 mM s−1 following a 1 s, 100 Hz stimulus. Thus, the rate constant of [K+]o decline during the first half of the decay of a K+ transient was approximately 10-fold faster than during the second half.
To more accurately determine the time course of K+ recovery the decay phase was plotted on a semilogarithmic plot and fitted with exponential decay functions using a least-squares fitting routine (Fig. 2C and D; see Methods). The non-linearity of these curves is readily apparent from examination of the representative examples given in Fig. 2C and D. These curves were better described by the sum of two exponential functions. The two components of these fits are displayed individually in Fig. 2C and D for a 1 s and 10 s stimulus, respectively. At 37°C, these fits suggested that post-stimulus recovery of [K+]o had a fast time constant, τfast, of 0.89 ± 0.2 and 1.1 ± 1 s and a slow time constant, τslow, of 4.2 ± 1 and 6.8 ± 1 s for a 1 s and 10 s stimulus, respectively. The presence of two components tended to be more obvious following a 1 s stimulus than a 10 s stimulus. The 90 % response times of our K+-selective electrodes were much faster than our measured time constants so an artefactual source of two rates of [K+]o decline related to our electrodes is unlikely.
Figure 3 illustrates the relationship of τfast and τslow to the magnitude of activity-dependent changes in [K+]o and stimulus duration. τfast was dependent on the magnitude of [K+]o transients but was relatively independent of stimulus duration. τfast became shorter as peak [K+]o increased (Fig. 3B). Conversely, τslow increased with increasing stimulus duration but was minimally dependent on the magnitude of [K+]o transients.
Figure 3. Relationship of the time constants for the two components of [K+]o recovery, τfast and τslow, to the magnitude of activity-dependent changes in [K+]o and to stimulus duration.
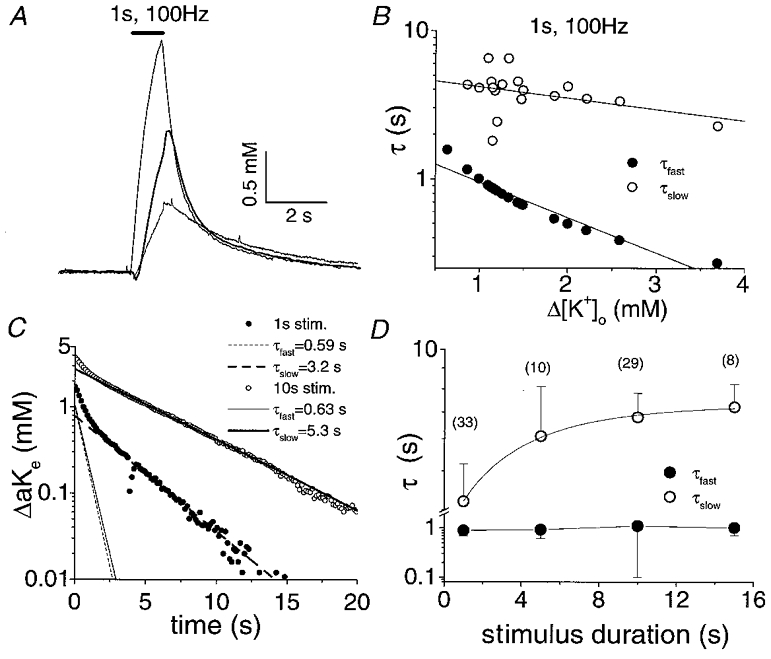
A, [K+]o transients from three different nerves in response to a 1 s, 100 Hz stimulus at 37 °C. The early phase of [K+]o recovery accelerates with increases in the size of the evoked [K+]o increase. B, time constants of [K+]o recovery from 21 nerves following a 1 s, 100 Hz stimulus plotted against the peak increase in [K+]o produced with each stimulus. τfast became shorter as a function of Δ[K+]o. The linear fit to τfast had a slope of −0.24 with a regression coefficient of 0.96. τslow was minimally affected by the magnitude of Δ[K+]o. The linear fit to τslow had a slope of −0.08 with a regression coefficient of 0.38. C, decay phases of [K+]o following a 1 s (•) and a 10 s (○) stimulus train from a representative nerve. Simulations of the individual exponential components of post-stimulus recovery of [K+]o are plotted on the same graph. The amplitude and τ of the fast component, but not the slow component, were unaffected by stimulus duration. D, time constants of [K+]o recovery (means ±s.d.) versus stimulus duration. τslow increased with stimulus duration but τfast was relatively invariant. Numbers in parentheses indicate the number of nerves each data point represents.
Temperature sensitivity of K+ clearance
To evaluate the contribution of energy-dependent processes to post-stimulus recovery of [K+]o, we recorded [K+]o transients at 37 and 27°C (see Fig. 4 and Table 1). The temperature was altered and monitored as described in Methods. Baseline and peak [K+]o were elevated at the lower temperature and the rate of recovery was slowed. To quantify the temperature effect we calculated temperature coefficients (Q10 values) for the time constants of [K+]o recovery. Q10 values greater than 2 are generally accepted to indicate an energy-dependent process. For comparison, the Q10 for the diffusion of K+ in free solution is 1.3 (Stein, 1967), for the conductance of inwardly rectifying K+ channels it is 1.4 (Ohmori, 1978), and for active K+ uptake in squid giant axons it is 3.3 (Hodgkin & Keynes, 1955).
Figure 4. Evoked increases in [K+]o and their subsequent decay are temperature sensitive.
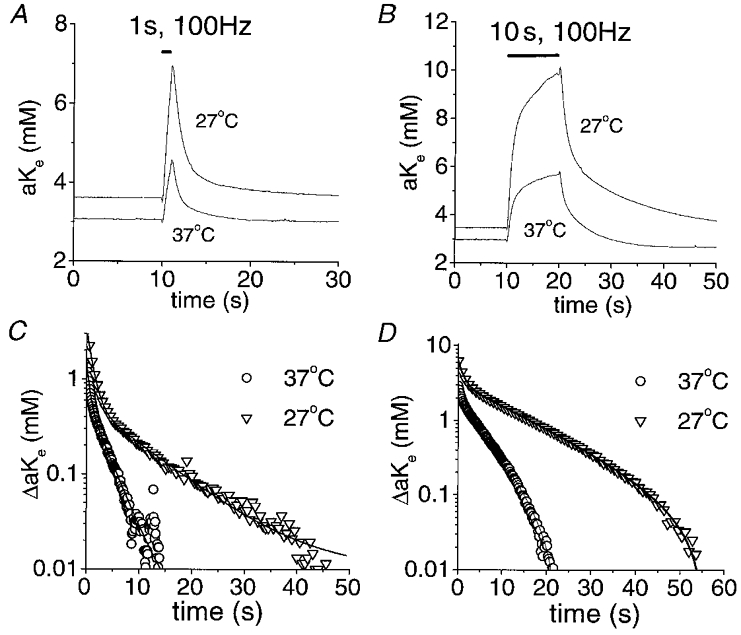
A, [K+]o transients in response to a 1 s, 100 Hz stimulus train at 37 and 27 °C. B, [K+]o transients in response to a 10 s, 100 Hz stimulus train at 37 and 27 °C. Temperature changes were complete in 15–20 min and were reversible. C, semilogarithmic plot of the decay phase of the [K+]o transients from A. Continuous lines represent the sum of two exponential functions (as in Fig. 2). The time constants of [K+]o recovery were determined from these computer-generated fits as in Fig. 2. The Q10 was calculated as Q10=τ27 °C/τ37 °C. The apparent Q10 values in this nerve were 1.9 and 3.3 following a 1 s stimulus for the fast and slow component, respectively. D, semilogarithmic plot of the decay phase of the [K+]o transients from B. The apparent Q10 values in this nerve were 1.7 and 2.5 following a 10 s stimulus for the fast and slow component, respectively.
Table 1.
Parameters of [K+]o transients evoked by a 1 and 10 s stimulus train (100 Hz) at 37 and 27 °C
| Baseline (mM) | Peak (mM) | τfast (s) | τslow (s) | n | |
|---|---|---|---|---|---|
| 1 s, 100 Hz | |||||
| 37 °C | 3.1 ± 0.4 | 4.1 ± 0.5 | 0.89 ± 0.2 | 4.2 ± 1 | 33 |
| 27 °C | 3.5 ± 0.4 | 4.9 ± 0.8 | 1.4 ± 0.4 | 9.4 ± 2 | 25 |
| 10 s, 100 Hz | |||||
| 37 °C | 3 ± 0.4 | 6.0 ± 1 | 1.1 ± 1 | 6.8 ± 1 | 35 |
| 27 °C | 3.6 ± 0.6 | 7.4 ± 1 | 1.9 ± 1 | 14 ± 3 | 31 |
Values are given as means ±s.d.
The apparent mean Q10 values of post-stimulus recovery of [K+]o following a 1 s, 100 Hz stimulus were 1.7 ± 0.3 and 2.6 ± 0.5 for τfast and τslow, respectively (n = 20, means calculated with the Q10 of each nerve). This result can be qualitatively appreciated by examining Fig. 4C and D. It is apparent that the later phase of post-stimulus recovery of [K+]o, dominated by τslow, was affected to a greater extent by temperature than the early phase. For both 1 s and 10 s stimulus trains the apparent Q10 of τslow was greater than that of τfast in 30/31 and 32/34 experiments, respectively. The apparent mean Q10 for the slow component of greater than 2 suggests that it reflects a highly energy-dependent process while the fast component is less energy dependent. The effects of temperature on the individual time constants of post-stimulus recovery of [K+]o are graphically summarised in Fig. 5. Results were not appreciably different whether the experiment was begun at 37 or 27°C. Therefore, these data have been combined to generate the mean values in Table 1 and Fig. 5.
Figure 5. Summary of the effects of temperature on the mean time constants of the fast and slow components of [K+]o decline following a 1 s (A) and 10 s (B) stimulus train (100 Hz).
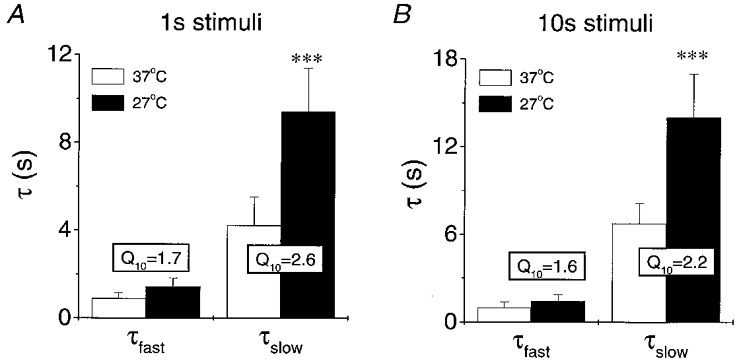
Asterisks indicate statistical significance with P = 0.001. Mean Q10 values calculated for each nerve are also presented.
Strophanthidin-sensitivity of K+ clearance
Expression of the α-subunits of the Na+ pump differs between glia and axons in the rat optic nerve and these different α-subunit types vary in their sensitivity to cardiac glycoside (CG) inhibitors of the Na+,K+-ATPase, such as ouabain and strophanthidin (Sweadner, 1979; McGrail & Sweadner, 1989). The axons of rat optic nerve express α-subunits with a high CG affinity (α3, K0.5= 3 × 10⁻⁸ M) and astrocytes express α-subunits with low and intermediate CG affinities (α1 and α2 with K0.5 values of 3 × 10⁻⁵ and 10−7 M, respectively) (Sweadner, 1995). In addition, 50 μM strophanthidin completely eliminates slow, post-tetanic hyperpolarisations, an axonal response, in rat optic nerves (Gordon et al. 1990). Thus, at 50 μM, strophanthidin would be predicted to produce near-maximal inhibition of α3-containing axonal Na+ pumps and α2-containing glial Na+ pumps while α1-containing glial Na+ pumps would be relatively unaffected. Superfusing nerves with 50 μM strophanthidin increased baseline [K+]o and the peak of [K+]o transients within 5 min. The most dramatic effect was a slowing of the post-stimulus recovery of [K+]o (see Fig. 6 and Table 2). As was the case with experiments with lowered temperature, τslow was affected to a greater extent by 50 μM strophanthidin than τfast. For the data illustrated in Fig. 6A and C, the time constants of post-stimulus recovery of [K+]o were 0.6 and 3.4 s under control conditions and 1.1 and 14.2 s in the presence of 50 μM strophanthidin for τfast and τslow, respectively. Thus, 50 μM strophanthidin resulted in an approximately 2-fold increase in τfast and an approximately 4.5-fold increase in τslow. Because τfast would be predicted to decrease with the increased peak [K+]o caused by strophanthidin (Table 2), the increase in τfast is probably an underestimate. Strophanthidin effects were poorly or not at all reversible during our experiments.
Figure 6. Effects of strophanthidin on post-stimulus recovery of [K+]o.
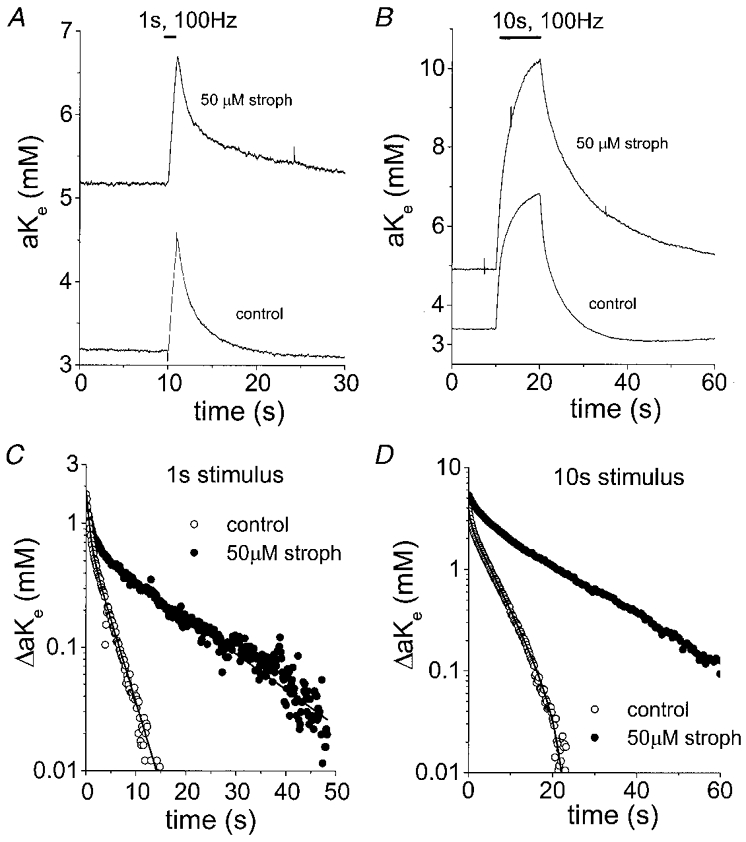
A, [K+]o transients following a 1 s, 100 Hz stimulus at 37 °C under control conditions and after superfusing the nerve with 50 μM strophanthidin for 5 min. The baseline [K+]o was increased from ≈3.2 to ≈5.2 mM and the rate of recovery was reduced. B, [K+]o transients in response to a 10 s, 100 Hz stimulus in the same nerve as in A before and after superfusion with 50 μM strophanthidin. The change in [K+]o produced with identical stimuli went from 3.5 mM under control conditions to > 5 mM in 50 μM strophanthidin. C, semilogarithmic plot of the decay phase of [K+]o from the records in A (1 s, 100 Hz stimulus). The time constants of [K+]o recovery were 0.6 and 3.4 s under control conditions and 1.1 and 14.2 s in the presence of 50 μM strophanthidin for τfast and τslow, respectively. D, semilogarithmic plot of the decay phase of the [K+]o transients from B (10 s, 100 Hz stimulus). The time constants of [K+]o recovery were 0.65 and 5.3 s under control conditions and 3.0 and 18.3 s in the presence of 50 μM strophanthidin for τfast and τslow, respectively. The later phase of post-stimulus recovery of [K+]o was affected to a greater extent by 50 μM strophanthidin than the early phase following stimuli of both durations.
Table 2.
Parameters of [K+]o transients evoked by 1 and 10 s stimulus trains (100 Hz) in nerves exposed to 50 μM strophanthidin
| Baseline (mM) | Peak (mM) | τfast (s) | τslow (s) | n | |
|---|---|---|---|---|---|
| 1 s, 100 Hz | |||||
| 37 °C | 3.2 ± 0.5 | 4.5 ± 0.5 | 0.88 ± 0.5 | 3.9 ± 1 | 8 |
| 37 °C, 50 μM strophanthidin | 4.5 ± 0.8 | 6.0 ± 2 | 1.6 ± 0.7 | 22 ± 2 | 8 |
| 27 °C, 50 μM strophanthidin | 4.7 ± 0.6 | 6.1 ± 0.3 | 2.0 ± 0.2 | 27 ± 14 | 6 |
| 10 s, 100 Hz | |||||
| 37 °C | 3.1 ± 0.4 | 5.7 ± 1 | 1.1 ± 0.5 | 6.8 ± 2 | 8 |
| 37 °C, 50 μM strophanthidin | 4.3 ± 0.9 | 8.0 ± 1 | 3.1 ± 3 | 22 ± 4 | 8 |
| 27 °C, 50 μM strophanthidin | 4.5 ± 0.7 | 8.0 ± 1 | 3.5 ± 0.6 | 30 ± 20 | 4 |
Values are given as means ±s.d.
In addition, temperature sensitivity was reduced by 50 μM strophanthidin (see Fig. 7 and Table 2). In the temperature experiments with strophanthidin the nerve was superfused with control solution during the period of temperature change.
Figure 7. Effects of temperature on post-stimulus recovery of [K+]o are reduced by 50 μM strophanthidin.
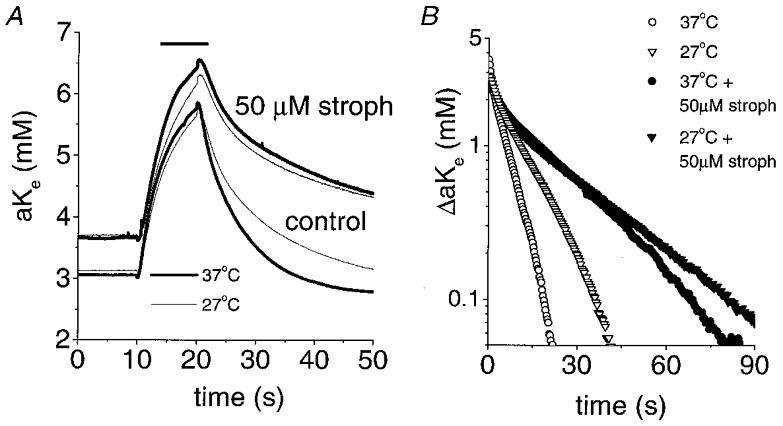
A, [K+]o transients at 37 and 27 °C under control conditions and in the presence of 50 μM strophanthidin. B, semilogarithmic plot of the decay phase of the [K+]o transients illustrated in A. Under control conditions, the apparent Q10 values in this nerve for the fast and slow components were 1.9 and 2.2, respectively. In the presence of 50 μM strophanthidin, the apparent Q10 values were 1.2 and 1.4 for the fast and slow components, respectively. The nerve was superfused with 50 μM strophanthidin for ≈5 min at each temperature before stimulation for 10 s at 100 Hz.
In two nerves, application of 50 μM strophanthidin at 37°C was followed by application of 3 mM strophanthidin (see Fig. 8). The baseline [K+]o was elevated to 7.0 ± 0.6 mM by 3 mM strophanthidin and post-stimulus recovery of [K+]o was further slowed.
Figure 8. Dose-dependent effects of strophanthidin on post-stimulus recovery of [K+]o and baseline [K+]o.
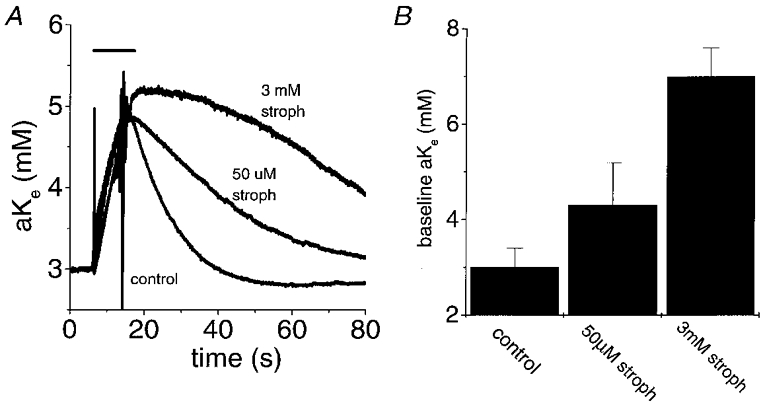
A, [K+]o transients evoked with a 10 s, 100 Hz stimulus under control conditions and in the presence of 50 μM or 3 mM strophanthidin. Higher concentrations of strophanthidin (3 mM) further inhibited post-stimulus recovery of [K+]o and increased baseline [K+]o. The traces were arbitrarily set to the same baseline [K+]o (i.e. 3 mM) to allow comparison of the time courses of recovery. Baseline [K+]o was 3 mM in control, 4.5 mM in 50 μM strophanthidin and 7.3 mM in 3 mM strophanthidin. Temperature, 37 °C. B, summary of the mean changes in baseline [K+]o produced by 50 μM and 3 mM strophanthidin. Data are plotted as means +s.d. of 33, 8 and 2 nerves for control, 50 μM strophanthidin and 3 mM strophanthidin, respectively.
[K+]o and channel blockade
Ba2+ is a non-specific blocker of K+ channels. However, at concentrations of 30–200 μM it preferentially inhibits inwardly rectifying K+ channels, such as those in glia implicated in K+ buffering (Newman, 1993; Ransom & Sontheimer, 1995). Ba2+ (0.2 mM) was applied to nerves to examine its effects on post-stimulus [K+]o recovery (Fig. 9 and Table 3). Exposure of nerves to 0.2 mM Ba2+, for up to 20 min, modestly increased peak accumulation of K+ during stimulation. Post-stimulus recovery of [K+]o was slightly affected by Ba2+ treatment (τfast and τslow were both increased by ∼20 %) but these effects were not significant (P = 0.56 and 0.76 for τfast and τslow, respectively, following a 1 s stimulus).
Figure 9. Effect of the K+ channel blocker Ba2+ on [K+]o recovery.
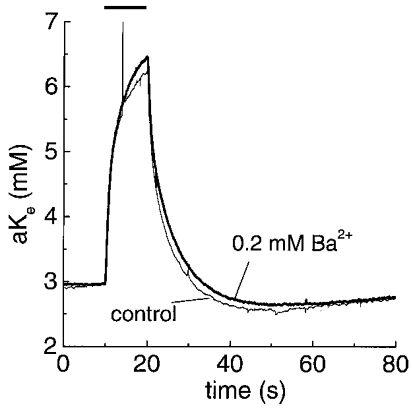
The figure shows representative [K+]o transients at 37 °C before and after superfusion of the nerve with 0.2 mM Ba2+ for 10 min. The rate of [K+]o recovery was minimally affected by this treatment in every experiment (n = 5); 10 s stimulus (100 Hz).
Table 3.
Parameters of [K+]o transients evoked by 1 and 10 s stimulus trains (100 Hz) in nerves exposed to 0.2 mM Ba2+
| Baseline (mM) | Peak (mM) | τfast (s) | τslow (s) | n | |
|---|---|---|---|---|---|
| 1 s, 100 Hz | |||||
| 37 °C | 3.0 ± 0.3 | 4.3 ± 0.6 | 0.88 ± 0.3 | 5.6 ± 2 | 5 |
| 37 °C, 0.2 mM Ba2+ | 2.9 ± 0.3 | 4.5 ± 0.4 | 1.1 ± 0.5 | 5.2 ± 0.7 | 5 |
| 27 °C, 0.2 mM Ba2+ | 3.4 ± 0.7 | 5.0 ± 1 | 1.9 ± 0.6 | 11.4 ± 4 | 4 |
| 10 s, 100 Hz | |||||
| 37 °C | 3.0 ± 0.3 | 5.9 ± 0.9 | 0.97 ± 0.3 | 7.8 ± 2 | 5 |
| 37 °C, 0.2 mM Ba2+ | 3.0 ± 0.5 | 6.4 ± 0.8 | 1.3 ± 0.5 | 9.2 ± 3 | 5 |
| 27 °C, 0.2 mM Ba2+ | 3.4 ± 0.7 | 7.5 ± 2 | 1.9 ± 0.4 | 15 ± 3 | 4 |
Values are given as means ±s.d.
Undershoots of [K+]o
Following a period of high-frequency stimulation, [K+]o transiently undershoots its resting level (e.g. Connors et al. 1982). The mechanisms underlying these undershoots must also influence the post-stimulus recovery of [K+]o. In every nerve in which stimuli of 1, 5, 10, 15 and 20 s duration were given (n = 12, at a constant frequency of 100 Hz), the magnitude of the [K+]o undershoot increased with increasing stimulus duration (Fig. 10). Most importantly, the accumulation of potassium ions reached a peak after a 10 s stimulus although the [K+]o undershoots continued to increase with stimulus duration.
Figure 10. [K+]o undershoots are dependent on stimulus duration not maximum [K+]o.
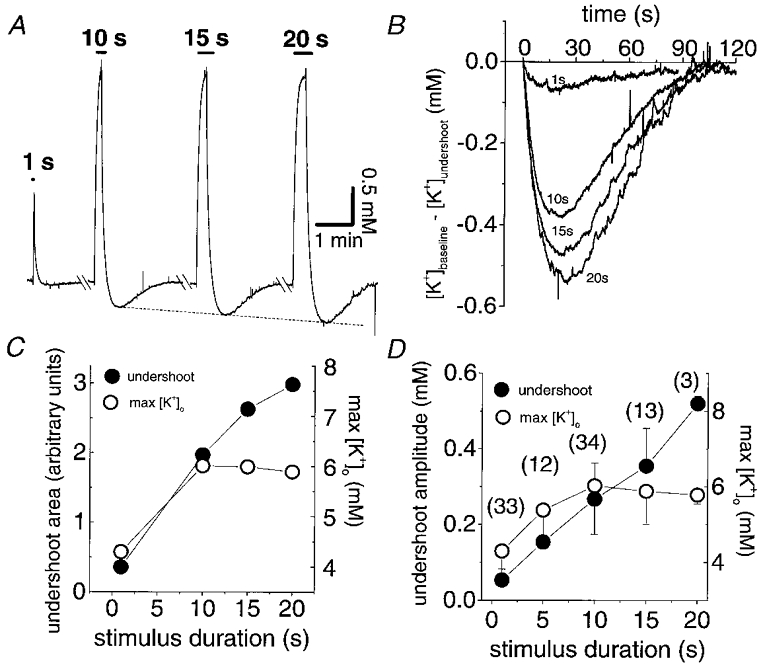
A, [K+]o transients produced with constant frequency (100 Hz) stimulation for 1, 10, 15 and 20 s. The maximum [K+]o was obtained with a 10 s stimulus but the undershoot amplitudes continued to increase with increasing stimulus duration. B, the undershoots from the data in A superimposed and enlarged to illustrate the increase in undershoot amplitude with stimulus duration. C, double x-axis plot of undershoot area and maximum [K+]o as a function of stimulus duration from the data in A. Undershoot area, obtained by calculating the area below baseline [K+]o, continued to increase with stimulus duration even when Δ[K+]o had reached a maximum. D, double x-axis plot of the mean and s.d. of undershoot amplitude and maximum [K+]o as a function of stimulus duration. Numbers in parentheses indicate the number of nerves each data point represents. The pattern seen with the nerve illustrated in A–C persisted across populations of nerves.
DISCUSSION
The double-exponential nature of post-stimulus recovery of [K+]o
A novel finding of our study is that the post-stimulus recovery of [K+]o follows a double-exponential time course with a fast and a slow time constant. An attractive interpretation is that these time constants refer to two distinct clearance processes. This possibility will be discussed in relation to a model of [K+]o accumulation and removal (see below).
An important first consideration is whether the decay phase of the K+ signal wholly represents K+ movement across cellular membranes and out of the ECS or whether extracellular diffusion away from the recording electrode and expansion of the ECS contribute to the rate of recovery of [K+]o. A significant contribution of extracellular diffusion to post-stimulus recovery of [K+]o seems unlikely. Based on the argument of Lux & Neher (1973; see also Newman & Odette, 1988), we assume that the [K+]o at the recording site is in fast equilibrium with the undisturbed tissue as a whole, i.e. we are accurately recording the changes in [K+]o occurring in undisturbed ECS because diffusion into and out of the pool created by damaged tissue at the electrode tip is extremely rapid compared to the changes in [K+]o. In the light of this, our supramaximal stimulation protocol, which ideally stimulates every activatable fibre producing a uniform increase in [K+]o throughout the nerve, makes the presence of significant gradients for diffusion in the ECS unlikely. A diffusion gradient would exist at the edge of the nerve which contacts the bath solution but this is unlikely to influence [K+]o at the recording site because changes in bath [K+] require at least 5 min to begin to affect the measured [K+]o (authors’ unpublished observations).
Connors et al. (1982) have shown that ECS volume shrinks with activity-dependent changes of [K+]o in rat optic nerve and returns to baseline in parallel to, and slightly slower than, the recovery of [K+]o. Although re-expansion of the ECS following a period of intense stimulation could contribute to the decay of an [K+]o transient, it is unlikely to be quantitatively significant. The maximum change in ECS volume fraction is only about 10 % and would be much smaller for 1 s stimuli that produce smaller increases in [K+]o (Ransom et al. 1985). For example, consider the consequences of recovery from a maximum ECS volume change of 10 %. During the first few seconds of [K+]o recovery, when the fast component of K+ removal predominates, ECS volume would only change by 2 or 3 %. If the overall change in [K+]o were 2 mM during this period, the amount of the [K+]o change attributable to ECS change would be a minuscule 0.06 mM. The possible contribution of ECS volume change to the second phase of K+ removal would be no more than 7 %; while larger than the effect on the initial stage of K+ removal, this would still be very small.
Based on the points raised above, we believe that the decay of stimulus-induced [K+]o transients is largely due to transmembrane K+ movement. Our measured time constants for the post-stimulus recovery of [K+]o, therefore, relate to K+ movement into cells.
Model of K+ accumulation and removal in the rat optic nerve
A qualitative model for K+ accumulation and removal in the rat optic nerve is developed in this section and is used to help interpret our data. The model is based on our current understanding of [K+]o dynamics in mammalian CNS, with special attention to white matter under the conditions of our experiments. Not all aspects of the model have been experimentally verified, and it will undoubtedly need refinement as more details become available.
We will begin by enumerating our assumptions. Glial cells are assumed to express an isoform of Na+,K+-ATPase the rate of which is sensitive to changes in [K+]o around the physiological concentration of 3 mM (i.e. low K+ affinity) (Ballanyi et al. 1987; Rose & Ransom, 1996). Axons are assumed to express an isoform of Na+,K+-ATPase that is insensitive to changes in [K+]o in the physiological range, but is sensitive to changes in [Na+]i, similar to the Na+ pumps in other neurones (i.e. high K+ affinity, low Na+ affinity) (Thomas, 1972; Rose & Ransom, 1997a; Fig. 11A). During periods of electrical stimulation, action potentials in the myelinated axons of the optic nerve cause a roughly ‘square wave’ of K+ efflux and K+ accumulates in the ECS (Fig. 11B). The accumulation is uniform throughout the nerve so inadequate K+ diffusion gradients exist within the tissue to engage ‘spatial buffer’ mechanisms (Orkand et al. 1966); i.e. regulation of [K+]o depends on cellular uptake. We assume that the rate of glial uptake adjusts instantly to changes in [K+]o. Action potentials result in intra-axonal accumulation of Na+, which stimulates axonal Na+,K+-ATPases (Gordon et al. 1990). The rate of [K+]o increase is rapid in comparison to axonal [Na+]i increase because of volume considerations (Fig. 11C); ECS volume fraction is about 20 % in white matter of adult rats (Lehmenkuhler et al. 1993) and axonal space is about 50 % (Black et al. 1986) of total rat optic nerve volume. Therefore, the intracellular volume of axons is about 2.5 times the volume of the ECS. This leads to slower activation of axonal Na+ pumps by Na+ than activation of glial Na+ pumps by K+. The net movement of K+ across axonal membranes is the difference between the K+ efflux related to action potential repolarisation and the K+ influx mediated by the axonal Na+ pump (Fig. 11B). Other transport mechanisms might participate in K+ decline, especially Na+-K+-2Cl− cotransport (Newman, 1995). Pharmacological inhibition of Na+-K+-2Cl− cotransport, however, has little effect on K+ decline in rat optic nerve (Ransom et al. 1985). The model implies the following.
Figure 11. Model of [K+]o regulation in rat optic nerve.
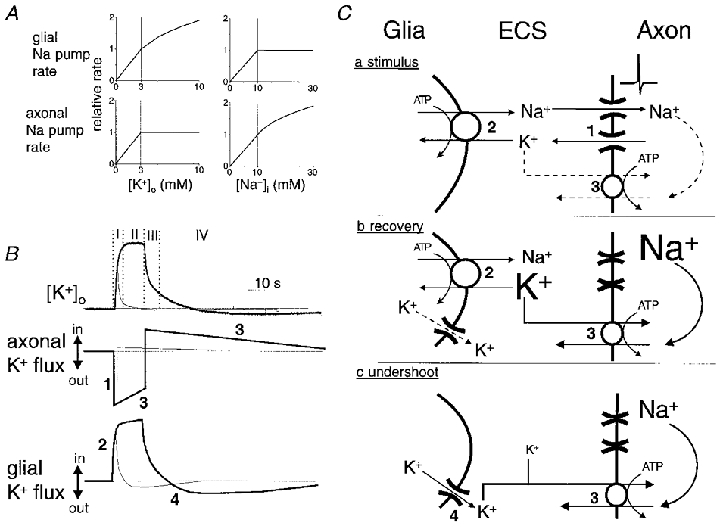
A, graphical illustration of two assumptions of our model. We assume that the rate of glial Na+,K+-ATPases, but not that of axonal Na+,K+-ATPases, is directly related to [K+]o over the range of concentrations encountered in our experiments. The rate of glial pumps adjusts instantaneously to changes in [K+]o. The external K+-binding site of axonal Na+ pumps is maximally stimulated when [K+]o is 3 mM. We assume that the rate of axonal Na+,K+-ATPases is sensitive to elevations of [Na+]i above the resting value of ≈10 mM. The rate of glial Na+ pumps falls off with reductions in [Na+]i. B, hypothetical relationship of transmembrane K+ fluxes in axons and glia to activity-dependent changes in [K+]o. Thick lines represent the situation following a 10 s stimulus; thin lines represent the situation following a 1 s stimulus. Immediately following the onset of stimulation there is an efflux of K+ from axons (mechanism 1 in C). Glial pumps instantaneously adjust their rate to the new [K+]o (mechanism 2 in C). Net efflux of K+ from axons drops slowly during the period of stimulation as Na+ loading of the intra-axonal volume enhances the rate of K+ influx via the axonal Na+ pumps (mechanism 3 in C). Following cessation of electrical stimulation axons immediately switch from a net efflux to a net influx of K+ as axons repolarise and K+ channels inactivate while their Na+ pumps continue at an accelerated rate to extrude accumulated sodium ions. Glial Na+ pump rate falls quickly as [K+]o decays. During the undershoot of [K+]o glia bleed the potassium ions that they transiently accumulated back to the ECS, probably via ion channels (mechanism 4 in C), for recapture by the axonal Na+ pumps that continue to operate above basal rates. When [K+]o returns to baseline, axons and glia have restored their initial intracellular concentrations, i.e. the area of the efflux portion of these curves equals the area of the influx portion. In summary, (I) mechanisms 1 and 2 determine [K+]o immediately following onset of stimulation and mechanism 2 is mainly responsible for determining the magnitude of evoked [K+]o increases following short duration stimuli (< 1 s), (II) mechanisms 1, 2 and 3 determine [K+]o during sustained stimulation with an increased role for mechanism 3 as the stimulus is made longer, (III) mechanisms 2 and 3 contribute to the rapid fall of [K+]o following cessation of stimulation (with mechanism 2 predominating for short periods of stimulation), and (IV) mechanisms 3 and 4 determine [K+]o during the undershoot. This model implies that glia are the primary regulators of the magnitude of evoked [K+]o increases, especially following short duration stimuli. Likewise, glial pumps play a relatively larger role in post-stimulus recovery of [K+]o increases following short duration stimuli. C, schematic diagram of the hypothesised mechanisms determining the [K+]o during electrical stimulation (a), post-stimulus recovery (b), and the undershoot in [K+]o (c).
(1) Baseline [K+]o and the magnitude of [K+]o increases seen with neural activity are mainly determined by glial Na+ pumps with a relatively low affinity for K+. During axonal activity, the new level of [K+]o will be set by the balance of K+ efflux and K+ uptake; K+ uptake immediately following the onset of tetanus is almost entirely glial (phase I in top panel of Fig. 11B). Axonal K+ uptake, compared to glial K+ uptake, would build slowly and independently of [K+]o, and has a smaller role in determining the peak level of [K+]o increase following brief (< 5 s) stimulation (phase II in Fig. 11B).
(2) The time course of [K+]o decline following stimulation (phase III in Fig. 11B) is determined by: (a) halted axonal K+ efflux due to axon repolarisation and K+ channel inactivation, (b) glial K+ uptake, the rate of which will fall rapidly as [K+]o falls, (c) axonal K+ uptake, which is primarily governed by the [Na+]i increase and will have a slow build-up and a slow decline (the slow decline is expected because the accumulated intracellular Na+ would be dispersed throughout the cytoplasmic volume of the axon, requiring more time to correct), and (d) the slow release of K+ from glia for recapture by axons (this release is probably widely distributed spatially and inconsequential with respect to [K+]o).
(3) Axonal pump rate determines the sustained, slow fall of [K+]o (see below) and causes the undershoot in [K+]o (phase IV in Fig. 11B). During the undershoot, K+ taken up by glia during phases I-III bleeds back into the ECS for recapture by the axons as they continue to extrude the accumulated sodium ions. Glial Na+ pumps should not contribute to the later, slow phase of [K+]o decay because their rate drops off rapidly as [K+]o returns to normal.
Predictions from the model about the time constants of [K+]o decline
First, the model suggests that multiple processes contribute to post-stimulus [K+]o decline. Our observation of two distinct time constants for post-stimulus recovery of [K+]o (i.e. τfast and τslow) is consistent with this. Our model proposes that the early phase of post-stimulus recovery of [K+]o (when the process associated with τfast is active) is dominated by glial Na+,K+-ATPases and the later phase of post-stimulus recovery of [K+]o (when τslow predominates) is due to axonal Na+,K+-ATPases. We therefore hypothesise that τfast is due to glial Na+ pumps and τslow is due to axonal Na+ pumps. In the following sections we will compare the observed properties of our measured time constants to those predicted for glial and axonal Na+,K+-ATPases (see above).
Effects of stimulus duration and the magnitude of [K+]o increases on τfast and τslow
If τfast represents uptake by glial Na+ pumps (i.e. low K+ affinity) it would be expected to depend on peak [K+]o and should not vary significantly with stimulus duration because this aspect of the stimulation will mainly affect axonal Na+ pumps through elevation of [Na+]i. Our data support this (Fig. 3B). For short stimulus trains (i.e. 1 s or less), the rapid decay of increased [K+]o should be mainly a τfast process. This is because there is very little increase in axonal [Na+]i and therefore little activation of axonal Na+ pumps. As the duration of the stimulus increases, the relative contribution of the late phase of post-stimulus recovery of [K+]o (i.e. τslow) should increase because the contribution of axonal pumps will increase (Fig. 11B). Indeed, the relative amplitude of τslow in our double-exponential fits of the decay phase of an [K+]o transient were increased as the stimulus duration was increased from 1 to 10 s (Fig. 3C).
The model predicts τslow will decrease as a function of stimulus duration because this will increase axonal [Na+]i (activating axonal pumps) and will not be affected by the magnitude of [K+]o increase because this does not affect axonal Na+ pumps. However, we observed an increase in τslow as stimulus duration increased. Several factors may explain this. First, the percentage increase in τslow going from a 1 s to a 10 s stimulus was small (4.2 to 6.8 s, 62 %). One needs to consider the time frame over which τslow was measured, in our case from the end of a stimulus to the trough of an undershoot. In actuality, the axonal pump rate probably only returns to the basal rate once the [K+]o has returned to baseline following an undershoot. The return of [K+]o towards baseline from the trough of the undershoot represents a time frame when axonal [Na+]i is still elevated and enhancing axonal pump rate. This ideally would be incorporated into our measurements of τslow. Our fits of post-stimulus recovery of [K+]o from longer duration stimuli were performed over a longer time frame so the measurements of τslow from these longer stimuli may more accurately reflect the true time constant of the axonal pumps. These points, and the fact that increasing stimulus duration increases the size of pHo transients (Ransom et al. 1986), a parameter that modulates pump activity (Samaha, 1967), complicates evaluation of the effects of stimulus duration on τslow.
The interpretation of the relationship of [K+]o undershoots to stimulus duration and the magnitude of [K+]o increases is less equivocal. The later phase of post-stimulus recovery, including undershoots in [K+]o, is dominated by the process associated with τslow. The fact that undershoots continued to increase in amplitude with increasing stimulus duration while the amplitude of [K+]o increases remained invariant supports viewing them as a result of axonal Na+ pump activity; longer stimuli produce larger [Na+]i loads, prolonging and intensifying axonal Na+ pump activity, resulting in larger [K+]o undershoots. Others have argued similarly for [K+]o undershoots representing neuronal Na+ pump activity (Ransom & Goldring, 1973; Kríz et al. 1975).
Temperature sensitivity of [K+]o recovery
We have found a relatively strong temperature dependence of post-stimulus recovery of [K+]o (Fig. 4). The apparent Q10 for τslow found in this study (∼2.2-2.6) is consistent with an active process, such as the Na+,K+-ATPase activity (in line with our model). Our apparent Q10 values compare well with that published for post-stimulus recovery of [K+]o in cat cortex (2.1; Lewis & Schuette, 1975b). They are quite different, however, from the value given for an amphibian optic nerve (1.56; Bracho & Orkand, 1972). Other studies in rat optic nerve have concluded that post-stimulus recovery of [K+]o is likewise temperature insensitive (Forstl et al. 1982). However, this latter study considered only the t½ in the evaluation of temperature effects on post-stimulus recovery of [K+]o. The lower temperature sensitivity of τfast, which dominates during the early phase of post-stimulus recovery of [K+]o, and therefore largely determines the t½, may partially explain this discrepancy.
The temperature sensitivity of τfast would be consistent with channel-mediated uptake, a secondary active transport process, or even Na+ pump activity. τfast was slightly, but not significantly, affected by the potassium channel blocker Ba2+, suggesting that channel-mediated K+ uptake does not underlie τfast. The slowing effect of strophanthidin on τfast could be a consequence of direct or indirect effects on the underlying process. If τfast were due to Na+-K+-2Cl− cotransport, for example, strophanthidin could slow this process by disrupting the Na+ gradient upon which transport depends. Inhibition of the Na+-K+-2Cl− cotransporter, however, appears to have little effect on activity-dependent changes in [K+]o (Ransom et al. 1985). We therefore believe that strophanthidin had direct effects on τfast, consistent with this representing the activity of glial Na+ pumps. The lower temperature sensitivity of τfast (compared to τslow) is not inconsistent with this conclusion for several reasons. Glial Na+ pump rate falls rapidly with [K+]o decline yet clear temperature effects could still be recognised under such dynamic conditions. Glia experience rapid reductions in [Na+]i following small increases in [K+]o (Ballanyi et al. 1987; Rose & Ransom, 1996). Normally, these changes in [Na+]i are rapidly compensated by Na+ import via Na+-HCO3− and Na+-K+-2Cl− cotransport (Rose & Ransom, 1996). If Na+ import were limited at 27°C, however, this would probably slow glial Na+ pumps (Rose & Ransom, 1997b), which could contribute to the low apparent Q10 of τfast. The dependence of τfast on the magnitude of [K+]o increases also may be involved in its low apparent temperature sensitivity; evoked rises of [K+]o were larger at lower temperatures and this would be predicted to decrease τfast. Using the values in Table 1 and data in Fig. 3B, we estimate that the increased rise in [K+]o seen at 27°C would reduce τfast by 0.2-0.3 s. Correcting for this would increase the apparent Q10 of τfast (calculated with the mean τfast) from 1.6 to ∼1.9. In addition, there were examples of nerves that displayed an apparent Q10 for τfast of close to 2 (see Fig. 4C).
Effects of strophanthidin on τfast and τslow
Low concentrations of strophanthidin (50 μM) affected both τfast and τslow; however, τslow was increased to a greater extent than τfast (223–464 % and 81–182 % increase, respectively). This observation is consistent with the hypothesis that these time constants refer to K+ uptake by Na+,K+-ATPases. The fact that temperature sensitivity was reduced by strophanthidin confirms the suggestion that Na+ pumps underlie temperature-sensitive recovery of [K+]o. The greater effect of strophanthidin on τslow than τfast may be related to the differential Na+,K+-ATPase isoform expression between axons and glia in rat optic nerve and their different sensitivities to strophanthidin (Sweadner, 1979; McGrail & Sweadner, 1989; Sweadner, 1995). We would suggest that 50 μM strophanthidin produces substantial inhibition of axonal Na+ pumps since this concentration completely abolished slow, post-tetanic hyperpolarisations in rat optic nerve, a response due to electrogenic pumping by axons (Gordon et al. 1990). Glial Na+ pumps, which we propose underlie τfast, express a variety of Na+ pump isoforms, some of which may be affected to a somewhat lesser extent. In any event, the fact that 3 mM strophanthidin had additional effects on post-stimulus recovery of [K+]o and baseline [K+]o indicates that 50 μM strophanthidin left some fractional Na+ pump activity of the nerve intact. This latter result is in line with other studies showing that ouabain effects on rat optic nerve grease-gap potentials reached a maximum only at concentrations of 1 mM (Lepannen & Stys, 1995). Strophanthidin also increased peak [K+]o which could lead to an underestimation of strophanthidin effects on τfast, as discussed for temperature effects on τfast.
Conclusions
Based on the results of this study, we view the decline of activity-dependent rises of K+ in ECS of CNS white matter following uniform neural activity as a two-stage process. There exists an initial, fast phase of decline and a late, slow sustained phase with identifiable time constants τfast and τslow, respectively. τfast is hypothesised to be due to the decrease in K+ uptake by the glial Na+ pump as [K+]o rapidly drops. The later phase of [K+]o decline, measured by τslow, is proposed to be due to K+ uptake by axonal Na+ pumps secondary to intracellular Na+ loading. Regulation of [K+]o by Ba2+-sensitive K+ channels was not found to be significant under our experimental conditions.
Acknowledgments
The authors appreciate the discussions and comments of Drs Robin Lester and Zucheng Ye. The authors wish to express special gratitude to the late Dr H. Robert Ransom. This work was supported by the National Institutes of Health (USA) (RO1-31234, H.S. and RO1-15589, B.R.R.). C.B.R. was supported by the Medical Scientist Training Program of the University of Alabama School of Medicine.
References
- Ballanyi K. Modulation of glial potassium, sodium, and chloride activities by the extracellular milieu. In: Kettenmann HK, Ransom BR, editors. Neuroglia. New York: Oxford University Press; 1995. pp. 289–298. [Google Scholar]
- Ballanyi K, Grafe P, Ten Bruggencate G. Ion activities and potassium uptake mechanisms of glial cells in guinea-pig olfactory cortex slices. The Journal of Physiology. 1987;382:159–174. doi: 10.1113/jphysiol.1987.sp016361. [DOI] [PMC free article] [PubMed] [Google Scholar]
- Baylor DA, Nicholls JG. After-effects of nerve impulses on signalling in the central nervous system of the leech. The Journal of Physiology. 1969;203:571–589. doi: 10.1113/jphysiol.1969.sp008880. [DOI] [PMC free article] [PubMed] [Google Scholar]
- Black JA, Waxman SG, Ransom BR, Felicano MD. A quantitative study of developing axons and glia following altered gliogenesis in rat optic nerve. Brain Research. 1986;380:122–135. doi: 10.1016/0006-8993(86)91436-8. [DOI] [PubMed] [Google Scholar]
- Bracho H, Orkand RK. Neuron-glia interaction: dependence on temperature. Brain Research. 1972;36:416–419. doi: 10.1016/0006-8993(72)90747-0. [DOI] [PubMed] [Google Scholar]
- Carlini WG, Ransom BR. Fabrication and implementation of ion-selective microelectrodes. In: Boulton AA, Baker GB, Vanderwolf CH, editors. Neuromethods, Neurophysiological Techniques: Basic Methods and Concepts. Vol. 14. Clifton, NJ, USA: The Humana Press; 1990. pp. 227–319. [Google Scholar]
- Chiu SY. Functions and distribution of voltage-gated sodium and potassium channels in mammalian Schwann cells. Glia. 1991;4:541–558. doi: 10.1002/glia.440040602. [DOI] [PubMed] [Google Scholar]
- Connors BW, Ransom BR, Kunis DM, Gutnick MJ. Activity-dependent K+ accumulation in the developing rat optic nerve. Science. 1982;216:1341–1343. doi: 10.1126/science.7079771. [DOI] [PubMed] [Google Scholar]
- Forstl J, Galvan M, Ten Bruggencate G. Extracellular K+ concentration during electrical stimulation of rat isolated sympathetic ganglia, vagus, and optic nerves. Neuroscience. 1982;7:3221–3229. doi: 10.1016/0306-4522(82)90244-5. [DOI] [PubMed] [Google Scholar]
- Frankenhaeuser B, Hodgkin AL. The after-effects of impulses in the giant nerve fibres of Loligo. The Journal of Physiology. 1956;131:341–376. doi: 10.1113/jphysiol.1956.sp005467. [DOI] [PMC free article] [PubMed] [Google Scholar]
- Gordon TR, Kocsis JD, Waxman SG. Electrogenic pump (Na+/K+-ATPase) activity in rat optic nerve. Neuroscience. 1990;37:829–837. doi: 10.1016/0306-4522(90)90112-h. [DOI] [PubMed] [Google Scholar]
- Hodgkin AL, Keynes RD. Active transport of cations in giant axons from Sepia and Loligo. The Journal of Physiology. 1955;128:28–60. doi: 10.1113/jphysiol.1955.sp005290. [DOI] [PMC free article] [PubMed] [Google Scholar]
- Katz B, Miledi R. An endplate potential due to potassium released by the motor nerve impulse. Proceedings of the Royal Society of London. 1982;216:497–507. doi: 10.1098/rspb.1982.0088. [DOI] [PubMed] [Google Scholar]
- Kelly JP, van Essen DC. Cell structure and function in the visual cortex of the cat. The Journal of Physiology. 1974;238:515–547. doi: 10.1113/jphysiol.1974.sp010541. [DOI] [PMC free article] [PubMed] [Google Scholar]
- Knot HJ, Zimmerman PA, Nelson MT. Extracellular K+-induced hyperpolarizations and dilatations of rat coronary and cerebral arteries involve inward rectifier K+ channels. The Journal of Physiology. 1996;492:419–430. doi: 10.1113/jphysiol.1996.sp021318. [DOI] [PMC free article] [PubMed] [Google Scholar]
- Kríz N, Syková E, Vyklický L. Extracellular potassium changes in the spinal cord of the cat and their relation to slow potentials, active transport and impulse transmission. The Journal of Physiology. 1975;249:167–182. doi: 10.1113/jphysiol.1975.sp011009. [DOI] [PMC free article] [PubMed] [Google Scholar]
- Lehmenkuhler A, Sykova E, Svoboda J, Zilles K, Nicholson C. Extracellular space parameters in the rat neocortex and subcortical white matter during postnatal development determined by diffusion analysis. Neuroscience. 1993;55:339–351. doi: 10.1016/0306-4522(93)90503-8. [DOI] [PubMed] [Google Scholar]
- Leppanen L, Stys PK. Ion transport and membrane potential in CNS myelinated axons I. Normoxic conditions. Journal of Neurophysiology. 1997;78:2086–2094. doi: 10.1152/jn.1997.78.4.2086. [DOI] [PubMed] [Google Scholar]
- Lester RA, Jahr CE. NMDA channel behavior depends on agonist affinity. Journal of Neuroscience. 1992;12:635–643. doi: 10.1523/JNEUROSCI.12-02-00635.1992. [DOI] [PMC free article] [PubMed] [Google Scholar]
- Lewis DV, Schuette WH. NADH fluorescence and [K+] changes during hippocampal electrical stimulation. Journal of Neurophysiology. 1975a;38:405–417. doi: 10.1152/jn.1975.38.2.405. [DOI] [PubMed] [Google Scholar]
- Lewis DV, Schuette WH. Temperature dependence of potassium clearance in the central nervous system. Brain Research. 1975b;99:175–178. doi: 10.1016/0006-8993(75)90623-x. [DOI] [PubMed] [Google Scholar]
- Lux HD, Neher E. The equilibration time course of [K+]o in cat cortex. Experimental Brain Research. 1973;17:190–205. doi: 10.1007/BF00235028. [DOI] [PubMed] [Google Scholar]
- McGrail KM, Sweadner KJ. Complex expression patterns for Na,K-ATPase isoforms in retina and optic nerve. European Journal of Neuroscience. 1989;2:170–176. doi: 10.1111/j.1460-9568.1990.tb00409.x. [DOI] [PubMed] [Google Scholar]
- Morad M. Physiological implications of K accumulation in heart muscle. FASEB Journal. 1980;3:1533–1539. [PubMed] [Google Scholar]
- Newman EA. Inward-rectifying potassium channels in retinal glial (Muller) cells. Journal of Neuroscience. 1993;13:3333–3345. doi: 10.1523/JNEUROSCI.13-08-03333.1993. [DOI] [PMC free article] [PubMed] [Google Scholar]
- Newman EA. Glial cell regulation of extracellular potassium. In: Kettenmann HK, Ransom BR, editors. Neuroglia. New York: Oxford University Press; 1995. pp. 717–731. [Google Scholar]
- Newman EA, Odette LL. Model of potassium dynamics in the central nervous system. Glia. 1988;1:198–210. doi: 10.1002/glia.440010305. [DOI] [PubMed] [Google Scholar]
- Ohmori H. Inactivation kinetics and steady-state current noise in the anomalous rectifier of tunicate egg cell membranes. The Journal of Physiology. 1978;281:77–99. doi: 10.1113/jphysiol.1978.sp012410. [DOI] [PMC free article] [PubMed] [Google Scholar]
- Orkand RK, Nicholls JG, Kuffler SW. Effect of nerve impulses on the membrane potential of glial cells in the central nervous system of amphibia. Journal of Neurophysiology. 1966;29:788–806. doi: 10.1152/jn.1966.29.4.788. [DOI] [PubMed] [Google Scholar]
- Pappas CA, Ransom BR. Depolarization-induced alkalinization (DIA) in rat hippocampal astrocytes. Journal of Neurophysiology. 1994;72:2816–2826. doi: 10.1152/jn.1994.72.6.2816. [DOI] [PubMed] [Google Scholar]
- Poolos NP, Koscis JD. Elevated extracellular potassium concentration enhances synaptic activation of N-methyl-D-aspartate receptors in hippocampus. Brain Research. 1990;508:7–12. doi: 10.1016/0006-8993(90)91110-3. [DOI] [PubMed] [Google Scholar]
- Ransom BR, Carlini WG, Connors BW. Brain extracellular space: developmental studies in rat optic nerve. Annals of the New York Academy of Sciences. 1986;481:87–105. doi: 10.1111/j.1749-6632.1986.tb27141.x. [DOI] [PubMed] [Google Scholar]
- Ransom BR, Goldring S. Slow hyperpolarization in cells presumed to be glia in cerebral cortex of cat. Journal of Neurophysiology. 1973;36:879–892. doi: 10.1152/jn.1973.36.5.879. [DOI] [PubMed] [Google Scholar]
- Ransom BR, Orkand RK. Glial-neuronal interactions in non-synaptic areas of the brain: studies in the optic nerve. Trends in Neurosciences. 1996;19:352–358. doi: 10.1016/0166-2236(96)10045-x. [DOI] [PubMed] [Google Scholar]
- Ransom BR, Yamate CL, Connors BW. Activity-dependent shrinkage of extracellular space in rat optic nerve: a developmental study. Journal of Neuroscience. 1985;5:532–535. doi: 10.1523/JNEUROSCI.05-02-00532.1985. [DOI] [PMC free article] [PubMed] [Google Scholar]
- Ransom CB, Sontheimer H. Biophysical and pharmacolgical characterization of inwardly-rectifying K+ currents in rat spinal cord astrocytes. Journal of Neurophysiology. 1995;73:333–346. doi: 10.1152/jn.1995.73.1.333. [DOI] [PubMed] [Google Scholar]
- Rose CR, Deitmer JW. Evidence that glial cells modulate extracellular pH transients induced by neuronal activity in the leech central nervous system. The Journal of Physiology. 1994;481:1–5. doi: 10.1113/jphysiol.1994.sp020413. [DOI] [PMC free article] [PubMed] [Google Scholar]
- Rose CR, Ransom BR. Intracellular sodium homeostasis in rat hippocampal astrocytes. The Journal of Physiology. 1996;491:291–305. doi: 10.1113/jphysiol.1996.sp021216. [DOI] [PMC free article] [PubMed] [Google Scholar]
- Rose CR, Ransom BR. Regulation of intracellular sodium in rat hippocampal neurones. The Journal of Physiology. 1997a;499:573–587. doi: 10.1113/jphysiol.1997.sp021951. [DOI] [PMC free article] [PubMed] [Google Scholar]
- Rose CR, Ransom BR. Gap junctions equalize intracellular Na+ concentration in astrocytes. Glia. 1997b;20:299–307. doi: 10.1002/(sici)1098-1136(199708)20:4<299::aid-glia3>3.0.co;2-1. [DOI] [PubMed] [Google Scholar]
- Salem RD, Hammerschlag R, Bracho H, Orkand RK. Influence of potassium ions on accumulation and metabolism of (14C)glucose by glial cells. Brain Research. 1975;86:499–503. doi: 10.1016/0006-8993(75)90903-8. [DOI] [PubMed] [Google Scholar]
- Samaha FJ. Studies on Na+-K+-stimulated ATPase of human brain. Journal of Neurochemistry. 1967;14:333–341. doi: 10.1111/j.1471-4159.1967.tb09530.x. [DOI] [PubMed] [Google Scholar]
- Singer W, Lux HD. Extracellular potassium gradients and visual receptive fields in the cat striate cortex. Brain Research. 1975;96:378–383. doi: 10.1016/0006-8993(75)90751-9. [DOI] [PubMed] [Google Scholar]
- Stein WD. The Movement of Molecules Across Cell Membranes. New York: Academic Press; 1967. [Google Scholar]
- Stys PK. Suction electrode recording from nerves and fiber tracts. In: Kettenmann HK, Grantyn R, editors. Practical Electrophysiological Methods. New York: Wiley-Liss; 1993. pp. 189–194. [Google Scholar]
- Sweadner KJ. Two molecular forms of (Na++ K+)-stimulated ATPase in brain: separation, and difference in affinity for strophanthidin. Journal of Biological Chemistry. 1979;254:6060–6067. [PubMed] [Google Scholar]
- Sweadner KJ. Na,K-ATPase and its isoforms. In: Kettenmann HK, Ransom BR, editors. Neuroglia. New York: Oxford University Press; 1995. pp. 259–272. [Google Scholar]
- Szatkowski M, Barbour B, Atwell D. Non-vesicular release of glutamate from glial cells by reversed electrogenic glutamate uptake. Nature. 1990;348:443–445. doi: 10.1038/348443a0. [DOI] [PubMed] [Google Scholar]
- Thomas RC. Intracellular sodium activity and the sodium pump in snail neurones. The Journal of Physiology. 1972;220:55–71. doi: 10.1113/jphysiol.1972.sp009694. [DOI] [PMC free article] [PubMed] [Google Scholar]


