

Abstract
The permanent extra tension after a stretch and the deficit of tension after a shortening in the soleus muscle of the anaesthetised cat were measured using distributed nerve stimulation across five channels. At low rates of stimulation the optimum length for a contraction was several millimetres longer than that when higher rates of stimulation were used, so that movements applied over the same length range could be on the descending limb of the full activation curve but on the ascending limb of the submaximal activation curve.
The extra tension after stretch and the depression after shortening were present only near the peak and on the descending limb of the length-tension curve. Effects on final tension of changing the speed and amplitude of stretches or shortenings were found to be small.
Statistical analysis showed that variations in the tension excess or deficit due to changing stimulus rate could be entirely attributed to the effect of stimulus rate on the length-tension relation, as when length was expressed relative to optimum for each rate, stimulus rate was no longer a significant determinant of the tension excess or deficit.
The extra tension after stretch and the depression after shortening disappeared if stimulation was interrupted and tension briefly fell to zero.
These effects were explained in terms of a non-uniform distribution of sarcomere length changes at long muscle lengths. During stretch some sarcomeres are stretched to beyond overlap while others lengthen hardly at all. During shortening some sarcomeres shorten much further than others.
These mechanisms have important implications for exercise physiology and sports medicine.
It has been known for a long time that stretch of a muscle at long muscle lengths leads to a final maintained level of active tension higher than the equivalent isometric tension at the final length, while shortening produces less than the isometric tension (Abbott & Aubert, 1952; Hill, 1953). The extra tension after the stretch, ‘permanent extra tension’, remained a puzzle to physiologists (Délèze, 1961), as did the mechanism for the deficit after shortening. For detailed references see Noble (1992). A solution to the problem was offered by Morgan (1994) who suggested that lengthening of muscle fibres at long lengths occurred highly non-uniformly, so that some sarcomeres, those responsible for the recorded tension, were stretched very little while others were stretched to beyond myofilament overlap. Similar considerations could be applied to shortening, where a few, strong sarcomeres took up most of the movement while the majority of sarcomeres shortened very little.
Recently this subject has been raised once again. In the past, most of the work was carried out on single amphibian muscle fibres (Edman et al. 1978; Julian & Morgan, 1979; Sugi & Tsuchiya, 1988; Granzier & Pollack, 1989; Edman & Tsuchiya, 1996). Now there are new reports on whole mammalian muscle describing similar phenomena and arriving at new explanations (Herzog & Leonard, 1997; Herzog, 1998). Here we describe observations on the soleus muscle of the anaesthetised cat, which are consistent with the earlier proposal of Morgan (1994). We have chosen to consider responses to stretch and to shortening together because, we believe, the same underlying mechanism is responsible for the observed tension changes. Because it is necessary to stimulate the muscle for relatively long periods of time to allow development of the tension changes following slow movements, the technique of sequential, distributed stimulation of the muscle was used to minimise effects of fatigue (Rack & Westbury, 1969). In addition, since the optimum length for contraction depends on the rate of stimulation, by changing the stimulus rate we were able to study the effects of movements over the same length range but which represented different regions, the ascending limb or descending limb, of the muscle's length- tension relation, while maintaining smooth tension profiles (Rack & Westbury, 1969).
METHODS
All of the work described here was approved by the local Animal Ethics Committee. The experiments were carried out on a total of eight cats of both sexes weighing between 4 and 7.9 kg. Details of the preparation have been reported previously (see, e.g. Wise et al. 1999). Anaesthesia was induced with an intraperitoneal dose of sodium pentobarbitone (40 mg kg−1) and maintained with additional doses (5–10 mg), given when necessary, into the cephalic vein during the course of the experiment. At the end of the experiment animals were killed with an overdose of anaesthetic and disposed of by incineration. The trachea was cannulated and the end-tidal CO2 concentration monitored. Respiration rate and expired CO2 levels are sensitive indicators of depth of anaesthesia. Rectal temperature was measured and body temperature maintained at 38°C by the use of a feedback-regulated heating blanket.
A laminectomy was carried out to expose dorsal and ventral roots L6-S2. These were cut at their point of entry into the cord. Electrical stimulation established where motor axons to soleus ran in the ventral roots, typically L7 and S1. The left hindlimb was dissected to expose the soleus muscle. For this it was necessary to free the medial and lateral gastrocnemius muscles and to cut and separate their tendons from the Achilles’ tendon, leaving just the tendon of soleus attached to the calcaneum. All other hindlimb nerves were cut, including those to hip muscles. The two gastrocnemii and plantaris were taken out completely or deflected away from soleus. The hindlimb was fixed to a rigid metal frame by steel pins driven into the pelvis and each end of the tibia. Exposed tissues were covered with mineral paraffin oil retained in baths fashioned from skin flaps. The paraffin was maintained within 2°C of core body temperature and, if necessary, was warmed using a heating lamp.
The calcaneum was severed and the piece attached to the tendon was used to connect the muscle to a feedback-regulated muscle stretcher using length feedback from an LVDT (linear variable differential transformer) displacement transducer. Tension was measured with a U-shaped strain gauge in series with the stretcher. Compliance of the stretcher and gauge was 5 μm N−1. The method used previously by ourselves and others to attach the tendon to the strain gauge involved pushing a T-shaped stainless-steel rod through a small longitudinal slit in the base of the tendon, close to the calcaneum. The T cross-piece bore on the calcaneum while the other end was attached to the strain gauge. In previous studies this had been a secure and reliable means of attaching the muscle to the stretcher. In preliminary experiments here, however, this method was found to be unsatisfactory, as slitting the tendon weakened it sufficiently for it to stretch and tear while the muscle was undergoing eccentric contractions at the long muscle lengths necessary for these experiments. This problem was eventually solved by drilling a 2 mm diameter hole through the calcaneum, passing a threaded rod through it and clamping the calcaneum between a pair of nuts and washers. This meant that the soleus tendon and its attachment to the calcaneum were left essentially undisturbed. In the later experiments no tendon tears occurred and inspection of markers placed on the tendon at the beginning and end of the experiment showed no measurable increase in marker spacing during the experiment.
Stretches of 2–6 mm amplitude at 2.5-13 mm s−1 were used. Given that at optimum length cat soleus fibres are about 33 mm long (Al-Amood & Pope, 1972), these stretches convert to 6–18 % of fibre length at 7.5-39 % s−1. Similarly, for the shortenings, 2–6 mm at 2.3-2.6 mm s−1 converts to 6–18 % at 6.9-78 % s−1.
Ventral roots were subdivided into five portions with differences in tension generated by them of up to 30 %. The dissected pieces of root were placed across an array of platinum bipolar stimulating electrodes. Stimuli of 0.1 ms duration were adjusted to be maximal for a twitch for each portion. The method of stimulation which was used here is called ‘distributed stimulation’ (Rack & Westbury, 1969). The five muscle portions are stimulated, one after the other, with delays between channels so that not all of the muscle is being activated at the same time. As a result, mean tension levels are higher and oscillations at the frequency of stimulation are less. In addition, we have added a further sophistication. The delays between stimulus channels were not kept fixed but were adjusted by computer to reduce tension ripple at the stimulus frequency to below 1 %. For details of the method see Brown et al. (1999). It meant that smooth tension profiles could be achieved using low stimulus rates, without requiring ventral root portions generating equal tensions (Rack & Westbury, 1969). It also had the advantage that if, during the course of the experiment, tension in one stimulated portion fell more than in another, as a result of fatigue, the resulting difference in tension could be taken into account by automatic adjustment of stimulus intervals. Stimulus rates of 3, 5, 6, 7, 10 and 30 pulses s−1 were used. Anything less than 3 pulses s−1 led to tension profiles which could not be sufficiently smoothed by adjustment of stimulus intervals. With stimulus rates above 30 pulses s−1, tension levels increased only slightly and during repetitive stimulation over the long periods required for these experiments, tension declined significantly during each contraction as a result of fatigue, making interpretation of the records more difficult.
Statistical analysis was by two-way ANOVA, with the measured permanent extra tension or tension deficit as the output variable, one input variable being stimulus rate, the other muscle length expressed relative to the optimum for a particular stimulus rate or relative to the optimum for the maximum rate. A second method involved a regression analysis of permanent extra tension or tension deficit against muscle length, calculation of the residuals and a second regression analysis on the relation between the residuals and stimulation rate.
RESULTS
The main objective of this study was to investigate the dependence of the tension excess after stretch and the deficit after shortening on the muscle's length-tension relation. To bring out this point, we generated different length-tension curves by changing the rate of stimulation. If distributed stimulation is used, smooth contractions can be obtained over a range of stimulation rates including quite low rates (Fig. 1A; see also Rack & Westbury, 1969). At lower stimulation rates the optimum length for a contraction shifted in the direction of longer muscle lengths (Fig. 1B). This meant that movements, applied over a given range of muscle lengths, could be on the ascending limb of the length-tension relation for submaximal activation but on the descending limb of the fully activated curve. Stimulation rates of less than 3 pulses s−1 were not used as the tension became too unfused while above 30 pulses s−1 there was little further increase in tension and, given the long duration of tetani required for these experiments, effects of fatigue became significant (cf. Herzog & Leonard, 1997).
Figure 1. Distributed stimulation at different rates and lengths.
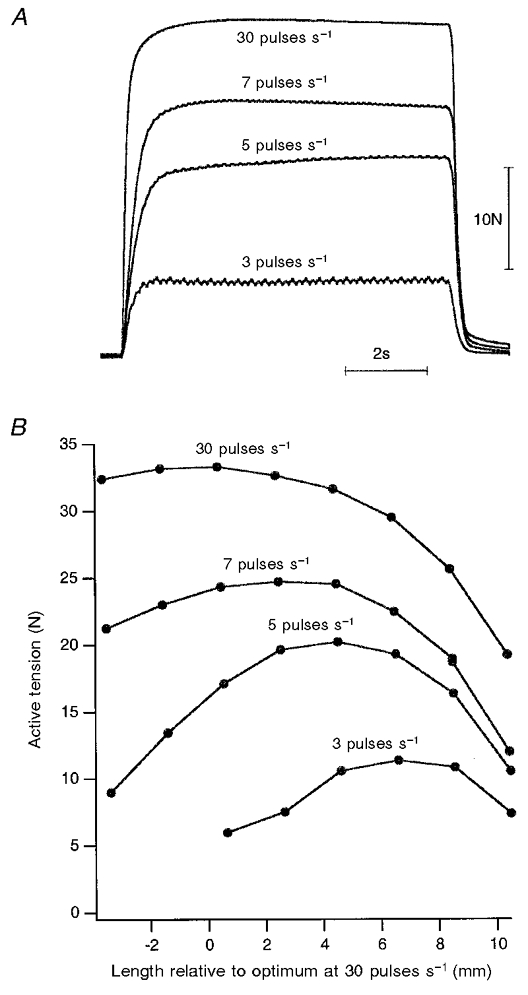
A, tetanic tension of the soleus muscle of the anaesthetised cat in response to sequential, distributed stimulation at 3, 5, 7 and 30 pulses s−1 for 8 s across 5 separate stimulus channels, with intervals between channels adjusted by computer. For details, see Methods. The small amount of tension ripple apparent at 3, 5 and 7 pulses s−1 represents fluctuations at harmonics of the stimulation rate. B, active length-tension curves for soleus using the four different rates of distributed stimulation. Passive tensions have been subtracted. Length is expressed relative to the optimum for tension using 30 pulses s−1 stimulation. There is a shift in the direction of longer muscle lengths for the optimum at the lower rates of stimulation.
In practice, by altering the rate of stimulation, length- tension curves could be generated with optima separated by 4–9 mm (Figs 1B and 3B). This meant that movements carried out using a stimulation rate of 30 pulses s−1 could readily be applied on the descending limb of the length-tension relation, while with a rate of 5 pulses s−1 it was often difficult to demonstrate a descending limb and all measurements were made on the ascending limb (Fig. 3).
Figure 3. Active length-tension relations for lengthening and shortening movements using a range of stimulation rates.
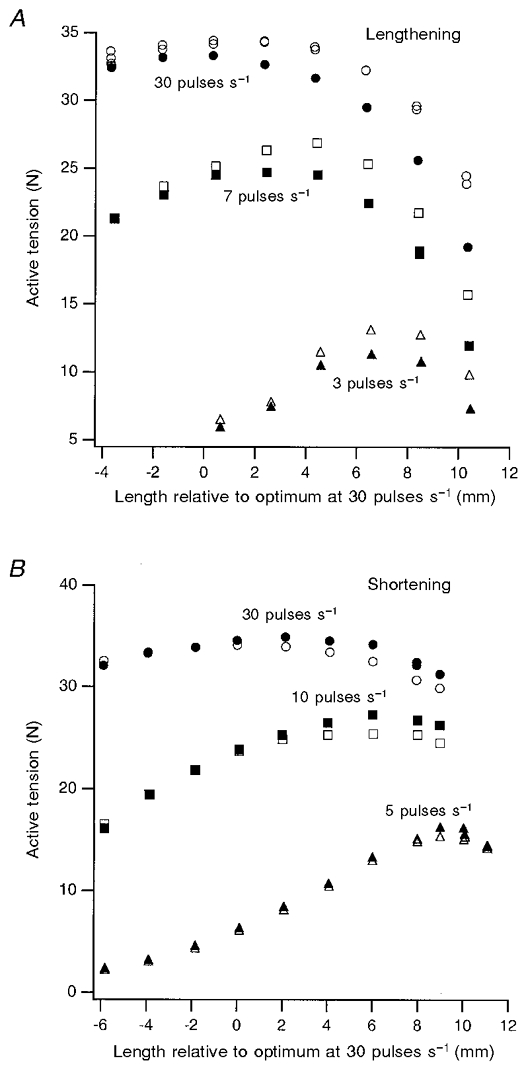
A, lengthening contractions; B, shortening contractions. Length is expressed relative to the optimum for a contraction using 30 pulses s−1 stimulation. In A, the open symbols represent the tension at the end of a 3 mm stretch at 10 mm s−1. Circles, 30 pulses s−1 stimulation; squares, 7 pulses s−1; triangles, 3 pulses s−1. In B, the open symbols represent tension after a 3 mm shortening at 2.5 mm s−1. Circles, 30 pulses s−1 stimulation; squares, 10 pulses s−1; triangles, 5 pulses s−1. In each panel, the filled symbols represent the values for isometric tension at the final length. A difference between the tension after stretch or shortening only becomes apparent at the peak or on the descending limb of each length-tension curve.
Muscle lengthening
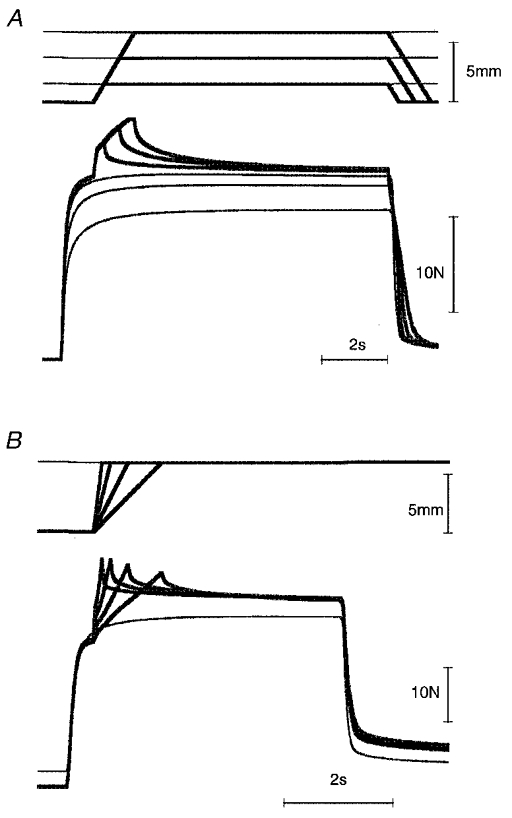
Examples of tension changes during stretch, measured over two regions of the length-tension curve, are shown in Fig. 2. In this and subsequent figures, L0 is the optimum length for a contraction at the particular rate of stimulation for the contraction. The general result was the same as that reported previously (Julian & Morgan, 1979). When the stretch was over a range of lengths on the ascending limb of the curve, the tension at the end of the stretch was the same as the isometric tension measured at the final length. However, when the stretch was applied at a length 8 mm longer, on the descending limb of the length-tension curve, the tension at the end on the stretch was 12 % higher than the isometric tension at the final length. This experiment therefore demonstrates that the extra tension after a stretch is seen only at lengths beyond the optimum. The point is made even more clearly when the tension at the end of stretch is plotted for a range of final lengths and compared with the isometric tension at each length for different rates of stimulation (Fig. 3A). Within the limits of experimental error, the extra tension after stretch only began to appear at about the optimum length for each particular stimulus rate and the difference between it and the isometric tension became progressively larger as more of the movement was on the descending limb of the curve.
Figure 2. Tension changes during stretch of the contracting muscle compared with the isometric tension, measured at two different final muscle lengths, L0– 4 mm (A) and L0+ 4 mm (B).

Stimulation rate, 10 pulses s−1; distributed stimulation. L0 is the optimum length for a contraction at that rate. Stretch, 3 mm at 10 mm s−1. In A and B, the upper traces are muscle length and the lower traces tension. Length and tension traces for the isometric contraction (thin line) and the lengthening contraction (thick line) have been superimposed. Only at the long length is there a difference between the final tension after stretch and the isometric tension.
Although not shown here, the tension developed after stretch was little different from the isometric tension at the starting length (see Julian & Morgan, 1979). However, such comparisons across lengths are difficult at these long lengths because of the amount of passive tension present (see Figs 2B and 5A).
Figure 5. Tension changes (stimulation rate, 30 pulses s−1) during stretches of different amplitude (A) and rate (B), compared with the corresponding isometric tension.
Stretches of 2, 4 and 6 mm at 5 mm s−1 were used (A), and a 6 mm stretch at 2.3, 4.6, 9.2 and 13 mm s−1 (B). In A and B, the superimposed length traces are shown at the top and the tension traces at the bottom. The isometric contraction is indicated by the thin lines. In A, because a comparison was made between the tension at the end of each stretch and the isometric tension at the corresponding final length, passive tension was subtracted from all records. For the lengthening contractions, tension during a passive stretch was used for subtraction.
The data from four different experiments covering a range of stimulation rates from 3 to 30 pulses s−1 were combined and the extra tension at the end of stretch measured for each rate of stimulation, over a range of muscle lengths (Fig. 4). When the extra tension was plotted against the change in length expressed relative to the optimum for the maximum rate of stimulation used (30 pulses s−1, Lopt,max; Fig. 4A), a clear trend of a larger amount of extra tension at the higher rates of stimulation was visible as well as an overall increase in extra tension at longer lengths. When the extra tension was plotted against the change in length expressed relative to the optimum for each rate of stimulation (Lopt,sub; Fig. 4B), a trend of an increase in extra tension at longer lengths was still visible, but the points for different stimulus rates were no longer clearly segregated. This is because the optimum lengths for lower stimulus rates were longer so that values for lower rates were moved to the left by the change in display. Points for 30 pulses s−1 remained unchanged.
Figure 4. Extra tension after stretch, expressed as a percentage of the isometric tension measured at 30 pulses s−1, against changes in muscle length for a range of stimulation rates.
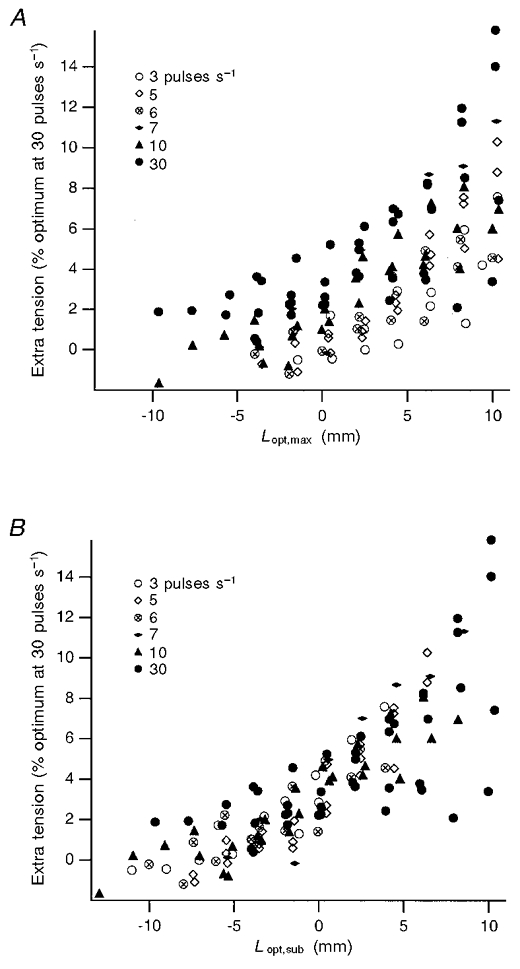
Data from 4 experiments were combined, giving a total of 132 values. Change in muscle length (in mm) is expressed relative to the optimum using 30 pulses s−1 stimulation (Lopt,max; A) or relative to the optimum length for each stimulus rate used (Lopt,sub; B). Values for each stimulation rate appear to be intermingled when expressed in terms of their own optimum (B). When expressed in terms of Lopt,max (A), they separate out more clearly, with values for the lower rates of stimulation lying below those for the higher rates.
Data from four experiments, each using three or four rates of stimulation, provided a total of 132 comparisons (Fig. 4). A two-way ANOVA was performed with the extra tension as the dependent variable, and stimulation rate as one independent variable and Lopt,max or Lopt,sub as the other. In the ANOVA both length variables were found to be significant (P < 0.001), supporting the view that the extra tension was greater at longer lengths. When Lopt,max was the independent variable (Fig. 4A), the stimulation rate was significant (P < 0.001). When Lopt,sub was the independent variable (Fig. 4B), the stimulation rate was not significant (P = 0.34).
In a second analysis, a regression line was fitted to the values, expressed in the two plots (Fig. 4), the residuals were calculated and a regression analysis carried out on the relation between the residuals and stimulus rate. In the first regression analysis, the dependence of values on length was removed and the dependence on stimulation rate was then tested. In the ANOVA the two were considered together. Linear regression of residuals using Lopt,max showed that both the slope and intercept of the relation with stimulus rate was significant (P < 0.001). When Lopt,sub was used, neither slope nor intercept were significant, both yielding P values > 0.4.
The display of the data in Fig. 4 and the two statistical analyses confirmed the view that the effect of stimulus rate could be accounted for entirely in terms of the resulting shift in the length-tension relation. Put another way, the permanent extra tension after stretch was determined by the length, relative to optimum, for a particular stimulus rate, not the absolute length.
It has been reported repeatedly that the extra tension measured after stretch of a contracting muscle is independent of the speed of stretch but depends on the amplitude of the stretch (Abbott & Aubert, 1952; Edman et al. 1978; Granzier & Pollack, 1989; Herzog & Leonard, 1997). The observations made here support the view first put forward by Julian & Morgan (1979) that changing stretch parameters produces only minor alterations in the level of tension after stretch, compared with the isometric tension at the final length.
Sample traces are shown in Fig. 5. Figure 5B shows that the effect of changing stretch velocity did not alter the final tension after stretch. Figure 5A shows the effect of altering stretch amplitude. The experiment was carried out by keeping the initial length constant and changing the final length to which the muscle was stretched. Because at these long lengths passive tension levels become considerable, for the sake of comparison, passive tension, that is, the tension during a passive stretch, was subtracted from each trace. When this was done, the tension after the stretch was essentially independent of amplitude, while the isometric tension measured at each final length fell to progressively lower levels as the amplitude of the stretch was increased.
Muscle shortening
Similar experiments to those described above were carried out to examine the effects of imposing controlled shortenings on the contracting muscle. Sample records are shown in Fig. 6. A 3 mm shortening imposed at a length 6 mm shorter than the optimum length did not lead to any sustained deficit in tension, when compared with the isometric tension measured at L0– 9 mm. The same experiment carried out at a longer length (L0+ 6 mm), which was well down on the descending limb of the length-tension curve, led to a maintained deficit in tension, when compared with the isometric value.
Figure 6. Tension changes during shortening (3 mm at 2 mm s−1) to two different muscle lengths, L0– 6 mm (A) and L0+ 6 mm (B).

Stimulation rate, 30 pulses s−1; distributed stimulation for 8 s. Only when the shortening is applied at the longer lengths is there depression of tension after shortening, compared with the isometric value. In each panel, length (upper traces) and tension (lower traces) have been superimposed, the isometric contraction being indicated by the thin lines.
The length dependence of the tension deficit is shown in graphical form for one experiment in Fig. 3B. For the lowest rate of stimulation, 5 pulses s−1, there was no measurable deficit until the optimum length for a contraction was reached, which was at a length 10 mm beyond the optimum length for 30 pulses s−1 stimulation, at which, for that rate, there was already a significant deficit.
To establish statistical significance for the tension depression seen after muscle shortening, an analysis similar to that for the lengthenings was carried out (Fig. 4). For a total of 96 comparisons from three experiments a two-way ANOVA was used to compare the dependence of the depression of tension on stimulus rate and Lopt,max or Lopt,sub. The stimulus rate was found to be a significant variable for Lopt,max (P = 0.005), but not for Lopt,sub (P = 0.83). The regression analysis from the plot of tension deficit against Lopt,max showed that the line of best fit to the plot of the residuals against stimulus rate was significant (P < 0.001), but that the analysis for Lopt,sub was not (P = 0.4). This analysis showed that the depression of tension depended only on length relative to optimum for a particular stimulation rate. The effect of stimulus rate could be entirely accounted for by its effect on the optimum length.
Experiments were carried out to examine the effects of changing the size and speed of the shortenings. Here our predictions were somewhat different from those for the effects of stretches. Consideration of the muscle's force-velocity relation predicts less tension deficit during more rapid shortenings and using similar reasoning, larger, slower shortenings might be expected to produce a larger deficit than smaller shortenings at the same speed (Edman et al. 1993). This trend is apparent in the records of Fig. 7.
Figure 7. Tension changes during shortenings of different sizes (A) and speeds (B).
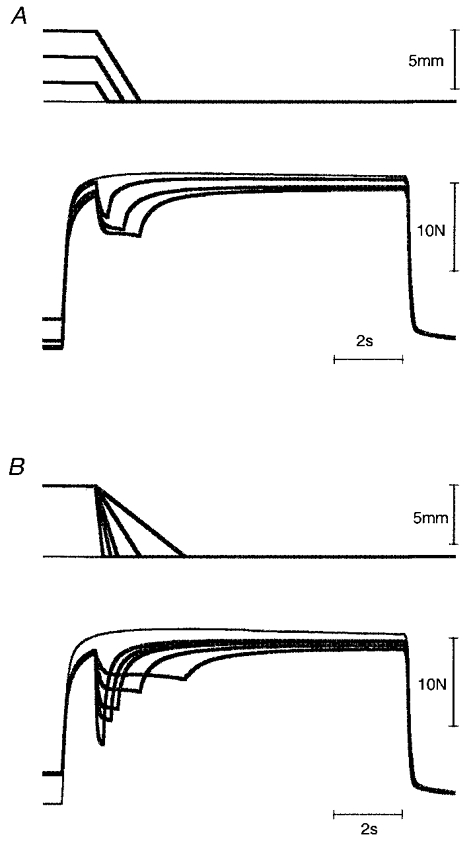
A, amplitude: 2, 4 and 6 mm at 4.6 mm s−1. B, speed: 2.3, 4.6, 9.2, 13 and 26 mm s−1, using a 6 mm shortening. Stimulation rate, 30 pulses s−1; distributed stimulation. In each panel, length traces are shown at the top and tension traces at the bottom, the thin lines indicating the isometric tension records.
Finally, it has been reported repeatedly (see, e.g. Abbott & Aubert, 1952) that interruption of stimulation leads to removal of the tension excess after stretch, and to recovery of full isometric tension after shortening. Here we have confirmed these observations on the cat soleus muscle (Fig. 8). During a 1 s interruption of stimulation the tension fell close to zero. Following an interruption after a lengthening contraction, tension redeveloped to a level identical to that for an isometric contraction at the longer length (Fig. 8A). After shortening, a similar interruption led to recovery of full isometric tension for that length (Fig. 8B).
Figure 8. The effect of interrupting stimulation on the tension above isometric after a stretch (A) and below isometric after a shortening (B).
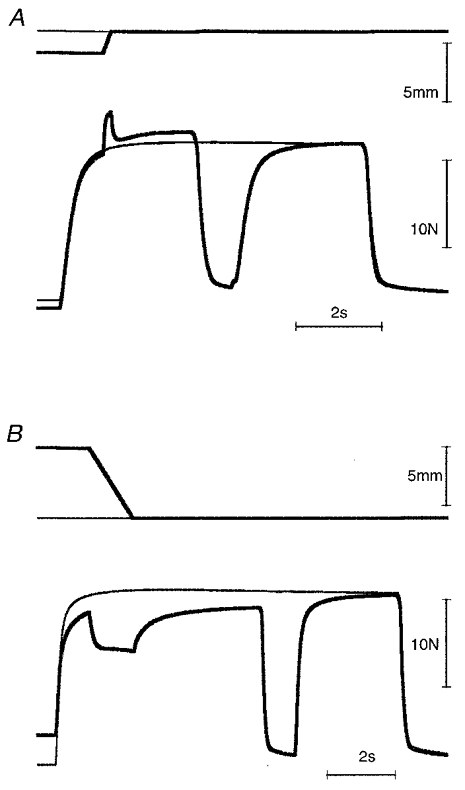
A, stretch: 2 mm at 10 mm s−1. B, shortening: 6 mm at 5 mm s−1. Stimulation rate, 10 pulses s−1; distributed stimulation. Muscle length, L0+ 4 mm. In each panel, superimposed length traces are shown at the top, and tension traces at the bottom. Isometric tension traces are indicated by the thin lines. After stimulus interruption, the tension returns to the isometric value for both lengthenings and shortenings.
DISCUSSION
The aim of these experiments was to demonstrate a muscle length dependence of the tension excess after a stretch and the deficit after a shortening. Both are present over a range of lengths only when these are on the descending limb of the muscle's length-tension relation. They are both absent on the ascending limb. While this general result has been shown before for fully activated muscle, here we show that it also applies even when the optimum length is altered by changing the stimulus rate.
It is necessary to comment on the very substantial shifts seen in the length-tension curves, on changing stimulus rate. For a rate of 3 pulses s−1 the optimum length is about 7 mm longer than that for 30 pulses s−1 (Fig. 1). The current view for the underlying mechanism is that at lower stimulus rates less Ca2+ is released during stimulation and there is an increase in the Ca2+ sensitivity of the myofilaments at longer lengths, leading to a longer optimum length (for a review, see Stephenson & Wendt, 1984).
The length-tension relation for maximal activation is believed to be entirely determined by overlap between the myofilaments. For submaximal activation some of the values on the ascending limb of the curve are in a region of reducing filament overlap so that here there is the combination of a reduced overlap tending to decrease tension and the raised Ca2+ sensitivity tending to increase it. The mechanism for the raised Ca2+ sensitivity remains uncertain, but it appears that for skeletal muscle it is not just a matter of an increase in binding affinity by troponin C (for a discussion see Stephenson & Wendt, 1984). For length-tension curves where activation processes dominate the shape of the curve, if the increased activation was delayed relative to the change in filament overlap, tension might be expected to transiently fall during a stretch. However, there was no evidence of such a trend.
Since the length-tension curves shifted in the direction of longer muscle lengths with submaximal activation and at these low stimulation rates force levels were very much lower, for each value of active tension, passive tension was proportionately higher than for comparable values on the full activation curve (see Fig. 9). If this passive tension lay entirely in parallel with sarcomeres, it raises the possibility that the sarcomere length-tension curves might have no descending limb. That, in turn, would prevent the development of sarcomere non-uniformities. Our data show that a tension excess after stretch and a deficit after shortening were still present with low stimulation rates, provided the movements were carried out on the descending limb of the active length-tension curve for that rate. This implies that, at the muscle lengths at which we worked, parallel elasticity within sarcomeres must have remained low.
Figure 9. Postulated sarcomere length-tension relation for maximal (A) and submaximal (B) activation.
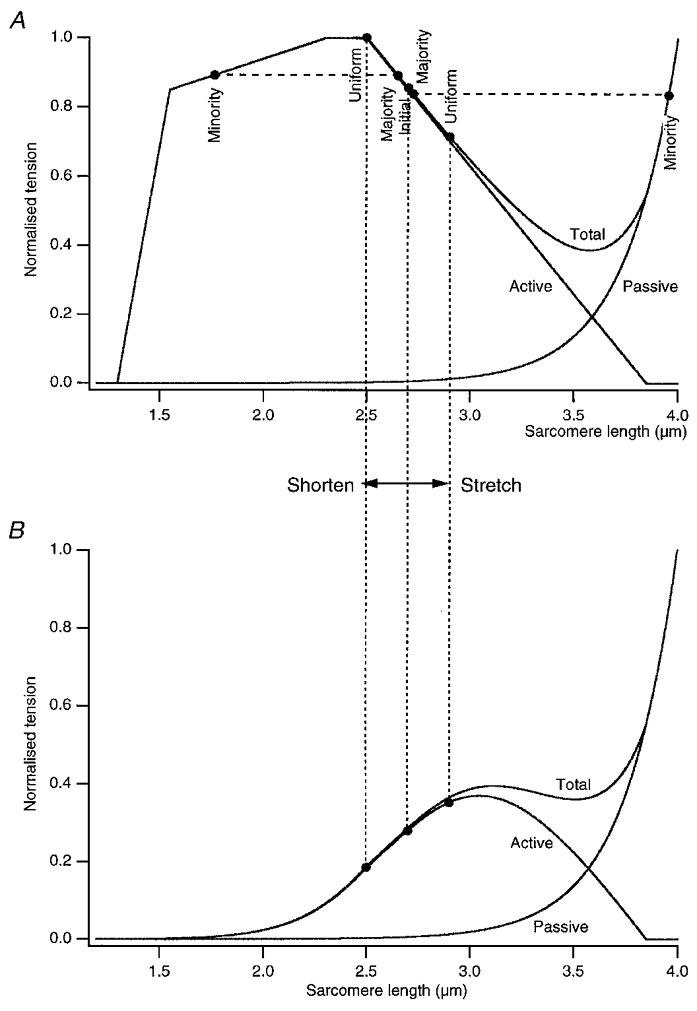
A, diagram used to illustrate the behaviour of sarcomeres during stretch or shortening of the muscle on the descending limb of the length-tension curve for maximal activation of the muscle. Here the theoretical curve for a single mammalian fibre has been used, based on Gordon et al. 1966 (see Stephenson & Wendt, 1984). A passive length-tension curve and a total length-tension curve have also been included. The starting sarcomere length was chosen to be 2.7 μm (Initial), a point part-way down on the descending limb of the curve. Stretching a muscle fibre by 7.5 % would lead to an expected increase in sarcomere length to 2.9 μm (Uniform). However, the weakest sarcomeres take up most of the stretch and continue to lengthen until at 3.95 μm their passive tension (Minority) is the same (dashed line) as that of the majority of sarcomeres which at 2.73 μm have lengthened very little (Majority). Similarly, for a 7.5 % shortening movement, while sarcomeres are expected to shorten from 2.7 to 2.5 μm (Uniform), some sarcomeres, the strongest, take up most of the shortening until they are on the ascending limb of their length-tension relation at 1.77 μm (Minority) and their tension matches (dashed line) the tension in the majority of sarcomeres (Majority) which have shortened only slightly (2.65 μm). B, active, passive and total length-tension curves modelled for a submaximally activated muscle. Points that were on the descending limb of the fully activated curve (A) are now on the ascending limb (dotted lines joining graphs in A and B). Therefore lengthening and shortening movements are no longer distributed non-uniformly between sarcomeres and do not lead to a tension excess or deficit.
The explanation we have used for our observations is based on the proposal put forward by Morgan (1990). He combined consideration of the muscle's length-tension and force- velocity relations to provide a comprehensive hypothesis which could be tested by computer modelling. The starting point is recognition of the descending limb of the length-tension curve as a region of potential instability for sarcomere length distributions. During an imposed stretch, any sarcomere which is lengthening over this range is becoming progressively weaker, leading to its further lengthening, a vicious circle effect. The shape of the force-velocity curve for lengthening (Katz, 1939) indicates that, for the initial lengthening, tension rises steeply, but once the yield point has been reached, the sarcomere will lengthen rapidly and uncontrollably, until rising forces in passive structures including the gap filaments (Huang et al. 1993) stop the movement. These considerations led to the proposal that lengthening of a contracting fibre occurs highly non-uniformly from the weakest sarcomere towards the strongest, the weakest stretching to beyond overlap. Other, stronger sarcomeres lengthen hardly at all and it is these which determine the tension recorded after the end of the stretch. Similar considerations can be applied to shortening movements. The shortening is largely taken up by the shorter, stronger sarcomeres, which move down the ascending limb of the length-tension relation, leading to depression of tension below the expected isometric value. The strongest sarcomeres are typically near the ends of the fibres so that segment-length recording shows clear non-uniformities during shortening (Julian & Morgan, 1979; Edman et al. 1993). By contrast, the weakest sarcomeres are scattered throughout the length of the fibre so that segment-length records show only small increases in dispersion after stretches.
These effects are represented diagrammatically in Fig. 9A. For an idealised fully activated mammalian muscle fibre, lengthening, for example, by 7.5 % from an average sarcomere length of 2.7 μm, if the lengthening was distributed uniformly, would leave sarcomeres at 2.9 μm. However, some sarcomeres, the weakest, lengthen into the region of no overlap until at 3.95 μm their passive tension matches that of the remaining sarcomeres (dashed line in Fig. 9A) which have lengthened only slightly to 2.73 μm. In other words, the recorded final tension after the stretch corresponds to a sarcomere length only a little longer than the starting length before the stretch, which is therefore higher than the isometric tension at 2.9 μm. Considering a similar sized shortening from the same point, 2.7 μm, if the shortening was distributed uniformly, sarcomere length would end up at 2.5 μm. In fact much of the shortening is taken up by a small number of sarcomeres, which are stronger than the others, and they shorten to 1.77 μm while the majority shorten only to 2.65 μm. Again, the forces generated at these two points are the same (dashed line in Fig. 9A) and are less than the isometric tension at 2.5 μm.
Figure 9B shows active, passive and total tension for a length-tension relation modelled for submaximal activation. The dotted lines joining the upper and lower panels of Fig. 9 indicate that points on the descending limb of the curve for maximal activation may lie on the ascending limb of the curve for submaximal activation. Over this length range, therefore, during submaximal activation, sarcomere non-uniformities do not develop during lengthening and shortening movements so that a tension excess or deficit is not present.
We believe that the strongest evidence in support of our view comes from the relation between the amount of tension excess during lengthening and the length relative to optimum (Lopt,max or Lopt,sub) and from similar data for shortening. The highly significant dependence on stimulation rate when Lopt,max was the variable contrasted with the lack of significance when Lopt,sub was the variable. Given that this analysis is based on a large number of comparisons, 132 for lengthenings and 96 for shortenings, the findings indicate that the tension increment or deficit depends on the optimum length for that stimulation rate, as the effect of stimulus rate could be entirely accounted for in terms of its effect on the optimum length.
It is now necessary to consider some of the observations of others on this subject. There are recent reports of tension changes in the cat soleus muscle during and after stretches and shortenings of the contracting muscle (Herzog & Leonard, 1997). An important methodological difference between that work and our own is that we used a maximum stimulation rate of 30 pulses s−1 while those authors used 100 pulses s−1 throughout the experiment. The higher stimulus rate risks greater effects of fatigue, both muscular and neuromuscular. In discussing their findings, Herzog (1998) concluded that there were likely to be separate explanations for the force enhancement by stretch and the deficit by shortening. Support for their view was provided by the observation of a parallel decrease in muscle stiffness, measured using vibration, and force during shortening but not a parallel increase during lengthening (Sugi & Tsuchiya, 1988). Our interpretation of this finding is based on the view that after a stretch a fibre consists of some active sarcomeres in series with a number of overstretched sarcomeres. Active sarcomeres are thought to have a dynamic stiffness proportional to the number of cross-bridges (Ford et al. 1977). Over-stretched sarcomeres will be substantially more compliant, their stiffness being related to the slope of the passive length-tension curve at that point (Fig. 9). Therefore the reduced stiffness after stretch is the result of the combined influences of the sarcomeres with no overlap and the still functional sarcomeres. For shortening, on the other hand, the few sarcomeres that shorten increase their overlap and so become stiffer. The majority of sarcomeres, however, shorten very little, so stiffness increases only slightly. Hence the stiffness measurements are consistent with an explanation based on non-uniform length changes in sarcomeres.
In considering various explanations for the deficit in force after shortening, Herzog (1998) dismissed the sarcomere non-uniformity hypothesis on the grounds that Granzier & Pollack (1989) had observed a similar depression in freely shortening and segment-clamped muscle fibres. However, the method of segment length control does not, in fact, control sarcomere length and therefore a tension deficit will still be expected if non-uniformities develop within the segment.
Arguments used by Granzier & Pollack (1989) in favour of two separate mechanisms for the effects of lengthening and shortening were that force enhancement after stretch could be abolished by a brief interruption of the stimulus, while this was not the case for shortenings. In our hands, effects of stimulus interruption were similar, eliminating the difference in tension between that after lengthening or shortening and the respective isometric tensions (Fig. 8). One possible explanation for these differences in observations is that when muscle fibres are stimulated at high rates (frog semitendinosus at 50 pulses s−1; Granzier & Pollack, 1989) the likelihood for development of significant fatigue effects is enhanced, particularly during the long-duration contractions required by these experiments. A comparison of tension with different histories of contraction must take this into account (see Figs 9 and 10 of Granzier & Pollack, 1989).
Other observations used to argue for different mechanisms for the effects of lengthening and shortening were that the deficit after shortening persisted at short sarcomere lengths (but see Fig. 6) and that while force enhancement was independent of stretch velocity, the deficit was shortening velocity dependent. In our view this latter finding is what would be expected, since the degree of shortening of stronger sarcomeres depends on the size and the slowness of the movement (Fig. 7). With faster shortenings, given the shape of the force-velocity curve, any difference in shortening velocity between a strong and a weak sarcomere becomes less, so that the force deficit becomes less (Morgan et al. 1991). For lengthening, no matter how fast the stretches, any difference in force generation by strong and weak sarcomeres will remain the same.
Is there significance in any of this for the whole animal? Presumably the increased compliance from overstretched sarcomeres provides some protection against damage to muscle and tendon when they are stretched to long lengths. Repeated active stretches of a muscle on the plateau and descending limb of its length-tension curve will lead to overstretch and disruption of some sarcomeres, with eventual damage to whole muscle fibres (Morgan, 1992; Wood et al. 1993; Jones et al. 1997). That, in turn, will lead to muscle soreness and swelling, followed by adaptive changes providing the muscle with protection against further damage (Whitehead et al. 1998). These are important issues for sports medicine and exercise physiology.
To conclude, this study provides new evidence in support of the sarcomere non-uniformities hypothesis to account for the observed tension excess after stretch and deficit after shortening in mammalian slow twitch muscle. The observed length dependence and its relation to stimulation rate are strong arguments in support of this hypothesis.
Acknowledgments
This work was carried out with support from the National Health and Medical Research Council of Australia.
References
- Abbott BC, Aubert XM. The force exerted by active striated muscle during and after change in length. The Journal of Physiology. 1952;117:77–86. [PMC free article] [PubMed] [Google Scholar]
- Al-Amood WS, Pope R. A comparison of the structural features of muscle fibres from a fast and a slow-twitch muscle of the pelvic limb of the cat. Journal of Anatomy. 1972;113:49–60. [PMC free article] [PubMed] [Google Scholar]
- Brown TIH, Huang Y, Morgan DL, Proske U, Wise AK. A new strategy for controlling the level of activation in artificially stimulated muscle. IEEE Transactions on Rehabilitation Engineering. 1999;7:167–173. doi: 10.1109/86.769407. [DOI] [PubMed] [Google Scholar]
- Délèze JB. The mechanical properties of the semitendinosus muscle at lengths greater than its length in the body. The Journal of Physiology. 1961;158:154–164. [PMC free article] [PubMed] [Google Scholar]
- Edman KAP, Caputo C, Lou F. Depression of tetanic force induced by loaded shortening of frog muscle fibres. The Journal of Physiology. 1993;466:535–552. [PMC free article] [PubMed] [Google Scholar]
- Edman KAP, Elzinga G, Noble MIM. Enhancement of mechanical performance by stretch during tetanic contractions of vertebrate skeletal muscle fibres. The Journal of Physiology. 1978;281:139–155. doi: 10.1113/jphysiol.1978.sp012413. [DOI] [PMC free article] [PubMed] [Google Scholar]
- Edman KAP, Tsuchiya T. Strain of passive elements during force enhancement by stretch in frog muscle fibres. The Journal of Physiology. 1996;490:191–205. doi: 10.1113/jphysiol.1996.sp021135. [DOI] [PMC free article] [PubMed] [Google Scholar]
- Ford LE, Huxley AF, Simmons RM. Tension responses to sudden length change in stimulated frog muscle fibres near slack length. The Journal of Physiology. 1977;269:441–515. doi: 10.1113/jphysiol.1977.sp011911. [DOI] [PMC free article] [PubMed] [Google Scholar]
- Gordon AM, Huxley AF, Julian FJ. The variation in isometric tension with sarcomere length in vertebrate muscle fibres. The Journal of Physiology. 1966;184:170–192. doi: 10.1113/jphysiol.1966.sp007909. [DOI] [PMC free article] [PubMed] [Google Scholar]
- Granzier HLM, Pollack GH. Effect of active pre-shortening on isometric and isotonic performance of single frog muscle fibres. The Journal of Physiology. 1989;415:299–327. doi: 10.1113/jphysiol.1989.sp017723. [DOI] [PMC free article] [PubMed] [Google Scholar]
- Herzog W. History dependence of force production in skeletal muscle: a proposal for mechanisms. Journal of Electromyography and Kinesiology. 1998;8:111–117. [PubMed] [Google Scholar]
- Herzog W, Leonard TR. Depression of cat soleus forces following isokinetic shortening. Journal of Biomechanics. 1997;30:865–872. doi: 10.1016/s0021-9290(97)00046-8. [DOI] [PubMed] [Google Scholar]
- Hill AV. The mechanics of active muscle. Proceedings of the Royal Society B. 1953;141:104–117. doi: 10.1098/rspb.1953.0027. [DOI] [PubMed] [Google Scholar]
- Huang K, McCarter R, Wright J, Beverley J, Ramirez-Mitchell R. Viscoelasticity of the sarcomere matrix of skeletal muscle. Biophysical Journal. 1993;64:1161–1177. doi: 10.1016/S0006-3495(93)81482-6. [DOI] [PMC free article] [PubMed] [Google Scholar]
- Jones C, Allen TJ, Talbot J, Morgan DL, Proske U. Changes in mechanical properties of human and amphibian muscle after eccentric exercise. European Journal of Applied Physiology and Occupational Physiology. 1997;76:21–31. doi: 10.1007/s004210050208. [DOI] [PubMed] [Google Scholar]
- Julian FJ, Morgan DL. The effect on tension of non-uniform distribution of length changes applied to frog muscle fibres. The Journal of Physiology. 1979;293:379–392. doi: 10.1113/jphysiol.1979.sp012895. [DOI] [PMC free article] [PubMed] [Google Scholar]
- Katz B. The relation between force and speed in muscular contraction. The Journal of Physiology. 1939;96:45–64. doi: 10.1113/jphysiol.1939.sp003756. [DOI] [PMC free article] [PubMed] [Google Scholar]
- Morgan DL. New insights into the behavior of muscle during active lengthening. Biophysical Journal. 1990;57:209–221. doi: 10.1016/S0006-3495(90)82524-8. [DOI] [PMC free article] [PubMed] [Google Scholar]
- Morgan DL. Intersarcomere dynamics: Implications for exercise. Proceedings of the Australian Physiological and Pharmacological Society. 1992;23:31–39. [Google Scholar]
- Morgan DL. An explanation for residual increased tension in striated muscle after stretch during contraction. Experimental Physiology. 1994;79:831–838. doi: 10.1113/expphysiol.1994.sp003811. [DOI] [PubMed] [Google Scholar]
- Morgan DL, Claflin DR, Julian FJ. Tension as a function of sarcomere length and velocity of shortening in single skeletal muscle fibres of the frog. The Journal of Physiology. 1991;441:719–732. doi: 10.1113/jphysiol.1991.sp018775. [DOI] [PMC free article] [PubMed] [Google Scholar]
- Noble MIM. Enhancement of mechanical performance of striated muscle by stretch during contraction. Experimental Physiology. 1992;77:539–552. doi: 10.1113/expphysiol.1992.sp003618. [DOI] [PubMed] [Google Scholar]
- Rack PMH, Westbury DR. The effects of length and stimulus rate on tension in the isometric cat soleus muscle. The Journal of Physiology. 1969;204:443–460. doi: 10.1113/jphysiol.1969.sp008923. [DOI] [PMC free article] [PubMed] [Google Scholar]
- Stephenson DG, Wendt IR. Length dependence of changes in sarcoplasmic calcium concentration and myofibrillar calcium sensitivity in striated muscle fibres. Journal of Muscle Research and Cell Motility. 1984;5:243–272. doi: 10.1007/BF00713107. [DOI] [PubMed] [Google Scholar]
- Sugi H, Tsuchiya T. Stiffness changes during enhancement and deficit of isometric force by slow length changes in frog skeletal muscle fibres. The Journal of Physiology. 1988;407:215–229. doi: 10.1113/jphysiol.1988.sp017411. [DOI] [PMC free article] [PubMed] [Google Scholar]
- Whitehead NP, Allen TJ, Morgan DL, Proske U. Damage to human muscle from eccentric exercise after training with concentric exercise. The Journal of Physiology. 1998;512:615–620. doi: 10.1111/j.1469-7793.1998.615be.x. [DOI] [PMC free article] [PubMed] [Google Scholar]
- Wise AK, Gregory JE, Proske U. The responses of muscle spindles to small, slow movements in passive muscle and during fusimotor activity. Brain Research. 1999;821:87–94. doi: 10.1016/s0006-8993(99)01071-9. [DOI] [PubMed] [Google Scholar]
- Wood SA, Morgan DL, Proske U. Effects of repeated eccentric contractions on structure and mechanical properties of toad sartorius muscle. American Journal of Physiology. 1993;265:792–800. doi: 10.1152/ajpcell.1993.265.3.C792. [DOI] [PubMed] [Google Scholar]