

Abstract
We investigated the effects of pH elevation or depression on adenosine output from buffer-perfused rat gracilis muscle, and kinetic properties of adenosine-forming enzymes, 5′-nucleotidase (5′N) and non-specific phosphatase (PT), and adenosine-removing enzymes, adenosine kinase (AK) and adenosine deaminase (AD), in homogenates of muscle.
Depression of the perfusion buffer pH from 7.4 to 6.8, by addition of sodium acetate, reduced arterial perfusion pressure from 8.44 ± 1.44 to 7.33 ± 0.58 kPa, and increased adenosine output from 35 ± 5 to 56 ± 6 pmol min−1 (g wet wt muscle)−1 and AMP output from 1.8 ± 0.3 to 9.1 ± 3.9 pmol min−1 (g wet wt muscle)−1.
Elevation of the buffer pH to 7.8, by addition of ammonium chloride, reduced arterial perfusion pressure from 8.74 ± 0.57 to 6.96 ± 1.37 kPa, and increased adenosine output from 25 ± 5 to 47 ± 8 pmol min−1 (g wet wt muscle)−1 and AMP output from 3.7 ± 1.1 to 24.6 ± 6.8 pmol min−1 (g wet wt muscle)−1.
Activity of membrane-bound 5′N was an order of magnitude higher than that of either cytosolic 5′N or PT: pH depression reduced the Km of 5′N, which increased its capacity to form adenosine by 10–20% for every 0.5 unit decrease in pH within the physiological range. PT was only found in the membrane fraction: its contribution to extracellular adenosine formation increased from about 5% at pH 7.0 to about 15% at pH 8.0.
Cytosolic 5′N had a low activity, which was unaffected by pH; the rate of intracellular adenosine formation was an order of magnitude lower than the rate of adenosine removal by adenosine kinase or adenosine deaminase, which were both exclusively intracellular enzymes.
We conclude that (i) adenosine is formed in the extracellular compartment of rat skeletal muscle, principally by membrane-bound 5′N, where it is protected from enzymatic breakdown; (ii) adenosine is formed intracellularly at a very low rate, and is unlikely to leave the cell; (iii) enhanced adenosine formation at low pH is driven by an increased extracellular AMP concentration and an increased affinity of membrane-bound 5′N for AMP; (iv) enhanced adenosine formation at high pH is driven solely by the elevated extracellular AMP concentration, since the catalytic capacity of membrane 5′N is reduced at high pH.
Adenosine was originally thought to be released from skeletal muscle as the result of an insufficient oxygen supply (Imai et al. 1964) since ischaemia enhanced the adenosine release during muscle contractions. Later research has found that, under in vivo conditions, there is no correlation between indices of oxygenation and the adenosine output from oxidative red muscle during contractions, but the output is linearly correlated with the decrease in pH, and adenosine output can be stimulated by depression of cellular pH (Ballard, 1991; Achike & Ballard, 1993; Mo & Ballard, 1994). The effects of alkalosis on adenosine output from skeletal muscle have not yet been determined. Thus the adenosine output from oxidative skeletal muscle in vivo might be controlled directly or indirectly by the pH, but the mechanism by which pH depression could stimulate adenosine output from muscle cells is not clear.
Adenosine is produced when 5′-nucleotidase (5′N) or non-specific phosphatases (alkaline and acid phosphatases; PT) remove the phosphate group from AMP. 5′N exists in membrane-bound (ecto-) and cytosolic forms. Compared with 5′N, PT is generally thought to play a minor role in catalysing the hydrolysis of AMP to adenosine (Fernley, 1971; Hollander, 1971). Adenosine is removed by adenosine kinase (AK) and adenosine deaminase (AD). Therefore, we can predict that, theoretically, adenosine output might be increased by an increased activity of the enzymes for adenosine formation (5′N and PT) and/or decreased activity of the enzymes for adenosine removal (AK and AD) and/or increased availability of the substrate for adenosine formation (AMP). The effects of pH on AMP availability have not previously been studied.
Several studies have suggested that in heart the intracellular pathway is the dominant route for production of adenosine, especially under ischaemic or hypoxic conditions (Meghji et al. 1988; Newby, 1988; Darvish et al. 1996). The contributions of the intra- and extracellular pathways to adenosine formation in skeletal muscle are less clear. Studying the histochemical properties of rat and guinea-pig skeletal muscle, Rubio et al. (1973) suggested that adenosine is exclusively formed from the dephosphorylation of extracellular AMP by ecto-5′N. However, inhibition of ecto-5′N in in vivo studies of dog skeletal muscle has yielded contradictory results (Kille & Klabunde, 1984; Fuchs et al. 1986). Thus, it is uncertain whether extracellular formation of adenosine via ecto-5′N is the main pathway in skeletal muscle.
The ecto- and cytosolic 5′Ns have been purified from the heart, liver, or brain of several species and the skeletal muscle of guinea-pig, and have been reported to have pH maxima in the range 7–9 (Arch & Newsholme, 1978; Naito & Lowenstein, 1981; Camici et al. 1985; Newby, 1988; Skladanowski & Newby, 1990). The 5′N from guinea-pig skeletal muscle appeared to be an ecto-enzyme (Camici et al. 1985) and its pH optimum was at pH 8. Arch & Newsholme (1978) found that the activity of AK in rat skeletal muscle was higher at pH 5.3 than at pH 7.5, but the muscle selected (gastrocnemius) consisted of a mixture of white and red fibres, whereas, to date, a significant relationship between pH depression and adenosine output has only been demonstrated in red, oxidative muscle (Mo & Ballard, 1994). Thus, there is no obvious reason why pH depression should cause increased adenosine output from skeletal muscle. However, there are substantial differences in the properties of the enzymes from the various tissues and different species, and the effects of pH on the activities of all the enzymes directly involved in adenosine metabolism in oxidative skeletal muscle have not been thoroughly investigated.
The main purposes of the present study were (1) to determine directly the effects of acidosis or alkalosis on the adenosine and AMP output from the in situ buffer-perfused gracilis muscle of the rat, (2) to investigate the effects of changes in pH on the key adenosine-metabolising enzymes (5′N, PT, AK and AD) in oxidative skeletal muscle from the rat, and (3) to evaluate the contributions of membrane-bound (ecto-) and cytosolic 5′N to adenosine production in oxidative skeletal muscle.
METHODS
Animals
All experimental protocols were approved by the University of Hong Kong Committee on the Use of Live Animals in Teaching and Research. Male Sprague-Dawley rats weighing ∼400 g were used. All the animals had free access to food and water prior to the experiments. Rats were anaesthetised by intraperitoneal injection of sodium pentobarbitone (6.0-7.0 mg (100 g)−1; Sagatal, RMB Animal Health Ltd, Dagenham, UK) and heparin (500 U).
Isolation and perfusion of the gracilis muscle
The skin was opened ventrally from the mid-pubic region along the mid-line of the hindquarter towards the paw. The skin was deflected and the superficial circumflex, iliac, popliteal and saphenous vessels were tied. The femoral vessels were tied below the origin of the muscular branch so as to restrict perfusion to the gracilis muscle. In order to allow unrestricted access to the upper regions of the femoral vessels, the abdominal wall was incised across the pubic region towards the other hindquarter. The distal colon and surrounding blood vessels were ligated and cut. The abdominal viscera were deflected and adipose tissue in the perineal and retroperineal regions was cauterised.
The femoral vessels were separated with fine atraumatic forceps (Fine Science Tools Inc., North Vancouver, Canada). The femoral artery was cannulated and connected to the perfusion circuit (Fig. 1). About 0.5 ml saline containing 100 U heparin was injected from a syringe through the cannula, then buffer perfusion was initiated at a flow rate of 45 ± 2 μl min−1 (g wet wt muscle)−1using a modified Krebs-Henseleit bicarbonate buffer containing 11 mM glucose, 59 g l−1 dextran (MW 60000–90000), 1 g l−1 albumin and 100 μl l−1 antifoam A (Sigma, St Louis, USA) at pH 7.4. For experiments at pH 6.8, 30 mM sodium chloride was replaced by 30 mM sodium acetate, and for experiments at pH 7.8, 30 mM sodium chloride was replaced by an equal amount of ammonium chloride. Buffer pH was monitored in the perfusion reservoirs, and fine adjustments to pH were made, if required, by adjustments to the rate of bubbling with 95 % O2-5 % CO2. The femoral vein was cannulated to allow collection of the perfusion buffer draining out of the muscle; the venous cannula was secured at the same level as the arterial cannula. The arterial perfusion pressure was monitored with a transducer attached to the arterial side of the perfusion circuit and recorded on a Lectromed MX 216 recorder (Lectromed Ltd, St Peter, Jersey, Channel Islands). The pH of the venous effluent was monitored from a standard glass electrode attached to the venous part of the perfusion circuit.
Figure 1. Perfused rat gracilis muscle preparation.
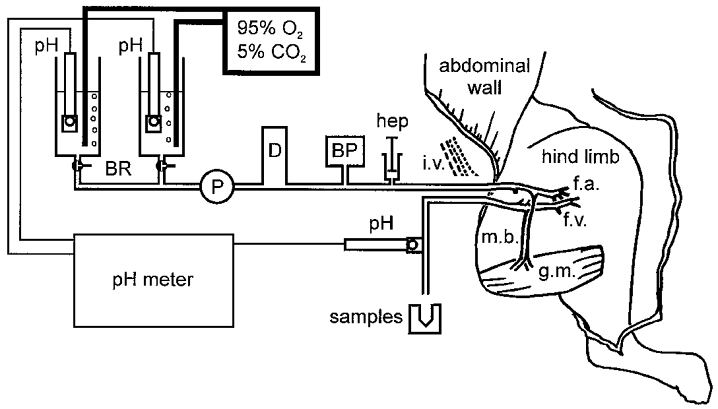
The skin overlying the abdomen and hindlimb was opened, and the gracilis muscle (g.m.) was isolated by ligating or cauterising any small vessels in the connective tissues surrounding it. The femoral vessels were tied just below the origins of the muscular branches (m.b.) supplying the gracilis muscle, and any other branches arising from the upper regions of the femoral vessels were also tied. Cannulae were placed in the femoral artery (f.a.) and vein (f.v.) close to their junctions with the iliac vessels (i.v.). Immediately after cannulation of the femoral artery, heparin (hep) was injected through the cannula, and the muscle was then perfused at constant flow with buffer drawn from one of the buffer reservoirs (BR) using a peristaltic pump (P). The arterial perfusion pressure was monitored with a transducer (BP) attached to the circuit, and pressure pulsations arising from the pump were damped by circulating the buffer through a damping chamber (D). The effluent draining from the isolated section of the femoral vein was allowed to run to waste, except during the sampling periods, when it was collected on ice. The pH values of the two perfusion buffers and of the venous effluent were monitored with glass electrodes (pH): alterations to the rates of bubbling of the perfusion buffers with 95 % O2-5 % CO2 were used to keep their pH at the desired values.
After the buffer perfusion had been established, the rat was killed with an overdose of sodium pentobarbitone.
Preparation of muscle homogenates for enzyme assays
In a separate group of rats, both hindlegs were skinned and the soleus and gracilis muscles were rapidly removed and freed of fat and connective tissue. All tissues were placed in liquid nitrogen immediately after removal from the animal, and stored at −80°C until the homogenisation and assay procedures were performed. The rats were killed with an overdose of sodium pentobarbitone after the muscles had been removed.
All purification procedures were performed at 0–4°C, unless otherwise indicated. The muscle tissues were first sliced with a Tissue Tearor (Dremel, Model 396, Truebite Inc., Vestel, NY, USA) and then homogenised in 20 vol. of extraction medium. The assays of AK and AD were performed in a crude homogenate, for which the extraction medium consisted of 1 mM MgCl2, 1 mM EDTA and 1 % (v/v) Triton X-100 at pH 7.0.
For the assays of 5′N and PT, the homogenate was further purified into membrane and cytosolic fractions by differential centrifugation: the extraction medium consisted of 25 M sucrose, 0.2 mM Na-EDTA and 0.5 mM MgCl2. The homogenate was centrifuged at 900 g (Beckman J6-B, Fullerton, CA, USA) for 7 min and the precipitate discarded. The supernatant was centrifuged at 77000 g (Beckman L8-M Ultracentrifuge) for 60 min. The resulting supernatant (cytosol 1) was kept. The precipitate containing membrane was resuspended in 20 vol. of extraction medium and centrifuged again at 77000 g for 60 min. The supernatant (cytosol 2) was combined with cytosol 1.
The membrane proteins in the precipitate were solubilised by stirring the resuspended precipitate in 20 vol. of 0.1 mM Na-EDTA, 0.5 mM MgCl2 and 1 % Triton X-100 (30 min at 37°C), and then centrifuging at 77000 g for 60 min. The supernatant (membrane 1) was saved, and the precipitate was resuspended, stirred and centrifuged as before. The two supernatants (membrane 1 and membrane 2), containing the solubilised membrane proteins, were combined.
Analytical procedures
Determination of adenosine and AMP in venous effluent from perfused gracilis muscle
Samples of the venous effluent collected during perfusion were centrifuged at 30000 r.p.m. for 15 s (Beckman Microfuge E): duplicate 200 μl aliquots of the supernatant were deproteinised with 1.5 ml ice-cold acetone and extracted with 1.5 ml chloroform. All treated samples were evaporated under nitrogen for 30 min at 0.5°C. The adenosine concentration was determined in one of the duplicates by high-pressure liquid chromatography (HPLC) as previously described (Ballard, 1991). AMP was determined in the other sample by anion-exchange HPLC: samples were chromatographed on a 25 cm × 4.6 mm SAX column (Supelco, Bellefonte, PA, USA) using a gradient of 0.006 M potassium orthophosphate-0.01 M acetic acid, pH 4.0 (solvent A) and 0.6 M potassium orthophosphate, pH 5.0 (solvent B). Peaks were quantified by their absorbance at 260 nm. The recovery of AMP from the extraction and chromatography procedure was 24 ± 5 % (n = 15).
Assay of AD and AK in muscle homogenate
These enzymes were assayed by following the conversion of radioactive adenosine into AMP or inosine. The incubation medium for the AK assay consisted of (final concentrations) 3.3 mM citric acid, 77 mM Na2HPO4, 4 mM MgCl2, 0.4 mM EDTA, 8 mM phosphocreatine, 0.2 mg ml−1 creatine phosphokinase, 0.03 mg ml−1 adenylate kinase, 4 mM ATP and various concentrations (0.5-80 μM) of [8-4C]adenosine, plus coformycin (50 μM) to inhibit AD and AMP deaminase (Newby et al. 1987). The incubation medium for the AD assay was similar to that for the AK assay, except that (1) the concentrations of [8-14C]adenosine varied from 25 to 1000 μM, and (2) 5′-amino-5′-deoxyadenosine (80 μM) replaced coformycin, in order to inhibit AK (Newby et al. 1987). The reaction was started by addition of 6 μl homogenate to 14 μl incubation medium, and terminated after 15 min incubation at 30°C by the addition of 3.5 μl of 2 M HClO4 containing adenine, adenosine, hypoxanthine, inosine, ADP and AMP at approximately 5 mM concentrations.
Assay of 5′N and PT in muscle homogenate
5′N activity was assayed by measuring the conversion of [14C]AMP into [14C]adenosine in an incubation medium consisting of 50 mM Tris-maleate, 10 mM MgCl2, 0.4 mM EDTA, 1 mM dithiothreitol, 0.3 mM adenosine, 50 μM coformycin to inhibit AMP deaminase, and various concentrations (25–600 μM) of [8-14C]AMP. The sample was pre-incubated with 10 mM β-glycerophosphate for 10 min to inhibit PT activity (Newby et al. 1987). In all other respects, the method was similar to that for AK and AD, except that the reaction was terminated after 10 min by placing the tubes in a boiling-water bath for 3 min. PT was assayed in a similar manner, except that the sample was pre-incubated with 0.1 mM α,β-methylene ADP (AOPCP) to inhibit 5′N (Newby et al. 1987).
Purification and quantification of assay products
The tubes containing the terminated assay solutions were centrifuged at 2000 g for 5 min, and adenosine, inosine and adenine nucleotides present in 5 μl of the supernatant were separated from each other by thin layer chromatography (Arch & Newsholme, 1976). The separated assay products were quantified by scintillation counting.
Experimental methods
The influence of pH on adenosine and AMP output from perfused gracilis muscle
The gracilis muscle was kept at its approximate resting length. The preparation was perfused with the control buffer (pH 7.4) for a 15 min equilibration period, then two control samples of the venous effluent (3 min each) were collected into 1.5 ml pre-cooled tubes and stored on ice until further treatment. Perfusion was switched over to buffer at pH 6.8 (acidosis) or 7.8 (alkalosis). Following a 15 min equilibration period (of which, about 5 min was the time for the new buffer to pass through the dead volume of the circuit), two samples of the venous effluent were again collected.
The influence of pH on adenosine-metabolising enzymes in muscle homogenate
The pH of the incubation buffer for the assay was varied between 5.5 and 9.0 by varying the concentrations of citric acid and Na2HPO4 (AK and AD assays), or by the addition of NaOH or HCl (5′N and PT assays). Each enzyme was assayed at five different concentrations of substrate (AMP or adenosine) at each pH value. All assays were performed in triplicate, each one using pooled tissue from six rats. Enzyme activities are expressed as nanomoles of product per minute per milligram of protein at 30°C. The protein concentrations of the homogenates were determined by the method of Lowry et al. (1951). Enzymes in the soleus muscle homogenate were assayed at all five pH values, and enzymes in the gracilis muscle homogenate at pH 7.5 only.
The maximal activity (Vmax) and Michaelis constant (Km; a value which is inversely related to the affinity of the enzyme for its substrate) were determined for each enzyme at each pH from the substrate concentration versus activity plot, using computer software designed for calculating enzyme kinetic parameters (Enzfitter, R. J. Leatherbarrow, Biosoft Co., Cambridge, UK). The ability of the enzyme to convert substrate to products was quantified by the catalytic efficiency of the enzyme (Kcat; Vmax/Km), since this parameter takes into account changes in both activity of the enzyme and its affinity for the substrate; the actual rate of formation of product at any given substrate concentration was calculated from the formula:
where V is the rate of product formation and [S] is the substrate concentration.
Statistical analysis
Experiments on the perfused gracilis muscle
Values are expressed as means ±s.e.m. of the number of tests shown. Student's paired t test is used for statistical evaluation within the treatment group and Student's unpaired t test for comparisons between the treatment groups.
Experiments on the muscle homogenate
Values of enzyme activity are the means of three estimations, and values of Vmax and Km are the values calculated from the computer curve fitting. Statistical comparisons of individual values are not therefore possible. However, the experimental errors were evaluated by performing four sets of triplicate estimations of activity, at each of the five concentrations, for two of the enzymes. Standard errors for the 12 estimations averaged 3.3 % of the mean (range 2.4-4.7 %) for membrane 5′N and 3.8 % of the mean (range 2.6-5.5 %) for cytosolic 5′N. The internal variation (range/2, expressed as a percentage of the mean), which gives a result similar to the standard deviation in very small samples, was assessed for each set of triplicate estimations: internal variation averaged 7.6 % for membrane 5′N and 10.5 % for cytosolic 5′N. Therefore, values for enzyme kinetic parameters were deemed to be significantly different if they differed from each other by at least 10 %.
RESULTS
The influence of pH on adenosine and AMP output from perfused gracilis muscle
Twelve rats were used: the effect of pH depression was tested six times in six rats, and the effect of pH elevation was tested six times in six rats.
A decrease in the pH of the perfusion buffer from 7.4 to 6.8 reduced the venous pH from 7.40 ± 0.02 to 6.93 ± 0.05 (n = 6), and the perfusion pressure from 8.44 ± 1.44 to 7.33 ± 0.58 kPa (n = 6; P < 0.0002). An increase in the pH of the perfusion buffer to pH 7.8 raised the venous pH from 7.43 ± 0.01 to 7.79 ± 0.01 (n = 6), and reduced the perfusion pressure from 8.74 ± 0.57 to 6.96 ± 1.37 kPa (n = 6; P < 0.0002).
Either reduction or elevation of the pH from its normal level resulted in an increase in the venous adenosine concentration (Fig. 2). pH depression increased the adenosine output from the muscle from 35 ± 5 to 56 ± 6 pmol min−1 (g wet wt muscle)−1 (n = 6; P < 0.005), whereas pH elevation increased the adenosine output from 25 ± 5 to 47 ± 8 pmol min−1 (g wet wt muscle)−1 (n = 6; P < 0.05). With either reduction or elevation of the pH, the venous adenosine concentration was significantly (P < 0.01) higher in the 18 min sample than in the 15 min sample. The adenosine outputs in the two control periods were not significantly different from each other.
Figure 2. Influence of perfusion with acidic (pH 6.8) or alkaline (pH 7.8) buffer on the appearance of adenosine and AMP in the venous effluent from the isolated rat gracilis muscle.

Samples were collected for two successive 3 min periods following a 15 min period of equilibration with the buffer. Values are the means ±s.e.m. of 6 tests. *P < 0.05; **P < 0.02; ***P < 0.0075 in a paired t test against the corresponding value at pH 7.4.
The muscle venous AMP concentration was also elevated by either a reduction or an elevation of the pH from its normal level (Fig. 2). The AMP outputs in the two control periods were not significantly different from each other (1.8 ± 0.3 and 3.7 ± 1.1 pmol min−1 (g wet wt muscle)−1 in acidosis and alkalosis, respectively). AMP output increased to 9.1 ± 3.9 pmol min−1 (g wet wt muscle)−1 (n = 6; P < 0.05) in acidosis and to 24.6 ± 6.8 pmol min−1 (g wet wt muscle)−1 (n = 6; P < 0.0005) in alkalosis. However, the venous AMP concentrations after 15 min were not significantly different from those after 18 min in either acidosis or alkalosis.
The influence of pH on adenosine-metabolising enzymes in muscle homogenate
The membrane, cytosolic and total proteins accounted for 1.4, 7.0 and 8.4 % (w/w), respectively, of the total wet weight for fresh rat soleus muscle, and 1.6, 6.6 and 8.1 % (w/w) for gracilis muscle.
Effect of pH on the kinetics of adenosine-forming enzymes from soleus muscle
Pilot studies showed that the cytosolic preparation contained negligible PT activity, so only data from the membrane fraction are presented. Both the membrane and the cytosolic preparation contained 5′N activities. Membrane 5′N had its highest Vmax at pH 7.5, whereas both PT and cytosolic 5′N had their highest Vmax values at pH 9 (Fig. 3, Table 1). At pH 7.5, the activity of membrane 5′N was almost an order of magnitude higher than the activity of either cytosolic 5′N or PT (Fig. 3).
Figure 3. Activity of adenosine-forming enzymes from rat soleus (open symbols) or gracilis (filled symbols) muscles at different pHs.

Values are the means of 3 estimations using the pooled tissues from 6 rats.
Table 1. Kinetic properties of adenosine-forming enzymes from rat soleus and gracilis muscles.
| Soleus muscle | Gracilis muscle | ||||||
|---|---|---|---|---|---|---|---|
| pH | 5.5 | 6.5 | 7.0 | 7.5 | 9.0 | 7.5 | |
| Membrane | Vmax | 9.4 | 26.1 | 35.3 | 43.5 | 23.2 | 23.8 |
| 5′nucleotidase | Km | 200 | 32 | 47 | 70 | 82 | 76 |
| Kcat | 0.05 | 0.82 | 0.75 | 0.62 | 0.28 | 0.31 | |
| Membrane | Vmax | 1.6 | 4.8 | 6.1 | 6.8 | 8.1 | — |
| Phosphatase | Km | 637 | 512 | 146 | 96 | 56 | — |
| Kcat | 0.003 | 0.009 | 0.04 | 0.07 | 0.14 | — | |
| Cytosolic | Vmax | 2.7 | 4.8 | 5.2 | 5.7 | 8.7 | 2.6 |
| 5′nucleotidase | Km | 559 | 167 | 175 | 172 | 176 | 177 |
| Kcat | 0.01 | 0.03 | 0.03 | 0.03 | 0.05 | 0.01 | |
Vmax is expressed in units of nmol min−1 (mg protein)−1, and Km in units of μM. Kcat is calculated as Vmax/Km.
Changes in pH also changed the affinity of the enzyme for the substrate: the Km of membrane 5′N was at its lowest at pH 6.5, and the affinity decreased with changes in the pH either above or below this value (Table 1). The Km of cytosolic 5′N, on the other hand, remained unchanged across the pH range from 6.5 to 9.0, although it increased sharply below pH 6.5 (Table 1). For PT, the Km decreased by an order of magnitude over the pH range from 5.5 to 9.0 (Table 1).
The Kcat for membrane 5′N remained high across the physiological pH range 6.5-7.5, and tended to increase as the pH decreased within this range (Table 1). Outside of the physiological pH range, it dropped sharply. The Kcat for cytosolic 5′N was more than an order of magnitude smaller than that for membrane 5′N in the physiological pH range, and was unaffected by pH. The Kcat for PT increased by almost two orders of magnitude across the whole pH range from 5.5 to 9.0, and by more than one order of magnitude across the physiologically relevant pH range 6.5-7.5 (Table 1); at pH 7.0 it was similar in magnitude to that for cytosolic 5′N, and about 20 times smaller than that of membrane 5′N.
Adenosine-forming enzymes from gracilis muscle
Activities and kinetic properties of membrane and cytosolic 5′N from homogenates of gracilis or soleus muscles at pH 7.5 are compared in Fig. 3 and Table 1. The activities of both of the gracilis muscles enzymes were around half of the values for the corresponding soleus muscle enzymes (Fig. 3), but the Km values did not differ between the two muscles, suggesting that the same enzyme was present in both muscles, but at a lower concentration in the gracilis than in the soleus.
Effect of pH on the kinetics of adenosine-removing enzymes
Pilot studies showed that the membrane fraction contained negligible amounts of AK and AD activity, so these enzymes were assayed in the crude homogenate only. The activity of AD was about an order of magnitude higher than that of AK (Fig. 4), but AK had a much higher affinity than AD for the substrate (adenosine). AK had its highest Vmax at pH 5.5, and activity dropped steadily with increases in pH. However, the affinity of AK for adenosine was lowest at pH 5.5 (highest Km; Table 2), so overall, the Kcat was lowest at pH 5.5 and highest at pH 9. Within the physiological pH range, changes in Kcat were only small. AD had its highest Vmax and its lowest affinity for adenosine (highest Km) at pH 7.5 (Fig. 4, Table 2), and the Kcat was therefore unchanged across the entire pH range (Table 2).
Figure 4. Influence of pH on the activity of adenosine-removing enzymes from rat soleus muscle.
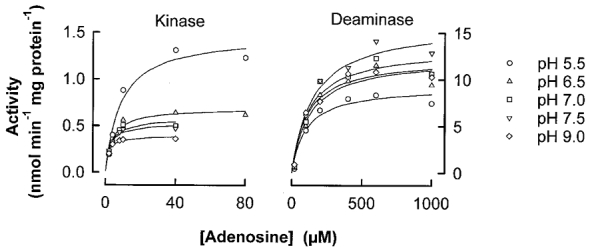
Values are the means of 3 estimations using the pooled tissues from 6 rats.
Table 2. Kinetic properties of adenosine-removing enzymes from rat soleus muscle.
| pH | 5.5 | 6.5 | 7.0 | 7.5 | 9.0 | |
|---|---|---|---|---|---|---|
| Adenosine kinase | Vmax | 1.33 | 0.66 | 0.54 | 0.50 | 0.38 |
| Km | 8.6 | 3.9 | 2.8 | 2.4 | 1.5 | |
| Kcat | 0.15 | 0.17 | 0.19 | 0.21 | 0.25 | |
| Adenosine deaminase | Vmax | 8.4 | 11.0 | 12.1 | 13.9 | 11.1 |
| Km | 100 | 124 | 122 | 150 | 106 | |
| Kcat | 0.08 | 0.09 | 0.10 | 0.09 | 0.10 |
Vmax is expressed in units of nmol min−1 (mg protein)−1, and Km in units of μM. Kcat is calculated as Vmax/Km.
Calculated rates of adenosine formation and removal at different pH values
The actual rates of adenosine formation or removal by each of the enzymes at control pH (7.5 for the extracellular space and 7.0 for the intracellular space) were calculated from the Vmax and Km values obtained in this study, and literature values for the substrate concentration, as described in Methods: the results are shown in Table 3. In order to compare rates of adenosine formation and removal between different enzymes, results are normalised to the wet weight of the whole muscle rather than the homogenised preparations.
Table 3. Calculated rates of adenosine formation and removal by intra-or extracellular enzymes in rat soleus muscle.
| Adenosine formation (nmol min−1 (g wet wt)−1) | ||
|---|---|---|
| Intracellular | Extracellular | |
| 5′Nucleotidase | 0.19 | 0.96 |
| Non-specific phosphatase | — | 0.11 |
| Adenosine kinase | −22.80 | — |
| Adenosine deaminase | −23.12 | — |
| Net adenosine output | 0 | 1.07 |
The calculation of rates is described in the text. Negative values for adenosine formation indicate that adenosine is removed by the enzyme.
For the purposes of these calculations, the free AMP (substrate) concentrations in the intracellular and extracellular spaces of skeletal muscle were calculated by the following methods: we determined the total AMP content of the rat soleus muscle to be 45.9 ± 7.7 μM (n = 8) using HPLC. The free extracellular AMP in heart muscle has been measured to be 0.7 μM under basal conditions (Hall et al. 1995), which comprises 0.24 % of the total AMP content of heart muscle (Tullson & Terjung, 1990). On this basis, the free extracellular AMP in rat red skeletal muscle at pH 7.5 is calculated to be 0.11 μM, which is in good agreement with literature values for similar muscles (Tullson & Terjung, 1990). The free intracellular AMP has not been measured for any type of muscle, but is calculated from the equilibrium constant of the myokinase reaction to be 0.2 % of the total AMP in red skeletal muscle (Tullson & Terjung, 1990). The free intracellular AMP in skeletal muscle would therefore be 0.09 μM under control conditions (pH 7.0). Since adenosine-removing enzymes are only present in the intracellular space, only the intracellular adenosine (substrate) concentration is relevant. The adenosine content of whole red muscle has been determined from biopsy samples to be 2.84 μM (Phair & Sparks, 1979), and this is considered to be mainly intracellular.
The changes in adenosine formation by the extracellular enzymes in response to elevation or depression of the pH by 0.5 units were also estimated: the results are shown in Table 4. The following assumptions were made for the purposes of the calculations: the perfused muscle experiments indicated that extracellular AMP increased by 370 % or 947 %, respectively, during depression or elevation of the pH. On this basis, the free extracellular AMP would increase to 0.41 μM during pH depression and to 1.04 μM during pH elevation. Enzyme kinetics were not directly determined at pH 8.0, so values of Vmax and Km for the pH elevation column were estimated to fall one-third of the way between the data for pH 7.5 and pH 9.0.
Table 4. Estimated changes in rate of adenosine formation by extracellular enzymes of rat soleus muscle due to elevation or depression of pH.
| Rate of adenosine formation (nmol min−1 (mg wet wt)−1) | ||||
|---|---|---|---|---|
| pH | 7.0 | 7.5 | 8.0 | |
| Membrane 5′nucleotidase | 4.27 | 0.96 | 7.12 | |
| Membrane non-specific phosphatase | 0.24 | 0.11 | 1.25 | |
The calculation of rates is described in Methods.
These calculations suggest that, at elevated pH, the increased adenosine output results mainly from the increased availability of AMP to membrane 5′N and PT, and that PT makes a larger contribution to adenosine formation at high pH. At reduced pH, increased adenosine formation results from both an increase in AMP availability, as well as an increase in the affinity of 5′N for AMP, which increases its Kcat.
DISCUSSION
The main purpose of this study was to investigate the possible mechanisms by which pH might control the adenosine output from skeletal muscle. Our group had consistently observed that pH depression could stimulate adenosine output from skeletal muscle, and yet, we could find no explanation for this in the available literature. In the present study, we found that either depression or elevation of the pH from its normal value led to an increase in the adenosine output from the muscle. This is the first report on the effects of pH elevation on adenosine output from muscle. The results of the present investigation suggest that: (i) in skeletal muscle, adenosine is principally formed in the extracellular space by the actions of ecto-5′N on extracellular AMP; (ii) depression of the pH increases the availability of the substrate, AMP, in the extracellular space, as well as increasing the affinity of 5′N for AMP, both of which contribute to an increase in adenosine formation; (iii) elevation of the pH directly depresses the activity of 5′N, increases the activity of PT (although it remains a minor contributor to the adenosine formation), and produces a very large increase in AMP availability, which results in an increase in the overall rate of adenosine production.
In both the enzyme studies and the perfused muscle experiments, we found that either elevation or depression of the pH increased the adenosine output from muscle, although the results of the two types of study differed somewhat in the magnitude of the increase: the enzyme kinetic studies predicted that adenosine formation in the interstitial space should increase around 4-fold during pH depression and around 8-fold during pH elevation (Table 4) whereas the perfusion studies found that the venous adenosine concentration was approximately doubled in either condition (Fig. 2). The difference probably arises from cellular uptake of adenosine during its passage from the interstitial space to the venous sampling site in the perfusion studies: mathematical modelling and indicator dilution studies have predicted that 2/3 of interstitial adenosine enters the endothelial cells and only 1/3 passes intact through the interendothelial clefts (Bassingthwaighte & Sparks, 1986; Wangler et al. 1989). The adenosine reaching the vessel lumen would be subject to further uptake into the endothelial cells lining the blood vessels, so that as little as 1/4 of the interstitial adenosine may reach the venous sampling site (Ballard et al. 1987; Wangler et al. 1989). The effects of pH changes on adenosine transport are largely unknown: in the heart, pH depression has been reported to reduce adenosine uptake (Mustafa, 1980), so we could not rule out different rates of adenosine uptake at the different pH levels. However, the interstitial adenosine concentration would be more relevant than the venous concentration in determining the degree of vasodilatation in vivo.
The muscle extracellular pH can be depressed to around 7.0 by tetanic or high frequency twitch contractions. In a previous study, we found a linear relationship between the increase in venous adenosine and the decrease in venous pH during muscle contractions: contractions that decreased the pH to around 7.0 produced about a 4-fold increase in venous adenosine (Achike & Ballard, 1993). These data are in good agreement with the kinetic predictions of the present study, and support the concept that the enhanced adenosine production during muscle contractions is mediated by pH depression. In systemic hypoxia, the situation is more complex: we have previously reported the adenosine release from muscle during systemic hypoxia to be mediated by intracellular pH depression caused by the uptake of lactate (Mo & Ballard, 1997). However, since the lactate is delivered to the muscle in the arterial blood, we might expect the majority to be taken up by vascular tissues, producing a relatively large depression of pH in that tissue, with smaller changes elsewhere in the muscle. Other authors have reported that adenosine is mainly released from the vascular endothelium of muscle during systemic hypoxia (Skinner & Marshall, 1996). Thus, it can be said that both pH depression and enhanced adenosine production occur in the vascular tissues of muscle in hypoxia, but it is difficult to demonstrate a causative relationship between the two events due to the non-homogeneity of both the pH changes in, and the adenosine release from, the muscle.
The enzyme, 5′N, was first described in 1951 (Reis, 1951). Subsequent investigation has shown that there are basically four forms: one membrane-bound form (ecto-5′N) which is anchored to the external surface of the plasma membrane via a glycosyl phosphatidylinositol (GPI) at its C-terminus, and three soluble forms (Zimmermann, 1992). One of the soluble forms appears to be derived from a precursor of ecto-5′N and may therefore have an extracellular location. The two cytosolic soluble forms have similar characteristics but one is AMP-preferring and the other is IMP-preferring (Truong et al. 1988). Both of the soluble cytosolic forms metabolise only intracellular substrates, whereas the ectoenzyme participates only in extracellular metabolism (Frick & Lowenstein, 1976; Meghji et al. 1988). In this study, all the soluble forms of 5′N were arbitrarily grouped together as cytosolic 5′N, and we may thus have slightly overestimated the rate of cytosolic adenosine formation. However, this would not alter the conclusions of the study, since cytosolic adenosine formation was found not to have contributed to adenosine output. We found that cytosolic 5′N had a high Km (low affinity for the substrate) and a low Vmax. Thus, even under conditions of elevated substrate concentration (such as altered pH), the maximum rate of cytosolic adenosine formation would be less than the rate of adenosine removal by adenosine deaminase and adenosine kinase, which suggests that intracellularly formed adenosine could not survive long enough to be transported out of the cell. This differs from the situation in heart muscle, where cytosolic adenosine formation is reported to account for most of the adenosine output in many species (Newby, 1988; Darvish et al. 1996). It is uncertain whether the difference arises from different forms of cytosolic 5′N in the two tissues, or from differences in the degree of activation of the enzymes under local conditions: the Km values for skeletal muscle and heart cytosolic 5′N are similar, but the heart enzyme has a much higher Vmax (Newby, 1988). No doubt this arises partly from the higher concentration of cytosolic 5′N in heart muscle than in skeletal muscle, but it is also reported that a high concentration of ADP in the heart activates the cytosolic enzyme and inhibits the ectoenzyme (Darvish et al. 1996). However, we have found that ADP is inhibitory to the cytosolic form of 5′N in skeletal muscle (B. Cheng & H. J. Ballard, unpublished observation). In any event, the Kcat values for all the cytosolic enzymes (cytosolic 5′N, AK and AD) were unaffected by pH changes within the physiological range, making it most unlikely that a cytoplasmic enzyme could be responsible for pH-induced changes in adenosine output.
Previously, the contribution of ecto-5′N to adenosine formation during muscle contractions was evaluated using α,β-methylene ADP (AOPCP), an inhibitor of the enzyme: when AOPCP was infused during the last 5 min of a period of contractions, it did not reduce the adenosine output (Fuchs et al. 1986). However, it is likely that ecto-5′N had not been fully inhibited by this protocol, because another group, who infused AOPCP for 20 min prior to starting the stimulation, found that it reduced the post-contraction hyperaemia by 40 % (Kille & Klabunde, 1984). It has been estimated that adenosine contributes around 40 % to exercise vasodilatation (Ballard et al. 1987; Poucher et al. 1990): taken together, these data suggest that inhibition of ecto-5′N completely eliminates the contribution of adenosine to exercise vasodilatation, which further supports the suggestion that adenosine is formed entirely in the extracellular compartment in skeletal muscle.
It is interesting to note that the activities of AK and AD were entirely confined to the cytoplasmic compartment: an important implication of this is that any adenosine formed in the extracellular compartment would be protected from enzymatic removal, and would thus be cleared only by cellular uptake or by washout in the venous blood. In skeletal muscle, it is thought that the vascular endothelium is the major site for cellular uptake of adenosine (Bassingthwaighte & Sparks, 1986); thus, most of the extracellularly formed adenosine would be able to act on vascular smooth muscle receptors and induce changes in blood flow, making it a very effective local hormone.
The enzyme studies in this work were principally performed using tissues from the soleus muscle, which is a red, oxidative muscle, and was found in preliminary studies in our laboratory to release adenosine at low pH. However, it proved impossible to perfuse this muscle in situ, and the perfusion studies were performed in the rat gracilis muscle, which is composed of a mixture of oxidative and glycolytic muscle fibres. Kinetic analysis of the membrane and cytosolic 5′Ns from gracilis muscle revealed them to have similar Km values to the enzymes in soleus muscle, but Vmax values that were around 50 % lower, which is in agreement with a previous report that the activity of 5′N is highest in oxidative skeletal muscle and lowest in glycolytic muscle (Bockman & McKenzie, 1983). Based on the similar Km values, we would tentatively suggest that the same enzymes are present in both types of muscle, but that the concentrations are higher in oxidative muscle, producing a higher overall activity. This is in accordance with the results of a staining study, which has suggested that 5′N is distributed throughout oxidative skeletal muscle, but is confined to cells in the immediate vicinity of the blood vessels in glycolytic muscle (Rubio et al. 1973).
The source of the extracellular AMP that acts as the substrate for ecto-5′N must be a major focus of interest in the future, since it appears that pH-induced changes in the substrate (AMP) concentration are a major contributing mechanism for pH-induced changes in adenosine output. So far, no mechanism for the release of cellular AMP has been identified, and it is assumed that extracellular AMP is formed extracellularly from extracellular ATP or extracellular cAMP. Some types of intact cells (e.g. brain) metabolise exogenous ATP or cAMP to adenosine (Pull & McIlwain, 1972; Gorin & Brenner, 1976), and ectoenzymes that hydrolyse ATP or ADP are associated with cell surfaces in many tissues, including blood cells (Evans, 1974; Gordon, 1986; Grondal & Zimmermann, 1986). Specific ecto-ATPases have been identified, whilst the PT identified in this study would also be capable of degrading ATP to AMP as well as AMP to adenosine.
The source of the extracellular ATP is still debatable. Release of ATP has been demonstrated in a number of cellular systems, including working muscle, working heart, renal cortex, brain, vascular endothelial and smooth muscle cells (Wu & Phillis, 1978; Pearson & Gordon, 1979; Gordon, 1986). Cellular systems known to compartmentalise ATP in secretory vesicles are confined to cholinergic and adrenergic neurons, chromaffin cells and blood platelets (White et al. 1987). From these, ATP and ADP can be released by controlled exocytosis, and for each case, the complete cascade of hydrolysis to adenosine has been demonstrated (Pearson et al. 1980; Grondal & Zimmermann, 1986; Richardson & Brown, 1987; Terrian et al. 1989; Torres et al. 1990). However, these mechanisms could not have contributed to nucleotide release in the in situ perfused muscle preparation that we used. Non-specific mechanisms for nucleotide release from cells have already been reported to include hypoxia and trauma, and based on the present data, may also include perturbation to the pH. An attractive proposal is that, during pH depression, Na+-H+ exchange increases the intracellular sodium, which drives the Na+-K+-ATPase at a higher rate (Phillis et al. 1998): such a mechanism might be able to increase the concentration of ADP or AMP in the extracellular space. If this mechanism was responsible for the appearance of AMP extracellularly, then presumably the amount of AMP formed would be proportional to the extent of the pH depression, which might explain the very good linear correlations that we have previously observed between pH depression and adenosine output from muscle. However, further investigation of the control of the extracellular AMP concentration is still required.
Acknowledgments
This work was supported by the University of Hong Kong Committee on Research and Conference Grants and the Lee Wing Tat Medical Research Fund. B. Cheng and H. C. Essackjee submitted some parts of this work to the University of Hong Kong in partial fulfilment of the requirements for their respective degrees of PhD. They both received postgraduate studentships from the University of Hong Kong.
References
- Achike FI, Ballard HJ. Influence of stimulation parameters on the release of adenosine, lactate and CO2 from contracting dog gracilis muscle. The Journal of Physiology. 1993;463:107–121. doi: 10.1113/jphysiol.1993.sp019586. [DOI] [PMC free article] [PubMed] [Google Scholar]
- Arch JRS, Newsholme EA. Activities and some properties of adenylate cyclase and phosphodiesterase in muscle, liver and nervous tissues from vertebrates and invertebrates in relation to the control of the concentration of adenosine 3′,5′-cyclic monophosphate. Biochemical Journal. 1976;158:603–622. doi: 10.1042/bj1580603. [DOI] [PMC free article] [PubMed] [Google Scholar]
- Arch JRS, Newsholme EA. Activities and some properties of 5′-nucleotidase, adenosine kinase and adenosine deaminase in tissues from vertebrates and invertebrates in relation to the control of the concentration and the physiological role of adenosine. Biochemical Journal. 1978;174:965–977. doi: 10.1042/bj1740965. [DOI] [PMC free article] [PubMed] [Google Scholar]
- Ballard HJ. The influence of lactic acid on adenosine release from skeletal muscle in anaesthetised dogs. The Journal of Physiology. 1991;433:95–108. doi: 10.1113/jphysiol.1991.sp018416. [DOI] [PMC free article] [PubMed] [Google Scholar]
- Ballard HJ, Cotterrell D, Karim F. Appearance of adenosine in venous blood from the contracting gracilis muscle and its role in vasodilatation in the dog. The Journal of Physiology. 1987;387:401–413. doi: 10.1113/jphysiol.1987.sp016580. [DOI] [PMC free article] [PubMed] [Google Scholar]
- Bassingthwaighte JB, Sparks HV. Indicator dilution estimation of capillary endothelial transport. Annual Review of Physiology. 1986;48:321–334. doi: 10.1146/annurev.ph.48.030186.001541. [DOI] [PMC free article] [PubMed] [Google Scholar]
- Bockman EL, McKenzie JE. Tissue adenosine content in active soleus and gracilis muscles of cats. American Journal of Physiology. 1983;244:H552–559. doi: 10.1152/ajpheart.1983.244.4.H552. [DOI] [PubMed] [Google Scholar]
- Camici M, Fini C, Ipata PL. Isolation and kinetic properties of 5′-nucleotidase from guinea-pig skeletal muscle. Biochimica et Biophysica Acta. 1985;840:6–12. doi: 10.1016/0304-4165(85)90155-2. [DOI] [PubMed] [Google Scholar]
- Darvish A, Pomerantz RW, Zografides PG, Metting PJ. Contribution of cytosolic and membrane-bound 5′-nucleotidase to cardiac adenosine production. American Journal of Physiology. 1996;271:H2162–2167. doi: 10.1152/ajpheart.1996.271.5.H2162. [DOI] [PubMed] [Google Scholar]
- Evans WH. Nucleotide pyrophosphatase, a sialoglycoprotein located on the hepatocyte surface. Nature. 1974;250:391–394. doi: 10.1038/250391a0. [DOI] [PubMed] [Google Scholar]
- Fernley HN. Mammalian alkaline phosphatases. In: Boyer PD, editor. The Enzymes. Vol. 4. New York, USA: Academic Press; 1971. pp. 417–447. [Google Scholar]
- Frick GP, Lowenstein JM. Studies of 5′-nucleotidase in the perfused rat heart. Including measurements of the enzyme in perfused skeletal muscle and liver. Journal of Biological Chemistry. 1976;251:6372–6378. [PubMed] [Google Scholar]
- Fuchs BD, Gorman MW, Sparks HV. Adenosine release into venous plasma during free flow exercise. Proceedings of the Society for Experimental Biology and Medicine. 1986;181:364–370. doi: 10.3181/00379727-181-42266. [DOI] [PubMed] [Google Scholar]
- Gordon JL. Extracellular ATP: effects, sources and fate. Biochemical Journal. 1986;233:309–319. doi: 10.1042/bj2330309. [DOI] [PMC free article] [PubMed] [Google Scholar]
- Gorin E, Brenner T. Extracellular metabolism of cyclic AMP. Biochimica et Biophysica Acta. 1976;451:20–28. doi: 10.1016/0304-4165(76)90253-1. [DOI] [PubMed] [Google Scholar]
- Grondal EJ, Zimmermann H. Ectonucleotidase activities associated with cholinergic synaptosomes isolated from Torpedo electric organ. Journal of Neurochemistry. 1986;47:871–881. doi: 10.1111/j.1471-4159.1986.tb00692.x. [DOI] [PubMed] [Google Scholar]
- Hall JL, van Wylen DGL, Pizurro R D, Hamilton CD, Reiling CM, Stanley WC. Myocardial interstitial purine metabolites and lactate with increased work in swine. Cardiovascular Research. 1995;30:351–356. [PubMed] [Google Scholar]
- Hollander VP. Acid phosphatases. In: Boyer PD, editor. The Enzymes. Vol. 4. New York, USA: Academic Press; 1971. pp. 449–498. [Google Scholar]
- Imai S, Riley AL, Berne RM. Effect of ischaemia on adenine nucleotides in cardiac and skeletal muscle. Circulation Research. 1964;15:443–450. doi: 10.1161/01.res.15.5.443. [DOI] [PubMed] [Google Scholar]
- Kille JM, Klabunde RE. Adenosine as a mediator of postcontraction hyperemia in dog skeletal muscle. American Journal of Physiology. 1984;246:H274–282. doi: 10.1152/ajpheart.1984.246.2.H274. [DOI] [PubMed] [Google Scholar]
- Lowry OH, Rosebrough NJ, Farr A, Randall RJ. Protein measurement with the Folin phenol reagent. Journal of Biological Chemistry. 1951;193:265–275. [PubMed] [Google Scholar]
- Meghji P, Middleton KM, Newby AC. Absolute rates of adenosine formation during ischaemia in rat and pigeon hearts. Biochemical Journal. 1988;249:695–703. doi: 10.1042/bj2490695. [DOI] [PMC free article] [PubMed] [Google Scholar]
- Mo FM, Ballard HJ. Adenosine output from dog gracilis muscle during systemic hypercapnia and/or amiloride-SITS infusion. American Journal of Physiology. 1994;267:H1243–1249. doi: 10.1152/ajpheart.1994.267.4.H1243. [DOI] [PubMed] [Google Scholar]
- Mo FM, Ballard HJ. Intracellular lactate controls adenosine output from dog gracilis muscle during moderate systemic hypoxia. American Journal of Physiology. 1997;272:H318–324. doi: 10.1152/ajpheart.1997.272.1.H318. [DOI] [PubMed] [Google Scholar]
- Mustafa SJ. Cellular and molecular mechanism(s) of coronary flow regulation by adenosine. Molecular and Cellular Biochemistry. 1980;31:67–87. doi: 10.1007/BF00240813. [DOI] [PubMed] [Google Scholar]
- Naito Y, Lowenstein JM. 5′-Nucleotidase from rat heart. Biochemistry. 1981;20:5188–5194. doi: 10.1021/bi00521a014. [DOI] [PubMed] [Google Scholar]
- Newby AC. The pigeon heart 5′-nucleotidase responsible for ischaemia-induced adenosine formation. Biochemical Journal. 1988;253:123–130. doi: 10.1042/bj2530123. [DOI] [PMC free article] [PubMed] [Google Scholar]
- Newby AC, Worku Y, Meghji P. Critical evaluation of the role of ecto- and cytosolic 5′-nucleotidase in adenosine formation. In: Gerlach E, Becker B, editors. Topics and Perspectives in Adenosine Research. Berlin, Germany: Springer-Verlag; 1987. pp. 155–169. [Google Scholar]
- Pearson JD, Carlton JS, Gordon JL. Metabolism of adenine nucleotides by ectoenzymes of vascular endothelial and smooth muscle cells in culture. Biochemical Journal. 1980;190:421–429. doi: 10.1042/bj1900421. [DOI] [PMC free article] [PubMed] [Google Scholar]
- Pearson JD, Gordon JL. Vascular endothelial and smooth muscle cells in culture selectively release adenine nucleotides. Nature. 1979;281:384–386. doi: 10.1038/281384a0. [DOI] [PubMed] [Google Scholar]
- Phair RD, Sparks HV. Adenosine content of skeletal muscle during active hyperemia and ischemic contraction. American Journal of Physiology. 1979;237:H1–9. doi: 10.1152/ajpheart.1979.237.1.H1. [DOI] [PubMed] [Google Scholar]
- Phillis JW, Song D, O'Regan MH. The role of adenosine in rat coronary flow regulation during respiratory and metabolic acidosis. European Journal of Pharmacology. 1998;356:199–206. doi: 10.1016/s0014-2999(98)00512-3. [DOI] [PubMed] [Google Scholar]
- Poucher SM, Nowell CG, Collis MG. The role of adenosine in exercise hyperaemia of the gracilis muscle in anaesthetized cats. The Journal of Physiology. 1990;427:19–29. doi: 10.1113/jphysiol.1990.sp018158. [DOI] [PMC free article] [PubMed] [Google Scholar]
- Pull I, McIlwain H. Metabolism of [14C]adenine and derivatives by cerebral tissues, superfused and electrically stimulated. Biochemical Journal. 1972;126:965–973. doi: 10.1042/bj1260965. [DOI] [PMC free article] [PubMed] [Google Scholar]
- Reis J. The specificity of phosphomonoesterases in human tissues. Biochemical Journal. 1951;48:548. doi: 10.1042/bj0480548. [DOI] [PMC free article] [PubMed] [Google Scholar]
- Richardson PJ, Brown SJ. ATP release from affinity-purified rat cholinergic nerve terminals. Journal of Neurochemistry. 1987;48:622–630. doi: 10.1111/j.1471-4159.1987.tb04138.x. [DOI] [PubMed] [Google Scholar]
- Rubio R, Berne RM, Dobson JG. Sites of adenosine production in cardiac and skeletal muscle. American Journal of Physiology. 1973;225:938–953. doi: 10.1152/ajplegacy.1973.225.4.938. [DOI] [PubMed] [Google Scholar]
- Skinner MR, Marshall JM. Studies on the roles of ATP, adenosine and nitric oxide in mediating muscle vasodilatation induced in the rat by acute systemic hypoxia. The Journal of Physiology. 1996;495:553–560. doi: 10.1113/jphysiol.1996.sp021615. [DOI] [PMC free article] [PubMed] [Google Scholar]
- Skladanowski AC, Newby AC. Partial purification and properties of an AMP-specific soluble 5′-nucleotidase from pigeon heart. Biochemical Journal. 1990;268:117–122. doi: 10.1042/bj2680117. [DOI] [PMC free article] [PubMed] [Google Scholar]
- Terrian DM, Hernandez PG, Rea MA, Peters RI. ATP release, adenosine formation, and modulation of dynorphin and glutamic acid release by adenosine analogues in rat hippocampal mossy fiber synaptosomes. Journal of Neurochemistry. 1989;53:1390–1399. doi: 10.1111/j.1471-4159.1989.tb08529.x. [DOI] [PubMed] [Google Scholar]
- Torres M, Pintor J, Miras-Portugal MT. Presence of ectonucleotidases in cultured chromaffin cells: hydrolysis of extracellular adenine nucleotides. Archives of Biochemistry and Biophysics. 1990;279:37–44. doi: 10.1016/0003-9861(90)90460-g. [DOI] [PubMed] [Google Scholar]
- Truong VL, Collinson AR, Lowenstein JM. 5′-Nucleotidases in rat heart. Evidence for the occurrence of two soluble enzymes with different substrate specificities. Biochemical Journal. 1988;253:117–121. doi: 10.1042/bj2530117. [DOI] [PMC free article] [PubMed] [Google Scholar]
- Tullson PC, Terjung RL. Adenine nucleotide in striated muscle. International Journal of Sports Medicine. 1990;11(suppl. 2):S47–S55. doi: 10.1055/s-2007-1024854. [DOI] [PubMed] [Google Scholar]
- Wangler RD, Gorman MW, Wang CY, DeWitt DF, Chan IS, Bassingthwaighte JB, Sparks HV. Transcapillary adenosine transport and interstitial adenosine concentration in guinea pig hearts. American Journal of Physiology. 1989;257:H89–106. doi: 10.1152/ajpheart.1989.257.1.H89. [DOI] [PMC free article] [PubMed] [Google Scholar]
- White TD, Bourke JE, Livett BG. Direct and continuous detection of ATP secretion from primary monolayer cultures of bovine adrenal chromaffin cells. Journal of Neurochemistry. 1987;49:1266–1273. doi: 10.1111/j.1471-4159.1987.tb10019.x. [DOI] [PubMed] [Google Scholar]
- Wu PH, Phillis JW. Distribution and release of adenosine triphosphate in rat brain. Neurochemistry Research. 1978;3:563–571. doi: 10.1007/BF00963759. [DOI] [PubMed] [Google Scholar]
- Zimmermann H. 5′-Nucleotidase: molecular structure and functional aspects. Biochemical Journal. 1992;285:345–365. doi: 10.1042/bj2850345. [DOI] [PMC free article] [PubMed] [Google Scholar]