Abstract
The adult fast character and a Ca2+-inducible reversible transition from a fast to a slow type of rabbit myotube in a primary culture were demonstrated at the mRNA level by Northern blot analysis with probes specific for different myosin heavy chain (MyHC) isoforms and enzymes of energy metabolism.
No non-adult MyHC isoform mRNA was detected after 22 days of culture. After 4 weeks of culture the fast MyHCIId mRNA was strongly expressed while MyHCI mRNA was virtually absent, indicating the fast adult character of the myotubes in the primary skeletal muscle culture.
The data show that a fast-to-slow transition occurred in the myotubes at the level of MyHC isoform gene expression after treatment with the Ca2+ ionophore A23187. The effects of ionophore treatment were decreased levels of fast MyHCII mRNA and an augmented expression of the slow MyHCI gene. Changes in gene expression started very rapidly 1 day after the onset of ionophore treatment.
Levels of citrate synthase mRNA increased and levels of glyceraldehyde 3-phosphate dehydrogenase mRNA decreased during ionophore treatment. This points to a shift from anaerobic to oxidative energy metabolism in the primary skeletal muscle culture cells at the level of gene expression.
Withdrawal of the Ca2+ ionophore led to a return to increased levels of MyHCII mRNA and decreased levels of MyHCI mRNA, indicating a slow-to-fast transition in the myotubes and the reversibility of the effect of ionophore on MyHC isoform gene expression.
One of the most striking features of the differentiated adult skeletal muscle is its high degree of plasticity. In an adaptive response to altered physiological demands, a switch from the fast-glycolytic to the slow-oxidative phenotype, and vice versa, occurs. A fast-to-slow transition induces morphological and biochemical alterations resulting in an increased resistance to fatigue. The expression of isoforms of proteins of the contractile apparatus and enzymes of energy metabolism is influenced by the pattern of innervation (Buller et al. 1960), by electrical stimulation (Pette & Vbrová, 1985; Pette, 1998), by the level of physical activity (Salmons & Henriksson, 1981; Pette, 1998), and by passive stretch (Goldspink et al. 1992; Russell & Dix, 1992). Changes at the level of mRNA and protein expression during low frequency stimulation-induced fast-to-slow transition of skeletal muscle are well documented (Pette & Vrbová, 1992; Pette, 1998). Genes encoding slow isoforms of myosin heavy (MyHC) and light chains (MLC), as well as genes encoding proteins involved in oxidative metabolism, are upregulated, fast myosin isoform genes and those encoding glycolytic enzymes are downregulated.
The time course of low frequency stimulation-induced changes was studied in detail, pointing to a sequential transition of MyHC isoforms (Pette & Vrbová, 1992; Peuker et al. 1998). Changes in MyHC mRNA levels occur early after the start of electrostimulation of rabbit and rat fast-twitch muscle (Brownson et al. 1988; Kirschbaum et al. 1990). The reversibility of low frequency stimulation-induced changes has been demonstrated (Brownson et al. 1992a,b; Pette & Vrbová, 1992). The reversal of the changes in proteins after cessation of stimulation is relatively slow, but the reappearance of fast MyHC mRNA is detected after a few days. In contrast to this thorough description of events, little is known about the primary signals that mediate the transformations. Alterations in intracellular Ca2+ concentration, phosphorylation and energy potential have been proposed as possible primary trigger events (Shoubridge et al. 1985; Sreter et al. 1987; Henriksson et al. 1988; Pette, 1998). Growing evidence points to the importance of changes in intracellular Ca2+ concentration ([Ca2+]i) for phenotypic adaptations in skeletal muscle (Kubis et al. 1997; Chin et al. 1998; Freyssenet et al. 1999).
The expression of developmental MyHC isoforms is a well known feature of muscle in vivo during ontogenesis (Buckingham, 1985). In myogenic cell lines, a mixture of non-adult and adult MyHC isoforms was found (Weydert et al. 1987). Recently, a primary skeletal muscle cell culture derived from newborn rabbit hindlimb muscle has been established (Kubis et al. 1997). Growing on gelatin bead microcarriers in suspension, the myotubes developed the adult expression pattern of fast MyHC after having been cultured for several weeks. When Ca2+ ionophore A23187 was added to the medium, [Ca2+]i increased about 10-fold and a fast-to-slow transformation occurred.
To characterize the adult fast type of myotube in the rabbit primary culture at the level of gene expression and to establish changes in gene expression during a Ca2+-induced fast-to-slow transition in this culture, we performed Northern blot analysis with probes specific for perinatal, slow and fast isoforms of MyHC (MyHCneo, MyHCI, MyHCII, respectively) and with probes for citrate synthase (CS) and glyceraldehyde 3-phosphate dehydrogenase (GAPDH). CS and GAPDH are enzymes of the aerobic oxidative and the anaerobic glycolytic pathways of energy supply, respectively. For detection of MyHC isoforms, probes derived from 3′ terminal regions of MyHC genes were used. The hypervariable 3′ untranslated regions of MyHC genes exhibit much greater divergence than the coding regions and are therefore specific for each isoform (Saez & Leinwand, 1986; Schiaffino & Salviati, 1998). The 3′ untranslated region of a given MyHC isoform from one species is very similar to this region in other mammalian species, but very different from the 3′ untranslated region of another MyHC isoform from the same species. Thus mammalian MyHC isoforms from different species, with comparable developmental expression, are more similar to each other than they are to other isoforms in the same genome (Moore et al. 1993).
The data presented in this study clearly demonstrate the adult fast character of the myotubes in culture at the level of gene expression. A fast-to-slow transition occurs in terms of MyHC isoform gene expression after treatment with a Ca2+ ionophore. The observed upregulation of CS mRNA and downregulation of GAPDH mRNA point to changes in energy metabolism that are also characteristic of a fast-to-slow transition. Furthermore, the effect of the ionophore on MyHC gene expression proved to be reversible.
METHODS
Materials and chemicals
Cell culture materials were obtained from Nunc (Roskilde, Denmark). Cell culture media, antibiotics and restriction enzymes were obtained from Gibco Life Technologies. Chemicals were obtained from Merck and from Sigma. [32P]dCTP was from Hartmann Analytics (Braunschweig, Germany) or New England Nuclear (Boston, MA, USA).
Culture and harvesting of skeletal muscle cells
Newborn New Zealand White rabbits were killed by decapitation. Hindlimb muscles were removed, cut into small pieces and incubated in BSS (composition: 4.56 mm KCl, 0.44 mm KH2PO4, 0.42 mm Na2HPO4, 25 mm NaHCO3, 119.8 mm NaCl, 50 mg l−1 penicillin, and 100 mg l−1 streptomycin, pH 7.0) with 0.125 % trypsin at 37°C for 1 h. The suspension was centrifuged at 800g for 5 min, the pellet resuspended in Dulbecco's modified Eagle's medium (DMEM) supplemented with 10 % neonatal calf serum (NCS), and the entire procedure repeated once. The final pellet was suspended in DMEM-10 % NCS and then filtered through a sieve with 0.4 mm pores. The filtrate was transferred into culture bottles where the fibroblasts were allowed to settle and attach themselves to the bottom for 30 min. The supernatant suspension was decanted and diluted to a final density of 8 × 10⁵ cells ml−1 in DMEM-10 % NCS. A total of 15 ml of this suspension was poured into a 260 ml culture flask and 0.04 g cross-linked gelatin beads with a diameter of 100–300 μm (CultiSpher-GL; Percell Biolytica, Astorp, Sweden) were added per flask. The flasks were kept at 37°C in air with 8 % CO2 and 95 % humidity while being shaken gently to ensure adequate O2 supply to the cells and to prevent cells and beads from settling down. Twenty-four hours later the cell suspension was diluted to a cell concentration of 4 × 10⁵ cells ml−1. Myoblasts attached themselves to the gelatin beads and began to fuse after 3 days in culture. After 2 weeks, fusion appeared to be complete and only myotubes were detectable microscopically. To collect the myotubes for protein analysis or for isolation of total RNA after 1–5 weeks of culture, cell-covered beads were allowed to sediment, washed twice in BSS (pH 7.0) with 0.02 % EDTA, and resuspended in prewarmed (37°C) BBS (pH 7.9) containing 0.35 % trypsin, 1.8 mm CaCl2 and 0.8 mm MgSO4. After incubation for 30 min at 37°C on a rotary shaker in an incubator, the isolated cells were spun down at 800g for 5 min, washed twice in BSS (pH 7.0) with 0.02 % EDTA, and then suspended in BSS (pH 7.0). For the isolation of total RNA, the last two washing steps were omitted.
Animal experiments were carried out according to the guidelines of the local Animal Care Committee (Bezirksregierung Hannover).
Northern blot analysis
Total cellular RNA was isolated from cells according to the method of Chirgwin et al. (1979) including ultracentrifugation of the guanidinium thiocyanate homogenate through a dense cushion of caesium chloride. Alternatively, total RNA was isolated in a single-step procedure by acid guanidinium thiocyanate-phenol-chloroform extraction according to Chomczynski & Sacchi (1987), using the Ultraspec RNA isolation system (Biotecx Laboratories, Inc., Houston, TX, USA). The RNA was size fractionated on 1.2 % agarose-formaldehyde gels and transferred to a nitrocellulose filter. After restriction enzyme cleavage of cDNA clones (see below), cDNA probes were purified from agarose gels using the Geneclean Kit (BIO 101, Inc., Vista, CA, USA). The cDNA probes were labelled with [32P]dCTP using random hexamers as primers (Feinberg & Vogelstein, 1983) with the Prime-a-Gene labelling system (Promega Corporation, Madison, WI, USA). Filters were prehybridized at 42°C overnight in a solution containing 50 % formamide, 4 × saline-sodium phosphate-EDTA buffer (SSPE) (1 × SSPE = 0.3 M NaCl, 0.02 M NaH2PO4, 0.002 M EDTA, pH 7.4), 0.1 % Ficoll, 0.1 % polyvinylpyrrolidone, 0.1 % bovine serum albumin, 0.1 % SDS, and 100 μl salmon testes DNA. Hybridization was performed for 18 h at 42°C in the same solution containing 1 × 10⁶ to 5 × 10⁶ c.p.m. ml−1 of labelled DNA probes. To minimize cross-reactivity, blots were washed under high stringency conditions (65°C, 0.2 × saline-sodium citrate buffer (SSC), 0.5 % SDS; 1 × SSC = 0.15 M NaCl, 0.015 M sodium citrate, pH 7) twice for 30 min. Autoradiography was performed with intensifying screens at −80°C with exposure times from 1 to 5 days.
cDNA probes
To establish muscle type-specific gene expression, we performed Northern blot analysis with probes specific for MyHC isoforms. All probes used are fragments from cDNA clones containing only small parts of the 3′ translated and the full sections of the hypervariable 3′ untranslated regions which exhibit much greater divergence than the coding regions (Saez & Leinwand, 1986). For detecting mRNA of neonatal MyHC, the 3′ terminal 250 bp PstI fragment of mouse perinatal MyHC cDNA (Weydert et al. 1985) was used. The probe for detecting slow MyHCI mRNA was the 3′ terminal 450 bp HinfI fragment from rabbit MyHCI cDNA (Brownson et al. 1992a). The probes for detecting fast MyHCII mRNAs were the 3′ terminal PstI fragments from rabbit cDNAs (Maeda et al. 1987), specific for fast MyHC isoforms IIb and IId (Uber & Pette, 1993).
For investigating changes in enzymes of energy metabolism, gene expression of CS was probed with the 800 bp ClaI-EcoRV fragment of the rabbit cDNA (Annex et al. 1991) and that of GAPDH with a 1.3 kb PstI fragment encompassing the complete rat cDNA (Fort et al. 1985). 18S rRNA was detected with the 5.8 kb HindIII fragment of 18S rDNA (Katz et al. 1983).
MyHC electrophoresis
Collected myotubes were homogenized by sonication (6 × 5 s with 60 W at 0°C) and centrifuged at 100000g for 1 h. Pellets were extracted with 0.6 M KCl, 1 mm EGTA, 0.5 mm DTT, and 10 mm potassium phosphate, pH 6.8. Extracts were centrifuged at 20000g for 20 min and supernatants were diluted 1:10 with ice-cold water to precipitate the actomyosin. After precipitation at 0°C for 12 h, the suspension was centrifuged at 20000g for 30 min and the actomyosin pellets were solubilized with the extraction buffer. SDS electrophoresis was performed by the method of Kubis & Gros (1997).
RESULTS
Adult fast character of the primary skeletal muscle culture cells
To investigate the level of MyHC gene expression in cells from a recently established primary skeletal muscle culture from rabbit hindlimb (Kubis et al. 1997) we performed Northern blot analysis with probes specific for different MyHC isoforms. For detecting mRNAs of neonatal, adult fast and adult slow MyHC isoforms, we used specific probes as described above. To minimize cross-reactivity, high stringency conditions were used in RNA analysis. The specificity of the probe from MyHCI cDNA for slow muscle fibres and the specificity of probes from MyHCIIb and IId cDNA, respectively, for fast muscle fibres was verified by hybridization with total RNA derived from slow soleus and fast extensor digitorum longus muscle of adult rabbits (data not shown).
The myotubes were cultured for up to 30 days and total mRNA was isolated at different times. On day 11 of culture, significant amounts of mRNA from the neonatal MyHC isoform were detected (Fig. 1, lane 1), but no signal was found on day 22 (Fig. 1, lane 2). On day 8 of the primary muscle cell culture, mRNA from fast MyHCII was detected with the probe from MyHCIId cDNA (Fig. 2, lane 1). The level of mRNA expression of fast MyHCII was increased by day 16 (Fig. 2, lane 2) and strong expression was still observed on days 23 and 29 of culture (Fig. 2, lanes 3 and 5, respectively). Hybridization on day 29 with the fast MyHCII probe derived from MyHCIIb cDNA showed a significantly weaker signal (Fig. 2, lane 7). The mRNA for slow MyHCI was also detected at low levels on days 8 and 16 of culture (Fig. 3, lanes 1 and 2, respectively), and was still low on days 23 and 24 (Fig. 3, lanes 3 and 5, respectively), and very low on day 29 (Fig. 3, lane 7). The strong expression of MyHCIId mRNA together with the very weak expression of MyHCI mRNA indicates the almost exclusive presence of adult muscle cells of the fast type in the primary culture, with no non-adult MyHC mRNA being present from day 22 onwards.
Figure 1. Northern blot analysis of MyHCneo mRNA.
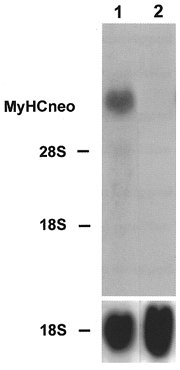
The rabbit primary skeletal muscle culture cells were grown for 11 (lane 1) and 22 days (lane 2). Total RNA (20 μg) was isolated at the time points indicated, fractionated on a 1.2 % agarose-formaldehyde gel, and transferred to nitrocellulose. The blots were hybridized with the 32P-labelled 3′ terminal PstI fragment of perinatal MyHC cDNA (1 × 10⁶ c.p.m. ml−1) or an rDNA probe from 18S rRNA (1 × 10⁶ c.p.m. ml−1). The positions of 18S rRNA (1.9 kb) and 28S rRNA (4.8 kb) on the ethidium bromide-stained gel are indicated.
Figure 2. Effect of late addition of Ca2+ ionophore on the expression of fast MyHCII mRNA.
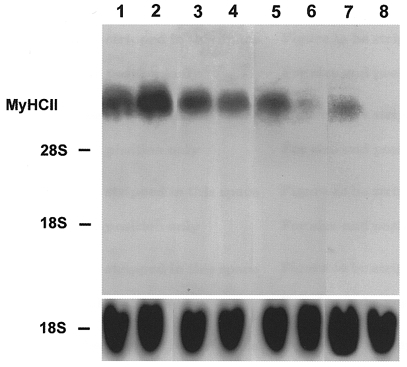
Cell cultures were grown for 8 (lane 1), 16 (lane 2), 23 (lane 3) and 29 days (lanes 5 and 7) in the absence or presence of Ca2+ ionophore A23187 (4 × 10⁻⁷ M) from day 22 of the culture for a further 1 day (lane 4) or 7 days (lanes 6 and 8). Total RNA (20 μg) was isolated from control and ionophore treated cultures on the days indicated, fractionated on a 1.2 % agarose-formaldehyde gel, and transferred to nitrocellulose. Lanes 1–6 were probed with the 32P-labelled 3′ terminal PstI fragment of MyHCIId cDNA (1 × 10⁶ c.p.m. ml−1) or an 18S rDNA probe (1 × 10⁶ c.p.m. ml−1). Lanes 7 and 8 were probed with the 3′ terminal 32P-labelled PstI fragment of MyHCIIb cDNA (1 × 10⁶ c.p.m. ml−1) or an rDNA probe from 18S rRNA (1 × 10⁶ c.p.m. ml−1). The positions of 18S rRNA (1.9 kb) and 28S rRNA (4.8 kb) on the ethidium bromide-stained gel are indicated.
Figure 3. Effect of late addition of Ca2+ ionophore on the expression of slow MyHCI mRNA.
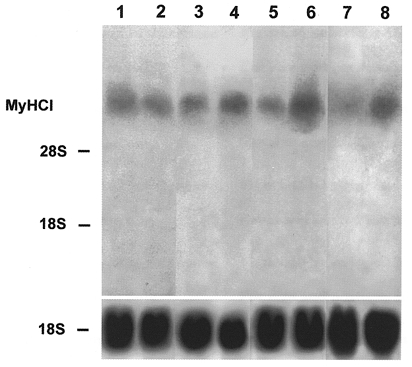
Cultures were grown for 8 (lane 1), 16 (lane 2), 23 (lane 3), 24 (lane 5) and 29 days (lane 7) in the absence of ionophore. The other lanes represent cultures grown for 22 days without ionophore and thereafter in the presence of Ca2+ ionophore A23187 (4 × 10⁻⁷ M) for 1 day (lane 4), 2 days (lane 6) or 7 days (lane 8). Total RNA (20 μg) was isolated from control and ionophore treated cultures at the time points indicated, fractionated on a 1.2 % agarose-formaldehyde gel, and transferred to nitrocellulose. The blots were hybridized with the 3′ terminal 32P-labelled HinfI fragment of MyHCI cDNA (1 × 10⁶ c.p.m. ml−1) or an rDNA probe from 18S rRNA (1 × 10⁶ c.p.m. ml−1). The positions of 18S rRNA (1.9 kb) and 28S rRNA (4.8 kb) on the ethidium bromide-stained gel are indicated.
Early addition of Ca2+ ionophore
To study the effects of a long-term rise in [Ca2+]i on expression of MyHC genes, the Ca2+ ionophore A23187 (4 × 10⁻⁷ M) was added from day 11 of the culture onwards, increasing [Ca2+]i about 10-fold (Kubis et al. 1997). On day 11, the myotubes in the culture had not yet reached a completely adult state in terms of MyHC isoform expression (see Fig. 1, lane 1). Figure 4 shows, that after 13 days of ionophore treatment on day 24 significant changes of MyHC gene expression occurred. The level of MyHCII mRNA decreased (Fig. 4, lane 4, compare with lane 3) and the level of MyHCI mRNA increased strongly (Fig. 4, lane 2, compare with lane 1), indicating a fast-to-slow transition in the cultured myotubes at the level of MyHC gene expression.
Figure 4. Effect of early addition of Ca2+ ionophore on the expression of slow MyHCI mRNA and fast MyHCII mRNA.
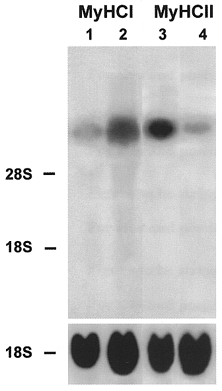
Cultures were grown for 24 days without ionophore (lanes 1 and 3) or from day 11 for a further 13 days with Ca2+ ionophore A23187 (4 × 10⁻⁷ M) (lanes 2 and 4). Total RNA (20 μg) was isolated from control and ionophore treated cultures at the time points indicated, fractionated on a 1.2 % agarose-formaldehyde gel, and transferred to nitrocellulose. Lanes 1 and 2 were probed with the 32P-labelled 3′ terminal HinfI fragment of MyHCI cDNA (1 × 10⁶ c.p.m. ml−1) or an 18S rDNA probe (1 × 10⁶ c.p.m. ml−1). Lanes 3 and 4 were probed with the 32P-labelled 3′ terminal PstI fragment of MyHCIId cDNA (1 × 10⁶ c.p.m. ml−1) or an rDNA probe from 18S rRNA (1 × 10⁶ c.p.m. ml−1). The positions of 18S rRNA (1.9 kb) and 28S rRNA (4.8 kb) on the ethidium bromide-stained gel are indicated.
Late addition of Ca2+ ionophore
To study the ability of fully adult fast type muscle cells in the primary culture to become transformed into slow type by raising [Ca2+]i, Ca2+ ionophore A23187 was added at a later stage of culture to the growth medium at 4 × 10⁻⁷ M. After ionophore treatment from day 22 of culture onwards, the fast MyHCII mRNA level decreased after only 1 day (Fig. 2, lane 4) compared with controls on day 23 (Fig. 2, lane 3) and was barely detected after 7 days of ionophore treatment on day 29 (Fig. 2, lane 6, compare with lane 5), as shown with the probe from MyHCIId cDNA. Furthermore, no signal was detected with the probe from MyHCIIb cDNA after 7 days of ionophore treatment (Fig. 2, lane 8, compare with lane 7). Analogously the level of slow MyHCI mRNA increased only 1 day after addition of ionophore (Fig. 3, lane 4, compare with lane 3), and increased strongly only 2 days after the start of ionophore treatment (Fig. 3, lane 6, compare with lane 5). After 7 days of ionophore treatment, MyHCI mRNA was also strongly expressed compared with the controls (Fig. 3, lane 8, compare with lane 7). These results clearly demonstrate a switch from fast to slow MyHC isoforms at the mRNA level in cells of the primary skeletal muscle cultures that have reached the adult state after treatment with Ca2+ ionophore.
Figure 5 shows how these observations at the MyHC mRNA level correlate with MyHC protein levels. The electrophoretic pattern from SDS-PAGE of MyHC isoforms after 2 and 7 days of Ca2+ ionophore treatment from day 22 onwards showed a mixture of MyHCI, IIa, and IId protein (Fig. 5, lanes 3 and 4, respectively). The amount of fast MyHCIId in ionophore treated cultures had decreased compared with the pattern of MyHC isoforms from day 24 and from day 29 of control cultures (Fig. 5, lanes 1 and 2, respectively). MyHCIId was the main MyHC isoform on days 24 and 29 in untreated cultures. Minor amounts of slow MyHCI were still present on day 24, but had nearly disappeared on day 29. In contrast, no decrease in MyHCI was observed and its band was much stronger on day 29 with ionophore (Fig. 5, lane 4, compare with lane 2). In addition, significant amounts of MyHCIIa were present, when ionophore was added to the medium. The appearance of MyHCIIa in the ionophore treated cultures is in agreement with the fast-to-slow transition sequence MyHCIId > IIa > I in rabbit muscles (Peuker et al. 1998).
Figure 5. Electrophoresis of MyHC isoforms.
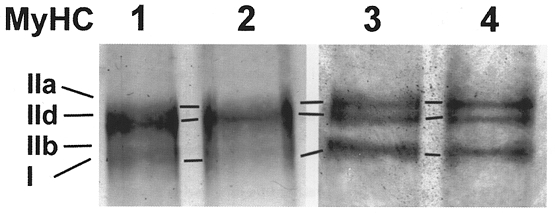
Electrophoresis of myosin extracts from myotubes growing on microcarriers. MyHC of the control on day 24 (lane 1) and day 29 (lane 2) and isoform pattern of the Ca2+ ionophore A23187 (4 × 10⁻⁷ M) treated cells after 2 (lane 3) and 7 days (lane 4) of incubation.
Reversibility of Ca2+ ionophore effect
The reversibility of low frequency stimulation-induced fast-to-slow transition has been demonstrated in vivo at the level of gene expression (Brownson et al. 1992a,b; Pette & Vrbová, 1992). To study the reversibility of the Ca2+ ionophore effect on MyHC isoform gene expression in the present culture, cells were treated with ionophore starting on day 8. On day 22 of culture, after 14 days of ionophore treatment, MyHCI mRNA was strongly expressed and the level of MyHCII mRNA was low (Fig 6 and Fig 7, respectively, lanes 2). In controls on day 22, the reverse was true (Fig 6 and Fig 7, respectively, lanes 1). When, subsequently, the ionophore treated cells were kept after day 22 for 8 days without ionophore, the level of mRNA expression of fast MyHCII increased and the mRNA for slow MyHCI was no longer detectable (Fig 7 and Fig 6, respectively, lanes 4). Similarly, the controls on day 30 showed no MyHCI but only MyHCII mRNA expression (Fig 6 and Fig 7, respectively, lanes 3). These results clearly demonstrate the reversibility of the ionophore effect on the expression of MyHC isoform mRNAs in the myotubes of the primary culture.
Figure 6. Reversibility of the effect of Ca2+ ionophore on the expression of slow MyHCI mRNA.
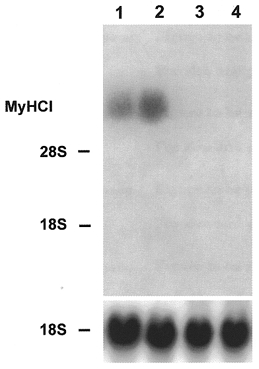
Cells were cultured for 22 (lane 1) or 30 days (lane 3) without ionophore or from day 8 for a further 14 days with Ca2+ ionophore A23187 (4 × 10⁻⁷ M) (lane 2). Other cells were cultured from day 8 to 22 with ionophore and then after withdrawal of ionophore for a further 8 days (lane 4). Total RNA (20 μg) was isolated from control and ionophore treated cultures on the days indicated, fractionated on a 1.2 % agarose-formaldehyde gel, and transferred to nitrocellulose. The blots were hybridized with the 3′ terminal 32P-labelled HinfI fragment of MyHCI cDNA (1 × 10⁶ c.p.m. ml−1) or an rDNA probe from 18S rRNA (1 × 10⁶ c.p.m. ml−1). The positions of 18S rRNA (1.9 kb) and 28S rRNA (4.8 kb) on the ethidium bromide-stained gel are indicated.
Figure 7. Reversibility of the effect of Ca2+ ionophore on the expression of fast MyHCII mRNA.
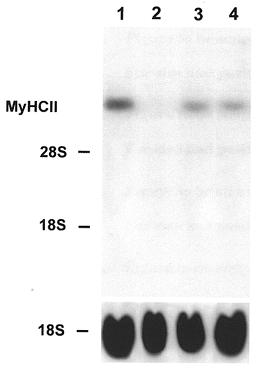
Cells were cultured for 22 (lane 1) or 30 days (lane 3) without ionophore or from day 8 for a further 14 days with Ca2+ ionophore A23187 (4 × 10⁻⁷ M) (lane 2). Other cells were cultured from day 8 to 22 with ionophore and then after withdrawal of ionophore for a further 8 days (lane 4). Total RNA (20 μg) was isolated from control and ionophore treated cultures at the time points indicated, fractionated on a 1.2 % agarose-formaldehyde gel, and transferred to nitrocellulose. The blots were probed with the 32P-labelled 3′ terminal PstI fragment of MyHCIId cDNA (1 × 10⁶ c.p.m. ml−1) or an rDNA probe from 18S rRNA (1 × 10⁶ c.p.m. ml−1). The positions of 18S rRNA (1.9 kb) and 28S rRNA (4.8 kb) on the ethidium bromide-stained gel are indicated.
Effects of Ca2+ ionophore treatment on metabolic marker enzymes
It is well documented that a fast-to-slow transition leads to significant changes in the enzyme activities of energy metabolism (Pette & Vrbová, 1992; Mayne et al. 1996). To study the effects of Ca2+ ionophore treatment on enzymes of energy metabolism at the transcriptional level, we investigated the expression of the CS and GAPDH genes. The level of CS mRNA was already slightly increased 2 days after starting the late ionophore treatment on day 22 (Fig. 8, lane 2, compare with lane 1). The long-term rise in [Ca2+]i led to a significant increase in the amount of CS mRNA on day 24 after 13 days of ionophore treatment (Fig. 8, lane 3, compare with lane 1). The level of GAPDH mRNA decreased as shown in Fig. 9 for a culture after 7 days of ionophore treatment from day 22 onwards (lane 2, compare with lane 1). These data indicate a shift from glycolytic to oxidative energy metabolism at the level of gene expression during a Ca2+-induced fast-to-slow muscle cell transition.
Figure 8. Northern blot analysis of the citrate synthase (CS) mRNA.
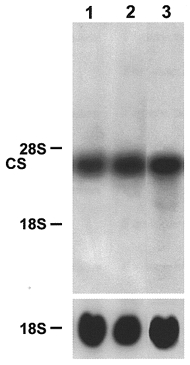
Muscle cell cultures were grown for 24 days in the absence (lane 1) of ionophore. Ca2+ ionophore A23187 (4 × 10⁻⁷ M) was added for a further 2 days on day 22 (lane 2) or for a further 13 days on day 11 (lane 3) to the cell cultures. Total RNA (20 μg) was isolated from control and ionophore treated cultures, fractionated on a 1.2 % agarose-formaldehyde gel, and transferred to nitrocellulose. The blots were hybridized with the 32P-labelled 800 bp ClaI-EcoRV fragment of CS cDNA (1 × 10⁶ c.p.m. ml−1) or an rDNA probe from 18S rRNA (1 × 10⁶ c.p.m. ml−1). The positions of 18S rRNA (1.9 kb) and 28S rRNA (4.8 kb) on the ethidium bromide-stained gel are indicated.
Figure 9. Northern blot analysis of the glyceraldehyde 3-phosphate dehydrogenase (GAPDH) mRNA.
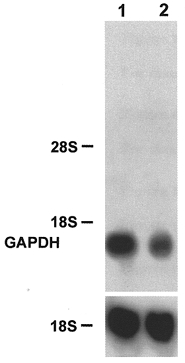
Muscle cell cultures were grown for 29 days in the absence (lane 1) or for 22 days without and then for further 7 days in the presence of Ca2+ ionophore A23187 (4 × 10⁻⁷ M) (lane 2). Total RNA (20 μg) was isolated from control and ionophore treated cultures, fractionated on a 1.2 % agarose- formaldehyde gel, and transferred to nitrocellulose. The blots were hybridized with a 32P-labelled 1.3 kb PstI fragment encompassing the complete GAPDH cDNA (1 × 10⁶ c.p.m. ml−1) or an rDNA probe from 18S rRNA (1 × 10⁶ c.p.m. ml−1). The positions of 18S rRNA (1.9 kb) and 28S rRNA (4.8 kb) on the ethidium bromide-stained gel are indicated.
DISCUSSION
The present study demonstrates the adult fast character and a Ca2+-induced reversible fast-to-slow transition of the myotubes in a rabbit primary skeletal muscle culture at the level of gene expression. Non-adult MyHC isoform mRNAs were absent after 22 days of culture. After 4 weeks of culture, only trace amounts of MyHCI mRNA were found, while fast MyHCIId mRNA was strongly expressed. MyHCIId is the dominating MyHC of many fast adult rabbit muscles (Aigner et al. 1993). The absence of non-adult MyHC isoforms in the cultured myotubes grown on microcarriers is in contrast to cultures from the same source growing on tissue culture dishes (data not shown). Also, a mixed pattern of non-adult and adult MyHC isoforms has been reported previously for satellite or neonatal myoblast cultures and myogenic cell lines (Silverstein et al. 1986; Weydert et al. 1987; Düsterhöft & Pette, 1993; Naumann & Pette, 1994). Furthermore, the data presented demonstrate clearly that during the Ca2+-induced fast-to-slow transition changes at the MyHC mRNA level occur. The levels of fast MyHCII isoform mRNAs decrease, while slow MyHCI mRNA levels increase. The results of late Ca2+ ionophore treatment beginning on day 22 and lasting until day 24 or 29, show that changes at the mRNA level correspond qualitatively to the changes at the protein level, but mRNAs and proteins change at different rates. The changes are more advanced at the transcriptional level. Upregulation of the MyHCI gene is detectable just 1 day after the start of the ionophore treatment, while only a small increase in the level of MyHCI protein is found after 2 days. In addition to a fast upregulation of the MyHCI gene, significant amounts of MyHCIIa protein were found here during the transition. It is well known that during fast-to-slow transition of rabbit muscle in vivo the expression of MyHC isoforms occurs in the order IId > IIa > I (Peuker et al. 1998). The occurrence of MyHCIIa and MyHCI protein after short periods of ionophore treatment and the exclusive occurrence of MyHCI protein after long periods (Kubis et al. 1997) are in accordance with this transition sequence.
In response to the Ca2+ stimulus, genes encoding enzymes involved in oxidative metabolism, like CS, are induced while those encoding glycolytic enzymes, like GAPDH, are downregulated. These data are in accordance with the data of Kubis et al. (1997) who found a rise in CS enzyme activity and a drop in lactate dehydrogenase (LDH) enzyme activity in the myotubes after Ca2+ ionophore treatment. Thus, the Ca2+-induced fast-to-slow transition of the primary skeletal muscle culture cells is comparable to the effect of low frequency stimulation on fast skeletal muscle in vivo with respect to changes in the proteins of the contractile apparatus and the enzymes of energy metabolism. The plasticity of the cultured myotubes was further demonstrated after withdrawal of ionophore. Increasing levels of fast MyHCII mRNA and decreasing levels of slow MyHCI mRNA after lowering [Ca2+]i to normal levels indicate a slow-to-fast transition at the level of gene expression, demonstrating the reversibility of the ionophore effect. Reversibility of the transition is also a marked feature of low frequency stimulation-induced changes of gene expression in vivo (Brownson et al. 1992a,b; Pette & Vrbová, 1992). A slightly more rapid onset of resulting alterations in MyHC mRNA expression was observed in the primary skeletal muscle culture than in vivo. The first changes at the mRNA level were demonstrated in the culture 1 day after the start of Ca2+ ionophore treatment. The earliest changes in MyHC mRNA levels were reported after 2 days of electrostimulation of rat fast-twitch muscle (Kirschbaum et al. 1990). It may be noted that we do not know at present whether the two experimental situations impose different regimens of induction of the transition or whether they both enter into the same pathway of signals leading to altered gene expression.
Low frequency stimulation-induced alterations in muscle phenotype are well documented (Pette & Vrbová, 1992), but little is known about the signals that mediate the transformation. It has been proposed previously that an altered intracellular phosphorylation potential results in fibre type-specific alterations in gene expression of enzymes and proteins of the contractile apparatus (Shoubridge et al. 1985). A close relationship between MyHC isoform expression and the [ATP]/[ADP]free ratio has been described in transforming fibres. Therefore, it has been suggested that changes in the energy potential may act as a signal initiating a fast-to-slow transformation (Conjard et al. 1998; Pette, 1998). Sreter et al. (1987) have demonstrated a long-lasting elevation of intracellular Ca2+ during electrically induced fast-to-slow transition of rabbit extensor digitorum longus and tibialis anterior muscles in vivo. Ca2+-dependent phosphorylation steps as well as activation of proteolytic enzymes were hypothesized to be involved in the transformation process. The importance of changes in [Ca2+]i is demonstrated by the fact reported here that a fast-to-slow transition in the primary muscle culture cells is triggered by addition of Ca2+ ionophore to the medium, which leads to a 3- to 10-fold increase in intracellular free Ca2+ in the myotubes that lasts for at least 16 days (Kubis et al. 1997). In the present experiments, ionophore treatment had no impact on the ability of the myotubes to contract vigorously and spontaneously, indicating integrity of the cell membrane. In addition, an intact morphology of the myotubes could be demonstrated by scanning and transmission electron microscopy (B. Decker, H.-P. Kubis & G. Gros, unpublished observation). Therefore, we conclude that the fast-to-slow transition of the myotubes as observed here was induced by changes in [Ca2+]i rather than by muscle damage, which has been linked to stretch-induced fibre growth and transformation (McKoy et al. 1999).
Recently, Chin et al. (1998) demonstrated the involvement of a calcineurin (Ca2+-regulated serine/threonine phosphatase)-dependent signalling pathway in controlling fibre type-specific gene expression. Activation of calcineurin selectively upregulates slow fibre-specific genes and slow fibre-specific transcriptional activation appears to be mediated by members of the NF-AT (nuclear factor of activated thymocytes) and MEF2 (myocyte enhancer factor 2) transcription factor families. The importance of Ca2+ for phenotypic adaptations of skeletal muscle was further shown by the finding of a Ca2+-sensitive protein kinase C-dependent pathway involved in cytochrome c expression (Freyssenet et al. 1999).
The induction of immediate-early genes c-fos, c-jun and egr-1 is one of the earliest responses of rabbit tibialis anterior subjected to low frequency stimulation (Michel et al. 1994). The same regimen, or passive stretch, or a combination of both, led also to induction of c-jun and c-fos in rabbit latissimus dorsi and extensor digitorum longus (Osbaldeston et al. 1993, 1995; Dawes et al. 1996). Interestingly, passive stretch, leading to significant growth of muscle, as well as fibre type transformation, was accompanied by increases in insulin-like growth factor I (IGF-I) protein and mRNA. In contrast, continuous electrical stimulation-induced fibre transition did not induce muscle growth and did not lead to an increase in IGF-I mRNA (Goldspink et al. 1995; Yang et al. 1997).
A consistent hypothesis for a signalling pathway underlying fibre type transition has not yet emerged from the available data. There might be differences between the different transition-inducing regimens. For investigation of the complete signalling pathways underlying mechanisms of muscle plasticity, electrical stimulation and passive stretch so far have been of restricted value due to the limitations imposed by the in vivo situation. The primary skeletal muscle culture offers the possibility to study signalling pathways in vitro in detail and may help to gain more insight into the mechanisms, extracellular factors, and intracellular signal cascades that lead to fast-to-slow transition.
Acknowledgments
We are grateful to Drs C. Brownson, M. Buckingham, R. Guntaka, P. K. Umeda, R. S. Williams, and A. Wittinghofer for their generous gift of plasmids. We thank E.-A. Haller for excellent assistance in cell culture and N. Freiberg for technical assistance. We wish to thank Drs W. H. Müller and A. Rühlmann for helpful discussions.
References
- Aigner S, Gohlsch B, Hämäläinen N, Staron RS, Uber A, Wehrle U, Pette D. Fast myosin heavy chain diversity in skeletal muscles of the rabbit: heavy chain IId, not IIb predominates. European Journal of Biochemistry. 1993;211:367–372. doi: 10.1111/j.1432-1033.1993.tb19906.x. [DOI] [PubMed] [Google Scholar]
- Annex BH, Kraus WE, Dohm GL, Williams RS. Mitochondrial biogenesis in striated muscles: rapid induction of citrate synthase mRNA by nerve stimulation. American Journal of Physiology. 1991;260:C266–270. doi: 10.1152/ajpcell.1991.260.2.C266. [DOI] [PubMed] [Google Scholar]
- Brownson C, Isenberg H, Brown W, Salmons S, Edwards Y. Changes in skeletal muscle gene transcription induced by chronic stimulation. Muscle and Nerve. 1988;11:1183–1189. doi: 10.1002/mus.880111113. [DOI] [PubMed] [Google Scholar]
- Brownson C, Little P, Jarvis JC, Salmons S. Reciprocal changes in myosin isoform mRNAs of rabbit skeletal muscle in response to the initiation and cessation of chronic electrical stimulation. Muscle and Nerve. 1992a;15:694–700. doi: 10.1002/mus.880150611. [DOI] [PubMed] [Google Scholar]
- Brownson C, Little P, Mayne C, Jarvis JC, Salmons S. Reciprocal changes in myosin isoform expression in rabbit fast skeletal muscle resulting from the application and removal of chronic electrical stimulation. Symposium of the Society of Experimental Biology. 1992b;46:301–310. [PubMed] [Google Scholar]
- Buckingham ME. Actin and myosin multigene families: their expression during the formation of skeletal muscle. Essays in Biochemistry. 1985;20:77–109. [PubMed] [Google Scholar]
- Buller AJ, Eccles JC, Eccles RM. Differentiation of fast and slow muscles in the cat hind limb. The Journal of Physiology. 1960;150:399–416. doi: 10.1113/jphysiol.1960.sp006394. [DOI] [PMC free article] [PubMed] [Google Scholar]
- Chin ER, Olson EN, Richardson JA, Yang Q, Humphries C, Shelton JM, Wu H, Zhu W, Bassel-Duby R, Williams RS. A calcineurin-dependent transcriptional pathway controls skeletal muscle fiber type. Genes and Development. 1998;12:2499–2509. doi: 10.1101/gad.12.16.2499. [DOI] [PMC free article] [PubMed] [Google Scholar]
- Chirgwin JM, Przybyla AE, MacDonald RJ, Rutter WJ. Isolation of biologically active ribonucleic acid from sources enriched in ribonuclease. Biochemistry. 1979;18:5294–5299. doi: 10.1021/bi00591a005. [DOI] [PubMed] [Google Scholar]
- Chomczynski P, Sacchi N. Single-step method of RNA isolation by acid guanidinium thiocyanate-phenol-chloroform extraction. Analytical Biochemistry. 1987;162:156–159. doi: 10.1006/abio.1987.9999. [DOI] [PubMed] [Google Scholar]
- Conjard A, Peuker H, Pette D. Energy state and myosin heavy chain isoforms in single fibres of normal and transforming rabbit muscles. Pflügers Archiv. 1998;436:962–969. doi: 10.1007/s004240050730. [DOI] [PubMed] [Google Scholar]
- Dawes NJ, Cox VM, Park KS, Nga H, Goldspink DF. The induction of c-fos and c-jun in the stretched latissimus dorsi muscle of the rabbit: responses to duration, degree and re-application of the stretch stimulus. Experimental Physiology. 1996;81:329–339. doi: 10.1113/expphysiol.1996.sp003937. [DOI] [PubMed] [Google Scholar]
- Düsterhöft S, Pette D. Satellite cells from slow rat muscle express slow myosin under appropriate culture conditions. Differentiation. 1993;53:25–33. doi: 10.1111/j.1432-0436.1993.tb00642.x. [DOI] [PubMed] [Google Scholar]
- Feinberg AP, Vogelstein B. A technique for radiolabeling DNA restriction endonuclease fragments to high specific activity. Analytical Biochemistry. 1983;132:6–13. doi: 10.1016/0003-2697(83)90418-9. [DOI] [PubMed] [Google Scholar]
- Fort P, Marty L, Piechaczyk M, van Sabrouty S, Dani C, Jaenteur P, Blanchard JM. Various rat adult tissues express only one major mRNA species from the glyceraldehyde-3-phosphate dehydrogenase multigenic family. Nucleic Acids Research. 1985;13:1431–1442. doi: 10.1093/nar/13.5.1431. [DOI] [PMC free article] [PubMed] [Google Scholar]
- Freyssenet D, van Carlo M, Hood DA. Calcium-dependent regulation of cytyochrome c gene expression in skeletal muscle cells. Identification of a protein kinase C-dependent pathway. Journal of Biological Chemistry. 1999;274:9305–9311. doi: 10.1074/jbc.274.14.9305. [DOI] [PubMed] [Google Scholar]
- Goldspink DF, Cox VM, Smith SK, Eaves LA, Osbaldeston NJ, Lee DM, Mantle D. Muscle growth in response to mechanical stimuli. American Journal of Physiology. 1995;268:E288–297. doi: 10.1152/ajpendo.1995.268.2.E288. [DOI] [PubMed] [Google Scholar]
- Goldspink G, Scutt A, Loughna PT, Wells DJ, Jaenicke T, Gerlach GF. Gene expression in skeletal muscle in response to stretch and force generation. American Journal of Physiology. 1992;262:R356–363. doi: 10.1152/ajpregu.1992.262.3.R356. [DOI] [PubMed] [Google Scholar]
- Henriksson J, Salmons S, Chi MM-Y, Hintz CS, Lowry OH. Chronic stimulation of mammalian muscle: changes in metabolite concentrations in individual fibers. American Journal of Physiology. 1988;255:C543–551. doi: 10.1152/ajpcell.1988.255.4.C543. [DOI] [PubMed] [Google Scholar]
- Katz RA, Erlanger BF, Guntaka RV. Evidence for extensive methylation of ribosomal RNA genes in rat XC cell line. Biochimica et Biophysica Acta. 1983;739:258–264. doi: 10.1016/0167-4781(83)90099-4. [DOI] [PubMed] [Google Scholar]
- Kirschbaum BJ, Schneider S, Izumo S, Mahdavi V, Nadal-Ginard B, Pette D. Rapid and reversible changes in myosin heavy chain expression in response to increased neuromuscular activity of rat fast-twitch muscle. FEBS Letters. 1990;268:75–78. doi: 10.1016/0014-5793(90)80976-p. [DOI] [PubMed] [Google Scholar]
- Kubis H-P, Gros G. A rapid electrophoretic method for separating rabbit skeletal muscle myosin heavy chains at high resolution. Electrophoresis. 1997;18:64–66. doi: 10.1002/elps.1150180113. [DOI] [PubMed] [Google Scholar]
- Kubis H-P, Haller E-A, Wetzel P, Gros G. Adult fast myosin pattern and Ca2+-induced slow myosin pattern in primary skeletal muscle cell culture. Proceedings of the National Academy of Sciences of the USA. 1997;94:4205–4210. doi: 10.1073/pnas.94.8.4205. [DOI] [PMC free article] [PubMed] [Google Scholar]
- McKoy G, Ashley W, Mander J, Yang SY, Williams N, Russell B, Goldspink G. Expression of insulin growth factor-I splice variants and structural genes in rabbit skeletal muscle induced by stretch and stimulation. The Journal of Physiology. 1999;516:583–592. doi: 10.1111/j.1469-7793.1999.0583v.x. [DOI] [PMC free article] [PubMed] [Google Scholar]
- Maeda K, Sczakiel G, Wittinghofer A. Characterisation of cDNA coding for the complete light meromyosin portion of a rabbit fast skeletal muscle myosin heavy chain. European Journal of Biochemistry. 1987;167:97–102. doi: 10.1111/j.1432-1033.1987.tb13308.x. [DOI] [PubMed] [Google Scholar]
- Mayne CN, Sutherland H, Jarvis JC, Gilroy SJ, Craven AJ, Salmons S. Induction of a fast-oxidative phenotype by chronic muscle stimulation: histochemical and metabolic studies. American Journal of Physiology. 1996;270:C313–320. doi: 10.1152/ajpcell.1996.270.1.C313. [DOI] [PubMed] [Google Scholar]
- Michel JB, Ordway GA, Richardson JA, Williams RS. Biphasic induction of immediate early gene expression accompanies activity-dependent angiogenesis and myofiber remodeling of rabbit skeletal muscle. Journal of Clinical Investigation. 1994;94:277–285. doi: 10.1172/JCI117318. [DOI] [PMC free article] [PubMed] [Google Scholar]
- Moore LA, Tidyman WE, Arrizubieta MJ, Bandman E. The evolutionary relationship of avian and mammalian myosin heavy-chain genes. Journal of Molecular Evolution. 1993;36:21–30. doi: 10.1007/BF02407303. [DOI] [PubMed] [Google Scholar]
- Naumann K, Pette D. Effects of chronic stimulation with different impulse patterns on the expression of myosin isoforms in rat myotube cultures. Differentiation. 1994;55:203–211. doi: 10.1046/j.1432-0436.1994.5530203.x. [DOI] [PubMed] [Google Scholar]
- Osbaldeston NJ, Lee DM, Cox VM, Eaves L, Morrison JFJ, Hesketh J, Goldspink DF. The temporal expression of cellular oncogenes in mechanically stimulated muscle. Biochemical Society Transactions. 1993;21:367S. doi: 10.1042/bst021367s. [DOI] [PubMed] [Google Scholar]
- Osbaldeston NJ, Lee DM, Cox VM, Hesketh JE, Morrison JFJ, Blair GE, Goldspink DF. The temporal and cellular expression of c-fos and c-jun in mechanically stimulated rabbit latissimus dorsi muscle. Biochemical Journal. 1995;308:465–471. doi: 10.1042/bj3080465. [DOI] [PMC free article] [PubMed] [Google Scholar]
- Pette D. Training effects on the contractile apparatus. Acta Physiologica Scandinavica. 1998;162:367–376. doi: 10.1046/j.1365-201X.1998.0296e.x. [DOI] [PubMed] [Google Scholar]
- Pette D, Vbrová G. Neural control of phenotypic expression in mammalian muscle fibers. Muscle and Nerve. 1985;8:676–689. doi: 10.1002/mus.880080810. [DOI] [PubMed] [Google Scholar]
- Pette D, Vrbová G. Adaption of mammalian skeletal muscle fibers to chronic electrical stimulation. Reviews of Physiology, Biochemistry and Pharmacology. 1992;120:115–208. doi: 10.1007/BFb0036123. [DOI] [PubMed] [Google Scholar]
- Peuker H, Conjard A, Pette D. Alpha-cardiac-like myosin heavy chain as an intermediate between MyHCIIa and MHCI beta in transforming rabbit muscle. American Journal of Physiology. 1998;274:C595–602. doi: 10.1152/ajpcell.1998.274.3.C595. [DOI] [PubMed] [Google Scholar]
- Russell B, Dix DJ. Mechanisms for intracellular distribution of mRNA: in situ hybridization studies in muscle. American Journal of Physiology. 1992;262:C1–8. doi: 10.1152/ajpcell.1992.262.1.C1. [DOI] [PubMed] [Google Scholar]
- Saez L, Leinwand LA. Characterisation of diverse forms of myosin heavy chain expressed in adult human skeletal muscle. Nucleic Acids Research. 1986;14:2951–2969. doi: 10.1093/nar/14.7.2951. [DOI] [PMC free article] [PubMed] [Google Scholar]
- Salmons S, Henriksson J. The adaptive response of skeletal muscle to increased use. Muscle and Nerve. 1981;4:94–105. doi: 10.1002/mus.880040204. [DOI] [PubMed] [Google Scholar]
- Schiaffino S, Salviati G. Molecular diversity of myofibrillar proteins: isoform analysis at the protein and mRNA level. Methods in Cell Biology. 1998;52:349–369. doi: 10.1016/s0091-679x(08)60387-8. [DOI] [PubMed] [Google Scholar]
- Shoubridge EA, Challiss RAJ, Hayes DJ, Radda GK. Biochemical adaption in the skeletal muscle of rats depleted of creatine with the substrate analogue beta-guanidinopropionic acid. Biochemical Journal. 1985;232:125–131. doi: 10.1042/bj2320125. [DOI] [PMC free article] [PubMed] [Google Scholar]
- Silverstein L, Webster SG, Travis M, Blau HM. Developmental progression of myosin gene expression in cultured muscle cells. Cell. 1986;46:1075–1081. doi: 10.1016/0092-8674(86)90707-5. [DOI] [PubMed] [Google Scholar]
- Sreter FA, Lopez JR, Alamo L, Mabuchi K, Gergely J. Changes in intracellular ionized Ca concentration associated with muscle fiber type transformation. American Journal of Physiology. 1987;253:C296–300. doi: 10.1152/ajpcell.1987.253.2.C296. [DOI] [PubMed] [Google Scholar]
- Uber A, Pette D. PCR-based assignment of two myosin heavy chain cDNA clones to biochemically and histochemically defined single type IIB and IID fibers of rabbit muscle. FEBS Letters. 1993;331:193–197. doi: 10.1016/0014-5793(93)80324-n. [DOI] [PubMed] [Google Scholar]
- Weydert A, Barton P, Harris AJ, Pinset C, Buckingham ME. Developmental pattern of mouse skeletal myosin heavy chain gene transcripts in vivo and in vitro. Cell. 1987;49:121–129. doi: 10.1016/0092-8674(87)90762-8. [DOI] [PubMed] [Google Scholar]
- Weydert A, Daubas P, Lazarides I, Barton P, Garner I, Leader DP, Bonhomme F, Catalan J, Simon D, Guenet JL, Gros F, Buckingham ME. Genes for skeletal muscle myosin heavy chains are clustered and are not located on the same mouse chromosome as a cardiac myosin heavy chain gene. Proceedings of the National Academy of Sciences of the USA. 1985;82:7183–7187. doi: 10.1073/pnas.82.21.7183. [DOI] [PMC free article] [PubMed] [Google Scholar]
- Yang S, Alnaqeeb M, Simpson H, Goldspink G. Changes in muscle fiber type, muscle mass and IGF-I gene expression in rabbit skeletal muscle subjected to stretch. Journal of Anatomy. 1997;190:613–622. doi: 10.1046/j.1469-7580.1997.19040613.x. [DOI] [PMC free article] [PubMed] [Google Scholar]


