

Abstract
The effects of cytosolic ATP on sarcoplasmic reticulum (SR) Ca2+ regulation were investigated in saponin-permeabilised rat ventricular myocytes. [Ca2+] within the cells was monitored using Fura-2 or Fluo-3 fluorescence. Spontaneous cyclic Ca2+ release from the SR was induced by increasing the bathing [Ca2+] to 200–300 nM, in solutions weakly Ca2+ buffered with 0.05 mm EGTA. Alternatively, Ca2+-induced Ca2+ release (CICR) was triggered by a rapid increase in [Ca2+] induced by flash photolysis of Nitr-5 (0.08 mm), replacing EGTA in the solution.
Stepwise reductions in [ATP] were associated with corresponding decreases in the frequency and increases in the amplitude of spontaneous Ca2+ transients. A decrease from 5 mm to 0.1 mm ATP, reduced the release frequency by 48.6 ± 7 % (n = 7) and almost doubled the amplitude of the Ca2+ transient. Marked prolongation of the spontaneous Ca2+ transient occurred when [ATP] was further reduced to 10 μM, consistent with inhibition of the SR Ca2+ pump.
These effects of ATP were compared with other interventions that inhibit Ca2+ uptake or reduce the sensitivity of the SR Ca2+ release mechanism. Inhibition of the SR Ca2+ pump with cyclopiazonic acid (CPA) markedly reduced the spontaneous Ca2+ release frequency, without changing the amplitude. The descending phase of the Ca2+ transient was prolonged in the presence of CPA, while the rising phase was unaffected. In contrast, desensitisation of the SR Ca2+ release mechanism with tetracaine decreased the frequency of spontaneous release, but markedly increased the amplitude.
CICR triggered by flash photolysis of Nitr-5 appeared to be more sensitive to cytosolic [ATP] than spontaneous release and was generally delayed by a decrease to 2.5 mm ATP. In the presence of 0.1-0.2 mm ATP, release often failed completely or was not consistently triggered. Some preparations exhibited Ca2+ release ‘alternans’, whereby every alternate trigger induced a response.
These results suggest that the increase in spontaneous Ca2+ release amplitude and the decrease in frequency that occurs as [ATP] is reduced from 1 mm to 100 μM, is mainly due to desensitisation of the SR Ca2+ release mechanism, which allows the SR Ca2+ content to reach a higher level before release occurs. At very low [ATP], a reduction in the SR Ca2+ uptake rate may also contribute to the decrease in release frequency. CICR triggered by photolysis of Nitr-5 appeared to be more sensitive to cytosolic [ATP]. The possible underlying mechanisms and the relevance of these results to myocardial ischaemia or hypoxia is considered.
In the first few minutes of anoxia or global ischaemia, inhibition of aerobic metabolism is accompanied by a pronounced decrease in contractile force (reviewed by Allen & Orchard, 1987). During this phase, the average intracellular concentration of ATP ([ATP]i) remains relatively constant as ADP is re-phosphorylated by creatine phosphate (CrP), catalysed by creatine kinase. The [CrP]i decreases rapidly from 15–20 mm to undetectable levels and the intracellular inorganic phosphate concentration ([Pi]i) increases from about 2 mm to 20 mm. After depletion of CrP, ATP synthesis continues via anaerobic glycolysis, resulting in lactic acid production and a decrease in intracellular pH (pHi). With more prolonged periods of global ischaemia, anaerobic glycolysis ceases and a further increase in [Pi]i occurs due to the net hydrolysis of ATP.
Previous studies have shown that these characteristic changes in pH, [Pi] and [CrP] have pronounced effects on SR Ca2+ regulation and the myofilament force production (Orchard & Kentish, 1990; Smith & Steele, 1992; Steele et al. 1995). However, comparatively little is known about the effects of ATP depletion on SR Ca2+ regulation and in particular the CICR mechanism. In isolated SR vesicles, ATP increases the maximum Ca2+-activated efflux rate and the apparent Ca2+ sensitivity of the release mechanism (Meissner & Henderson, 1987). Experiments on isolated SR Ca2+ channels have also shown that, in the presence of activating levels of Ca2+, millimolar levels of ATP and other adenine nucleotides activate the channel (Rousseau et al. 1986; McGarry & Williams, 1994). However, in recent studies on isolated channels under simulated ischaemic conditions, the dominant effect of ATP was a reduction in the degree of channel inactivation as [Ca2+] increased above 30 μM (Xu et al. 1996). At lower [Ca2+] channels appeared to be relatively insensitive to ATP: reducing the [ATP] from 5 to 1 mm had little effect on the opening probability (Po), while complete removal of ATP resulted in a 20 % reduction in Po.
Based on single channel studies alone, it is difficult to assess what effect changes in cytosolic [ATP] may have on the sensitivity of the CICR mechanism in intact cardiac cells under more physiological conditions. In the present study, we have investigated the effects of cytosolic ATP on SR Ca2+ regulation in permeabilised rat ventricular myocytes. In this preparation, the effects of ATP on the Ca2+ uptake and release process can be studied under conditions in which the SR remains in situ. The [Ca2+] within the cell was monitored using Fura-2 or Fluo-3 fluorescence. Stepwise reductions in [ATP] were associated with corresponding decreases in the frequency and increases in the amplitude of spontaneous CICR transients. A decrease from 5 to 0.1 mm ATP, reduced the CICR frequency and almost doubled the amplitude of the Ca2+ transient. Marked prolongation of the spontaneous CICR transient occurred when [ATP] was further reduced to 10 μM, consistent with inhibition of the SR Ca2+ pump. These effects on spontaneous Ca2+ release were compared with CICR triggered by a rapid increase in [Ca2+] induced by flash photolysis of the caged calcium chelator Nitr-5. Release triggered by flash photolysis at regular time intervals appeared more sensitive to the cytosolic [ATP] and was generally delayed by a decrease to 2.5 mm. In the presence of 0.1–0.2 mm ATP, some preparations exhibited release ‘alternans’, whereby every alternate trigger induced a response. The mechanism underlying these effects of cytosolic ATP on CICR and the possible relevance to ischaemia or anoxia are considered.
METHODS
Ventricular myocyte isolation and permeabilisation
Rats were killed by an intraperitoneal overdose of sodium pentobarbitone and the hearts rapidly excised into oxygenated physiological saline solution. Hearts were mounted on a Langendorff apparatus and perfused at 5 ml min−1 at 37°C with a series of solutions based on an ‘isolation solution’ of the following composition (mm): NaCl 130, KCl 5.4, MgCl2 1.4, NaH2PO4 0.4, Hepes 5, glucose 10, taurine 20, creatine 10, pH 7.3. The first solution, containing 750 μM CaCl2, was perfused for 4 min. The heart was then perfused for 4 min with Ca2+-free isolation solution containing 100 μM Na2EGTA. Finally, perfusion was switched to the isolation solution containing 200 μM CaCl2 and collagenase (Worthington type 2; 0.1 mg ml−1) for 9–12 min. The left ventricle was dissected and finely chopped in an enzyme-containing solution with 1 % bovine serum albumin and gently agitated in a water bath at 37°C. Aliquots of the cell suspension were examined every 5 min until a >80 % yield of rod-shaped cells with a clear striation pattern was obtained. Myocytes were collected by filtration through nylon gauze and gentle centrifugation. The myocytes were then exposed to saponin (10 mg ml−1) in a mock intracellular solution (as below) for 6 min, before centrifugation and re-suspension. All experiments were done at room temperature (20–22°C).
Composition of ‘mock intracellular’ solutions
Unless otherwise stated, all chemicals were obtained from Sigma. H+ and Ca2+ were buffered with Hepes and EGTA, respectively. All solutions used during and after saponin-treatment contained ATP to support the activity of the SR and myofilaments. In all experiments, the ionic composition of the solution was adjusted to maintain [Ca2+], [Mg2+], [Na+], [K+] and pH constant. In brief, for most experiments, a basic solution was prepared containing KCl (100 mm); Hepes (25 mm); EGTA (0.05 mm) or Nitr-5 (80 μM); CrP (10 mm); ATP (5 mm) and Fura-2 (4 μM) or Fluo-3 (2 μM). MgCl2 was added (from 1 M, BDH) to produce a free concentration of 1.0 mm. The free [Ca2+] was adjusted to the desired level by addition of CaCl2 (1 M, BDH).
The primary aim of this study was to characterise the effect of ATP on CICR, without the influence of other intracellular factors which may alter in concentration during ischaemia or anoxia. Therefore, 10 mm CrP was included in all solutions to reduce the possibility of indirect effects via ATP metabolites (e.g. ADP). Buffering of ATP by CrP also minimises any possible [ATP] gradient between the bulk solution and core of the cell. As ATP buffers Mg2+ strongly, it was necessary to ensure that the free [Mg2+] remained constant (at 1 mm) when [ATP] was altered. In order to avoid possible inaccuracies in calculation of the free [Mg2+] using binding constant data obtained under different ionic conditions, the concentration was measured directly using Mg2+-selective Fura-2. In these experiments, it was found that addition of ATP decreased Mg2+-Fura-2 fluorescence recorded at > 500 nm. However, the proportional decrease was the same at 340 nm and 380 nm excitation wavelengths and the ratio and Mg2+ sensitivity were unaffected. This was further confirmed in experiments where 50 mm EDTA was included in the experimental solutions in order to minimise the influence of Mg2+ buffering by ATP (not shown). In the absence of ATP, it was necessary to add 1.2 mm total Mg2+ to produce a free concentration of 1 mm in the standard experimental solution (as above). This is because approximately 0.2 mm Mg2+ is bound to 10 mm CrP. In solutions with 5 mm ATP and 10 mm CrP, it was necessary to add 5.75 mm total Mg2+ to achieve a free Mg2+ concentration of 1 mm. In solutions containing 5 mm 5-adenylylimododiphosphate (AMP-PNP), [Mg2+] was reduced by approximately 1.7 mm to maintain the free [Mg2+] at 1 mm.
In practice, a solution was prepared containing all constituents except ATP and Mg2+. The solution was divided into two parts and 5 mm ATP (final concentration) added to one. Appropriate levels of Mg2+ were then added to each solution to maintain the final free Mg2+ at 1 mm and 10 mm NaCl was added to the solution lacking ATP to maintain [Na+] at 30 mm. The pH of the solutions was then adjusted to 7.0 using KOH (1 M, BDH). As the solution containing ATP required more KOH, an equivalent concentration of KCl was added to maintain [K+] at 130 mm. Finally, the solutions were accurately volume corrected and the pH re-checked. The [Ca2+] of the ATP and ATP-free solutions was then checked using Fura-2 (or Fluo-3) fluorescence and adjusted as necessary before mixing in various proportions to obtain the desired [ATP]. The [Cl−] increased from 111.5 mm to 138.3 mm, when [ATP] was reduced from 5 to 0.01 mm in these solutions. However, in control experiments, it was found that changes in Cl− within this range had no apparent effect on SR Ca2+ uptake and release (not shown).
Apparatus for [Ca2+] detection in permeabilised myocytes
The apparatus used for measurement of [Ca2+] in ventricular myocytes is shown in Fig. 1A. The cells were placed in a cylindrical bath (5 mm diameter) in a Perspex block. The bottom of the bath was formed by attaching a coverslip to the underside of the block using epoxy resin. A drop of solution containing cells was placed at the bottom of the bath and a tightly fitting Perspex column inserted into the well until the lower surface was close to myocytes which had come to rest on the coverslip. During this procedure, some displaced solution rose up the side of the column, but most cells remained at the bottom of the bath. Perfusion was achieved by pumping solution at 0.3 ml min−1 down a narrow bore running longitudinally through the centre of the column. After passing through the bath, the solution flowed continuously up the side of the column, where it was collected and taken to waste. In some experiments, solution with caffeine (20 mm) was rapidly applied via a narrow injection duct, which joined the column above the upper surface of the Perspex block.
Figure 1. Apparatus for measurement of [Ca2+] within permeabilised ventricular myocytes.

The standard configuration used for Fura-2 fluorescence is shown in A. The cells were illuminated with 340 nm and 380 nm light at 40 Hz using a xenon light source and a spinning wheel filter system. Light emitted from areas of the visual field to each side of the myocyte was reduced using a variable rectangular diaphragm. Fluorescence from above the myocyte was reduced by lowering a Perspex column close to the surface of the myocyte. The modified apparatus used in experiments involving flash photolysis of Nitr-5 and Ca2+ measurement using Fluo-3 is shown in B. Continuous excitation at 490 nm was obtained using a bandpass (B.P.) filter. The Perspex column was replaced by a liquid light guide to transmit the excitation light from a xenon flash lamp, long-pass (L.P.) filtered at 320 nm. This light guide also transmitted long wavelength light (L.P. filtered at 665 nm) from a Schott light source, used to provide an image of the cell, viewed on a CCD camera (not shown).
The bath was placed on the stage of a Nikon Diaphot Eclipse inverted microscope and the cells were viewed using a ×40 oil immersion lens (Nikon Plan Flour X40 DLL). In most experiments, the preparation was alternately illuminated with light of wavelengths 340 nm and 380 nm at 40 Hz frequency using a spinning wheel spectrophotometer (Cairn Research, Faversham, Kent). The average [Ca2+] within the visual field containing the preparation, was indicated by the ratio of light intensities emitted at >500 nm. Light emitted from areas of the field to each side of the cell was eliminated using a variable rectangular window on the side port of the microscope and long-pass filtered at >480 nm before entering the photomultiplier.
In most experiments, Fura-2 was used in preference to Fluo-3, because ratiometric Ca2+ measurement is less prone to possible movement artefacts. However, in experiments involving flash photolysis of Nitr-5, Fluo-3 was used, because the excitation wavelengths for Fura-2 (340 nm and 380 nm) overlap with the excitation wavelengths required for photolysis of Nitr-5 (320–380 nm). As shown in Fig. 1B, these experiments required modification of the basic set-up, such that a liquid light guide replaced the Perspex column. Fluo-3 was excited using a 100 W xenon light source (Cairn Research) focused and passed through a 490 nm (Comar Optics, Cambridge, UK) bandpass filter. The emission light was passed through a 530 nm bandpass filter before entering the photomultiplier. Photolysis of Nitr-5 was achieved using a 150 W xenon flash lamp (Cairn Research), focused onto the light guide (3 mm diameter) positioned immediately above the cells. Before entering the light guide, short wavelength light was attenuated using a 315 nm longpass filter (Comar). The cells were also illuminated continuously by directing the output of another light guide attached to a standard dissecting light source (Schott, KL1500) onto the input of the flash lamp light guide at a slight (approximately 20 deg) angle. During the experiment, the illuminating light was long-pass filtered at 665 nm (Comar). This allowed the cells to be visualised using a CCD camera and monitor, without interfering with the wavelengths required for Ca2+ measurement.
Ca2+ measurement in ventricular myocytes
Ca2+ release from the SR was detected in solutions weakly Ca2+ buffered (0.05 mm EGTA or 80–100 μM Nitr-5) containing 4 μM Fura-2 (Calbiochem) or 2 μM Fluo-3. Under the conditions of this study, the apparent affinity constant of Fura-2 for Ca2+ was 0.33 ± 7 μM (n = 4). This value was calculated by measuring the fluorescence ratio in strongly Ca2+-buffered solutions over a range of [Ca2+]. The Kd for Ca2+ binding to Fluo-3 was as reported by Xiang & Kentish (1995) under similar conditions (0.55 μM). Experiments carried out with strongly Ca2+-buffered solutions (10 mm EGTA) confirmed that ATP had no significant effect on the Kd for Ca2+ binding to Fluo-3 within the concentration range studied. As reported previously, ATP reduced Fura-2 fluorescence detected at >500 nm. However, the relative increase in fluorescence was equal at both 340 nm and 380 nm excitation wavelengths, and the ratio was unaffected by changes in [ATP] (Duke & Steele, 1998a). The Kd for Ca2+ binding to Nitr-5 was assumed to be 0.145 nM and 6 μM after photolysis (Gurney, 1994). Measurements suggest that a single flash resulted in photolysis of 22–25 % of the Nitr-5 under these conditions, which is in agreement with previous studies using similar equipment. Where necessary, the equilibrium concentrations of metal ions in the calibration solutions were calculated using the affinity constants for H+, Ca2+ and Mg2+ for EGTA as previously reported (Fabiato & Fabiato, 1979; Smith & Miller, 1985) using the Windows-based REACT program (Duncan et al. 1999). Corrections for ionic strength, details of pH measurement, allowance for EGTA purity and the principles of the calculations are as described in Miller & Smith (1984). In some experiments, 5 mm azide (BDH) was included in the solutions to inhibit possible mitochondrial activity. However, azide had no apparent influence on the effects of ATP reported in this study.
One of the problems associated with the technique is that the fluorescent dye is present in the solution surrounding the muscle as well as the cytosolic space. Therefore, the collected fluorescence has a cytosolic component (Cs) and a component from the surrounding bathing solution (Bs). The signal from below the cell is small because the cell rests on the coverslip. Light emitted from the solution to either side of the preparation was excluded using a variable rectangular diaphragm in the emission light path. The signal from above the preparation was reduced by lowering the Perspex column or light guide close to the upper surface of the cells. With this arrangement, the change in ratio is large relative to previous studies in which solution above the cells was not minimised (Kawai et al. 1998) and most of the signal must originate from the cell. However, the contribution of the extracellular signal relative to that of the cell is not known with accuracy and may vary from cell to cell, depending on the precise positioning of the column or light guide. The influence of the Bs component means that the calculated [Ca2+] may be an underestimate of the peak release when the Ca2+ rises rapidly within the cell (for discussion see Duke & Steele, 1998b). Therefore, as the absolute peak [Ca2+] is not of major importance in this study, we have opted to show the unconverted Fura-2 fluorescence ratio, while indicating the steady-state bathing [Ca2+]. In the experiments using Fluo-3 and Nitr-5, photolysis results in a uniform increase in [Ca2+] throughout the bath, and an approximate [Ca2+] calibration has been indicated.
In these experiments, cells shortened significantly at [ATP] less than 100 μM due to the formation of rigor complexes. In this experimental system, cell shortening could not be measured reliably because the presence of the Perspex column or light guide reduced the image quality significantly. The relationship between [ATP] and cell length has, however, been studied previously in saponin-permeabilised myocytes (Nichols & Lederer, 1990).
Data recording and analysis
The ratio signal and the individual wavelength intensities were digitised at 40–100 Hz as appropriate, using a Data Translation 2801A computer card in a 120 MHz Pentium PC, using in-house software. Data are presented as mean values ± s.e.m, and n is the number of myocytes. Where necessary, statistical significance was determined using Student's t test (Microsoft Excel).
RESULTS
Figure 2A shows a recording of the 340 nm:380 nm fluorescence ratio from a saponin-permeabilised ventricular myocyte. The cell was initially perfused with a solution weakly buffered with 0.05 mm EGTA, at a free [Ca2+] of 260 nM, in the presence of 5 mm ATP. Under these conditions, cells typically exhibited regular spontaneous SR Ca2+ releases, resulting in transient increases in the Fura-2 fluorescence ratio. After a period of equilibration, [ATP] in the perfusing solution was decreased in a stepwise manner to 1 mm, 0.2 mm and 0.01 mm, while maintaining the free [Mg2+] at 1 mm. Decreasing [ATP] from 5 to 1 mm and then 0.2 mm resulted in a progressive decrease in the frequency of spontaneous Ca2+ release and an increase in the transient amplitude. However, a further reduction in [ATP] to 0.01 mm was associated with a slight fall in the amplitude of the Ca2+ transient, relative to that at 0.2 mm ATP, while the frequency again decreased. These effects were reversible, although in some experiments the recovery was not complete. Cells developed a maintained contracture at [ATP] below 100 μM (not shown), due to the formation of rigor cross-bridges and this may underlie the incomplete recovery in some cells.
Figure 2. Effect of cytosolic ATP on spontaneous CICR.

Representative records of the 340 nm/380 nm Fura-2 fluorescence ratio from a saponin-permeabilised ventricular myocyte perfused with a solution approximating to the intracellular milieu with a free [Ca2+] of 260 nM (see Methods for composition). In the presence of 5 mm ATP, transient increases in the fluorescence ratio occurred due to spontaneous SR Ca2+ release (A). Stepwise decreases in [ATP] to 1.0 mm (B) 0.2 mm (C) and 0.1 mm (not shown) produced corresponding decreases in the frequency of spontaneous release, while the amplitude of the response increased. At 0.01 mm ATP (D), the amplitude declined relative to that at 0.1 mm ATP, while the release frequency was further reduced.
Figure 3 shows accumulated data from seven preparations. The abscissa indicates [ATP] on a log scale and the ordinate indicates the frequency or amplitude of the CICR transient. As [ATP] decreased below 1 mm, the mean amplitude of the CICR transient increased progressively. In the presence of 0.1 mm ATP, the amplitude reached a maximum of 194.6 ± 25.5 % of the control response at 5 mm ATP. As [ATP] was reduced further, the mean amplitude declined slightly to 175.3 ± 18.29 %, n = 7. The spontaneous release frequency showed an approximately linear dependence on log10[ATP], decreasing by approximately 23.4 ± 5.24 % in the presence of 0.01 mm ATP.
Figure 3. Accumulated data: effects of ATP on spontaneous release frequency and amplitude.

The abscissa indicates [ATP] on a log scale and the ordinates indicate the frequency or amplitude of the spontaneous CICR transient. As [ATP] was decreased, the mean amplitude of the CICR transient increased to a maximum of 194.6 ± 25.5 % (mean ± s.e.m., n = 7) of the control response in the presence of 5 mm ATP. As the concentration was further reduced the mean amplitude declined slightly to 175.3 ± 18.29 % (mean ± s.e.m., n = 7). The frequency of the CICR showed an approximately linear dependence on log10[ATP], decreasing by 23.4 ± 5.24 % (mean ± s.e.m., n = 7) in the presence of 0.01 mm ATP.
Effects of ATP on the time course of spontaneous SR Ca2+ release
Normalised spontaneous Ca2+ transients obtained following equilibration at various [ATP] are shown in Fig. 4. Reducing [ATP] from 5 to 0.2 mm had little effect on the ascending or descending phases of the CICR transient. However, a further reduction in [ATP] to 0.01 mm was associated with marked prolongation of the descending phase and slowing of the ascending phase of the Ca2+ transient. The accumulated data (Fig. 4B) show the mean time for the transient to rise from 25 % to 100 % of the maximum value attained (TP75) or fall by 75 % of the peak level (DT75) at a range of [ATP]. It is apparent that the rise time is only prolonged at the lowest [ATP] tested, where the concentration was reduced from 0.1 mm to 10 μM. The falling phase of the Ca2+ transient was significantly prolonged at 0.2 and 0.1 mm ATP, although the effect was most prominent when [ATP] was reduced from 0.1 mm to 10 μM.
Figure 4. Effects of ATP on time course of spontaneous CICR fluorescence transient.

Superimposed spontaneous CICR transients at various [ATP] are shown superimposed on an expanded time scale (A). All transients were obtained from the same ventricular myocyte following equilibration at each [ATP]. The accumulated data (B) show the mean time for the CICR transient to rise from 25 % to 100 % of the maximum value (TP75) attained, or fall by 75 % of the peak level (DT75) at a range of [ATP] in 6 myocytes. Each point represents the mean ± s.e.m. (n = 6). Reducing the [ATP] to 0.2 or 0.1 mm caused a small but significant prolongation of the descending phase of the Ca2+ transient, without effect on the rising phase. At 0.01 mm ATP, the descending and ascending phases were both markedly prolonged. *P < 0.05, **P < 0.01, ***P < 0.005, ****P < 0.001.
Relationship between [ATP] and SR Ca2+ content
Decreasing the [ATP] to sub-millimolar levels might be expected to reduce the SR Ca2+ uptake rate. Therefore, it is possible that inhibition of the SR Ca2+ pump may contribute to the effects of [ATP] on spontaneous Ca2+ release. This could involve (i) a direct effect on the time course of the CICR transient, or (ii) an indirect effect on the amount of Ca2+ released due to changes in the SR Ca2+ content. The protocol shown in Fig. 5 was designed to investigate the relationship between [ATP] and SR Ca2+ content at the point of spontaneous release. Cells were initially equilibrated with solutions containing 260 nM Ca2+ and 5 mm ATP, until regular spontaneous Ca2+ release was observed. The frequency of release was then measured and a high concentration of caffeine (20 mm) rapidly applied when a spontaneous Ca2+ release would otherwise have occurred. The amplitude of the caffeine-induced fluorescence transient was used as an index of the SR Ca2+ content at the point of spontaneous release. This procedure was then repeated in the same cell following equilibration with 1, 0.1 and 0.01 mm ATP. Typically, the SR Ca2+ content increased to a maximum at about 0.1 mm ATP, and then decreased again slightly. Accumulated data showing the amplitude of the spontaneous (Fig. 5B) and caffeine-induced (Fig. 5C) Ca2+ transients at a range of [ATP] are also shown. In each graph, the mean amplitudes of the spontaneous or caffeine-induced Ca2+ transients are expressed relative to the mean response at 5 mm ATP. As [ATP] decreased from 5 to 1 mm and 0.1 mm, the amplitude of the caffeine-induced Ca2+ transient increased progressively to 152.8 ± 13 %. When [ATP] was reduced further from 0.1 to 0.01 mm, caffeine-induced Ca2+ release decreased slightly to 148.2 ± 13 %, although the maximum SR Ca2+ content, at the point of spontaneous release, was still greater than that under control conditions in the presence of 5 mm ATP.
Figure 5. SR Ca2+ content at the point of spontaneous Ca2+ release.
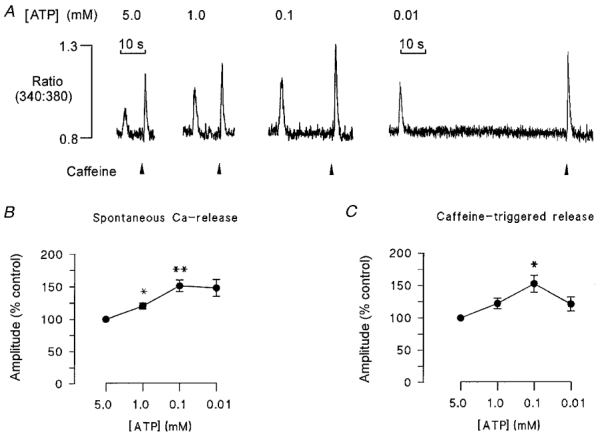
In the protocol shown in A, a ventricular myocyte was initially equilibrated with a solution containing 260 nM Ca2+ and 5 mm ATP, until regular spontaneous Ca2+ transients were observed. A high concentration of caffeine (20 mm) was then rapidly applied at the same point in time that a spontaneous Ca2+ release would otherwise have occurred. The amplitude of the caffeine-induced fluorescence transient was used as an index of the SR Ca2+ content at the point of spontaneous release. This process was repeated following equilibration at 1, 0.1 and 0.01 mm ATP in the same cell. Accumulated data from 8 cells is shown in B and C. [ATP] is indicated on the abscissa and the amplitude of the fluorescence transient expressed relative to the control caffeine-induced (C), or spontaneous (B) Ca2+ release obtained at 5 mm ATP (*P < 0.05, **P < 0.02, n = 8). The data show that the content at the point of spontaneous release increased as [ATP] decreased to 0.1 mm. The SR Ca2+ content declined slightly at 0.01 mm ATP, although still greater than under control conditions at 5 mm ATP. There was no significant difference in the relative amplitudes of caffeine and spontaneous transients at 10 μM ATP.
The experiments shown in Fig. 5 provide information regarding the maximum SR Ca2+ content that can be achieved at each [ATP] before spontaneous release occurs. However, the effects of ATP on the SR Ca2+ content were also studied when the duration of the SR Ca2+ loading period (i.e. the interval between caffeine applications) was constant. The aim of this series of experiments was to provide information regarding the ability of the SR to accumulate Ca2+ within a set period of time, at each [ATP]. Figure 6A shows a series of brief caffeine (20 mm) applications in a permeabilised myocyte at various [ATP]. The 10 s interval between caffeine applications was chosen because it corresponded approximately to the interval between spontaneous Ca2+ release in the presence of 5 mm ATP in this cell. However, once regular caffeine application was initiated, spontaneous release was not observed at any [ATP]. This is probably because the larger fractional release of Ca2+ prevented the SR content reaching the required threshold level. Reducing [ATP] to 1 or 0.1 mm resulted in an increase in the SR Ca2+ content. However, a marked decrease in content occurred when [ATP] was further reduced to 10 μM. The accumulated data (Fig. 6B) show that a significant increase in content to 114.7 ± 5.17 % of control levels occurred at 0.1 mm ATP. The decrease in content to 78.8 ± 7.3 % was also significant at 0.01 mm ATP, relative to responses obtained at 5 mm ATP.
Figure 6. SR Ca2+ content after a constant Ca2+ loading period.

A ventricular myocyte was briefly exposed to 20 mm caffeine at regular (10 s) intervals (A). Each application of caffeine resulted in a transient increase in the Fura-2 fluorescence ratio. The amplitude of the transient was used as an index of the SR Ca2+ content following each 10 s loading period. As [ATP] was reduced to 1 mm and then 0.1 mm, the amplitude of the transient increased progressively. However, when [ATP] was reduced to 10 μM (right), the amplitude decreased markedly, and a slight prolongation of the descending phase of the transient was apparent. The accumulated data (B) show that the increase in the amplitude of the fluorescence transient was significant at 0.1 mm ATP (*P < 0.5, n = 6). The reduction in amplitude at 0.01 mm ATP was also significant relative to the mean amplitude at 0.1 mm ATP (*P < 0.5, n = 6).
Comparison of SR Ca2+ pump inhibition and desensitisation of the Ca2+ release mechanism
Prolongation of the descending phase of the spontaneous Ca2+ transient (Fig. 4) may reflect inhibition of Ca2+ accumulation by the SR, due to the limited supply of substrate. However, the possible contribution of pump inhibition to the reduction in frequency or increase in amplitude is less clear. Therefore, cells were exposed to the Ca2+ pump inhibitor cyclopiazonic acid (CPA) to assess the effects of pump inhibition on spontaneous Ca2+ release. Figure 7 shows spontaneous Ca2+ release in a myocyte under control conditions and following exposure to 10 μM and 20 μM CPA. CPA decreased the spontaneous release frequency in a concentration-dependent manner. It is apparent from the normalised responses (lower right) that CPA also prolonged the descending phase of the Ca2+ transient The accumulated data show that CPA had no significant effect on the amplitude of the spontaneous Ca2+ transient, while the frequency was reduced to 49.5 ± 12 % and 18 ± 7 % of control levels at 10 and 20 μM CPA, respectively (Fig. 7B). Accumulated data showing the effects of CPA on the descending phase of the Ca2+ transient are also shown (Fig. 7C). These results suggest that pump inhibition may contribute to the decrease in frequency of spontaneous release when [ATP] is reduced, but not to the changes in amplitude. Similar results were obtained in six other preparations.
Figure 7. Effects of SR Ca2+ pump inhibition on spontaneous Ca2+ release.
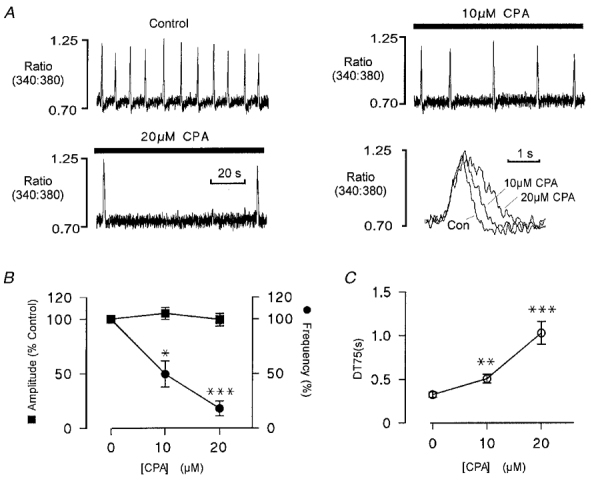
A, regular spontaneous SR Ca2+ release in a ventricular myocyte at a bathing [Ca2+] of 260 nM. Inhibition of the SR Ca2+ pump by introduction of 10 μM CPA resulted in a decrease in the frequency of spontaneous Ca2+ release without significant effect on the amplitude. Increasing [CPA] to 20 μM further reduced the frequency, with no apparent effect on the amplitude. Superimposed transients show that the descending phase of the response is markedly prolonged by pump inhibition, while the ascending phase is unaffected. [ATP] was maintained at 5 mm throughout. All responses were obtained from the same ventricular myocyte. B, accumulated data showing the change in the frequency and amplitude of spontaneous fluorescence transients in the presence of 10 and 20 μM CPA expressed as a percentage of the control level (n = 7). C, accumulated data showing the mean ( ± s.e.m.) change in the time taken for the transient to fall by 75 % of the peak level (DT75) (n = 7). In B and C:*P < 0.02, **P < 0.01, ***P < 0.001.
One possible explanation for the reduced rate of rise of the CICR transient observed at the lowest levels of ATP (Fig. 4) is a reduction in the sensitivity of the SR Ca2+ release mechanism. In order to investigate this possibility, the effects of tetracaine were studied. Tetracaine has been reported to decrease the opening probability of the SR Ca2+ channel (Xu et al. 1993) and to increase the amplitude of spontaneous Ca2+ transients in intact myocytes (Overend et al. 1997). As shown in Fig. 8, introduction of 30 μM tetracaine decreased the frequency of spontaneous Ca2+ release and increased the amplitude (Fig. 8B). Increasing the tetracaine concentration to 0.2 mm was associated with a further decrease in frequency and increase in amplitude of the spontaneous Ca2+ transient (Fig. 8C). The superimposed normalised responses (Fig. 8D) show that 30 μM tetracaine had no apparent effect on the time course of the spontaneous Ca2+ transients. However, at 200 μM tetracaine, the rising and falling phases were both slightly prolonged. Prolongation of the rising phase may be consistent with desensitisation of the SR Ca2+ release mechanism. However, slowing of the descending phase was unexpected and suggests that tetracaine may also influence the rate of SR Ca2+ uptake.
Figure 8. Effects of tetracaine on spontaneous CICR.

A, regular spontaneous SR Ca2+ release in a ventricular myocyte at a bathing [Ca2+] of 260 nM. B, introduction of 30 μM tetracaine resulted in a decrease in the frequency of spontaneous Ca2+ release and an increase in amplitude. C, further increase in the tetracaine concentration to 0.2 mm was associated with a further decrease in frequency and an increase in amplitude of the spontaneous Ca2+ transient. D, superimposed normalised responses on an expanded time scale show that 30 μM tetracaine had no apparent effect on the time course of the spontaneous Ca2+ transients. However, at 200 μM tetracaine, the rising and falling phases were both slightly prolonged. All responses are from the same permeabilised myocyte. In D, normalised responses are averaged from 4 steady-state transients at each tetracaine concentration.
Accumulated data showing the effects of a range of tetracaine concentrations on the amplitude and frequency of the spontaneous Ca2+ transients are shown in Fig. 9A. Increasing the tetracaine concentration from 10 μM to 200 μM increased the amplitude of the Ca2+ transient to 148 ± 13 % and decreased the release frequency to 49 ± 4.3 % of the control values. Figure 9B shows that the descending phase of the Ca2+ transient was not significantly affected by tetracaine at levels below 75 μM. At higher concentrations, tetracaine significantly prolonged the descending phase. At concentrations lower than 100 nM, tetracaine had no significant effect on the rising phase of the spontaneous Ca2+ transient. However, at 100 nM and 200 nM tetracaine significantly prolonged the rising phase of the transient.
Figure 9. Effects of tetracaine on spontaneous Ca2+ release: accumulated data.

A, accumulated data showing the effects of increasing levels of tetracaine on the amplitude and frequency of spontaneous Ca2+ release. B, accumulated data showing the influence of tetracaine on the time taken for the transient to fall by 75 % of the peak level (DT75), or rise from 25 % to 100 % of the maximum value (TP75). At >75 μM tetracaine, the DT50 was significantly greater than control responses in the absence of tetracaine. At >100 μM tetracaine, TP75 was significantly greater than control responses in the absence of tetracaine (*P < 0.05, **P < 0.02, ***P < 0.01; n = 7).
Effects of ATP on CICR triggered by flash photolysis of Nitr-5
Figure 10 shows the typical effect of ATP on CICR triggered by flash photolysis of Nitr-5 (100 μM), replacing EGTA in the solution. In these experiments, 2 μM Fluo-3 was used instead of Fura-2. Each flash resulted in a step increase in [Ca2+] from 280 nM to about 410 nM, which then declined to baseline levels as fresh solution entered the bath. On this time scale, the step increase in [Ca2+] is obscured by the initial transient increase in the signal which occurs due to some excitation light reaching the photomultiplier. The decline in [Ca2+] after the flash can be seen where triggered release was delayed or absent (e.g. Fig. 10B). In the presence of 5 mm ATP, Ca2+ release appeared coincident with the rise in [Ca2+] following flash photolysis of Nitr-5. However, as [ATP] was reduced to 2.5 mm, a significant delay occurred between the flash and the Ca2+ release. The Ca2+ transient became increasingly dissociated from the trigger flash as [ATP] was further reduced and at 0.2 mm ATP, release failed completely in this cell. It seems likely that the Ca2+ release observed after a significant delay (i.e. at 2.5, 1 and 0.5 mm ATP) actually reflects spontaneous release due to an increase in the SR Ca2+ content, caused partly by the rise in [Ca2+] associated with flash photolysis of Nitr-5. Qualitatively similar results were obtained in five other cells, some variation between cells in the response to decreasing [ATP] was apparent.
Figure 10. Typical effects of ATP on CICR triggered by flash photolysis of Nitr-5.

Steady state CICR responses obtained from a permeabilised ventricular myocyte following flash photolysis of Nitr-5 at 10 s intervals in the presence of 5 mm (A), 2.5 mm (B), 1 mm (C), 0.5 mm (D) and 0.2 mm ATP (E). In this experiment, 2 μM Fluo-3 was used instead of Fura-2 and 100 μM Nitr-5 replaced EGTA in the solution. Each flash resulted in a step increase in [Ca2+] from 280 nM to about 410 nM, which then declined to baseline levels as the fresh solution entered the bath. On this time scale, the step increase in [Ca2+] is obscured by the initial transient increase in the signal which occurs as an artefact of some excitation light reaching the photomultiplier. The slower decline in [Ca2+] after the flash is apparent where triggered release was delayed or absent. A decrease in [ATP] resulted in progressive dissociation between flash and the subsequent CICR transient. All responses are from the same ventricular myocyte at a bathing [Ca2+] of 280 nM.
In some cells, a different pattern of response was seen. In Fig. 11, a cell was again exposed to 5 mm ATP and a series of CICR transients were initiated by photolysis of Nitr-5, in this case at 6 s intervals. Reduction in [ATP] from 5 mm to 0.2 mm markedly increased the delay between the flash and the subsequent Ca2+ release, although release was not abolished in this cell. A further reduction to 0.1 mm resulted in failure of every second triggered release. Where release failed, the brief flash artefact, followed by the step rise in [Ca2+] associated with the photolysis of Nitr-5, can be seen before the signal declined to baseline levels as the bath solution was refreshed.
Figure 11. SR Ca2+ release ‘alternans’ in permeabilised myocyte.

Steady-state CICR responses obtained from a permeabilised ventricular myocyte following flash photolysis of Nitr-5 at 10 s intervals in the presence of 5 mm (A), 0.2 mm (B) and 0.1 mm ATP (C). Flash photolysis of Nitr-5 was induced at 6 s intervals and all responses were obtained from the same myocyte. Reduction in [ATP] from 5 mm to 0.2 mm resulted in a markedly increased delay between the flash and the subsequent Ca2+ transient. In this cell, a further reduction to 0.1 mm resulted in complete failure of every second release. In examples where release failed, the spike artefact, followed by the step rise in [Ca2+] associated with the photolysis of Nitr-5, can clearly be seen, before the signal declined to baseline levels, as the bath solution is refreshed.
Release triggered in the presence of AMP-PNP
Release triggered by flash photolysis of Nitr-5 before and after replacement of 5 mm ATP with the non-hydrolysable analogue AMP-PNP is shown in Fig. 12. In Fig. 12A, the cell was bathed in a solution containing 280 mm Ca2+. In the absence of repeated flash photolysis of Nitr-5, spontaneous Ca2+ release occurred (SP). On initiation of flash photolysis of Nitr-5 at regular intervals, triggered CICR responses were initiated and spontaneous Ca2+ release was abolished. The same cell is shown in Fig. 12B, following substitution of the non-hydrolysable analogue AMP-PNP for ATP. As expected, substitution with AMP-PNP was followed by abolition of spontaneous Ca2+ release. However, subsequent flash photolysis of Nitr-5 initiated a Ca2+ release of similar amplitude, but with a markedly prolonged descending phase. Prolongation of the descending phase is consistent with abolition of Ca2+ uptake as AMP-PNP does not support the activity of the SR Ca2+ pump. Subsequent flashes failed to trigger release and only the rise in [Ca2+] associated with photolysis was apparent. Similar results were seen in six other cells under these conditions.
Figure 12. Release triggered in the presence of AMP-PNP.

Responses obtained from a permeabilised ventricular myocyte following flash photolysis of Nitr-5. A, the preparation was bathed in a solution containing 280 mm Ca2+. In the absence of repeated flash photolysis of Nitr-5, spontaneous Ca2+ release was apparent (SP). Triggered CICR responses occurred on flash photolysis of Nitr-5 at regular intervals and spontaneous Ca2+ release was abolished. B, following complete substitution of 5 mm AMP-PNP for 5 mm ATP, the cyclic uptake and spontaneous release of Ca2+ was abolished. The first flash triggered a release of Ca2+ with a markedly prolonged descending phase. Subsequent flashes failed to trigger release and only the rise in [Ca2+] associated with photolysis of Nitr-5 was apparent. All responses were obtained from the same permeabilised cell. Similar results were obtained in 6 other cells.
In these experiments, changing to 5 mm AMP-PNP from 5 mm ATP resulted in cells shortening to 54.8 ± 3.9 % (n = 4) of the control level. Changing from 5 mm ATP to 0.1 mm ATP resulted in a similar degree of cell shortening (50.3 ± 12.4 %, n = 4). This suggests that reducing [ATP] to 0.1 mm, or complete substitution with 5 mm AMP-PNP both result in the formation of nucleotide-free rigor cross-bridges. However, after complete substitution with AMP-PNP it was only possible to produce one response to flash photolysis or caffeine application (not shown). Further attempts to release Ca2+ always failed, no matter how long a loading period was allowed. This suggests that Ca2+ re-uptake by the SR is effectively abolished in the presence of 5 mm AMP-PNP, whereas at 0.1 mm ATP cyclical uptake and release of Ca2+ is maintained (e.g. Fig. 4).
DISCUSSION
The CICR mechanism was first characterised in ‘mechanically skinned’ cardiac cells (Fabiato & Fabiato, 1975). It was found that CICR could be triggered by a rapid increase in [Ca2+] at the surface of the SR (Fabiato, 1985a). The amount of Ca2+ released was dependent upon both the magnitude and rate of change of [Ca2+]: a larger or more rapid rise in the trigger [Ca2+] increased the amount of Ca2+ released. Subsequent work using a variety of methods confirmed that Ca2+ entry during the action potential is the physiological trigger for SR Ca2+ release in intact cardiac cells. For example: (i) flash photolysis of caged Ca2+ (Nitr-5 or DM-nitrophen) can induce contraction by triggering CICR from the SR (Valdeolmillos et al. 1989; Nabauer & Morad, 1990); (ii) removal of extracellular Ca2+ rapidly abolishes contractile activity, even when the Ca2+ content of the SR is maintained (Valdeolmillos et al. 1988); (iii) the amplitude of the intracellular Ca2+ transient is related to the magnitude of the L-type Ca2+ current (ICa), but independent of the membrane voltage (Beuckelmann & Wier, 1988; Nabauer et al. 1989). While recent work has questioned the possibility that voltage-dependent SR Ca2+ release may occur under some specific conditions (Hobai et al. 1997), it is generally accepted that CICR is the primary release mechanism in cardiac muscle.
Spontaneous Ca2+ release occurs when the cytosolic [Ca2+] is elevated above normal diastolic levels and is, therefore, assumed to be symptomatic of SR Ca2+ overload. In early studies on skinned cardiac cells, qualitative differences between spontaneous and triggered CICR were reported. For example, it was found that a rapid increase in [Ca2+] during the ascending phase of a spontaneous Ca2+ transient induced further Ca2+ release, while increasing the [Ca2+] during the rising phase of CICR triggered in a quiescent cell inactivated the release process (Fabiato, 1985b). It was suggested that spontaneous release and the ‘physiologically’ triggered CICR process may involve fundamentally different mechanisms. However, few subsequent studies have directly addressed this issue and the relationship between spontaneous and triggered CICR remains poorly understood.
Relationship between [ATP] and SR Ca2+ uptake, content and leak
Before addressing the effects of ATP on the SR Ca2+ release mechanism, it is necessary to consider how the substrate concentration may influence the activity of the Ca2+ pump and the SR Ca2+ content. In the experiments shown in Fig. 6, caffeine was applied at regular intervals at a range of [ATP]. The interval between caffeine application (10 s) was chosen because it was approximately the same as the average time between spontaneous release in the presence of 5 mm ATP. Under these conditions, a change in the amplitude of the caffeine-induced Ca2+ transient is assumed to reflect a change in net Ca2+ uptake (i.e. Ca2+ uptake minus Ca2+ efflux) during the period between caffeine applications. Interestingly, the SR Ca2+ content increased as [ATP] was reduced to 100 μM. It seems unlikely that the SR Ca2+ uptake rate is increased under these conditions. Indeed, the descending phase of the spontaneous Ca2+ transient was prolonged, when [ATP] was decreased to 100 μM, consistent with a slight inhibition of SR Ca2+ uptake (Fig. 4). This suggests that the increase in SR content is more likely to reflect a decrease in efflux via the Ca2+ leak pathway. This could be explained if the resting Ca2+ leak is partly determined by ATP-dependent activation of the SR Ca2+ channel under these conditions. Consistent with this possibility, experiments on frog skeletal muscle have shown that reducing the cytosolic [ATP] decreases the frequency of spontaneous localised SR Ca2+ release events or ‘Ca2+ sparks’ which must contribute to any resting Ca2+ leak (Lacampagne et al. 1998).
When [ATP] was further reduced to 10 μM, the SR content achieved within a fixed second loading period fell markedly (Fig. 6). At this level of ATP, the descending phase of the spontaneous and caffeine-induced Ca2+ transient was also prolonged (Figs 4 and 6) suggesting that the rate of net Ca2+ accumulation is substrate limited in the presence of 10 μM ATP. However, when the loading period was extended until spontaneous release occurred, the SR Ca2+ content was as high, or higher than in the presence of 5 mm ATP (Fig. 5). This suggests that the balance between Ca2+ uptake and efflux was altered such that the maximum Ca2+ capacity of the SR was increased.
Effects of SR Ca2+ release sensitivity on spontaneous CICR
Decreasing the [ATP] below 1 mm was associated with a marked increase in the amplitude of spontaneous Ca2+ transients and a decrease in the release frequency (Fig. 3). The amplitude reached a maximum at 0.1 mm ATP and then declined slightly as [ATP] was reduced further to 50 μM and then 10 μM. Experiments involving rapid application of caffeine showed that the maximum SR Ca2+ content achieved at the point of spontaneous Ca2+ release also increased in a concentration-dependent manner as [ATP] was reduced from 1 mm to 100 μM (Fig. 5). The Ca2+ content then reached a peak and declined slightly at 10 μM ATP. This suggests that changes in the amplitude of spontaneous Ca2+ transients largely reflect changes in SR Ca2+ content. This may be explained if the SR Ca2+ release mechanism is desensitised due to the fall in [ATP], which in turn allows the SR Ca2+ content to reach a higher level before spontaneous release occurs. This possibility is supported by several factors. First, in isolated SR Ca2+ channels or membrane vesicles, ATP is known to bind to a specific regulatory site on the SR Ca2+ channel and facilitate activation by Ca2+ (Rousseau et al. 1986; McGarry & Williams, 1994). This action does not appear to involve phosphorylation and can be mimicked by non-hydrolysable analogues. Second, experiments on intact myocytes have shown that tetracaine, which is known to reduce the opening probability of the SR Ca2+ channel, increases the amplitude of spontaneous CICR, decreases the release frequency and increases the SR content (Overend et al. 1997). In the present study on permeabilised cells, it was also found that tetracaine increased spontaneous CICR and reduced the frequency (Fig. 8).
At the lowest [ATP] studied (10 μM), a significant reduction in the rate of rise of the spontaneous Ca2+ transients occurred (Fig. 4). This may be explained if spontaneous release originates from a localised point within the myocyte and then propagates across the cell as a wave (Cheng et al. 1996). Desensitisation of the Ca2+ release mechanism at the lowest [ATP] may slow propagation and reduce the rate of rise of [Ca2+] when measured as the spatially averaged Ca2+ transient. In support of this interpretation, the rising phase of the Ca2+ transient was also slowed by levels of tetracaine greater than or equal to 100 μM (Fig. 9B).
One potential difficulty, however, in comparing the effects of tetracaine and results obtained at the lowest levels of ATP is that resting cell length decreases due to the formation of rigor cross-bridges. Such maintained cell shortening may have an effect on the time course of the spontaneous Ca2+ transient by influencing the propagation of Ca2+ waves across the cell. However, several lines of evidence suggest that maintained shortening at low levels of ATP does not have major effects on the characteristics of spontaneous Ca2+ transients: (i) there is no apparent effect on the rate of rise of the Ca2+ transient when [ATP] is reduced to 0.1 mm (Fig. 4B), despite the fact that maintained cell shortening occurs at this level of ATP; and (ii) in some cells exposed to AMP-PNP, tonic cell shortening did not reverse immediately (within 3–5 min) on reintroduction of 5 mm ATP. However, the frequency, amplitude and time course of the Ca2+ transient rapidly returned to control levels (not shown). This suggests that the effects of lowering ATP on the spontaneous Ca2+ release transient are largely unrelated to resting cell length.
Unexpectedly, high levels of tetracaine (≥75 μM) also prolonged the descending phase of the spontaneous Ca2+ transient (Figs 8D and 9B). The reason for prolongation of the Ca2+ transient is uncertain, but it may reflect an additional inhibitory effect on the SR Ca2+ pump. Further studies using image analysis or confocal microscopy are needed to characterise the possible influence of ATP on Ca2+ sparks and release propagation in cardiac muscle.
Effects of SR Ca2+ pump inhibition on spontaneous CICR
Introduction of the SR Ca2+ pump inhibitor CPA decreased the frequency of spontaneous release without affecting the amplitude of the fluorescence transient. The rising phase of the CICR transient was not significantly affected by CPA, suggesting that re-uptake of Ca2+ by the SR does not have a major influence on the rate of rise of [Ca2+] within the cell. However, the descending phase was markedly prolonged by CPA, confirming that (as in intact cells) SR Ca2+ uptake contributes to removal of Ca2+ from the cytosol following release. The fact that CPA reduced the frequency of spontaneous release, without affecting the amplitude, suggests that release occurs when the SR content reaches a threshold level and that pump inhibition simply increases the time taken to achieve this threshold level.
Reducing the [ATP] from 5 to 0.1 mm had little effect on the descending phase of the spontaneous Ca2+ transient, suggesting that over this range, ATP does not have major effects on SR Ca2+ uptake (Fig. 4). When [ATP] was further reduced to 10 μM, the Ca2+ transient was markedly prolonged, consistent with impaired SR Ca2+ uptake. These results are consistent with data suggesting that Kd of the SR Ca2+ pump for ATP is in the micromolar range (Bers, 1991). Together with the data on CPA, these experiments also suggest that at low [ATP] (<100 μM) pump inhibition may contribute to the decrease in spontaneous release frequency, but not to changes in amplitude.
Characteristics of Ca2+ release triggered by photolysis of Nitr-5 in permeabilised myocytes
Before addressing the effects of ATP on Ca2+ release triggered by Nitr-5 photolysis it is necessary to consider the characteristics of this release process and relevance of the experimental model to intact cells. One important consideration is the possibility that (under control conditions) release following photolysis of Nitr-5 is an indirect consequence of Ca2+ uptake by the SR, followed by spontaneous Ca2+ release. This seems unlikely because (i) in the presence of 5 mm ATP there is a close temporal relationship between the flash and the subsequent Ca2+ transient, (ii) release could be triggered in quiescent cells (not shown) at lower [Ca2+], and (iii) reducing the [ATP] to 2.5 mm had no apparent effect on spontaneous Ca2+ release (Fig. 3), while triggered release was markedly influenced (Fig. 10). This suggests that photolysis-induced Ca2+ release is qualitatively different to spontaneous Ca2+ release. However, direct evidence that release is triggered by the rise in [Ca2+] following photolysis of Nitr-5 is provided by the observation that Ca2+ release can be initiated following complete replacement of ATP with the non-hydrolysable analogue AMP-PNP (Fig. 11). This compound is known to substitute for ATP at the SR Ca2+ channel (e.g. Laver et al. 1995) but does not support the activity of the Ca2+-ATPase. Changing from a solution containing 5 mm ATP to one containing 5 mm AMP-PNP resulted in the abolition of spontaneous Ca2+ release. Thereafter, flash photolysis of Nitr-5 produced a Ca2+ transient of similar amplitude to that observed in the presence of 5 mm ATP. In these experiments, the rising phase of the transient was not significantly delayed, consistent with previous findings that AMP-PNP substitutes for ATP at the SR Ca2+ channel. However, the descending phase of the Ca2+ transient was markedly prolonged. This is expected as SR Ca2+ uptake is abolished in the presence of the non-hydrolysable ATP. In these circumstances, the descending phase of the transient will reflect diffusion of Ca2+ out of the myocyte. Consistent with this interpretation, only one triggered release could be initiated following AMP-PNP substitution as re-loading of SR could not occur. The ability to induce Ca2+ release in the presence of AMP-PNP strongly suggests that release is directly triggered by the brief rise in Ca2+ and does not require Ca2+ uptake. Importantly, it also suggests that the effects of ATP on Ca2+ release are due to a direct action on the SR Ca2+ channel, rather than an indirect action via phosphorylation, or a metabolite of ATP.
Another aspect that merits consideration is that the time to peak of the triggered CICR transient was slower than the Ca2+ transient in intact cells at room temperature, but similar to that previously reported in skinned cardiac trabeculae using Nitr-5 photolysis (Xiang & Kentish, 1995). It has not yet been established why release is slower in skinned cells. It is possible that slower release may reflect loss of an endogenous modulator of channel function. Alternatively, it may reflect the fact that the trigger for Ca2+ release induced by flash photolysis of Nitr-5 is sub-optimal, resulting in failure to activate ‘low sensitivity’ ryanodine receptors (for discussion see Niggli, 1999). Another possibility is that the slower rising phase may simply reflect Ca2+ buffering by uncleaved Nitr-5. While the apparent difference in time course must be borne in mind, comparison with the large spontaneous Ca2+ transients suggests that photolysis of Nitr-5 does release a significant amount of Ca2+ from the SR. While there must be some uncertainty regarding this matter, the remainder of this discussion will assume that release induced by photolysis of Nitr-5 is otherwise qualitatively similar to that occurring in intact cells.
Comparative effects of cytosolic ATP on spontaneous and triggered CICR
In this study, reducing the [ATP] delayed the onset of spontaneous release, while the amount of Ca2+ released was generally increased. If cytosolic ATP facilitates the spontaneous release mechanism, then a decrease in amplitude or a slowing of spontaneous release might have been expected. However, the rising phase of the Ca2+ transient was only slightly prolonged at the lowest levels of ATP tested (10 μM). This suggests that (i) the primary effect of ATP on spontaneous release is an increase in the threshold luminal [Ca2+] at which release occurs, and (ii) once initiated, the spontaneous release process is relatively insensitive to cytosolic [ATP]. In contrast, a decrease in [ATP] to 2.5 mm had clear effects on the SR Ca2+ release process when triggered by Nitr-5 photolysis, i.e. the onset of release was delayed and the rate of rise of [Ca2+] slowed (Fig. 10). A further reduction to 1 mm and 0.5 mm ATP resulted in a progressive temporal dissociation between the trigger (induced by photolysis of Nitr-5) and the transient. Indeed, it seems likely that below 2.5 mm ATP, the Ca2+ transient resulted from spontaneous release, due partly to loading of the SR by the trigger pulse.
When comparing spontaneous and triggered CICR, it is important to consider the conditions under which each occurred. Triggered release was generally induced at a bathing [Ca2+] that produced spontaneous CICR. In the presence of 5 mm ATP, the flash-induced trigger was applied at regular intervals and before the spontaneous release would have occurred. Hence, repeated photolysis of Nitr-5 prevented spontaneous release, because the SR content was close to, but below the threshold required for, spontaneous release. In these experiments, the flash interval remained constant when [ATP] was reduced. However, as shown in Figs 5 and 6, the SR Ca2+ content actually increased as [ATP] was reduced progressively to 100 μM. Therefore, disruption of the triggered release process at or below 2.5 mm ATP cannot be a secondary consequence of reduced SR content. In some preparations, however, when the flash-induced Ca2+ trigger failed to release Ca2+, or induced a smaller Ca2+ release at reduced levels of ATP, the following flash triggered a large response (Fig. 11). This presumably reflected the fact that the SR Ca2+-loading period was effectively doubled under these conditions. This phenomenon is strikingly similar to contraction ‘alternans’ commonly seen in intact cells, when metabolically impaired or Ca2+ overloaded (see Bers, 1991).
Mechanism underlying spontaneous SR Ca2+ release and the possible role of luminal Ca2+ regulation
While the mechanism underlying spontaneous Ca2+ release remains uncertain, it appears to occur when a threshold SR Ca2+ content is reached. Evidence of a direct effect of luminal [Ca2+] on the SR Ca2+ channel has been provided by experiments on isolated skeletal and cardiac SR Ca2+ channels incorporated into lipid bilayers (Sitsapesan & Williams, 1994; Lukyanenko et al. 1996). Experiments on intact preparations have also provided evidence of regulation of the release process by SR luminal Ca2+. Bassani et al. (1995) investigated the effects of SR Ca2+ load on the fraction of total SR Ca2+ released by ICa in ferret ventricular cells. It was found that as the SR approached maximum capacity (90–100 %), the fractional release increased markedly. Bassani and colleagues concluded that the free or total SR [Ca2+] may regulate the sensitivity of the SR Ca2+ channels to ICa, thereby altering the number of activated ‘release units’ during each twitch.
The effect of luminal Ca2+ on the sensitivity of the SR Ca2+ release mechanism may explain some of the results obtained in this study. For example, if the gain of the CICR mechanism increases disproportionally as the SR content approaches the maximum level, then spontaneous and triggered Ca2+ release might be expected to have different properties. Spontaneous release may occur when increasing sensitivity of the SR Ca2+ channel (due to rising luminal [Ca2+]) results in activation of a localised cluster of channels. As the sensitivity of the CICR mechanism is high, release propagates across the cell, producing a Ca2+ wave. However, the luminal threshold for Ca2+ release also depends on a number of cytosolic factors. Decreasing the [ATP] will reduce the sensitivity of the release mechanism to activation by Ca2+, and a higher luminal [Ca2+] must then be reached before the sensitivity is restored to the level needed for spontaneous release and propagation to occur. This may explain why the maximum SR Ca2+ content at the point of spontaneous release increases as [ATP] decreases to 100 μM (Fig. 5).
The influence of luminal Ca2+ on the SR Ca2+ release mechanism may also explain why release triggered by photolysis of Nitr-5 is influenced by reductions in [ATP] that have little effect on spontaneous release (Fig. 10). When the SR content is only slightly below that required for spontaneous release, the gain of the system may be disproportionately lower and determined mainly by cytosolic factors. In this case, in the absence of positive feedback via the proposed luminal [Ca2+] sensor, a smaller reduction in [ATP] may be sufficient to raise the minimum rise in [Ca2+] required for CICR above that produced by photolysis of Nitr-5.
Possible relevance to ATP depletion in hypoxia or ischaemia
The present results suggest that reduced levels of cytosolic [ATP] will tend to increase the maximum Ca2+ capacity of the SR (i) by reducing the resting leak of Ca2+ from the SR and (ii) by desensitising the SR Ca2+ channel to Ca2+ activation, thereby allowing the SR to achieve a higher content before spontaneous release occurs. However, when spontaneous release occurs at reduced levels of ATP, the amount of Ca2+ released will be greater than in the presence of normal cytosolic levels (5–8 mm). Once initiated, spontaneous release appears to be relatively insensitive to modification by cytosolic factors such as ATP. The data also suggest that smaller reductions in [ATP] may inhibit the ‘physiologically’ triggered CICR mechanism under these conditions. However, several factors must be taken into consideration when considering the relevance of these data to intact, metabolically impaired cells. Changes in pH, Pi and CrP will also influence Ca2+ regulation in these circumstances (Orchard & Kentish, 1990; Smith & Steele, 1992; Steele et al. 1995). Furthermore, a similar quantitative relationship between [ATP] and triggered CICR cannot be assumed in intact cells, as photolysis of Nitr-5 may not be as effective at triggering release as the localised increase in [Ca2+] in the vicinity of the SR Ca2+ channel, which occurs as a consequence of Ca2+ influx during the action potential.
Summary
The increase in the amplitude of spontaneous CICR and the decrease in the frequency which occurs as [ATP] is reduced from 1 mm to 100 μM, is predominantly due to desensitisation of the SR Ca2+ release mechanism, which allows the SR Ca2+ content to reach a higher level before spontaneous release occurs. At very low [ATP], a reduction in the SR Ca2+ uptake rate may also contribute to the decrease in release frequency. CICR triggered by photolysis of Nitr-5 at regular intervals appeared to be more sensitive to [ATP], with evidence of release failure when [ATP] was reduced from 5 mm to around 2 mm.
Acknowledgments
Financial support from the British Heart Foundation and the Wellcome Trust is acknowledged. We thank Professor C. H. Orchard and Mr A. M. Duke for helpful discussions during the course of this project.
References
- Allen DG, Orchard CH. Myocardial contractile function during ischaemia and hypoxia. Circulation Research. 1987;60:153–168. doi: 10.1161/01.res.60.2.153. [DOI] [PubMed] [Google Scholar]
- Bassani JWM, Yuan WL, Bers DM. Fractional SR Ca2+ release is regulated by trigger Ca2+ and SR Ca2+ content in cardiac myocytes. American Journal of Physiology. 1995;37:C1313–1319. doi: 10.1152/ajpcell.1995.268.5.C1313. [DOI] [PubMed] [Google Scholar]
- Bers DM. Excitation Contraction Coupling and Cardiac Contractile Force. The Netherlands: Kluwer Academic Publishers; 1991. [Google Scholar]
- Beuckelmann DJ, Wier WG. Mechanism of calcium release from sarcoplasmic reticulum of guinea-pig cardiac cells. The Journal of Physiology. 1988;405:233–255. doi: 10.1113/jphysiol.1988.sp017331. [DOI] [PMC free article] [PubMed] [Google Scholar]
- Cheng H, Lederer MR, Lederer WJ, Cannell MB. Ca2+ sparks and [Ca2+]i waves in cardiac myocytes. American Journal of Physiology. 1996;39:C148–159. doi: 10.1152/ajpcell.1996.270.1.C148. [DOI] [PubMed] [Google Scholar]
- Duke AM, Steele DS. Effects of caffeine and adenine nucleotides on Ca2+ release by the sarcoplasmic reticulum in saponin-permeabilized frog skeletal muscle fibres. The Journal of Physiology. 1998a;513:43–53. doi: 10.1111/j.1469-7793.1998.043by.x. [DOI] [PMC free article] [PubMed] [Google Scholar]
- Duke AM, Steele DS. Effects of cyclopiazonic acid on Ca2+ regulation by the sarcoplasmic reticulum in saponin-permeabilized skeletal muscle fibres. Pflügers Archiv. 1998b;436:104–111. doi: 10.1007/s004240050610. [DOI] [PubMed] [Google Scholar]
- Duncan L, Burton FL, Smith GL. REACT: Calculation of free metal and ligand concentrations using a Windows-based computer program. The Journal of Physiology. 1999;517.P:2. P. [Google Scholar]
- Fabiato A. Simulated calcium current can both cause Ca2+ loading in and trigger calcium release from the sarcoplasmic reticulum of a skinned canine cardiac Purkinje cell. Journal of General Physiology. 1985a;85:291–320. doi: 10.1085/jgp.85.2.291. [DOI] [PMC free article] [PubMed] [Google Scholar]
- Fabiato A. Rapid ionic modifications during the aequorin-detected calcium transient in a skinned canine cardiac Purkinje cell. Journal of General Physiology. 1985b;85:189–246. doi: 10.1085/jgp.85.2.189. [DOI] [PMC free article] [PubMed] [Google Scholar]
- Fabiato A, Fabiato F. Contractions induced by a calcium-triggered release of calcium from the sarcoplasmic reticulum of single skinned cardiac cells. The Journal of Physiology. 1975;249:469–495. doi: 10.1113/jphysiol.1975.sp011026. [DOI] [PMC free article] [PubMed] [Google Scholar]
- Fabiato A, Fabiato F. Calculator programs for computing the composition of the solutions containing multiple metals and ligands used for experiments in skinned muscle cells. Journal de Physiologie. 1979;75:463–505. [PubMed] [Google Scholar]
- Gurney AM. Flash photolysis of caged compounds. In: Ogden D, editor. Microelectrode Techniques. Cambridge: The Company of Biologists Limited; 1994. pp. 389–406. [Google Scholar]
- Hobai IA, Howarth FC, Pabbathi VK, Dalton GR, Hancox JC, Zhu JQ, Howlett SE, Ferrier GR, Levi AJ. “Voltage-activated Ca2+ release” in rabbit, rat and guinea-pig cardiac myocytes, and modulation by internal cAMP. Pflügers Archiv. 1997;435:164–173. doi: 10.1007/s004240050496. [DOI] [PubMed] [Google Scholar]
- Kawai M, Hussain M, Orchard CH. Cs+ inhibits spontaneous Ca2+ release from the sarcoplasmic reticulum of skinned cardiac myocytes. American Journal of Physiology. 1998;275:H422–430. doi: 10.1152/ajpheart.1998.275.2.H422. [DOI] [PubMed] [Google Scholar]
- Lacampagne A, Klein MG, Schneider MF. Modulation of the frequency of spontaneous sarcoplasmic reticulum Ca2+ release events (Ca2+ sparks) by myoplasmic [Mg2+] in frog skeletal muscle. Journal of General Physiology. 1998;111:207–224. doi: 10.1085/jgp.111.2.207. [DOI] [PMC free article] [PubMed] [Google Scholar]
- Laver DR, Roden LD, Ahern GP, Eager KR, Junankar PR, Dulhunty AF. Cytoplasmic Ca2+ inhibits the ryanodine receptor from cardiac muscle. Journal of Membrane Biology. 1995;147:7–22. doi: 10.1007/BF00235394. [DOI] [PubMed] [Google Scholar]
- Lukyanenko V, Gyorke I, Gyorke S. Regulation of Ca2+ release by calcium inside the sarcoplasmic reticulum in ventricular myocytes. Pflügers Archiv. 1996;432:1047–1054. doi: 10.1007/s004240050233. [DOI] [PubMed] [Google Scholar]
- McGarry SJ, Williams AJ. Adenosine discriminates between the caffeine and adenine-nucleotide sites on the sheep cardiac sarcoplasmic-reticulum calcium-release channel. Journal of Membrane Biology. 1994;137:169–177. doi: 10.1007/BF00233486. [DOI] [PubMed] [Google Scholar]
- Meissner G, Henderson JS. Rapid calcium release from cardiac sarcoplasmic reticulum vesicles is dependent on Ca2+ and is modulated by Mg2+, adenine nucleotide, and calmodulin. Journal of Biological Chemistry. 1987;262:3065–3073. [PubMed] [Google Scholar]
- Miller DJ, Smith GL. EGTA purity and the buffering of calcium ions in physiological solutions. American Journal of Physiology. 1984;246:C160–166. doi: 10.1152/ajpcell.1984.246.1.C160. [DOI] [PubMed] [Google Scholar]
- Nabauer M, Callewaert G, Cleemann L, Morad M. Regulation of Ca2+ release is gated by Ca2+ current, not gating charge in cardiac myocytes. Science. 1989;244:800–803. doi: 10.1126/science.2543067. [DOI] [PubMed] [Google Scholar]
- Nabauer M, Morad M. Ca2+-induced Ca2+ release as examined by photolysis of caged Ca2+ in single ventricular myocytes. American Journal of Physiology. 1990;258:C189–193. doi: 10.1152/ajpcell.1990.258.1.C189. [DOI] [PubMed] [Google Scholar]
- Nichols CG, Lederer WJ. The role of ATP in energy-deprivation contractures in unloaded rat ventricular myocytes. Canadian The Journal of Physiology. 1990;68:183–194. doi: 10.1139/y90-029. [DOI] [PubMed] [Google Scholar]
- Niggli E. Localized intracellular calcium signaling in muscle: calcium sparks and calcium quarks. Annual Reviews in Physiology. 1999;61:311–335. doi: 10.1146/annurev.physiol.61.1.311. [DOI] [PubMed] [Google Scholar]
- Orchard CH, Kentish JC. Effects of changes of pH on the contractile function of cardiac muscle. American Journal of Physiology. 1990;258:C967–981. doi: 10.1152/ajpcell.1990.258.6.C967. [DOI] [PubMed] [Google Scholar]
- Overend CL, Eisner DA, Oneill SC. The effect of tetracaine on spontaneous Ca2+ release and sarcoplasmic reticulum calcium content in rat ventricular myocytes. The Journal of Physiology. 1997;502:471–479. doi: 10.1111/j.1469-7793.1997.471bj.x. [DOI] [PMC free article] [PubMed] [Google Scholar]
- Rousseau E, Smith JS, Henderson JS, Meissner G. Single channel and Ca-45 flux measurements of the cardiac sarcoplasmic-reticulum calcium-channel. Biophysical Journal. 1986;50:1009–1014. doi: 10.1016/S0006-3495(86)83543-3. [DOI] [PMC free article] [PubMed] [Google Scholar]
- Sitsapesan R, Williams AJ. Regulation of the gating of the sheep cardiac SR Ca2+ release channel by luminal Ca2+ Journal of Membrane Biology. 1994;137:215–226. doi: 10.1007/BF00232590. [DOI] [PubMed] [Google Scholar]
- Smith GL, Miller DJ. Potentiometric measurements of stoichiometric and apparent affinity constants of EGTA for protons and divalent ions including calcium. Biochimica et Biophysica Acta. 1985;839:287–299. doi: 10.1016/0304-4165(85)90011-x. [DOI] [PubMed] [Google Scholar]
- Smith GL, Steele DS. Inorganic phosphate decreases the Ca2+ content of the sarcoplasmic reticulum in saponin-treated rat cardiac trabeculae. The Journal of Physiology. 1992;458:457–473. doi: 10.1113/jphysiol.1992.sp019427. [DOI] [PMC free article] [PubMed] [Google Scholar]
- Steele DS, McAinsh AM, Smith GL. Effects of creatine phosphate and inorganic phosphate on the sarcoplasmic reticulum of saponin-treated rat heart. The Journal of Physiology. 1995;483:155–166. doi: 10.1113/jphysiol.1995.sp020575. [DOI] [PMC free article] [PubMed] [Google Scholar]
- Valdeolmillos M, O'Neill SC, Smith GL, Eisner DA. Calcium-induced calcium release activates contraction in intact cardiac cells. Pflügers Archiv. 1989;413:676–678. doi: 10.1007/BF00581820. [DOI] [PubMed] [Google Scholar]
- Valdeolmillos M, Smith GL, Eisner DA, Allen DG. The effects of rapid application of caffeine on intracellular calcium concentration in ferret papillary muscle. Journal of General Physiology. 1988;92:351–368. doi: 10.1085/jgp.92.3.351. [DOI] [PMC free article] [PubMed] [Google Scholar]
- Xiang JZ, Kentish JK. Effects of inorganic phosphate and ADP on Ca2+ handling by the sarcoplasmic reticulum in rat skinned cardiac muscles. Cardiovascular Research. 1995;29:391–400. [PubMed] [Google Scholar]
- Xu L, Jones RV, Meissner G. Tetracaine inhibition of the Ca2+ release channel from skeletal sarcoplasmic-reticulum. Journal of General Physiology. 1993;101:207–233. doi: 10.1085/jgp.101.2.207. [DOI] [PMC free article] [PubMed] [Google Scholar]
- Xu L, Mann G, Meissner G. Regulation of cardiac Ca2+ release channel (ryanodine receptor) by Ca2+, H+, Mg2+, and adenine-nucleotides under normal and simulated ischaemic conditions. Circulation Research. 1996;79:1100–1109. doi: 10.1161/01.res.79.6.1100. [DOI] [PubMed] [Google Scholar]