

Abstract
Unitary inhibitory postsynaptic currents (uIPSCs) were recorded in synaptically coupled pairs of CA1 hippocampal interneurons and pyramidal neurons in rat brain slices by using dual patch-clamp techniques. Paired-pulse modulation of uIPSCs at individual GABAergic synapses was tested.
GABAergic synapses could be divided into two subgroups, high and low failure, depending on their failure rate.
The external Ca2+ levels modulate the failure rate of uIPSCs. In 0·51 mM Ca2+, low-failure pairs had a high-failure characteristic, whereas high-failure pairs had a low-failure characteristic in 8 mM Ca2+. The results suggest that uIPSC failures result from the Ca2+-dependent release mechanism rather than axon propagation failures.
Paired-pulse facilitation (PPF) occurred in high-failure pairs when the interspike interval was 20 ms. Paired-pulse depression (PPD) was not predominant in high-failure pairs.
Potency of uIPSCs, the average amplitude of non-failure events, was enhanced by PPF, suggesting that multiple synapses connect each pair. Differing numbers of activated synapses contributed to the variable amplitude of uIPSCs from a given pair.
PPD occurred in low-failure pairs at the tested range of interspike intervals (20–200 ms). The uIPSC2 after a large uIPSC1 was smaller than the uIPSC2 after a small uIPSC1, suggesting that PPD is use dependent and due to a decrease in the quantal content (m) after the first release.
In 8 mM Ca2+, PPD occurred in high-failure pairs and was larger in low-failure pairs, suggesting that the occurrence of PPF or PPD depends on the baseline release probability.
The GABAB receptor antagonist CGP 55845A (5 μM) decreased the baseline release probability of inhibitory synapses and attenuated PPD indirectly, rather than by blocking presynaptic GABAB autoreceptors.
Paired-pulse facilitation (PPF) and paired-pulse depression (PPD) are two examples of frequency-dependent short-term plasticity of synapses. In contrast to the robust PPF of excitatory postsynaptic currents (EPSCs) in the hippocampus (Andreasen & Hablitz, 1994; Debanne et al. 1996), inhibitory postsynaptic currents (IPSCs) showed a robust PPD (Deisz & Prince, 1989; Davies et al. 1990; Yoon & Rothman, 1991; Mott et al. 1993). Only a few studies have indicated PPF in inhibitory transmission (Fleidervish & Gutnick, 1995; Li et al. 1999). PPF is more readily identified under conditions in which the release probability (Pr) has been reduced, such as increasing the external [Mg2+]/[Ca2+] ratio (del Castillo & Katz, 1954; Davies & Collingridge, 1993; Lambert & Wilson, 1994; Wilcox & Dichter, 1994). The baseline Pr at individual excitatory synapses has been demonstrated to affect the subsequent occurrence of PPF or PPD (Debanne et al. 1996), while there is little evidence for the relationship between the baseline Pr and paired-pulse modulation of inhibitory synapses.
One hypothesis to explain PPF at neuromuscular junctions (Katz & Miledi, 1968) is that the first action potential induces a small Ca2+ influx that fails to trigger transmitter release itself, but remains in the terminal for several hundred milliseconds. This residual Ca2+ combined with the Ca2+ entering during the second action potential enhances the Pr. The mechanism underlying the PPD of inhibitory synaptic transmission is unknown. The widely known hypothesis, activation of presynaptic GABAB autoreceptors (Deisz & Prince, 1989; Davies et al. 1991; Mott et al. 1993; Davies & Collingridge, 1993; Khazipov et al. 1995), has been challenged by Wilcox & Dichter (1994) who observed that the GABAB receptor antagonists did not attenuate PPD of unitary IPSCs in pairs of cultured hippocampal neurons. An alternative presynaptic mechanism for PPD is that the decreased amplitude of the second IPSC is due to a transient decrease in the quantal content (m) resulting from depletion of the readily releasable vesicle pool by the first spike (Stevens & Wang, 1995; Debanne et al. 1996). Meanwhile, postsynaptic mechanisms such as desensitization of GABAA receptors (Alger, 1991) and decreased driving force due to intracellular accumulation of Cl− and/or extracellular accumulation of K+ (McCarren & Alger, 1985; Thompson & Gähwiler, 1989a,b) might explain the decrease in the second pulse-induced currents.
Individual GABAergic synapse modulation is difficult to test when recording synaptic events by stimulating multiple axonal fibres. Paired sharp electrode recordings of unitary inhibitory postsynaptic potentials (uIPSPs; Miles & Wong, 1984; Buhl et al. 1994; Poncer et al. 1997) also limit analysis of individual uIPSPs because of their low signal/noise ratio. The high signal/noise ratio of patch-clamp recordings enables detection of small synaptic currents with ∼10 pA amplitude, and the dual patch-clamp technique can be used to analyse the characteristics of individual synapses (Vincent & Marty, 1996; Cox et al. 1997). When unitary inhibitory postsynaptic currents (uIPSCs) in a pyramidal neuron were evoked by action potentials (AP) in an interneuron, a broad amplitude distribution for uIPSCs was usually observed (Kang et al. 1998). A multisynaptic coupling model can be used to explain this variation in the uIPSC amplitude if postsynaptic GABAA receptors are saturated by a single release (Edwards et al. 1990; Mody et al. 1994). Alternatively, variation in the amplitude of uIPSCs may result from releasing various sizes of vesicles if postsynaptic GABAA receptors are not saturated by a single vesicle (Frerking et al. 1995; Hill et al. 1998).
We tested PPF and PPD at individual synapses using a dual patch-clamp technique to record uIPSCs. We demonstrated that PPF predominates at high-failure GABAergic synapses, whereas PPD occurs at low-failure synapses. When the baseline Pr was enhanced by high extracellular concentrations of Ca2+, PPD occurred instead of PPF at high-failure synapses, suggesting that the occurrence of PPF or PPD depends on the baseline Pr. The GABAB receptor antagonist CGP55845A decreased baseline Pr and attenuated PPD indirectly, rather than by blocking presynaptic GABAB autoreceptors.
METHODS
Slice preparation
Rat brain slices were prepared as described previously (Kang et al. 1998). Briefly, 14- to 20-day-old (P14-P20) male and female Sprague-Dawley rats were anaesthetized with pentobarbitone sodium (55 mg kg−1) and decapitated. Coronal brain slices of 300 μm were cut with a vibratome (TPI, St Louis, MO, USA) in a cutting solution containing (mM): 2.5 KCl, 1.25 NaH2PO4, 10 MgSO4, 0.5 CaCl2, 10 glucose, 26 NaHCO3 and 230 sucrose. Slices containing the hippocampus were incubated in the slice solution gassed with 5 % CO2 and 95 % O2 for 1–7 h and then transferred to a recording chamber (1.5 ml) that was perfused with the slice solution gassed with 5 % CO2 and 95 % O2 at room temperature (23–24°C). The slice solution contained (mM); 126 NaCl, 2.5 KCl, 1.25 NaH2PO4, 2 MgCl2, 2 CaCl2, 10 glucose and 26 NaHCO3 (pH at 7.4 when gassed with 95 % O2 and 5 % CO2). All experiments were carried out according to the guidelines laid down by the Animal Care and Use Committee.
Dual patch-clamp recordings
The chamber was placed on the stage of an Olympus BX50 upright microscope (Olympus Optical Co., NY, USA) equipped with differential inference contrast (DIC) optics, and cells were visualized with a × 40 water immersion lens. Two electrical manipulators (TS Products Co., Arleta, CA, USA) were mounted on the stage in opposing positions and moved along a plane 18 deg to the horizontal. Patch electrodes with a resistance of 3–5 MΩ were pulled from KG-33 glass capillaries (i.d. 1.0 mm, o.d. 1.5 mm, Garner Glass Co., Claremont, CA, USA) using a P-97 electrode puller (Sutter Instrument Co., Novato, CA, USA). A seal resistance < 5 GΩ was rejected. Interneurons in the stratum radiatum and pyramidal neurons in the CA1 pyramidal layer were identified morphologically using DIC optics (Kang et al. 1998). Interneurons were patched in the whole-cell current-clamp configuration (Hamill et al. 1981) using an Axoclamp-2B amplifier (Axon Instruments, Inc., Burlingame, CA, USA). The pipette solution contained (mM): 120 potassium gluconate, 10 KCl, 1 MgCl2, 10 Hepes, 0.1 EGTA, 0.025 CaCl2, 1 ATP, 0.2 GTP and 4 glucose (pH adjusted to 7.2 with KOH). Pyramidal neurons whose apical dendrites were positioned toward the patched interneurons were patched in the voltage-clamp configuration and recorded at a holding potential of −60 mV using an Axopatch 200B amplifier (Axon Instruments, Inc.). The pipette solution for pyramidal neurons contained (mM): 120 CsCl, 10 KCl, 1 MgCl2, 10 Hepes, 0.1 EGTA, 0.025 CaCl2, 1 ATP, 0.2 GTP, 5 QX-314 and 4 glucose (pH adjusted to 7.2 with KOH). Experiments with a holding current > −200 pA were rejected. Recordings with changes in series resistance > 10 % of control were also rejected. Single, paired, or three depolarizing current pulses produced by a Master-8 stimulator (A.M.P.I., Jerusalem, Israel) were delivered to the patched interneurons at 0.1 Hz to induce single, paired, or three interneuronal spikes. Signals were filtered through an 8-pole Bessel low-pass filter with a 2 kHz cut-off frequency and sampled by an AxoScope program with an interval of 50 μs. Data were further processed with Origin 4.1 (Microcal Software, Inc., Northampton, MA, USA) and CorelDraw 7.0 (Corel Co. Ontario, Canada) programs. Statistical data are presented as means ±s.e.m. unless otherwise indicated.
Unitary IPSCs in pyramidal neurons (Pyr) were evoked by interneuronal APs (Fig. 1a, left trace). Synaptically coupled pairs of interneurons (Int) and pyramidal neurons were identified by trains of three spikes, which successfully evoked uIPSCs even when a single spike failed (Fig. 1a, centre traces). Unitary IPSCs had a short latency (Fig. 1B, left) between the interneuronal spike peak and the initiation of uIPSCs (2.9 ± 0.2 ms, mean ±s.d., n= 15 pairs), and were blocked by the GABAA receptor antagonist bicuculline (30 μM) confirming that they were GABAergic events (Fig. 1a, right traces). When the interpulse interval was shorter than the decay time of uIPSCs, the second uIPSC (uIPSC2) occurred on the decaying part of the first uIPSC (uIPSC1). Thus, the amplitude of uIPSC2 could be measured in two ways (Fig. 1B): ΔA2 measured from the initiation point to the peak of uIPSC2 (relative amplitude) and A2 from the baseline to the peak of uIPSC2 (absolute amplitude). When the first spike fails to evoke uIPSC1, A2 and ΔA2 are identical. ΔA2 reflects the net increase in the number of opening channels activated by the second spike. A2 reflects the total number of opening channels during the second spike. ΔA2 will be a better measure of uIPSC2 if the release sites activated during uIPSC1 are refractory to the subsequent AP (Stevens & Wang, 1995; Debanne et al. 1996). A2 is a better measure of uIPSC2 if both the first and second spikes trigger the same site to release but postsynaptic receptors were saturated by the first release. We used ΔA2 as a measure of uIPSC2 because the second spike may trigger release primarily from the synapses where the first spike has failed.
Figure 1. Characteristics and measurements of uIPSCs.
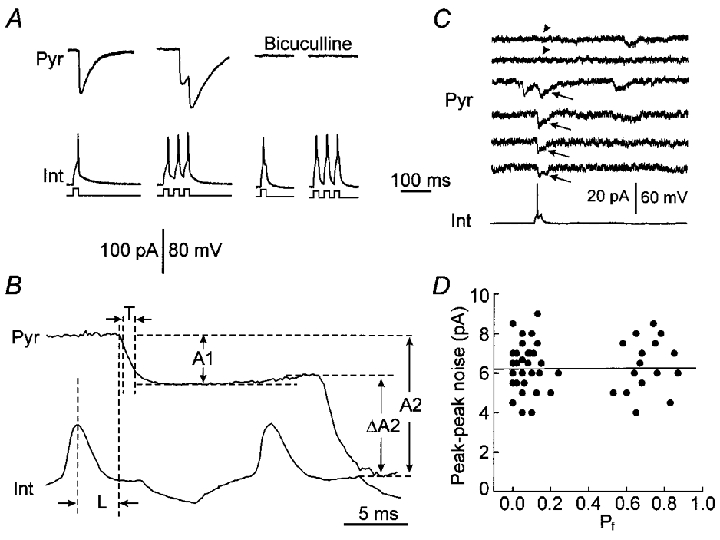
A, uIPSCs in a pyramidal neuron (Pyr) evoked by single (left traces) or three (centre traces) interneuronal spikes (Int). The bottom lines are depolarization pulses (15 ms duration, 20 ms interval, 200–400 pA at 0.1 Hz) delivered to the interneuron. Unitary IPSCs were blocked by the GABAA receptor antagonist bicuculline (30 μM, right traces). Trains of three spikes were used to confirm the blockade of receptors rather than failures. B, measurements of uIPSCs. The latency (L) was measured from the peak of action potential to the initiation of uIPSC. The 20–70 % rise time (T) was measured from the point where the uIPSC rose from 20 % of the peak amplitude to 70 % of the peak amplitude. The amplitude of uIPSC1 (A1) was measured from the baseline to the peak of uIPSC1. The relative amplitude of uIPSC2 (ΔA2) was measured from the initiation point of uIPSC2 to the peak of uIPSC2, and the absolute amplitude of uIPSC2 (A2) from the baseline to the peak of IPSC2. C, small uIPSCs with an amplitude of ≈10 pA (arrows) could be distinguished from noises and failures (arrowheads). D, the relationship between the failure rate (Pf) and peak-peak noise levels. The average peak-peak noise in each pair was plotted against the failure rate. The line is a linear regression line. Correlation coefficient r= 0.04, n= 51 cell pairs.
The patch-clamp recording technique allowed us to detect small uIPSCs of ∼10 pA amplitude. Although small uIPSCs may be close to the noise levels (average peak-peak noise in our experiments: 4–9 pA), we could discern them from noise and failures (Fig. 1C, arrowheads) by their long decay (decay constant, 38.2 ± 3.8 ms) and constant latency (Fig. 1C, arrows). In our experiments, an evoked uIPSC was defined as a downward current with a decay > 20 ms and an amplitude ≥ 10 pA starting within the average latency (for a given pair) ± 2 s.d. (fast: 0.18 ms, slow: 1.1 ms). The failure rate was not correlated to peak-peak noise levels (Fig. 1D, correlation ceofficient, r= 0.04) suggesting that failures were not attributed to high noise levels. That high external Ca2+ levels decreased failures further confirmed that failures were Ca2+-dependent release failures rather than undetectable events. A limitation of the technique is that small uIPSCs with an amplitude < 5 pA, such as those from far away dendritic locations (Spruston et al. 1993), might not be detected. To prevent misclassification of failures due to this limitation, we, in analysis, used only data from cell pairs having an average amplitude of uIPSCs > 15 pA. Small uIPSCs might also be undetected if the access resistance increased significantly. To prevent this problem, we carefully controlled the access resistance during experiments and the failure rate in a given pair did not increase with the recording time suggesting that failures could not be attributed to increased access resistance.
RESULTS
Fast and slow uIPSCs
Since dendritic filtering may attenuate the amplitude of uIPSCs and influence the analysis of uIPSC amplitude, we first identified fast and slow uIPSCs by analysing their 20 −70 % rise time. Unitary IPSCs from dendritic synapses should rise more slowly than uIPSCs from perisomatic synapses due to dendritic filtering (Major et al. 1994; Xiang et al. 1998). Although different receptor kinetics (Pearce, 1993) or unsynchronized openings of GABAA channels may also result in slowly rising uIPSCs, a fast uIPSC should be from a location near the recording position. In 22 of 51 pairs (average rise time: 0.5-1.6 ms, the threshold of fast uIPSCs was < 2 ms), uIPSCs rose fast (Fig. 2a, upper panel). The rise time for fast uIPSCs is around 1 ms (Fig. 2a, middle panel). Larger uIPSCs had similar or somewhat longer rise times than did smaller events (Fig. 2a, bottom panel). In 25 pairs (average rise time: 2.8-10.3 ms), uIPSCs rose slowly (Fig. 2B, upper panel). There was a broad distribution of rise times (Fig. 2B, middle panel), and larger events had relatively shorter rise times than did some smaller events (Fig. 2B, bottom panel). In four pairs, a group of uIPSCs rose quickly (Fig. 2C, upper panel, Fast), but others rose slowly (Fig. 2C, upper panel, Slow). The rise time for fast uIPSCs was around 1 ms (Fig. 2C, middle panel), and the amplitude of fast uIPSCs was larger than that of slow uIPSCs (Fig. 2C, bottom panel), suggesting that dendritic uIPSCs had been attenuated by dendritic filtering. The existence of both slow and fast uIPSCs in a given pair indicated that some interneurons (4/51) might be connected to pyramidal neurons by both dendritic and perisomatic synapses. The potency of uIPSCs (the averaged amplitude of non-failure events) from fast uIPSC pairs (112.9 ± 27.5 pA) was significantly larger than that from slow uIPSC pairs (21.0 ± 1.8 pA, P < 0.01, Student's t test). Since slow uIPSCs might be produced from dendritic synapses and attenuated by dendritic filtering, we used only fast uIPSC data for amplitude distributions.
Figure 2. Fast and slow uIPSCs.
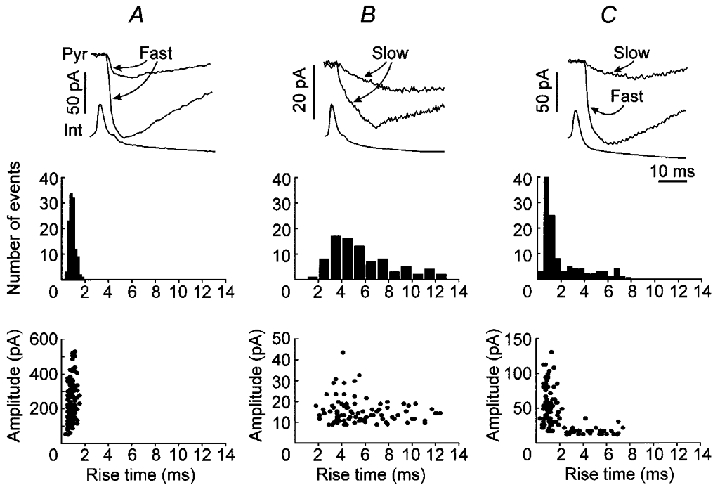
A, fast uIPSCs from a representative pair. B, slow uIPSCs from a representative pair. C, both fast and slow uIPSCs from a representative pair. Upper panels, representative recording traces showing fast (Fast) or slow (Slow) uIPSCs. Middle panels, the distribution for the 20 −70 % rise time of uIPSCs. The scale was the same as A. Bottom panels, the amplitude-rise time relationships for uIPSCs.
High- and low-failure synapses
Depending on the failure probability, inhibitory synapses were divided into two subgroups, ‘high failure’ (Fig. 3a) and ‘low failure’ (Fig. 3B). The definition of a high-failure pair is a cell pair having a failure rate ≥ 0.5. Seventeen of 51 coupled cell pairs were categorized as high failure with an average failure probability (Pf) of 0.69 ± 0.02 (range: 0.56-0.87); whereas, 34 pairs had very few failures (Pf of 0.08 ± 0.02, range: 0–0.24). Nine of 22 fast uIPSC pairs, 7 of 25 slow uIPSC pairs, and 1 of 4 fast and slow uIPSC pairs had the high-failure characteristic. In both high- and low-failure groups, large variations in the average amplitude of non-failure uIPSCs (potency) were noted among pairs (means ±s.d.: 69 ± 99 pA and 70 ± 80 pA, range: 10–266 pA and 11–471 pA, respectively). There was no statistical difference between the two groups (P= 0.91). Although the Pf was clearly different between the two groups, the transmission latency was similar (3.2 ± 0.3 ms for high-failure and 2.9 ± 0.2 ms for low-failure events, respectively, P= 0.35), indicating that uIPSCs in both groups were direct synaptic events.
Figure 3. Unitary IPSCs from high- and low-failure pairs.
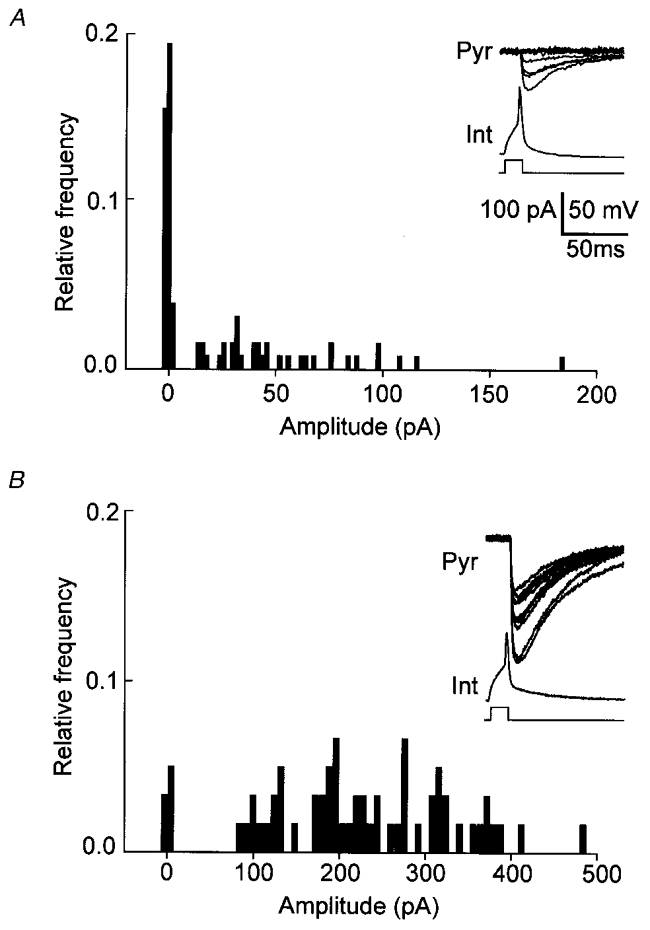
A, recording traces and the amplitude distribution for uIPSCs from a high-failure pair. The inset traces are 10 representative uIPSCs (upper) evoked by 10 continuous spikes at 0.1 Hz. The bottom traces are interneuronal spikes (Int) and depolarizing current pulses. The amplitude distribution was from 86 events. The bin step was 5 pA. The amplitude around zero indicates failure events. B, recording traces (inset, 10 traces) and the amplitude distribution (62 events) for uIPSCs from a low-failure pair. The bin step was 10 pA. Very few failure events (around zero) occurred.
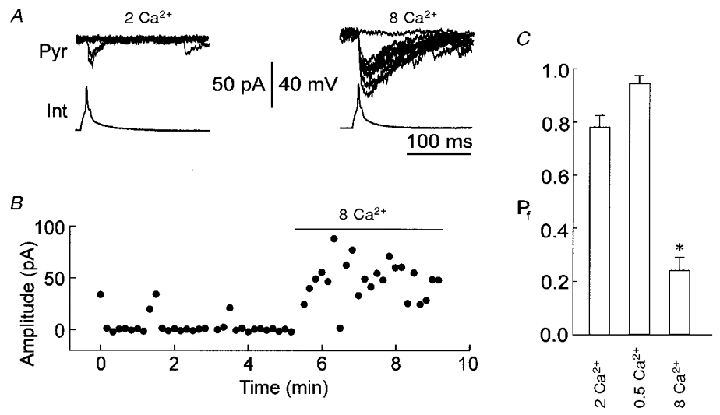
To verify whether failures of uIPSCs resulted from AP conduction failures (Debanne et al. 1997), we studied the influence of external Ca2+ on the failure of uIPSCs. We tested low-failure synapses first. In the control slice solution (2 mM Ca2+), there were very few failures of uIPSCs in a representative pair and the amplitudes of uIPSCs were distributed between 20 and 150 pA (Fig. 4a and B, 2 Ca2+). When the slice solution contained 0.5 mM Ca2+, uIPSC failures increased dramatically (Fig. 4a and B, 0.5 Ca2+), and the amplitude distribution showed a failure peak around zero amplitude and a single release peak around 20 pA (Fig. 4a, 0.5 Ca2+). The Pf of uIPSCs in 0.5 mM Ca2+ (Fig. 4C, 0.5 Ca2+) was significantly higher than that in 2 mM Ca2+ (Fig. 4C, 2 Ca2+, P < 0.001, paired t test, n= 5 low-failure pairs) indicating that the Pr decreased in low Ca2+ conditions. When the slice solution contained 8 mM Ca2+, the amplitude distribution shifted to the right, and there were more large amplitude events (Fig. 4a and B, 8 Ca2+, 100–230 pA) than those in the control solution (Fig. 4a and B, 2 Ca2+). The large uIPSCs in 8 mM Ca2+ conditions (Fig. 4a, 8 Ca2+, peak around 200 pA) might be close to the maximum. The results indicated that the Pr for individual synapses in low-failure pairs could be further enhanced by high concentrations of Ca2+. The amplitude distribution shift of uIPSCs in high Ca2+ suggested that each cell pair might be connected by multiple synapses and each spike activated more synapses in high Ca2+ than in control conditions.
Figure 4. Effects of external Ca2+ on uIPSC failures in low-failure pairs.
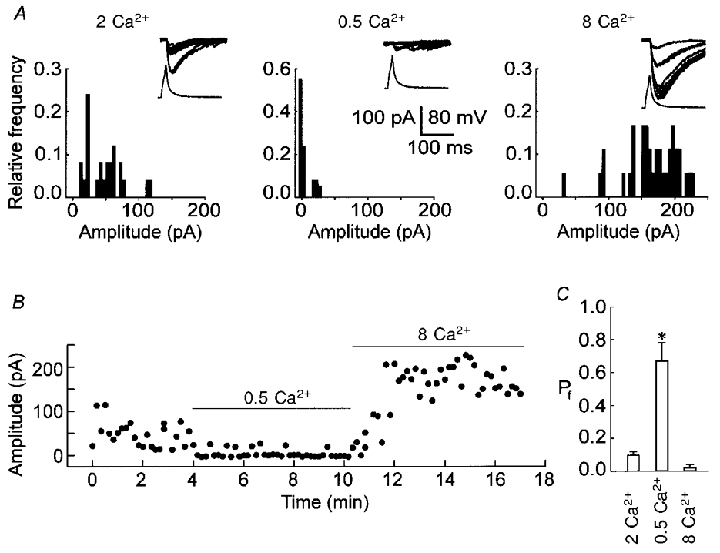
A, recording traces (inset) and amplitude distributions of uIPSCs from a representative low-failure pair in the presence of 2 (2 Ca2+), 0.5 (0.5 Ca2+) or 8 mM Ca2+ (8 Ca2+). Different concentrations of CaCl2 were added to the slice solution containing 2 mM MgCl2. B, a plot of the amplitude of uIPSCs against time for the data in A. C, the Pf of uIPSCs in the presence of 2 (2 Ca2+), 0.5 (0.5 Ca2+) or 8 mM Ca2+ (8 Ca2+). *P < 0.001 compared with control (2 Ca2+), n= 5 low-failure pairs.
Next, we examined the effects of external Ca2+ on uIPSCs at high-failure synapses. In the control solution (2 mM Ca2+), uIPSC failures in a representative high-failure pair occurred frequently (Fig. 5a and B, 2 Ca2+). When the slice solution contained 8 mM Ca2+, uIPSC failures decreased dramatically (Fig. 5a and B, 8 Ca2+). The Pf of uIPSCs in 8 mM Ca2+ (Fig. 5C, 8 Ca2+) was significantly lower than that in 2 mM Ca2+ (Fig. 5C, 2 Ca2+, P < 0.001, paired t test, n= 5 high-failure pairs). The low Ca2+ solution also further increased failures in high-failure pairs (Fig. 5C, 0.5 Ca2+). These results indicate that extracellular Ca2+ concentration significantly influences the uIPSC failure rate in both high- and low-failure pairs. Since high extracellular Ca2+ concentrations might not enhance AP conduction (possibly enhancing the threshold for AP production due to opening more Ca2+-activated K+ channels), the results suggest that uIPSC failures result from the Ca2+-dependent release mechanism rather than axon conduction failures.
Figure 5. Effects of external Ca2+ on uIPSC failures in high-failure pairs.
A, recording traces of uIPSCs from a representative high-failure pair in the presence of 2 (2 Ca2+) or 8 mM Ca2+ (8 Ca2+). B, a plot of the amplitude of uIPSCs against time for the data in A. C, the Pf of uIPSCs in the presence of 2 (2 Ca2+), 0.5 (0.5 Ca2+) or 8 mM Ca2+ (8 Ca2+). *P < 0.001 compared with control (2 Ca2+), n= 5 high-failure pairs.
PPF predominates at high-failure synapses
Paired-pulse modulation was first examined in high-failure pairs. The second spike more successfully evoked uIPSCs than did the first spike when the interpulse interval was 20 ms (Fig. 6a). The amplitude histogram for uIPSC2 (Fig. 6B, right) disclosed fewer failure events than did the histogram for uIPSC1 (Fig. 6B, left). The observed success probability (Ps) increased from 0.33 ± 0.03 (0.22-0.46) to 0.84 ± 0.03 (0.64-0.92), indicating the occurrence of PPF (Fig. 6C, P < 0.001, Student's paired t test, n= 10 pairs). In traces where the first spike failed to evoke uIPSC1 (Fig. 7Aa), the second spike with a 20 ms interval evoked uIPSC2 with a failure rate significantly lower than the overall failure rate for the first spike (P < 0.01, Student's paired t test, n= 5 pairs). The success probability ratio (Ps ratio, dividing the Ps for uIPSC2 where uIPSC1 was absent by the Ps for uIPSC1 in total traces) at 20 ms was larger than one (Fig. 7B, open circles). In total traces (Fig. 7B, filled circles), PPF was also observed at 20 ms intervals. Even at 200 ms intervals, the Ps for uIPSC2 was not significantly smaller than that for uIPSC1 in total traces (Fig. 7Ae and B, P= 0.37, Student's paired t test), suggesting that PPD does not predominate in high-failure pairs. In total traces, the average of ΔA2 (including failures) was significantly larger than the average of A1 (including failures) at 20 ms intervals (Fig. 7C, P < 0.01, Student's paired t test, n= 5 high-failure pairs), confirming PPF occurrence. The ΔA2 average was not smaller than the A1 average at 100 or 200 ms (Fig. 7Ae and C), confirming that PPD does not predominate at high-failure synapses.
Figure 6. PPF of uIPSCs in high-failure pairs.
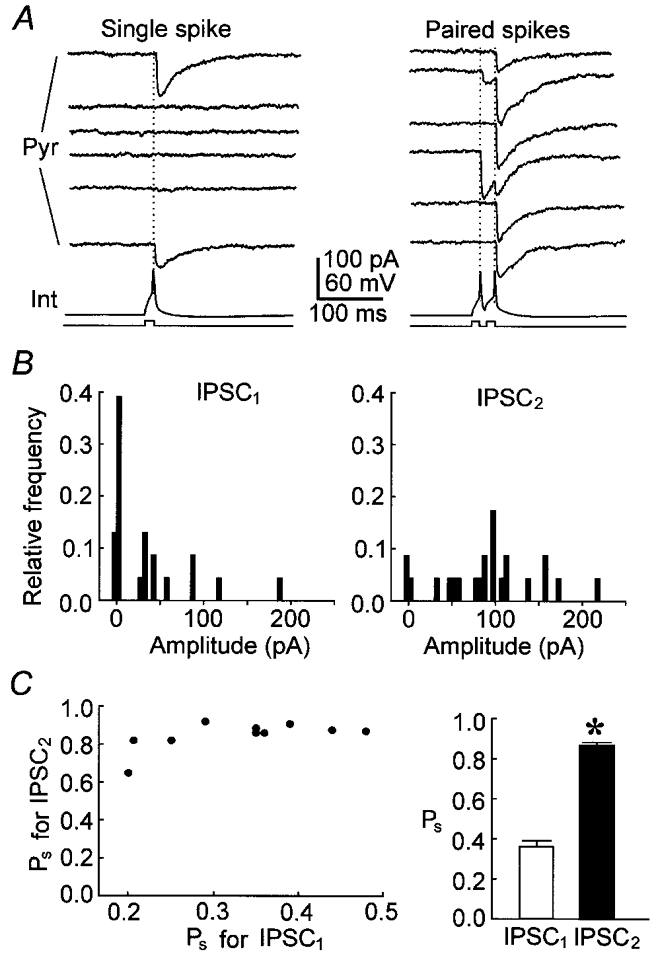
A, uIPSCs evoked by 6 continuous single spikes (left panel) or paired spikes (right panel) from a representative high-failure pair. The interpulse interval was 20 ms. B, the amplitude distribution for uIPSCs evoked by first (uIPSC1, left) and second (uIPSC2, right) spikes from the pair in A. C, left panel, the observed success probability (Ps) for uIPSC2 against Ps for uIPSC1. Right panel, average values of the observed success probability (Ps) for IPSC1 (□) and IPSC2 (▪). *P < 0.001 compared with uIPSC1 (Student's paired t test). n= 10 pairs.
Figure 7. PPF of uIPSCs with different intervals in high-failure pairs.
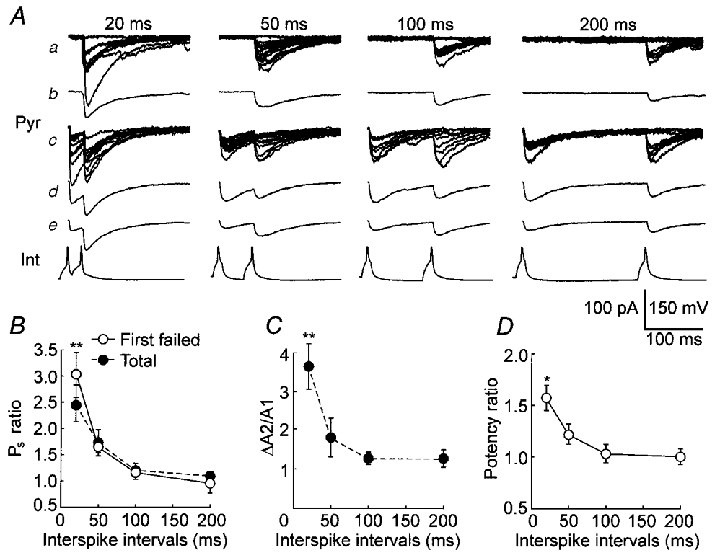
A, uIPSCs from a representative pair. a, individual traces where the first spike failed to evoke uIPSC1. b, an average of traces in a. c, individual traces where the first spike successfully evoked uIPSC1. d, an average of traces in c. e, an average of total traces. The numbers at the top indicate interpulse intervals. The bottom lines (Int) are interneuronal spikes. B, the observed success probability ratio (Ps ratio) for uIPSCs evoked by paired spikes with different intervals. In the first spike failed group (^, First failed), the Ps ratio was calculated by dividing the Ps for uIPSC2 from traces where the first spike failed by the Ps for uIPSC1 from total traces. The Ps ratio for total traces was also presented (•, Total). C, the amplitude ratio of uIPSC2 (ΔA2) to uIPSC1 (A1) in total traces. D, the potency ratio for uIPSCs evoked by paired spikes with different intervals. The potency for uIPSC2 from traces where uIPSC1 was absent (^) was divided by the potency for uIPSC1 from total traces. n= 5 cell pairs in B, C and D.*P < 0.05 and **P < 0.01, Student's paired t test.
Unitary IPSCs comprise currents from multiple synapses
To test further whether a single synapse or multiple synapses are functionally connecting a cell pair, we analysed the effect of PPF on uIPSC potency in high-failure pairs. If multiple synapses were connecting each pair, an increase in the Pr for individual synapses will increase the probability of simultaneous release from two or more synapses which will increase uIPSC potency (Stevens & Wang, 1995). The uIPSC potency, measured from traces where the first spike failed, was significantly enhanced by PPF at 20 ms (Fig. 7D, P < 0.05, Student's paired t test compared with that in total traces), suggesting that each cell pair was functionally connected by multiple synapses. Differing numbers of activated synapses contributed to the variation in the amplitude of uIPSCs from a given pair. These results agree with previous anatomical studies by other groups who showed that multiple terminals were present between an interneuron and a pyramidal neuron (Buhl et al. 1994; Miles et al. 1996).
PPD occurs at low-failure synapses
In low-failure pairs, because uIPSC1 failures were very few, the failure rate could not be used to reflect the paired-pulse modulation. We used the amplitude ratio (ΔA2/A1) to test paired-pulse modulation. We observed a significantly smaller ΔA2 than A1 at the tested range of interspike intervals (Fig. 8Ab and B, open circles, P < 0.01 ANOVA, n= 5 low-failure pairs), indicating PPD occurrence. These data agree with previous observations by other groups of PPD of inhibitory transmission (Lambert & Wilson, 1994; Pearce et al. 1995). The uIPSC2 failure rate at the 200 ms interval (0.18 ± 0.04) was significantly higher than the uIPSC1 failure rate (0.07 ± 0.03, P < 0.05, paired t test, n= 5 low-failure pairs). A plot of ΔA2 against A1 from a representative pair showed an inverse relationship between ΔA2 and A1 (Fig. 8C, r=−0.84), indicating that ΔA2 was evoked primarily from the synapses where the first spike failed. Thus, when the first spike activated more synapses to release (larger uIPSC1), ΔA2 was smaller (fewer available synapses for the second spike).
Figure 8. PPD of uIPSCs in low-failure pairs.
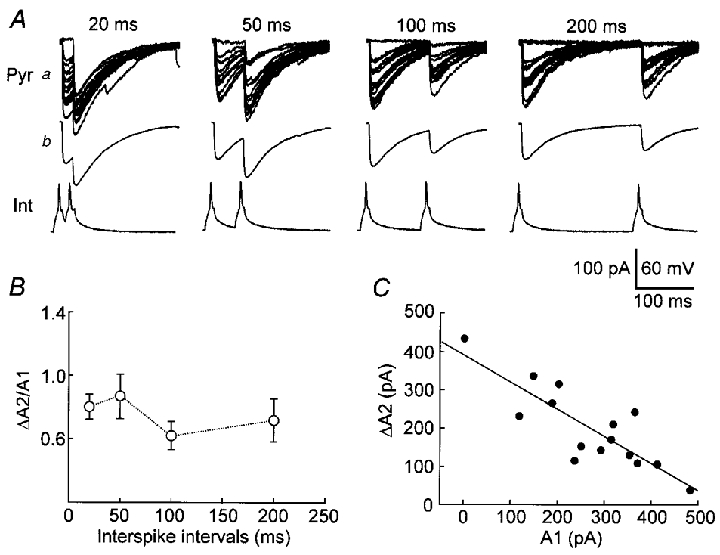
A, uIPSCs evoked by paired spikes (Int) with different intervals from a representative low-failure pair. a, individual traces. b, average of traces in a. Interpulse intervals are indicated at the top. B, the ΔA2/A1 ratio (^) at different intervals. n= 5 cell pairs. C, inverse relationship between ΔA2 and A1. Data are from the same pair in A. Interpulse interval, 20 ms. The line is a regression line (r=−0.84).
The occurrence of PPF or PPD depends on the baseline release probability
Paired-pulse modulation in both high- and low-failure pairs suggests that the occurrence of PPF or PPD is related to the baseline Pr. PPF is predominant when the Pr is low (high-failure pairs) and PPD occurs when the Pr is high (low-failure pairs). Since extracellular concentrations of Ca2+ can affect the baseline Pr (Figs 4 and 5), we further tested paired-pulse modulation in different concentrations of Ca2+ at high- or low-failure synapses. In a representative high-failure pair, uIPSC2 (ΔA2) was larger than uIPSC1 (A1) in the averaged trace in the control solution (Fig. 9a, 2 Ca2+, Ave). When the 8 mM Ca2+ solution was perfused (Fig. 9a, 8 Ca2+), uIPSC1 failure events were much fewer than those in the control solution (Fig. 9a, 2 Ca2+), and the averaged ΔA2 was smaller than the averaged A1 (Fig. 9a, 8 Ca2+) indicating the occurrence of PPD. The ΔA2/A1 ratio showed that PPF was predominant in 2 mM Ca2+ (Fig. 9B, open circles), whereas PPD occurred in 8 mM Ca2+ (Fig. 9B, filled circles, P < 0.01, ANOVA, n= 4 high-failure pairs). The results indicate that when the baseline Pr at high-failure synapses is enhanced by high external Ca2+, PPD occurs instead of PPF. When a low-failure pair was perfused by the 8 mM Ca2+ solution (Fig. 9B, 8 Ca2+), PPD was larger than that in the control solution (Fig. 9C, 2 Ca2+). The ΔA2/A1 ratio in 8 mM Ca2+ (Fig. 9D, filled circles) was significantly smaller than the ratio in 2 mM Ca2+ (Fig. 9D, open circles, P < 0.01, ANOVA, n= 5 low-failure pairs), further confirming that PPD is correlated to the baseline Pr. The ΔA2/A1 ratio in 0.5 mM Ca2+ (Fig. 9D, filled squares) was significantly larger than the ΔA2/A1 ratio in the control solution (Fig. 9D, open circles, P < 0.01, ANOVA, n= 5 pairs), indicating that PPD is attenuated when the baseline Pr is reduced by low external Ca2+. PPF at low-failure synapses in 0.5 mM Ca2+ (Fig. 9C, 0.5 Ca2+) was not as robust as that at high-failure synapses in 2 mM Ca2+ (Figs 6 and 7) although the failure rate was similar. A large variation in the ΔA2/A1 ratio was observed among pairs in the 0.5 mM Ca2+ solution, and there was no significant difference between ΔA2 and A1 at the 20 ms interval (P= 0.11, paired t test, n= 5 low-failure pairs). These results indicate that PPF depends on both the low baseline Pr and external Ca2+. The effects of external Ca2+ on the occurrence of PPD and PPF at GABAergic synapses are similar to those observed at the squid giant synapses, where synaptic depression occurs in high concentrations of Ca2+ and augmentation occurs in low concentrations of Ca2+ (Charlton et al. 1982; Swandulla et al. 1991).
Figure 9. Paired-pulse modulation in different extracellular concentrations of Ca2+.
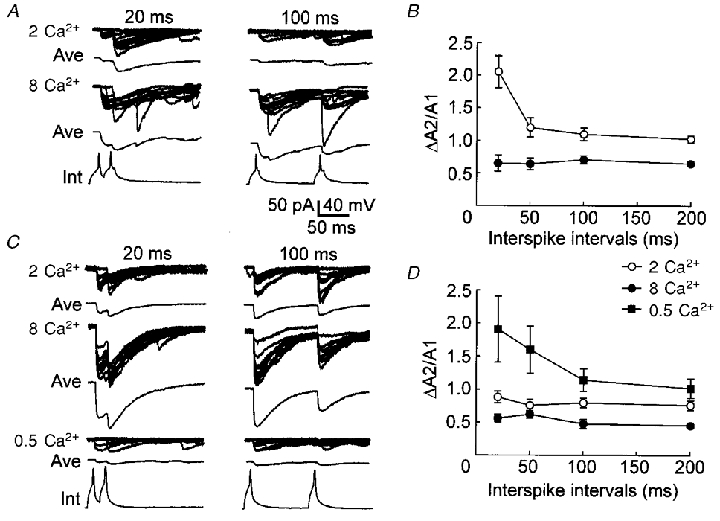
A, recording (10 continued traces) and averaged (Ave) traces of uIPSCs from a representative high-failure pair in the slice solution containing 2 (2 Ca2+) or 8 mM Ca2+ (8 Ca2+). Paired-pulse intervals are indicated on the top of traces (20 ms and 100 ms). The bottom traces are interneuronal spikes (Int). PPF occurred in the presence of 2 mM Ca2+, whereas PPD occurred in the presence of 8 mM Ca2+. B, the ΔA2/A1 ratio at different interspike intervals in 2 mM (^) or 8 mM Ca2+ (•) from high-failure pairs. n= 4 high-failure pairs. PPD, instead of PPF, occurred when 8 mM Ca2+ was perfused. C, recording (10 continued traces) and averaged (Ave) traces from a representative low-failure pair in the slice solution containing 2 (2 Ca2+), 8 (8 Ca2+) or 0.5 mM Ca2+ (0.5 Ca2+). D, the ΔA2/A1 ratio at different intervals in 2 (^), 8 (•) or 0.5 mM Ca2+ (▪) from low-failure pairs. n= 5 low-failure pairs.
Presynaptic GABAB autoreceptors are not involved in PPD
To determine whether presynaptic GABAB autoreceptors are involved in PPD of uIPSCs, we tested PPD in the absence or presence of the GABAB receptor antagonist CGP 55845A. First we perfused slices with the solution containing 8 mM Ca2+ to obtain the robust PPD in low-failure pairs. Then CGP 55845A (5 μM) was added to the 8 mM Ca2+ solution. The results showed that, if total traces in the presence of CGP 55845A were averaged, the ΔA2/A1 ratio in the presence of CGP55845A (Fig. 10Ab, Ave and C, filled circles) was larger than that in control (Fig. 10Aa, Ave and C, open circles, P < 0.01, ANOVA, n= 5 low-failure pairs). However, CGP 55845A clearly increased failures and decreased the amplitude of uIPSC1 (Fig. 10Ab and B, filled circles). The average amplitude of CGP 55845A-treated uIPSC1 was significantly smaller than control uIPSC1 (Fig. 10C, open squares). These results indicate that the GABAB receptor antagonist decreases the baseline Pr of GABAergic synapses. The GABAB receptor agonists are known to inhibit GABAergic synaptic release (Deisz & Prince, 1989; Yoon & Rothman, 1991). In contrast to the rapid effect of the GABAB receptor agonist (< 1 min, Kang et al. 1998), the CGP55845A-induced response started at 4–5 min after perfusion, suggesting that CGP55845A might block GABAB receptors activated by background GABA rather than GABA released during the first stimulus. A possible pathway is that CGP55845A blocks the astrocytic GABAB receptor-mediated potentiation of inhibitory transmission, which has a similar time course (Kang et al. 1998). To compare the effect of CGP55845A on PPD in conditions similar to the first spike-induced release, we selected CGP 55845A-treated traces with large uIPSC1 (Fig. 10B, filled circles, > 80 pA) so that the average amplitude of uIPSC1 in the selected traces was similar to the average of uIPSC1 in control. The ΔA2/A1 ratio for selected CGP 55845A-treated traces (Fig. 10Ac, Ave and C, filled squares) was not significantly different from the ratio in control (Fig. 10Aa, Aveand C, open circles, P= 0.77, ANOVA, n= 5 low-failure pairs), indicating that CGP 55845A did not attenuate PPD in those traces. The results indicate that the attenuation of PPD in total traces by CGP 55845A was due to the CGP 55845A-induced decrease in baseline Pr rather than blockade of presynaptic GABAB autoreceptors.
Figure 10. Effects of the GABAB receptor antagonist on PPD.
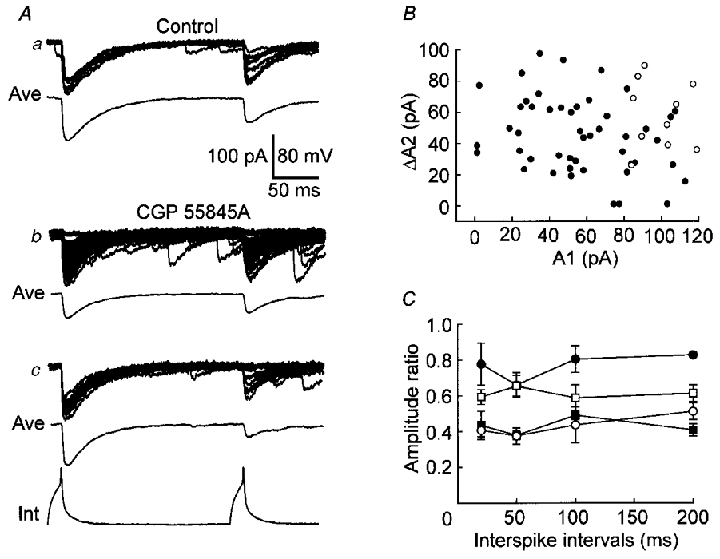
A, recording (upper) and averaged (Ave) traces from a representative low-failure pair in the absence (Control) or presence of CGP55845A (CGP55845A) while the slice solution contained 8 mM Ca2+. a, 10 continued traces in the absence of CGP55845A. b, total traces (47 continued traces) in the presence of CGP55845A. c, the traces chosen from data in b, in which the amplitude of uIPSC1 is similar to that in a. B, the amplitude of uIPSC2 (ΔA2) was plotted against the amplitude of uIPSC1 (A1) for the data in A in the absence (^) or presence of CGP55845A (•). C, the ΔA2/A1 ratio for the total traces in the absence (^) or presence of CGP55845A (•), and for the traces as in Ac (▪). The decrease in uIPSC1 by CGP55845A is indicated by the uIPSC1 ratio (□, CGP-treated uIPSC1/control uIPSC1). n= 5 cell pairs.
DISCUSSION
We have identified two subgroups of inhibitory synapses, high- and low-failure synapses. The failure characteristic in excitatory synaptic transmission has been described, wherein the unreliability has been attributed to the probabilistic nature of transmitter release (Rosenmund et al. 1993; Hessler et al. 1993), rather than axon threshold fluctuations or conduction failures (Allen & Stevens, 1994). By contrast, inhibitory synaptic transmission is reported by Miles & Wong (1984) and Miles et al. (1996) as a reliable system using intracellular recordings in the hippocampal CA3 region. We demonstrated that high-failure GABAergic synapses also exist in the hippocampal CA1 region. Failures of uIPSCs are not due to AP propagation failures because high extracellular concentrations of Ca2+ reduced failures in high-failure pairs (Fig. 5). The detailed mechanism underlying the failure of GABAergic synapses has not yet been determined. The Pf for a synapse with multiple release sites (Pr > 0) will be lower than for a synapse with a single release site. Alternatively, variances in vesicle exocytosis caused by different sizes of the readily releasable vesicle pool (Dobrunz & Stevens, 1997), Ca2+ channels, Ca2+ sensors, or other components of synaptic exocytosis core complex (Lin & Scheller, 1997), could also be the mechanism. As yet we lack sufficient evidence to conclude whether either or both of these mechanisms underlie the different failure probabilities.
That the potency ratio of uIPSCs was larger than one, suggests that multiple synapses connect each pair. A question is whether multiple release sites in a single synapse can be the mechanism underlying the PPF-induced increase in uIPSC potency. Here, a single synapse is defined as any connection at which an independent group of postsynaptic receptors is activated by one or more release sites but not by release sites at other synapses. Separate release sites, which impinge on independent groups of postsynaptic receptors without overlap, in a single button are considered separate synapses. Concerning presynaptic release sites and percentage occupancy of postsynaptic GABAA receptors, there are four models for release at a single synapse. First, there is a single release site and postsynaptic receptors are saturated by a single vesicle (Fig. 11a, 1). Second, receptors are saturated by a single vesicle, but multiple release sites exist (Fig. 11a, 2). Third, there is a single release site, but receptors are not saturated by a single vesicle (Fig. 11a, 3). Fourth, there are multiple release sites and receptors are not saturated by a single vesicle (Fig. 11a, 4). PPF will not increase the potency of uIPSCs in the first, second and third model because an increase in the Pr will not affect the average quantal size in these models. In the fourth model, release of additional vesicles induces a larger uIPSC amplitude by activating more receptors (Fig. 11a, 4). A PPF-induced increase in the Pr for each release site will enhance the probability of simultaneous release from two or more release sites. Thus, the PPF-induced increase in uIPSC potency could occur in the fourth model. If this were true, the increase in uIPSC potency at larger synapses would be larger than at smaller synapses because smaller synapses are more easily saturated than are larger ones (Nusser et al. 1997). However, the potency ratio was not correlated to uIPSC1 potency (Fig. 11B, r= 0.03), suggesting that multiple release sites in a single synapse were not a major mechanism in the PPF-induced increase in uIPSC potency.
Figure 11. Release models at a single synapse.
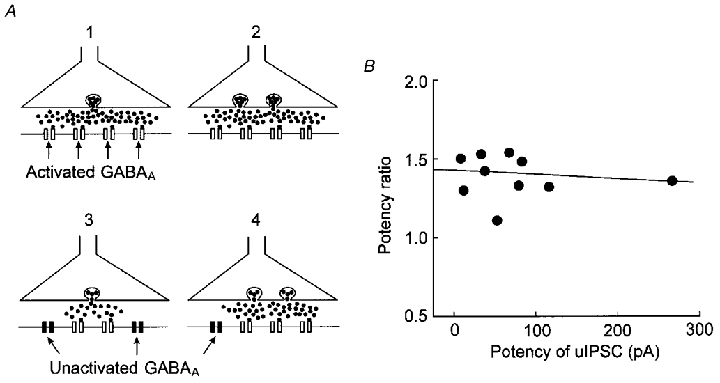
A, four release models for a single synapse: a single release site with saturated postsynaptic receptors (1), multiple release sites with saturated postsynaptic receptors (2), a single release site with unsaturated postsynaptic receptors (3), multiple release sites with unsaturated postsynaptic receptors (4). PPF may enhance the amplitude of uIPSCs in model 4. B, the PPF-induced increase in the potency of uIPSCs was not related to the size of synapses. The potency ratio in the first spike failed group was plotted against the potency of uIPSC1. The interpulse interval was 20 ms. The potency ratio was not correlated to the potency of uIPSCs in high-failure pairs (r= 0.03).
Connecting an inhibitory interneuron to a pyramidal neuron with multiple synapses has functional significance. In dendritically coupled pairs, an interneuronal spike may simultaneously inhibit excitatory inputs from several dendritic places. In perisomatically coupled pairs, by activating multiple synapses, an interneuronal spike may spatially control the excitability of a pyramidal neuron and the production of action potentials. Multiple synapses also play roles in modulating inhibitory transmission. At high-failure synapses, when an interneuron is firing in bursts with very short intervals (< 50 ms), PPF occurs and the second spike-induced inhibition increases due to increases in both the Pr for individual synapses (more successfully) and the number of activated synapses (more spatially). On the other hand, PPD that occurs at low-failure synapses decreases the second spike-induced inhibition by decreasing the Pr of individual synapses and the number of activated synapses. In this study, there was a small group of cell pairs (4/51) with both fast and slow uIPSCs, suggesting that both the perisomatic and dendritic synapses connect this type of cell pair (Fig. 2C). Firing of the interneuron in this type of connection may inhibit both dendritic inputs and AP production. Moreover, if these dendritic and perisomatic synapses are differentially modulated, the inhibition locale may shift from dendrites to perisoma or vice versa. For example, if dendritic synapses have a high Pr whereas perisomatic synapses have a low Pr, paired spikes will depress dendritic synapses and facilitate perisomatic synapses.
A postsynaptic mechanism, the decrease in the driving force for Cl−, seems unlikely to underlie PPD of uIPSCs. Perhaps the driving force did not change much in our experimental conditions because: (1) we stimulated a single interneuron that induced a small Cl− efflux (only a few synapses were activated); (2) a symmetric Cl− gradient ([Cl−]in/[Cl−]out= 140 mM/140 mM) was applied across the recorded pyramidal neuron. Thus, a small change in [Cl−]in or [Cl−]out may not change the [Cl−]in/Cl−]out ratio because of the high concentrations (140 mM) of Cl− on both sides of the membrane. For example, if [Cl−]in is changed from 140 mM to 135 mM, the [Cl−]in/[Cl−]out ratio will change only from 1 to 0.96, the difference is negligible for ECl. Our examination of the reversal potential of uIPSCs during paired pulses disclosed no change during uIPSC2 (P= 0.54, paired t test, n= 5 pairs), confirming that PPD is not due to changes in the driving force for Cl− in our experimental conditions. That the uIPSC2 failure rate was higher than the uIPSC1 failure rate suggests that the presynaptic mechanism is involved in PPD. Based on the data in this study, we could not exclude the involvement of postsynaptic GABAA receptor desensitization in PPD. GABAA receptor desensitization reportedly plays a role in shaping GABAergic responses (Jones & Westbrook, 1995). When Pr is high, the first AP-induced release of GABA may desensitize postsynaptic receptors. The negative correlation between ΔA2 and A1 shown in Fig. 8C could also be attributed to receptor desensitization. However, if a terminal contains only a single release site and the release site undergoes a refractory period after the first release, receptor desensitization would not contribute much to PPD. The results in our study do not support the GABAB autoreceptor hypothesis (Deisz & Prince, 1989; Davies et al. 1991; Mott et al. 1993; Davies & Collingridge, 1993; Khazipov et al. 1995; Ouardouz & Lacaille, 1997), but do agree with the observations in hippocampal cultures (Wilcox & Dichter, 1994). PPD with a similar time course (20 ms to 5 s) and use dependence has been observed at excitatory synapses (Debanne et al. 1996), implying that a similar mechanism may underlie both excitatory and inhibitory PPD. A possible mechanism for both excitatory and inhibitory PPD is that PPD results from a decrease in the quantal content (m) after exocytosis due to either depletion of the readily releasable vesicle pool (Stevens & Wang, 1995; Debanne et al. 1996) or reverse interaction between the components of the synaptic exocytosis core complex (Bezprozvanny et al. 1995).
Although a second spike may trigger release primarily from synapses at which the first spike has failed, we cannot exclude re-release occurring at some synapses. If a significant fraction of first-spike-activated synapses can re-release during a second spike, the use of ΔA2 may underestimate second release at the 20 ms interval because most postsynaptic receptors in the first-spike-activated synapse are being activated by the first release. In other words, ΔA2 primarily reflects release at the synapses where the first spike has failed. Thus, the occurrence of PPF or PPD (the ΔA2/A1 ratio) at the 20 ms interval relies primarily on the baseline Pr and the release probability for uIPSC2 (Pr2) at the synapses where a first spike has failed. If Pr≥ 0.5 for all release sites (might apply to most low-failure pairs), PPD occurs anyway because the first spike activates more than half of the total release sites. If Pr is < 0.5, Pr2 affects the occurrence of PPF and PPD. For example, if Pr is 0.4 for all release sites (Pf= 0.6) and Pr2 is 0.8, PPF occurs (0.6 × 0.8 = 0.48, > 0.4). However, if Pr2 is 0.6, PPD occurs (0.6 × 0.6 = 0.36, < 0.4). For high-failure synapses, the baseline Pr might be very low because multiple synapses connect each pair. In our data, the lowest failure rate in the high-failure group is 0.53. If two synapses with similar Pr connected this pair, Pr for each synapse would be close to 0.27. If Pr2 is > 0.4, PPF predominates at these synapses (0.73 × 0.4 = 0.29, > 0.27). Although predominant in most low-failure pairs, PPD may not occur in all low-failure pairs because PPD or PPF is not directly related to the failure rate but to the baseline Pr and Pr2 for individual synapses. There are a few special synapse organizations in low-failure pairs in which PPD may not occur. First, in a low-failure pair connected by many synapses, the baseline Pr for individual synapses may not be high. For example, if the failure rate for a cell pair is 0.1 and 10 synapses connect this pair, the baseline Pr for individual synapses is only 0.2 (assuming that Pr is similar among synapses). In such situations, if Pr2 is > 0.3, PPF occurs (0.8 × 0.3 = 0.24, > 0.2). Second, if there are large differences in Pr between individual synapses in a low-failure pair, PPD may not occur. For example, there are four similar size synapses connecting a pair; one synapse has Pr= 1 and the other three are silent (Pr= 0). If Pr2= 0.5, the average amplitude of uIPSC2 (0.5Q× 3 = 1.5Q, where Q represents quantal size) is larger than the average amplitude of uIPSC1 (1Q). In our data, only one low-failure pair (1/34) expressed PPF, suggesting that these special organizations may not be the major group of inhibitory synapses in the hippocampus.
The amplitude distribution of fast uIPSCs can be influenced by several factors including synapse number, synapse size, release probability, percentage occupancy of receptors, channel gating errors and recording errors. In our study, only two of 22 fast uIPSC pairs showed separate amplitude peaks suggesting that other factors, such as different synapse sizes in a cell pair (Sorra & Harris, 1993), the coefficient of variation of a quantum plus the background noise (with a small quantal size), and percentage occupancy of receptors (Frerking et al. 1995; Hill et al. 1998), might have influenced the amplitude distributions. Although a single release peak was observed in the amplitude distribution for uIPSCs in low Ca2+ conditions (Fig. 4a, 0.5 Ca2+), we cannot conclude that the synapse size among synapses is similar because some different size synapses might be silent in low concentrations of Ca2+.
We examined PPF and PPD at individual synapses using dual patch-clamp techniques in synaptically coupled cell pairs. We demonstrate that PPF predominates at high-failure GABAergic synapses, whereas PPD occurs at low-failure synapses. By analysing PPF of uIPSCs, we determined that uIPSCs are composed of currents from multiple synapses. The variable number of activated synapses contributes to the amplitude variations of uIPSCs from a given pair. When high extracellular concentrations of Ca2+ enhance the baseline Pr, PPD occurs instead of PPF, indicating that the occurrence of PPF or PPD depends on the baseline Pr. The GABAB receptor antagonist CGP55845A decreased baseline Pr and attenuated PPD indirectly, rather than by blocking presynaptic GABAB autoreceptors.
Acknowledgments
This work was supported by NIDH/NIH IR29NS37349-01, RO130007, RO135011, and The Alexandrine and Alexander L. Sinsheimer Scholar Award. We thank Dr William N. Ross and Dr Zixiu Xiang for helpful comments on this manuscript.
References
- Alger BE. Gating of GABAergic inhibition in hippocampal pyramidal cells. Annals of the New York Academy of Sciences. 1991;627:249–263. doi: 10.1111/j.1749-6632.1991.tb25929.x. [DOI] [PubMed] [Google Scholar]
- Allen C, Stevens CF. An evaluation of causes for unreliability of synaptic transmission. Proceedings of the National Academy of Sciences of the USA. 1994;91:10380–10383. doi: 10.1073/pnas.91.22.10380. [DOI] [PMC free article] [PubMed] [Google Scholar]
- Andreasen M, Hablitz JJ. Paired-pulse facilitation in the dentate gyrus: a patch-clamp study in rat hippocampus in vitro. Journal of Neurophysiology. 1994;72:326–336. doi: 10.1152/jn.1994.72.1.326. [DOI] [PubMed] [Google Scholar]
- Bezprozvanny I, Scheller RH, Tsien RW. Functional impact of syntaxin on gating of N-type and Q-type calcium channels. Nature. 1995;378:623–626. doi: 10.1038/378623a0. [DOI] [PubMed] [Google Scholar]
- Buhl EH, Halasy K, Somogyl P. Diverse sources of hippocampal unitary inhibitory postsynaptic potentials and the number of synaptic release sites. Nature. 1994;368:823–828. doi: 10.1038/368823a0. [DOI] [PubMed] [Google Scholar]
- Charlton MP, Smith SJ, Zucker RS. Role of presynaptic calcium ions and channels in synaptic facilitation and depression at the squid giant synapse. The Journal of Physiology. 1982;323:173–193. doi: 10.1113/jphysiol.1982.sp014067. [DOI] [PMC free article] [PubMed] [Google Scholar]
- Cox CL, Huguenard JR, Prince DA. Nucleus reticularis neurons mediate diverse inhibitory effects in thalamus. Proceedings of the National Academy of Sciences of the USA. 1997;94:8854–8859. doi: 10.1073/pnas.94.16.8854. [DOI] [PMC free article] [PubMed] [Google Scholar]
- Davies CH, Collingridge GL. The physiological regulation of synaptic inhibition by GABAB autoreceptors in rat hippocampus. The Journal of Physiology. 1993;472:245–265. doi: 10.1113/jphysiol.1993.sp019945. [DOI] [PMC free article] [PubMed] [Google Scholar]
- Davies CH, Davies SN, Collingridge GL. Paired-pulse depression of monosynaptic GABA-mediated inhibitory postsynaptic responses in rat hippocampus. The Journal of Physiology. 1990;424:513–531. doi: 10.1113/jphysiol.1990.sp018080. [DOI] [PMC free article] [PubMed] [Google Scholar]
- Davies CH, Starkey SJ, Pozza MF, Collingridge GL. GABAB autoreceptors regulate the induction of LTP. Nature. 1991;349:609–611. doi: 10.1038/349609a0. [DOI] [PubMed] [Google Scholar]
- Debanne D, Guérineau N, Gähwiler BH, Thompson SM. Paired-pulse facilitation and depression at unitary synapses in rat hippocampus: quantal fluctuation affects subsequent release. The Journal of Physiology. 1996;491:163–176. doi: 10.1113/jphysiol.1996.sp021204. [DOI] [PMC free article] [PubMed] [Google Scholar]
- Debanne D, Guérineau N, Gähwiler BH, Thompson SM. Action-potential propagation gated by an axonal IA-like K+ conductance in hippocampus. Nature. 1997;389:286–289. doi: 10.1038/38502. [DOI] [PubMed] [Google Scholar]
- Deisz RA, Prince DA. Frequency-dependent depression of inhibition in guinea-pig neocortex in vitro by GABAB receptor feed-back on GABA release. The Journal of Physiology. 1989;412:513–541. doi: 10.1113/jphysiol.1989.sp017629. [DOI] [PMC free article] [PubMed] [Google Scholar]
- del Castillo J, Katz B. Statistical factors involved in neuromuscular facilitation and depression. The Journal of Physiology. 1954;124:574–585. doi: 10.1113/jphysiol.1954.sp005130. [DOI] [PMC free article] [PubMed] [Google Scholar]
- Dobrunz LE, Stevens CF. Heterogeneity of release probability, facilitation, and depletion at central synapses. Neuron. 1997;18:995–1008. doi: 10.1016/s0896-6273(00)80338-4. [DOI] [PubMed] [Google Scholar]
- Edwards FA, Konnerth A, Sakmann B. Quantal analysis of inhibitory synaptic transmission in the dentate gyrus of rat hippocampal slices: a patch-clamp study. Journal of Physiology. 1990;430:213–249. doi: 10.1113/jphysiol.1990.sp018289. [DOI] [PMC free article] [PubMed] [Google Scholar]
- Fleidervish IA, Gutnick MJ. Paired-pulse facilitation of IPSCs in slices of immature and mature mouse somatosensory neocortex. Journal of Neurophysiology. 1995;73:2591–2595. doi: 10.1152/jn.1995.73.6.2591. [DOI] [PubMed] [Google Scholar]
- Frerking M, Borges S, Wilson M. Variation in GABA mini amplitude is the consequence of variation in transmitter concentration. Neuron. 1995;15:885–895. doi: 10.1016/0896-6273(95)90179-5. [DOI] [PubMed] [Google Scholar]
- Hamill OP, Marty A, Neher E, Sackmann B, Sigworth FJ. Improved patch-clamp techniques for high-resolution current recording from cells and cell-free membrane patches. Pflügers Archiv. 1981;391:85–100. doi: 10.1007/BF00656997. [DOI] [PubMed] [Google Scholar]
- Hessler NA, Shirke AM, Malinow R. The probability of transmitter release at a mammalian central synapse. Nature. 1993;366:569–572. doi: 10.1038/366569a0. [DOI] [PubMed] [Google Scholar]
- Hill MW, Reddy PA, Covey DF, Rothman SM. Contribution of subsaturating GABA concentration to IPSCs in cultured hippocampal neurons. Journal of Neuroscience. 1998;18:5103–5111. doi: 10.1523/JNEUROSCI.18-14-05103.1998. [DOI] [PMC free article] [PubMed] [Google Scholar]
- Jones MV, Westbrook GL. Desensitized states prolong GABAA channel responses to brief agonist pulses. Neuron. 1995;15:181–191. doi: 10.1016/0896-6273(95)90075-6. [DOI] [PubMed] [Google Scholar]
- Kang J, Jiang L, Goldman SA, Nedergaard M. Astrocyte-mediated potentiation of inhibitory synaptic transmission. Nature Neuroscience. 1998;1:683–692. doi: 10.1038/3684. [DOI] [PubMed] [Google Scholar]
- Katz B, Miledi R. The role of calcium in neuromuscular facilitation. The Journal of Physiology. 1968;195:481–492. doi: 10.1113/jphysiol.1968.sp008469. [DOI] [PMC free article] [PubMed] [Google Scholar]
- Khazipov R, Congar P, Ben-Ari Y. Hippocampal CA1 lacunosum-moleculare interneurons: modulation of monosynaptic GABAergic IPSCs by presynaptic GABAB receptors. Journal of Neurophysiology. 1995;74:2126–2137. doi: 10.1152/jn.1995.74.5.2126. [DOI] [PubMed] [Google Scholar]
- Lambert NA, Wilson WA. Temporally distinct mechanisms of use-dependent depression at inhibitory synapses in the rat hippocampus in vitro. Journal of Neurophysiology. 1994;72:121–130. doi: 10.1152/jn.1994.72.1.121. [DOI] [PubMed] [Google Scholar]
- Li P, Wilding TJ, Kim SJ, Calejesan AA, Huettner JE, Zhuo M. Kainate-receptor-mediated sensory synaptic transmission in mammalian spinal cord. Nature. 1999;397:161–164. doi: 10.1038/16469. [DOI] [PubMed] [Google Scholar]
- Lin RC, Scheller RH. Structural organization of the synaptic exocytosis core complex. Neuron. 1997;19:1087–1094. doi: 10.1016/s0896-6273(00)80399-2. [DOI] [PubMed] [Google Scholar]
- Mccarren M, Alger B. Use-dependent depression of IPSPs in rat hippocampal cells in vitro. Journal of Neurophysiology. 1985;53:557–571. doi: 10.1152/jn.1985.53.2.557. [DOI] [PubMed] [Google Scholar]
- Major G, Larkman AU, Jonas P, Sakmann B, Jack JJ. Detailed passive cable models of whole-cell recorded CA3 pyramidal neurons in rat hippocampal slices. Journal of Neuroscience. 1994;14:4613–4638. doi: 10.1523/JNEUROSCI.14-08-04613.1994. [DOI] [PMC free article] [PubMed] [Google Scholar]
- Miles R, Toth K, Gulyas AI, Hajos N, Freund TF. Differences between somatic and dendritic inhibition in the hippocampus. Neuron. 1996;16:815–823. doi: 10.1016/s0896-6273(00)80101-4. [DOI] [PubMed] [Google Scholar]
- Miles R, Wong RK. Unitary inhibitory synaptic potentials in the guinea-pig hippocampus in vitro. The Journal of Physiology. 1984;356:97–113. doi: 10.1113/jphysiol.1984.sp015455. [DOI] [PMC free article] [PubMed] [Google Scholar]
- Mody I, van Koninck Y, Otis TS, Soltesz I. Bridging the cleft at GABA synapses in the brain. Trends in Neurosciences. 1994;17:517–525. doi: 10.1016/0166-2236(94)90155-4. [DOI] [PubMed] [Google Scholar]
- Mott DD, Xie CW, Wilson WA, Swartzwelder HS, Lewis DV. GABAB autoreceptors mediate activity-dependent disinhibition and enhance signal transmission in the dentate gyrus. Journal of Neurophysiology. 1993;69:674–691. doi: 10.1152/jn.1993.69.3.674. [DOI] [PubMed] [Google Scholar]
- Nusser Z, Cull-Candy S, Farrant M. Differences in synaptic GABAA receptor number underlie variation in GABA mini amplitude. Neuron. 1997;19:697–709. doi: 10.1016/s0896-6273(00)80382-7. [DOI] [PubMed] [Google Scholar]
- Ouardouz M, Lacaille J. Properties of unitary IPSCs in hippocampal pyramidal cells originating from different types of interneurons in young rats. Journal of Neurophysiology. 1997;77:1939–1949. doi: 10.1152/jn.1997.77.4.1939. [DOI] [PubMed] [Google Scholar]
- Pearce RA. Physiological evidence for two distinct GABAA responses in rat hippocampus. Neuron. 1993;10:189–200. doi: 10.1016/0896-6273(93)90310-n. [DOI] [PubMed] [Google Scholar]
- Pearce RA, Grunder SD, Faucher LD. Different mechanisms for use-dependent depression of two GABAA-mediated IPSCs in rat hippocampus. The Journal of Physiology. 1995;484:425–435. doi: 10.1113/jphysiol.1995.sp020675. [DOI] [PMC free article] [PubMed] [Google Scholar]
- Poncer JC, Mckinney RA, Gähwiler BH, Thompson SM. Either N- or P-type calcium channels mediate GABA release at distinct hippocampal inhibitory synapses. Neuron. 1997;18:463–472. doi: 10.1016/s0896-6273(00)81246-5. [DOI] [PubMed] [Google Scholar]
- Rosenmund C, Clements JD, Westbrook GL. Nonuniform probability of glutamate release at a hippocampal synapse. Science. 1993;262:754–757. doi: 10.1126/science.7901909. [DOI] [PubMed] [Google Scholar]
- Sorra KE, Harris KM. Occurrence and three-dimensional structure of multiple synapses between individual radiatum axons and their target pyramidal cells in hippocampal area CA1. Journal of Neuroscience. 1993;13:3736–3748. doi: 10.1523/JNEUROSCI.13-09-03736.1993. [DOI] [PMC free article] [PubMed] [Google Scholar]
- Spruston N, Jaffe DB, Williams SH, Johnston D. Voltage- and space-clamp errors associated with the measurement of electrotonically remote synaptic events. Journal of Neurophysiology. 1993;70:781–802. doi: 10.1152/jn.1993.70.2.781. [DOI] [PubMed] [Google Scholar]
- Stevens CF, Wang Y. Facilitation and depression at single central synapses. Neuron. 1995;14:795–802. doi: 10.1016/0896-6273(95)90223-6. [DOI] [PubMed] [Google Scholar]
- Swandulla D, Hans M, Zipser K, Augustine GJ. Role of residual calcium in synaptic depression and posttetanic potentiation: fast and slow calcium signaling in nerve terminals. Neuron. 1991;7:915–926. doi: 10.1016/0896-6273(91)90337-y. [DOI] [PubMed] [Google Scholar]
- Thompson SM, Gähwiler BH. Activity-dependent disinhibition. I. Repetitive stimulation reduces IPSP driving force and conductance in hippocampus in vitro. Journal of Neurophysiology. 1989a;61:501–511. doi: 10.1152/jn.1989.61.3.501. [DOI] [PubMed] [Google Scholar]
- Thompson SM, Gähwiler BH. Activity-dependent disinhibition. II. Effects of extracellular potassium, furosemide, and membrane potential on Ecl in hippocampal CA3 neurons. Journal of Neurophysiology. 1989b;61:512–523. doi: 10.1152/jn.1989.61.3.512. [DOI] [PubMed] [Google Scholar]
- Vincent P, Marty A. Fluctuations of inhibitory postsynaptic currents in Purkinje cells from rat cerebellar slices. The Journal of Physiology. 1996;494:183–199. doi: 10.1113/jphysiol.1996.sp021484. [DOI] [PMC free article] [PubMed] [Google Scholar]
- Wilcox KS, Dichter MA. Paired pulse depression in cultured hippocampal neurons is due to a presynaptic mechanism independent of GABAB autoreceptor activation. Journal of Neuroscience. 1994;14:1775–1788. doi: 10.1523/JNEUROSCI.14-03-01775.1994. [DOI] [PMC free article] [PubMed] [Google Scholar]
- Xiang Z, Huguenard JR, Prince DA. Cholinergic switching within neocortical inhibitory networks. Science. 1998;281:985–988. doi: 10.1126/science.281.5379.985. [DOI] [PubMed] [Google Scholar]
- Yoon KW, Rothman SM. The modulation of rat hippocampal synaptic conductances by baclofen and gamma-aminobutyric acid. The Journal of Physiology. 1991;442:377–390. doi: 10.1113/jphysiol.1991.sp018798. [DOI] [PMC free article] [PubMed] [Google Scholar]