

Abstract
In seven decerebrate cats, recordings were taken from the preganglionic cervical sympathetic (CSy) nerves and from 74 individual CSy fibres. Correlation and spectral analyses showed that nerve and fibre discharges had several types of rhythm that were coherent (correlated) between population and unit activity: respiratory, ‘3 Hz’ (2–6 Hz, usually cardiac related), and ‘10 Hz’ (7–13 Hz).
Almost all units (73/74) had respiratory modulation of their discharge, either phasic (firing during only one phase) or tonic (firing during both the inspiratory (I) and expiratory (E) phases). The most common pattern consisted of tonic I-modulated firing. When the vagi were intact, lung afferent input during I greatly reduced CSy unit and nerve discharge, as evaluated by the no-inflation test.
The incidence of unit-nerve coherent fast rhythms (3 Hz or 10 Hz ranges) depended on unit discharge pattern: they were present in an appreciable fraction (30/58 or 52 %) of tonic units, but in only a small fraction (2/15 or 13 %) of phasic units.
When baroreceptor innervation (aortic depressor amd carotid sinus nerves) was intact, rhythms correlated to the cardiac cycle frequency were found in 20/34 (59 %) of units. The cardiac origin of these rhythms was confirmed by residual autospectral and partial coherence analysis and by their absence after baroreceptor denervation.
The 10 Hz coherent rhythm was found in 7/34 units when baroreceptor innervation was intact, where it co-existed with the cardiac-locked rhythm; after barodenervation it was found in 9/50 neurones. Where both rhythms were present, the 10 Hz component was sometimes synchronized in a 3:1 ratio to the 3 Hz (cardiac-related) frequency component.
The tonic and phasic CSy units seem to form distinct populations, as indicated by the differential responses to cardiac-related afferent inputs when baroreceptor innervation is intact. The high incidence of cardiac-related correlation found among tonic units suggests that they are involved in vasomotor regulation. The high incidence of respiratory modulation of discharge suggests that the CSy units may be involved in regulation of the nasal vasculature and consequent ventilation-related control of nasal airway resistance.
The aim of ascertaining the neural origin of vasomotor tone has led to many investigations involving analysis of discharge patterns in sympathetic nerves. In particular, there has been interest in analysis of slow and fast rhythms in sympathetic nerve activities (Malpas, 1998), where three types of rhythm have been described: respiratory (Cohen & Gootman, 1970; Häbler et al. 1994, 1999); ‘3 Hz’ (2–6 Hz range), often correlated to the cardiac rhythm (Gebber et al. 1990; Kocsis, 1995; Kocsis et al. 1999); ‘10 Hz’ (7–13 Hz range), which is sometimes locked 2:1 or 3:1 to the cardiac rhythm (Cohen & Gootman, 1970; Cohen et al. 1991; Barman et al. 1992, 1995). The interest of these rhythms is that they may furnish information about the interactions between brainstem neurones that generate sympathetic outflow (Barman et al. 1995).
Among studies of cervical sympathetic (CSy) nerve discharges, there have been several where recordings were taken of spike activity of individual fibres (Gilbey et al. 1986; Bachoo & Polosa, 1987; Boczek-Funcke et al. 1992a,b) and of their postsynaptic targets (McLachlan et al. 1998). These studies were usually done in anaesthetised animals, which might have resulted in elimination of any 10 Hz rhythm; moreover, they usually employed crosscorrelation analysis (or spike-triggered averaging) rather than spectral analysis.
Therefore we undertook a study of individual CSy fibre activities in decerebrate unanaesthetised cats, in order to ascertain: (a) the relation of unit activity to population activity (phrenic and CSy nerve discharges); (b) the incidence of different types of rhythm; (c) the co-existence of different types of rhythm in an individual unit's activity and (d) the correlation of rhythmic activity to the cardiac rhythm transmitted by baroreceptor afferents. We used both time-domain (correlation) analysis and frequency-domain (autospectral and coherence) analysis. In order to evaluate the influence of cardiac-related afferent input on CSy rhythmic components, we used partial coherence analysis (Gebber et al. 1994a,b; Cohen et al. 1995; Kocsis, 1995, 1999; Rosenberg et al. 1998).
Our main observations were: (a) CSy unit activity showed a high incidence of respiratory modulation of discharge arising from the central respiratory pattern generator, as well as strong inhibition by vagal afferents; (b) with intact baro-innervation, the majority of units had a rhythm correlated to the cardiac cycle; (c) the CSy units seemed to comprise two different populations: tonic (mainly inspiratory modulated) units had a high incidence of correlations (coherences) to fast rhythms (3 Hz and 10 Hz) in population (nerve) activity, whereas phasic (mainly inspiratory) units had a low incidence of such correlations.
A preliminary report of this work has been published in abstract form (Huang et al. 1992).
METHODS
Experimental preparation
Experiments were done on cats (2.5-3.5 kg) that were decerebrated at the midcollicular level, using standard methods (Kirsten & St John, 1978). Surgical preparation was performed under 3–5 % halothane anaesthesia; the adequacy of anaesthesia was attested by absence of movements and blood pressure changes. After decerebration and completion of surgery, the halothane was removed, and the animals were paralysed by infusion of gallamine triethiodide (5 mg kg−1 h−1). Artificial ventilation was applied via a tracheal cannula by a cycled-triggered pump (CTP) system (Cohen & Feldman 1984) or by a mechanical ventilator connected to a 1–2 cm expiratory load. End-tidal CO2 level (monitored by an infrared analyser) was maintained at 4–6 % by varying ventilation and the composition of the input gas mixture (0–5 % CO2 in 100–95 % O2). The use of high O2 mixtures avoided occurrence of hypoxaemia. To maintain fluid balance and keep systolic blood pressure > 100 mmHg, the animals were perfused with 0.9 % saline containing 5 % glucose (4 mg kg−1 h−1). Rectal temperature was kept at 37–39°C by use of a heating pad. At the end of the experiment, the animals were given an overdose of sodium pentobarbital (pentobarbitone).
Recordings
The phrenic (Phr) nerve, and bilateral preganglionic cervical sympathetic (CSy) nerve, vagus, aortic depressor and carotid sinus nerves were dissected free and prepared for recording or sectioning. With the cat in a supine position, the Phr and CSy nerves were mounted on bipolar electrodes and immersed in a mineral oil pool. The Phr and left CSy nerve activities were recorded monophasically (bandpass 1–5000 Hz) after crushing the peripheral end of the nerve onto the distal electrode wire. Initially in the experiment, right CSy nerve activity (CSyN) was also recorded monophasically. Later, small bundles containing one or two active fibres were dissected from the right CSyN and recorded with a monopolar electrode; and the central portion of the whole-nerve bundle (containing the fibre axons) was placed on a bipolar electrode to obtain a diphasic recording. Two monopolar electrodes were sometimes used to record simultaneously from two separately dissected fibres.
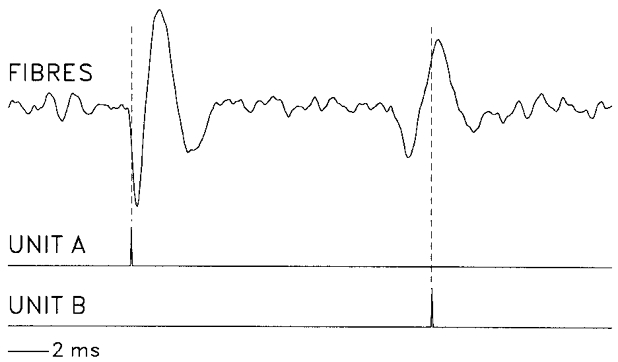
An example of a recording from a bundle that contained two different isolated units (A and B) is shown in Fig. 1. The two units had distinct spike shapes, which allowed the use of two time-amplitude discriminators to derive different pulse trains for each unit.
Figure 1. Display of CSy fibre activity and spike-derived pulses.
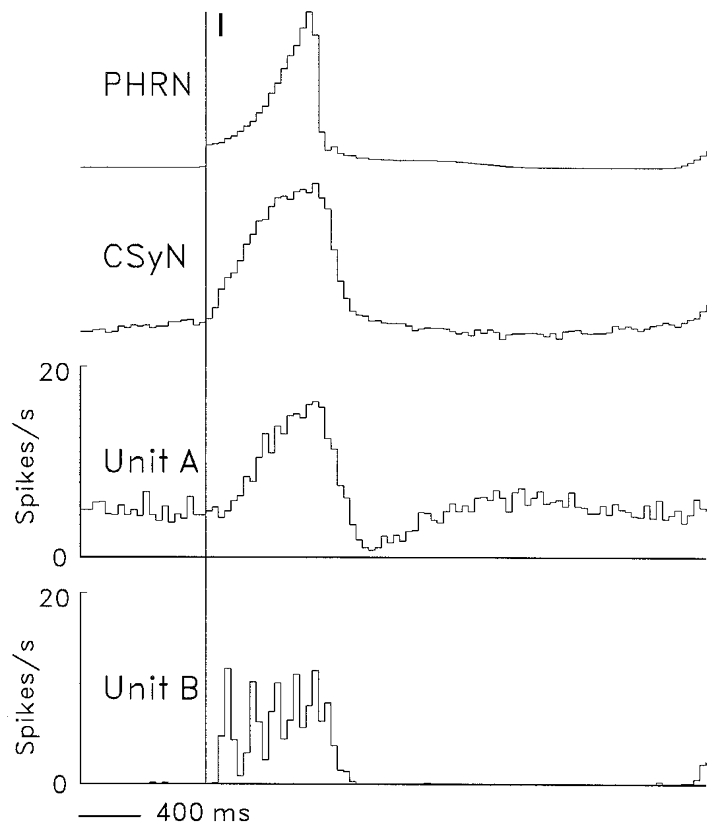
Digitized display (FIBRES, top), using 0.05 ms bins, of original spike recording (negativity upward) from a nerve strand that contained two distinguishable spike populations: Unit A, I-tonic unit; unit B, I-phasic unit (cf. firing patterns of units A and B in Fig. 5). Using two time-amplitude discriminators, a pulse train (pulse trigger points, vertical dashed lines) was derived for each spike population (bottom traces, units A and B).
Tape recordings were taken of several analogue signals: (a) Phr nerve activity; (b) left and right CSyN activities; (c) spike activity of individual CSy fibres dissected from the right CSyN; (d) intratracheal pressure (ITP); (e) femoral arterial blood pressure (BP). Recordings were also taken of pulse signals. (a) Pulses marking the onset of the inspiratory (I) and expiratory (E) phases, derived from Phr discharge by specialized circuitry (Cohen, 1968); (b) pulses derived from CSy fibre spikes by means of a time-amplitude discriminator and (c) blood pressure pulses (PrP), marking the cardiac cycle, derived from the systolic phase of BP by a time-amplitude discriminator.
Recordings were taken in three conditions: (1) with intact vagi and baroreceptor (aortic depressor and carotid sinus) nerves; (2) vagotomised with intact baroreceptor nerves and (3) vagotomised after section of baroreceptor nerves.
Vagal inputs
The influence of airway stretch receptors was studied by use of the no-inflation test (Cohen & Feldman, 1984). In ventilation with the CTP system, a logic gate coincident with the neural I phase (Cohen, 1968) is used to open a valve connecting a low-pressure gas source to the tracheal cannula, so that lung inflation is delivered during the Phr discharge burst. At the end of I, the valve connects the tracheal cannula to the expiratory load, allowing the lungs to deflate. In the no-inflation test, the logic gate is inactivated during an I phase, so that the lungs are not inflated and the usual phasic vagal afferent discharge does not occur. In a typical protocol, this test was repeated every fifth respiratory cycle for a total of at least 10 tests (usually 20–30). The effect of no-inflation on unit activity was evaluated by comparing the number of spikes during corresponding times of the control (inflation) vs. test (no-inflation) I phases (cf. Fig. 7 below); the difference was evaluated by the Student's unpaired t test with P < 0.05 taken as significant.
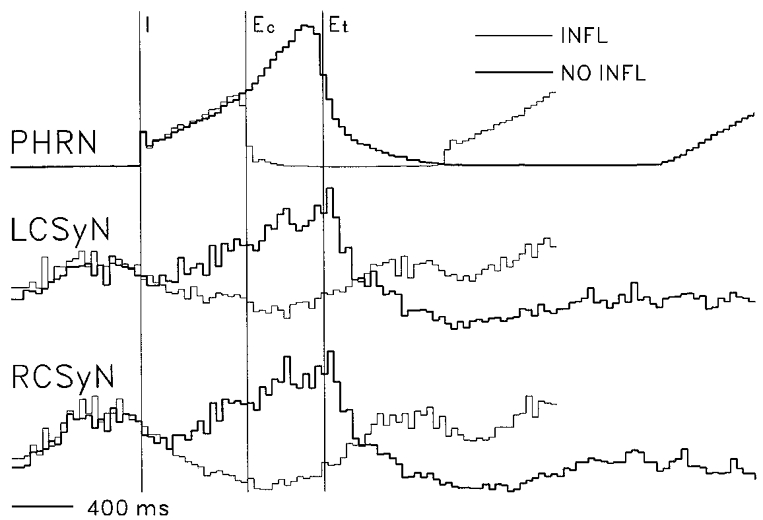
Figure 7. Effects of withholding lung inflation on CSy nerve and unit activities.
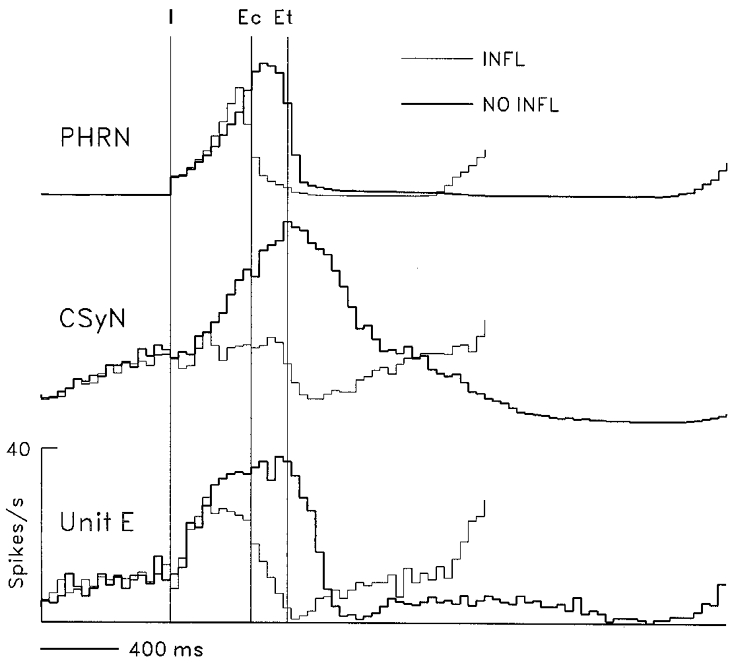
Effects of withholding lung inflation on rectified PHRN and CSyN activity and on discharges of unit E, which had a tonic I-modulated pattern. CTHs (40 ms bins) were derived using 68 I-pulse triggers for inflation cycles (thin lines) and for no-inflation cycles (thick lines). Vertical lines: I, start of I phase; Ec, start of control E phase (end of inflation I phase); Et, start of test E phase (end of no-inflation I phase).
Data analysis
The data were played back and digitized with an A-D converter board (RC Electronics), using a sampling rate of 2500 Hz.
Cycle-triggered histograms
Cycle-triggered histograms (CTHs) consisting of 40 ms bins and using the I or E pulses as triggers were computed for unit and rectified nerve activities. The rectified signals were obtained by a digital algorithm that subjected the data to 40 Hz high-pass filtering followed by full-wave rectification. To determine whether the respiratory rhythm seen in the CTH was statistically significant, the η2 method of Orem & Dick (1983) was used; this method compares variance of unit spike incidence across cycle portions with variance across cycles.
Autocorrelation histograms
Autocorrelation histograms (ACHs) of unit pulses, using the original sampling bins of 0.4 ms, were computed to verify that recordings had been obtained from a single unit, as was indicated by absence of counts in the early portion (< 2 ms) of the ACH, corresponding to the refractory period. If the number of counts in this portion of the ACH was greater than 5 % of the maximum bin count in the ACH, the recording was deemed to be contaminated by spikes of other units and was therefore discarded.
Crosscorrelation histograms
Crosscorrelation histograms (CCHs) of three types were computed. (a) The CCHs (2 ms bins) of the PrP signal (derived from the BP signal) vs. the CSyN signals, the unit pulses, or the BP signal were computed to detect synchronization of the signals to the cardiac cycle. CCHs of this type also allowed verification that the CSyN signal did not contain cardiac-related motion artifacts, which would be indicated by a waveform similar to arterial pressure (Gootman & Sica, 1994). (b) The CCHs (2 ms bins) of the unit pulse signal vs. the CSyN signals or a second unit pulse signal were computed to detect synchronization of the unit's activity to the latter signals. (c) CCHs (0.4 ms bins) of the unit pulse signal (from the peripheral recording electrode) vs. the ipsilateral CSyN signal (from the central recording electrode) were computed to ascertain the conduction velocity of the fibre.
Frequency-domain analysis
Autospectra of the signals and coherence spectra for pairs of signals were computed using methods previously described (Christakos et al. 1991). However, the segmentation method in this study differed from that used in the earlier study: the computations were not done on data gated during portions of the respiratory cycle (such as the I or E phases), but rather on data segments of a continuous data stream. This was done to allow adequate spectral frequency resolution for the relatively slow rhythms of sympathetic discharges (e.g < 15 Hz in contrast to the inspiratory high-frequency oscillations at 50–100 Hz). The continuous data stream was divided into segments of 1024 data points with bin duration of either 4 or 8 ms, derived by summation of data values in the original 0.4 ms sampling bins. This procedure acted as a low-pass filter with effective sampling rates of 250 or 125 Hz respectively, resulting in segments of duration 4.096 or 8.192 s and spectral frequency bins of 0.24 or 0.12 Hz, respectively.
Partial coherence analysis
Partial coherence analysis was carried out following the methods of Bendat & Piersol (1986), Gebber et al. (1994b), Cohen et al. (1995) and Rosenberg et al. (1998). The partial coherence for triplets of signals and the residual autospectrum for pairs of signals were computed. The partial coherence for a pair of signals (A and B) in relation to a third signal (C), abbreviated as (A-B)C is obtained from the ordinary coherence of A and B by ‘partialization’ with a third signal (C), i.e. the ‘influence’ of the third signal on the coherence between the two signals is mathematically removed (equations in Gebber et al. 1994b and Cohen et al. 1995). The residual autospectrum for a signal (A) in relation to another signal (B), abbreviated as (A auto)B, is obtained from the autospectrum of A by ‘partialization’ with the the A-B coherence. The partial coherence and the residual autospectrum were used to evaluate the effect of cardiac-related afferent input on the CSy unit-nerve coherences and the unit autospectrum, respectively.
In order to evaluate the statistical significance of spectral estimates, the upper 95 % confidence value, which depends on the number of data windows used, was calculated (Jenkins & Watts, 1968; Halliday et al. 1995). Coherence or autospectral values above the confidence value were deemed to be significantly different from zero at the 95 % confidence level (P < 0.05).
Summary statistics for variables are stated as means ±s.d.
RESULTS
In seven gallamine-paralysed decerebrate cats, recordings were taken from one or both preganglionic cervical sympathetic (CSy) nerves and from 74 individual CSy fibres dissected from a CSy nerve.
Rhythmic patterns in CSy nerve activity
Monophasic recordings from the efferent CSy nerve trunk revealed the presence of several types of rhythm in the discharge. An example of the recorded patterns is shown in Fig. 2. The recordings were from a decerebrate paralysed cat with intact vagus and baroreceptor (aortic depressor and carotid sinus) nerves, which was ventilated with a cycle-triggered pump system, where lung inflation is delivered during the time of the phrenic (Phr) discharge burst. The discharge in both left and right CSy nerves consisted of bursts of activity synchronized to the cardiac cycle, as can be seen in Fig. 2B. This activity was modulated by the central respiratory rhythm: in cycles where lung inflation was applied, the bursts occurred predominantly during the late expiratory (E) and the early inspiratory (I) phases.
Figure 2. Display of recorded signals.
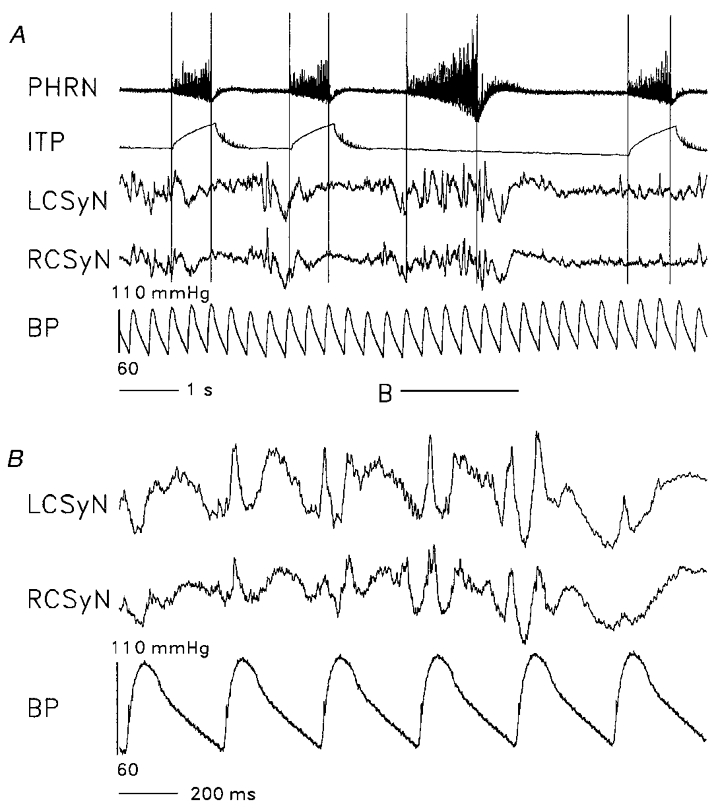
Digitized display (bin duration 0.4 ms) of recordings from a preparation with intact vagi and intact baroreceptor innervation (aortic depressor and carotid sinus nerves), which was ventilated by the cycle-triggered pump system. Nerve recordings (negativity upward): PHRN, phrenic nerve; LCSyN, left cervical sympathetic nerve; RCSyN, right cervical sympathetic nerve. ITP: intratracheal pressure. BP: arterial (aortic) blood pressure. ITP, LCSyN, and RCSyN signals were low-pass filtered at 30 Hz before display. A, ITP trace shows that lung inflation was withheld during the third inspiratory (I) phase. Vertical lines: locations of start and end of the I phases. Horizontal line (B) marks the data segment within which the no-inflation I phase is located, displayed on a faster time base in panel B.
This pattern was changed during a no-inflation test (third cycle in Fig. 2), where inflation was not delivered during one I phase, as indicated by the intratracheal pressure (ITP) trace. This procedure resulted in prolongation of the I phase and the following E phase, as well as considerable augmentation of CSyN activity during the longer I phase. As indicated in Fig. 2B, CSyN activity during this I phase consisted of a mixture of cardiac-related and higher frequencies.
The properties of these CSy rhythms were ascertained by means of frequency-domain analysis using the Fast Fourier Transform (FFT), as shown in Fig. 3. The blood pressure (BP) autospectrum (D) shows peaks at the frequency of the cardiac cycle (3.1 Hz) and its harmonics. The CSyN autospectra (A and B)and the LCSyN-RCSyN (left and right) coherence (C) show several frequency components: (a) respiratory (0.5 Hz); (b)cardiac (3.1 Hz) and its harmonics (6.1, 9.0 Hz); and (c) ‘10 Hz’ (a broad peak around a maximum at 10.4 Hz).
Figure 3. Spectral analysis of recorded signals.
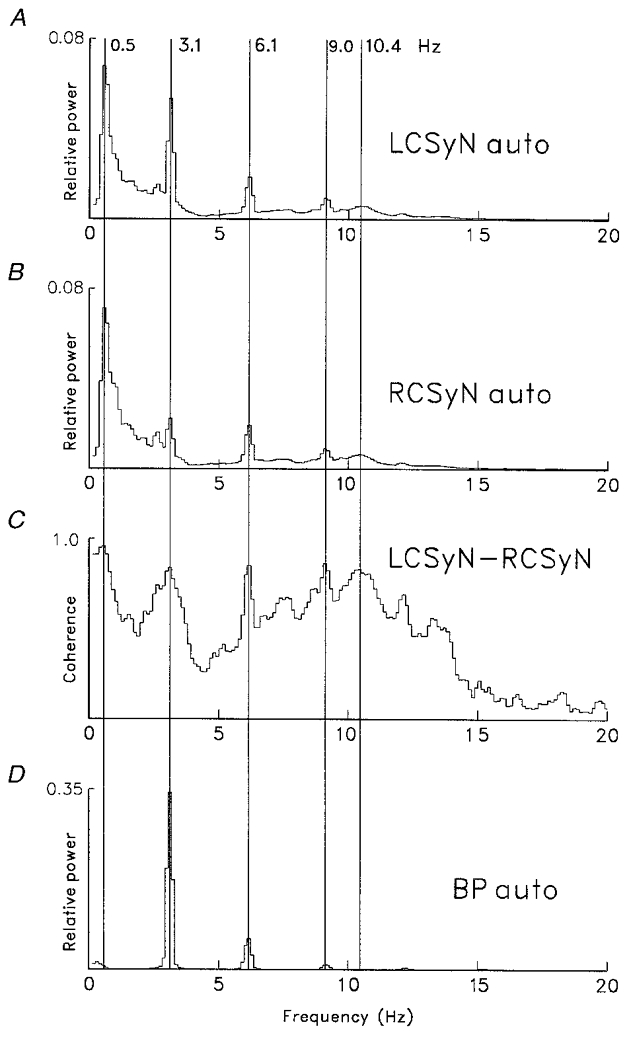
Autospectra of signals (A, LCSyN; B, RCSyN; D, BP) and the LCSyN-RCSyN coherence spectrum (C). Spectra (derived from recording run used for Fig. 2) based on 60 segments of duration 8.096 s (sampling interval 8 ms, frequency resolution 0.12 Hz bin−1), containing 1490 cardiac cycles. Vertical lines mark peaks corresponding to different coherent rhythms: respiratory (0.5 Hz); cardiac (3.1 Hz) and its first and second harmonics (6.1, 9.0 Hz); ‘10 Hz’ (10.4 Hz).
In all seven preparations, CSyN activities had respiratory rhythm. When baroreceptor innervation was intact, all preparations had cardiac rhythm in CSyN activities. In 6/7 preparations, a 10 Hz (9.2-10.7 Hz) rhythm was observed, both before and after baroreceptor denervation; thus, in these preparations, before denervation there was a mixture of cardiac and 10 Hz rhythms.
Respiratory modulation of CSy nerve and unit activities
The pattern of respiratory modulation of CSyN discharge in the preparation of Fig. 2 is shown in the cycle-triggered histograms (CTHs) of Fig. 4. In inflation I phases (inflation applied during I), the level of CSyN activity during I and early E was below the tonic activity level occurring later in E. During no-inflation I phases, discharge increased markedly, so that the pattern became ‘I-tonic’: tonic discharge with superimposed ramp activity during I. This effect suggests an inhibitory action of lung afferent input at some level(s) of the system, the increase of I activity during no-inflation being due to disinhibition.
Figure 4. Effect of withholding lung inflation on nerve activities.
Cycle-triggered histograms (CTHs) showing effects of withholding lung inflation on rectified PHRN, LCSyN, and RCSyN activities (based on recording run of Fig. 2). CTHs (40 ms bins) were derived using I pulse triggers (n= 41). Vertical lines: I, start of I phase; Ec, start of control expiratory (E) phase (end of inflation I phase); Et, start of test E phase (end of no-inflation I phase). CTH lines: thin, inflation cycles; thick: no-inflation cycles.
The 74 recorded CSy units had a variety of discharge patterns. When recording was done with vagi intact, a unit's classification was defined by its discharge pattern during no-inflation.
Two common types of discharge pattern are shown in the CTHs of Fig. 5, which were derived from a simultaneous recording of two units (A and B) in a vagotomised cat. Unit A had a tonic I-modulated discharge pattern, with increase of activity above the tonic level during I, followed by reduction of activity below the tonic level during early E. The tonic I-modulated pattern was also shown by CSyN activity. In contrast, unit Bhad a phasic discharge pattern, with activity occurring only during I.
Figure 5. Respiratory-modulated discharge patterns of a tonic and a phasic CSy I unit.
CTHs showing average rectified PHRN and CSyN activities and activities of two simultaneously recorded CSy units exemplifying two major types of respiratory pattern in a vagotomized cat. Unit A: ‘tonic’ discharge with superimposed respiratory modulation consisting of excitation during I and depression in early E. Unit B: ‘phasic’ discharge, consisting of firing that occurs only during I. CTHs (40 ms bins) were derived using 184 I pulse triggers (vertical line).
Two other discharge patterns, recorded in different cats, are shown in Fig. 6a. Unit C (Fig. 6a) had an expiratory- inspiratory (EI) pattern, whereas unit D had (Fig. 6B) an inspiratory-expiratory (IE) pattern.
Figure 6. Respiratory-modulated discharge patterns of an expiratory-inspiratory and an inspiratory-expiratory CSy I unit.
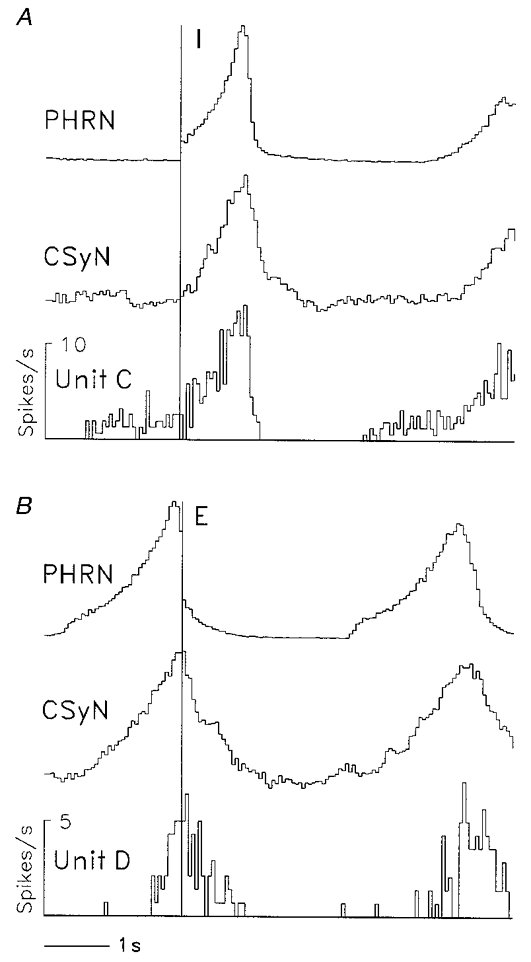
CTHs (40 ms bins) showing two additional respiratory-modulated patterns of CSy unit activity, together with rectified PHRN and CSyN activity, in a vagotomized cat. A, expiratory-inspiratory (EI) pattern of unit C activity; 39 I-pulse triggers (vertical line). B, inspiratory-expiratory (IE) pattern of unit D activity; 35 E-pulse triggers (vertical line).
The effect of vagal afferent input, as ascertained by the no-inflation test, on activity of an I-modulated tonic neurone (unit E) is shown in Fig. 7. It can be seen that removal of phasic lung afferent input produced an increase of I phase duration (47 %), an increase of CSyN activity and an increase (15 %, P < 0.001) of unit E activity during the comparison time period (time in the no-inflation I phase corresponding to the inflation I phase duration, indicated by lines I and Ec).
Of a total of nine units tested with no-inflation, seven had significant increases of firing during the comparison time period. One of these units had no significant respiratory modulation during inflation cycles but acquired respiratory modulation during no-inflation cycles, as indicated by the η2 test (Orem & Dick, 1983).
The incidence of different types of discharge pattern of CSy units is shown in Table 1. It is remarkable that almost all units (73/74) had respiratory modulation of their discharge. The ‘phasic’ units (n= 15) discharged exclusively during one phase (most commonly the I phase); the ‘tonic’ units (n= 58, 79 %) discharged during both I and E phases. The subgroups of the latter group were distinguished by discharge profile: (a) the I-tonic neurones had an augmenting discharge during I followed by a relatively rapid discharge decrement during early E; (b) for the IE neurones, the slope of decrement during early E was approximately the same as the slope of augmentation during I; and (c) the EI neurones had a slowly augmenting discharge during late E. The incidence of the various types of discharge pattern was similar in different cats. No relation was apparent between the distribution of discharge types and other variables, such as the duration of the respiratory cycle.
Table 1.
Discharge patterns of cervical sympathetic units and incidence of significant coherences to cervical sympathetic nerve activity
| Pattern | Number of units | Number of units coherent | Examples in Figures |
|---|---|---|---|
| Inspiratory-phasic | 12 | 1 | Fig. 5, unit B |
| Expiratory-phasic | 3 | 1 | — |
| Total phasic | 15 | 2 | — |
| Expiratory-inspiratory | 18 | 5 | Fig. 6, unit C |
| Inspiratory-expiratory | 14 | 6 | Fig. 6, unit D |
| Inspiratory-tonic | 26 | 19 | Fig. 5, unit A; Fig. 7, unit E; Fig. 9, unit F |
| Total tonic | 58 | 30 | — |
| Nonrespiratory | 1 | 0 | — |
| Total | 74 | 32 | — |
Table 1 also shows that the incidence of significant short-time scale (3 Hz or 10 Hz range) CSy unit-nerve coherences depended on discharge pattern: it was low (2/15) for phasic neurones and high for tonic neurones (30/58). This difference was highly significant (P= 0.00434) by the χ2 test.
Conduction velocities of CSy units
In order to ascertain the conduction velocity of a CSy fibre, a crosscorrelation histogram (CCH) was computed between the spike-derived pulses and the activity of the CSyN bundle central to the fibre recording electrode. The CCHs for units AandB of Fig. 5 are shown in Fig. 8. The peak in each CCH indicates the average of axon spikes in the bundle that are correlated to the peripheral spikes of the unit, and the lag of this peak equals the conduction time. From this and the measured distance between the peripheral and central electrodes the conduction velocity was calculated. For unit A this velocity was 5.1 m s−1; and for unit B it was 5.6 m s−1.
Figure 8. Determination of conduction velocity of two CSy units by means of crosscorrelation.
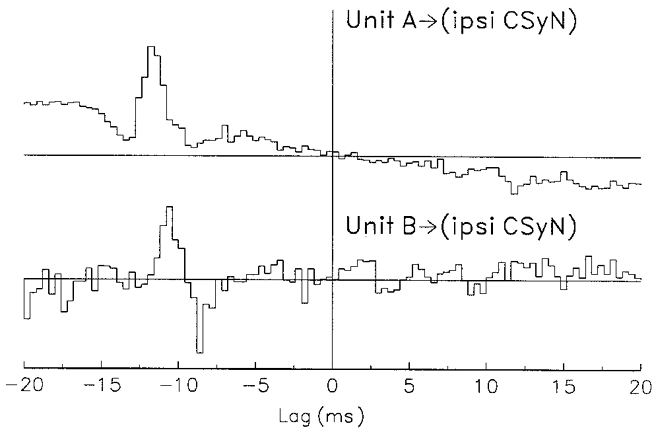
Measurement of fibre conduction velocities by means of crosscorrelation histograms (CCHs) between spike-derived pulses (from units A and B of Fig. 5) and activity of the ipsilateral CSyN trunk (negativity upward). Top: unit A; bottom: unit B. Isolated spike activity was recorded by peripheral electrode pair; nerve trunk activity was recorded by central electrode pair. Bin duration: 0.4 ms. Note the waveform derived from axon spikes in the nerve trunk, which precede the peripherally recorded spikes. No. of spikes: unit A, 5010; unit B, 1353. Latency (ms): unit A, 12.8; unit B, 11.6. Conduction velocity (m s−1): unit A, 5.1; unit B, 5.6.
Conduction velocity was measured for 55 fibres in five cats: the mean velocity was 5.2 ± 2.2 m s−1, with range of 0.9-12.5 m s−1 and median of 4.9 m s−1. The values of conduction velocity were comparable with those reported in an earlier study of preganglionic sympathetic fibres at T3 (Dembowsky et al. 1986). Finally, conduction velocity did not differ significantly (χ2 test) between phasic units (n= 10, range 3.1-9.6 m s−1, mean 5.8 ± 2.2 m s−1) and tonic units (n= 45, range 0.9-12.5 m s−1, mean 5.0 ± 2.3 m s−1).
Cardiac modulation of CSy nerve and unit discharges
In cats with intact baroreceptor innervation, all CSyN activities had cardiac-related rhythm, as indicated by a prominent peak in the coherence of the nerve signal with a cardiac-related (BP or PrP) signal. The range of cardiac cycle frequencies was 2.9-4.6 Hz, with predominant incidence in the 3.0-4.0 Hz range. Of 34 CSy units recorded, 59 % (20/34) had cardiac rhythm in their discharges, as indicated by a significant coherence between unit activity and a cardiac-related signal: the range of unit-cardiac coherence values was 0.05-0.38, with mean of 0.23 ± 0.10. For these units, the unit-nerve coherence had a prominent narrow peak (range of widths 0.5-0.8 Hz) at the cardiac frequency, the range of coherence values being 0.06-0.60. Partialization of the unit-nerve coherence with the cardiac-related signal resulted in elimination of this narrow coherence peak. In addition, for three of these units that were recorded both before and after barodenervation, the denervation eliminated the coherence peak.
An example of time-domain analysis of CSyN and unit activity in relation to cardiac rhythm is shown in Fig. 9 for unit F, whose activity rhythm was correlated to the cardiac cycle. The CTHs (top) show that the unit's pattern consisted of I-modulated tonic discharge that resembled global CSyN activity.
Figure 9. Time-domain analysis of cardiac rhythm in CSy nerve and unit activities.
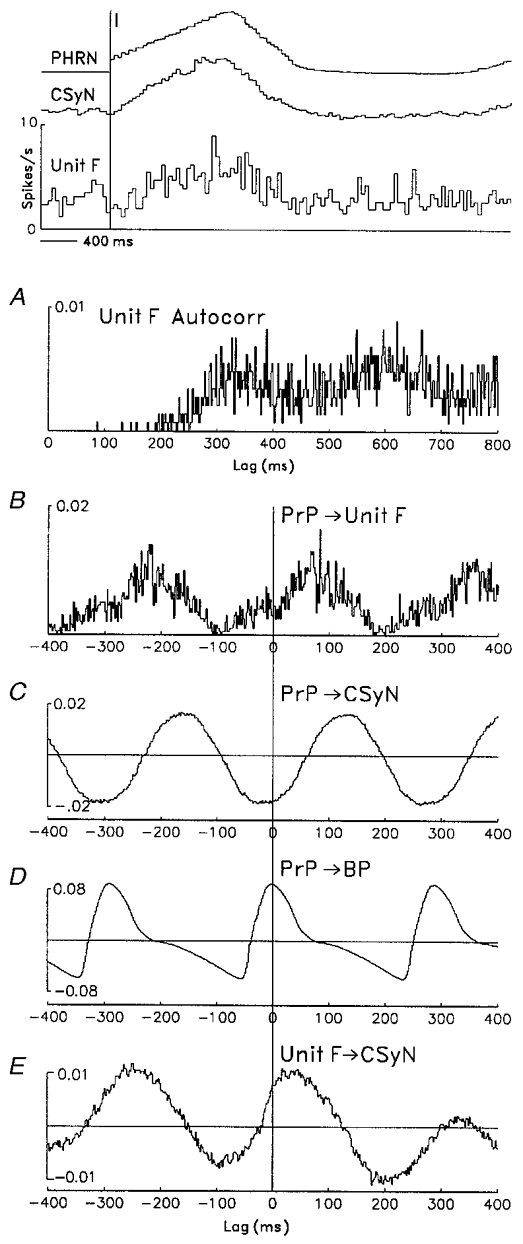
Time-domain analysis (auto- and crosscorrelations, 2 ms bins) showing cardiac-related rhythm in discharges of a CSy unit (unit F) and in CSyN activity (signal negativity upward). Top: CTHs (40 ms bins), derived using 128 I-pulse triggers (vertical line), show the unit's tonic I-modulated firing pattern, as well as average PHRN and CSyN rectified activities. A: autocorrelation histogram of unit F firing, derived from 1448 spikes, shows a rhythmic component (period ≈284 ms) corresponding to the cardiac frequency. B–D: crosscorrelation histograms (CCHs) of PrP (blood pressure pulses (n= 2767) derived from arterial blood pressure (BP) signal) vs. several signals: unit F activity (B), CSyN activity (C), and BP (D). E: CCH of unit F pulses vs. CSyN activity. Note that all CCHs show cardiac-related rhythm that is common to the signals.
The autocorrelation of unit activity (Fig. 9a) shows a rhythmic component with a period of 284 ms that was the same as the cardiac cycle period. This component is seen more clearly in the CCHs of the arterial pressure pulse (PrP) vs. unit F activity (B) and of PrP vs. CSyN activity (C), which indicate that the unit and nerve signals were correlated to the cardiac cycle. In D, the CCH of PrP vs. blood pressure (BP) verifies the accuracy of the pulse signal and allows us to ascertain the phase relations of unit F and CSyN activity to blood pressure: the maximum of these signals occurred during diastole. Moreover, the oscillation in the PrP-CSyN CCH was not derived from cardiac-related motion in the recording, since its shape differs from the shape of the PrP-BP CCH. Finally, the unit-nerve CCH (E) shows that the cardiac-related rhythm was common to the unit and nerve activities.
The frequency-domain analysis, including partial coherence and residual autospectrum analysis, of the cardiac rhythm in CSyN and unit F activities is shown in Fig. 10. The autospectra of CSyN activity (A) and unit F activity (B) have peaks at the cardiac frequency (3.4 Hz), whose value is shown in the PrP autospectrum (D). The CSyn autospectrum also has a respiratory-related peak at 0.6 Hz. In the unit autospectrum, the cardiac-related peak arises from a background level of spectral values without distinct peaks; this observation is consistent with the fact that the average unit F discharge rate is 1.8 s−1, a value lower than the cardiac frequency of 3.4 Hz, suggesting that the latter peak originates from intervals of appropriate values that are scattered among intervals whose durations are randomly distributed. (In addition, the unit autospectrum has peaks at 1.6 and 2.7 Hz, frequencies that are unrelated to the respiratory and cardiac frequency components.)
Figure 10. Partial coherence analysis of cardiac rhythm in activity of the CSy unit of Fig. 9.
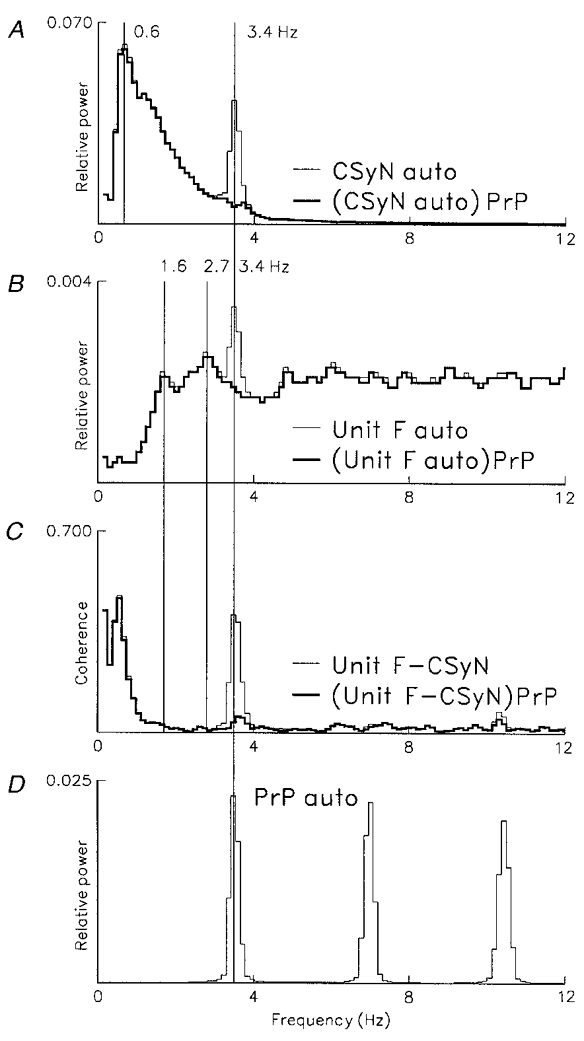
Frequency-domain analysis of cardiac-related rhythm in CSyN and unit F activity, based on 98 segments sampled at 8 ms intervals (0.12 Hz bin−1), using 1449 unit F pulses (mean discharge rate 1.8 s−1). D: autospectrum of blood pressure pulses (PrP, n= 2770), showing cardiac frequency peak (3.4 Hz) and its harmonics. A: thin line, autospectrum of CSyN activity showing cardiac frequency component at 3.4 Hz and respiratory-related component at 0.6 Hz; thick line, residual autospectrum, (CSyN auto)PrP, obtained by partialization of autospectrum with the PrP-nerve coherence. B: thin line, unit F autospectrum, showing cardiac-related frequency peak at 3.4 Hz and unrelated peaks at 1.6 and 2.7 Hz; thick line, residual autospectrum, (unitF auto)PrP, obtained by partialization with the PrP-unit coherence. C: thin line, coherence of unit and CSyN activities (unitF-CSyN), showing common (correlated) cardiac rhythm (peak at 3.4 Hz); thick line, partial coherence, (unitF-CSyN)PrP, where cardiac-related peak is eliminated by partialization with the PrP signal.
The residual CSyN and unit autospectra (A and B, thick lines) show that this type of partialization eliminates autospectral peaks at the cardiac frequency. Similarly, in the partial unit-nerve coherence (C, thick line) the cardiac-related peak (3.4 Hz) is eliminated by partialization with the PrP signal.
In another type of unit-spectral pattern, the cardiac-related peak is associated with a broader spectral component in the same frequency range, as illustrated for unit G (an I-tonic neurone) in Fig. 11. The autospectra of CSyN activity (A) and unit G activity (B) have narrow peaks at the cardiac frequency (3.2 Hz), whose value is shown in the PrP autospectrum (D). (An additional broad peak at 1.1 Hz in the CSyN autospectrum (A), as well as a broad peak in the unit autospectrum (B) at 5.9 Hz, are unrelated to the respiratory and cardiac frequency components.) As in the case of unit F, in the unit G autospectrum the cardiac-related peak arises from a background level of spectral values over a wide range of frequencies. The mean discharge rate of unit G was 1.0 s−1, a value lower than the cardiac frequency of 3.2 Hz.
Figure 11. Partial coherence analysis of cardiac rhythm in discharge of another CSy unit having associated 3 Hz activity not modulated by the cardiac rhythm.
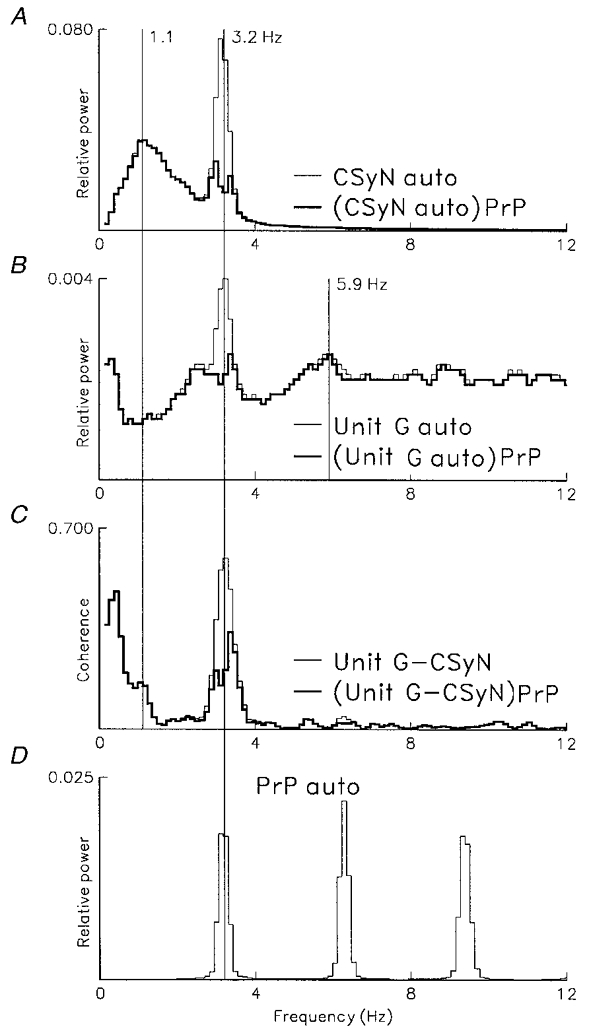
Frequency-domain analysis of cardiac-related rhythm in CSyN activity and activity of another unit (unit G, having an I-tonic pattern), using 811 pulses (mean discharge rate 1.0 s−1). Computation parameters as for Fig. 10. D: autospectrum of blood pressure pulses (PrP, n= 2496), showing cardiac frequency peak (3.2 Hz) and its harmonics. A: thin line, autospectrum of CSyN activity showing cardiac frequency component at 3.2 Hz and unrelated peak at 1.1 Hz; thick line, residual autospectrum, (CSyN auto)PrP, obtained by partialization with the PrP-nerve coherence. B: thin line, unit G autospectrum, showing cardiac-related frequency peak at 3.2 Hz and unrelated peak at 5.9 Hz; thick line, residual autospectrum, (unitG auto)PrP, obtained by partialization with the PrP-unit signal. C: thin line, coherence of unit and CSyN activities (unitG-CSyN), showing common (correlated) cardiac rhythm (peak at 3.2 Hz); thick line, partial coherence, (unitG-CSyN)PrP, where cardiac-related peak is reduced by partialization with the PrP signal. Note that in A–C a broad peak centred about the cardiac frequency remains after partialization.
In contrast to the unit F and CSyN spectra in Fig. 10, partialization of the unit G and nerve autospectra in Fig. 11 (A and B, thick lines) eliminated only the narrow-peaked portion of the spectrum around the cardiac frequency, but there remained a broad-peaked portion of the spectrum which can be interpreted as arising from an intrinsic brainstem rhythm that is independent of baroreceptor input, although it is in the same frequency range as the cardiac frequency. Similarly, in the partial unit-nerve coherence (C, thick line), a portion of the spectral peak around the cardiac frequency remained; this frequency component is presumably independent of baroreceptor input.
In cases where a unit's firing was recorded both before and after barodenervation, the effects of denervation were very similar to the effects of partialization with the cardiac-related signal, as illustrated for unit H (an I-tonic neuron) in Fig. 12. The residual unit H autospectrum with intact baro-innervation (Aa) is almost identical to the unit H autospectrum after barodenervation (Ab). Similarly, the unit- nerve partial coherence with intact baro-innervation (Ba) is almost identical to the ordinary (not partialized) unit-nerve coherence after barodenervation (Bb).
Figure 12. Comparison of effects of partialization and barodenervation on cardiac-related CSy rhythm.
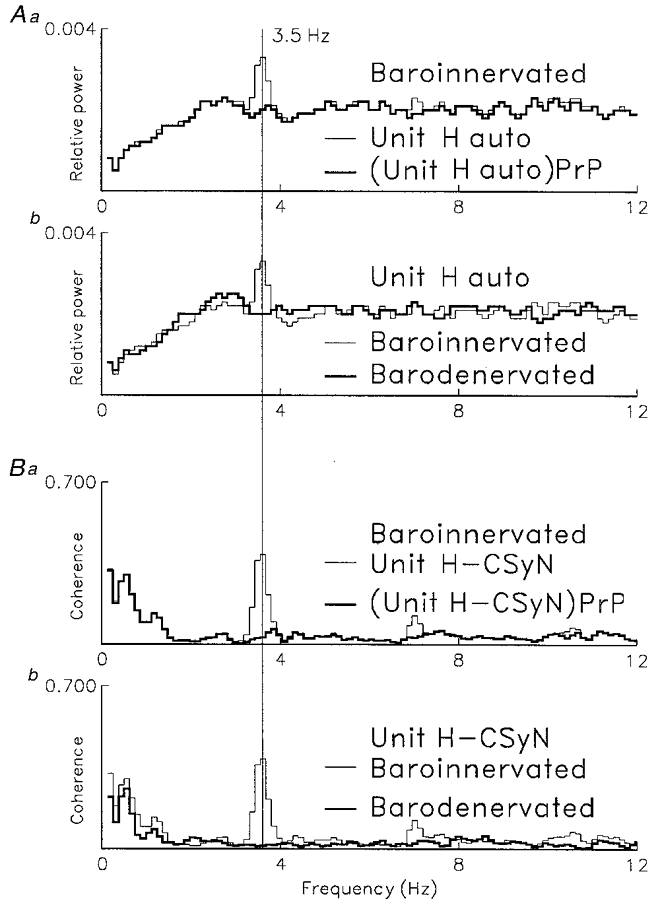
Comparison of effects of barodenervation and of partialization with the blood pressure signal (PrP) on cardiac-related rhythm in activity of another unit (unit H, I-tonic neuron). A: comparison of effects on unit H autospectrum of: (Aa) partialization with the PrP-unit coherence; (Ab) barodenervation. B: comparison of effects on unit H-CSyN coherence of: (Ba) partialization with the PrP signal; (Bb) barodenervation. Note that effects of mathematical and physical denervation are almost identical. Computation parameters as for Fig. 10. Unit H firing: baro-innervated: 1372 spikes, mean firing rate 1.7 s; barodenervated: 1473 spikes, mean firing rate 1.8 s−1. Number of PrP pulses: baro-innervated, 2794; barodenervated, 2934.
Similar results were obtained for two additional units that had a cardiac-related discharge rhythm before barodenervation and then lost this rhythm after barodenervation (cf. the example in Figs 15 and 16 below).
Figure 15. Autospectral analysis of 3 Hz and 10 Hz rhythms in CSy nerve and unit activities.
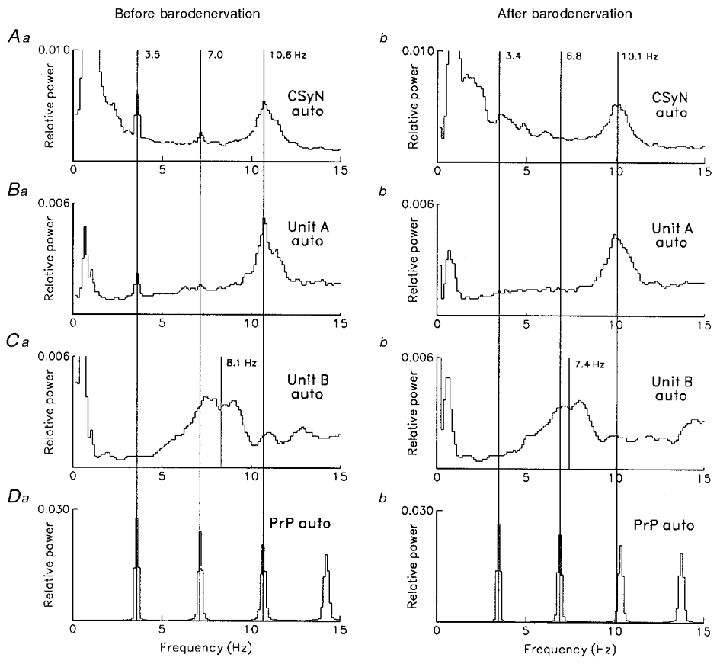
Frequency-domain autospectral analysis (98 segments, 8 ms sampling interval, 0.12 Hz bin−1) for CSyN and units A and B of Fig. 14, comparing activity rhythms before (left) vs. after (right) carotid sinus denervation. Da and b: PrP autospectra before (a) and after (b) denervation. A, B and C: autospectra of CSyN, unit A, and unit B, respectively, before (a) and after (b) denervation. Number of pulses (unit A, unit B and PrP, respectively): before: 5012, 1353 and 2850; after: 3791, 1311 and 2748. Mean firing rates before and after, respectively: unit A: 6.2 and 4.7 s−1; unit B: 1.7 and 1.6 s−1.
Figure 16. Coherence analysis of 3 Hz and 10 Hz rhythms in CSy nerve and unit A activities.
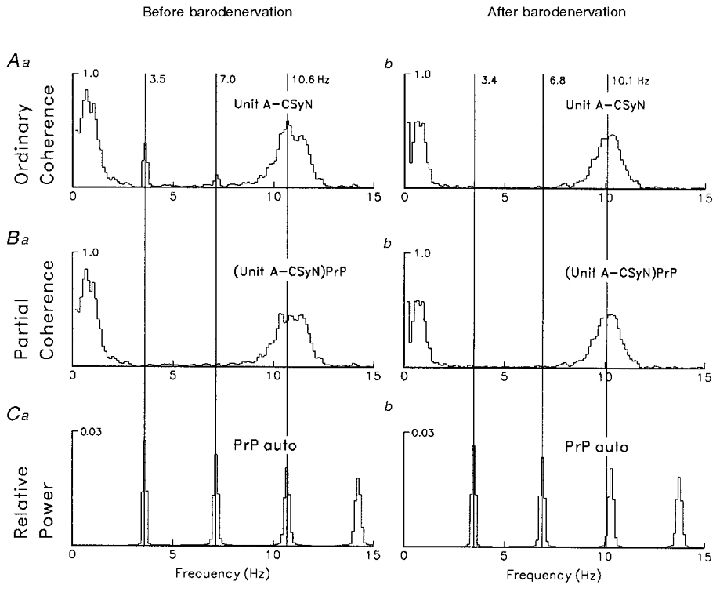
Frequency-domain coherence analysis (computation parameters as in Fig. 15) for CSyN and unit A, comparing activity rhythms before (left) vs. after (right) carotid sinus denervation. Ca and b: PrP autospectra before (a) and after (b) denervation. Aa and b: unit-CSyN coherences, showing disappearance of the cardiac-related component after denervation. Ba and b: unit-CSyN partial coherences (partialization with PrP signal), showing that the effect of partialization on the cardiac component is similar to the effect of barodenervation.
Of 20 units that had a cardiac-related rhythm in the unit-CSyN coherence, 18 had distinct peaks in the unit autospectrum. Application of partialization to this population produced two patterns of response. In pattern 1 (Figs 10 and 12), partialization completely eliminated the cardiac-related frequency peak; in pattern 2 (Fig. 11), after partialization a broad frequency peak near the cardiac frequency was still present. For partialization producing residual unit autospectra, 6/18 units showed pattern 2; whereas for partialization of unit-CSyN coherence 11/18 units showed pattern 2, with a reduction of peak coherence value ranging from 44 to 89 %. This discrepancy of incidence between the two kinds of partialization is probably due to the greater sensitivity of coherence analysis for detection of weak rhythmic components. This supposition is supported by the observation that units with pattern 1 had smaller 3 Hz coherence peak values than units with pattern 2 (ranges 0.08-0.38 vs. 0.30-0.60, respectively).
Recordings were taken from 50 CSy units after baroreceptor denervation. Of these, four units had significant unit-CSyN coherence in the 3 Hz range (2.9-3.4 Hz), with 0.08-0.20 range of peak coherence values; and nine units had significant coherence in the 10 Hz range (9.3-10.7 Hz), with 0.05-0.46 range of peak coherence values. However, no units had a cardiac-related rhythm.
The distributions of autospectral peak frequencies for three groups of units, recorded in two different conditions (before and after barodenervation), are shown in Fig. 13. For each unit, the frequency of the autospectral peak having maximum amplitude was ascertained.
Figure 13. Distributions of autospectral frequencies of CSy units in relation to cardiac rhythm.
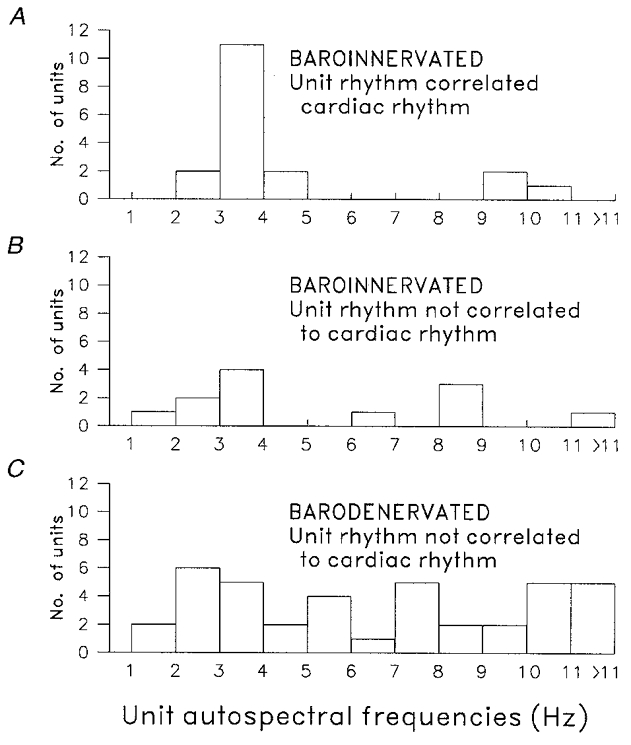
Distributions of dominant autospectral frequencies of CSy units in three different conditions. A, carotid sinus baroreceptor innervation intact, units (n= 18) with activity correlated to cardiac rhythm. B, carotid sinus baroreceptor innervation intact, units (n= 12) with activity not correlated to cardiac rhythm. C, after carotid sinus baroreceptor denervation, units (n= 39) with activity not correlated to cardiac cycle.
Figure 13a (intact baro-innervation, cardiac-correlated units) shows that, of 20 such units, 18 had a discernible maximum frequency peak (range 2.2-10.7 Hz, mean 4.5 ± 2.4, median 3.4 Hz). It can be seen that 11 of 18 units had autospectral peaks in the range 3.0-4.0 Hz, corresponding to cardiac cycle frequencies. Three units had frequency peaks > 9.0 Hz, corresponding to the second harmonic of cardiac cycle frequency. Figure 13B (intact baro-innervation, units not cardiac correlated) shows that, of 14 units, 12 had a discernible autospectral peak (range 1.2-13.4 Hz, mean 5.4 ± 3.5, median 3.8 Hz). Of these 12, four units had maximum autospectral peaks in the cardiac frequency range (3.0-4.0 Hz), even though their activity was not correlated to the cardiac cycle. Thus, on average both correlated and non-correlated units' firing had similar autospectral properties. Figure 13C (after barodenervation, units not cardiac correlated) shows that, of 50 units, 39 had a discernible autospectral peak (range 1.0 to 25.8 Hz, mean 7.5 ± 5.4, median 6.8 Hz). However, there was no distinct structure in the distribution of frequencies.
10 Hz rhythms in CSy unit activities
After barodenervation 9/50 units had significant unit-nerve coherences in the 10 Hz range. With intact baro-innervation, of the 20 recorded CSy units that had cardiac-related coherence, seven had in addition a significant unit-CSyN coherence peak in the 10 Hz range (9.0-12.7 Hz). After partialization with a cardiac-related signal, the 3 Hz component was eliminated in the partial coherence, but the 10 Hz component was not changed. For two units recorded both before and after barodenervation, the denervation produced a result similar to partialization, as shown below in Figure 16.
The time-domain analysis of Figure 14 is based on a simultaneous recording of two CSy units (those of Fig. 5) before baroreceptor denervation. The CTHs (top) show the I-modulated tonic pattern of unit A and the phasic-I pattern of unit B. Unit A firing had both cardiac-related and 10 Hz rhythms, whereas unit B firing had an intrinsic rhythm independent of the former rhythms. The ACHs of unit activity (Figure 14Aa and b) show prominent rhythms in these units' firing. In the unit A ACH (Aa) a very strong rhythm with period 94 ms is apparent, but the cardiac-related rhythm becomes apparent only in the unit autospectrum (Figure 15Ba). In the unit B ACH (Figure 14Ab), a moderately strong rhythm with a period 124 ms can be seen. The CCHs of the cardiac-related signal (PrP) vs. unit activity show that: unit A firing (Ba) was strongly locked to the cardiac rhythm in a 3:1 relation (i.e. 3 cycles of unit rhythm to 1 cardiac cycle); whereas unit B's rhythmic firing (Bb) was completely uncorrelated with the cardiac rhythm, as indicated by the flatness of the CCH. The CCH of PrP vs. CSyN activity (D) shows a mixture of 3:1 and 1:1 cardiac locking, the phase relation to the arterial pressure cycle being indicated by the PrP-BP CCH (C). Finally, the CCHs of unit vs. CSyN activity show the 10 Hz rhythm common to unit A and CSyN discharges (Ea) and the absence of a rhythm common to unit B and CSyN discharges (Eb). (The slow drift in the latter two CCHs indicates the common respiratory rhythm of the unit and nerve activities.)
Figure 14. Time-domain analysis of 3 Hz and 10 Hz rhythms in CSy nerve and unit discharges.
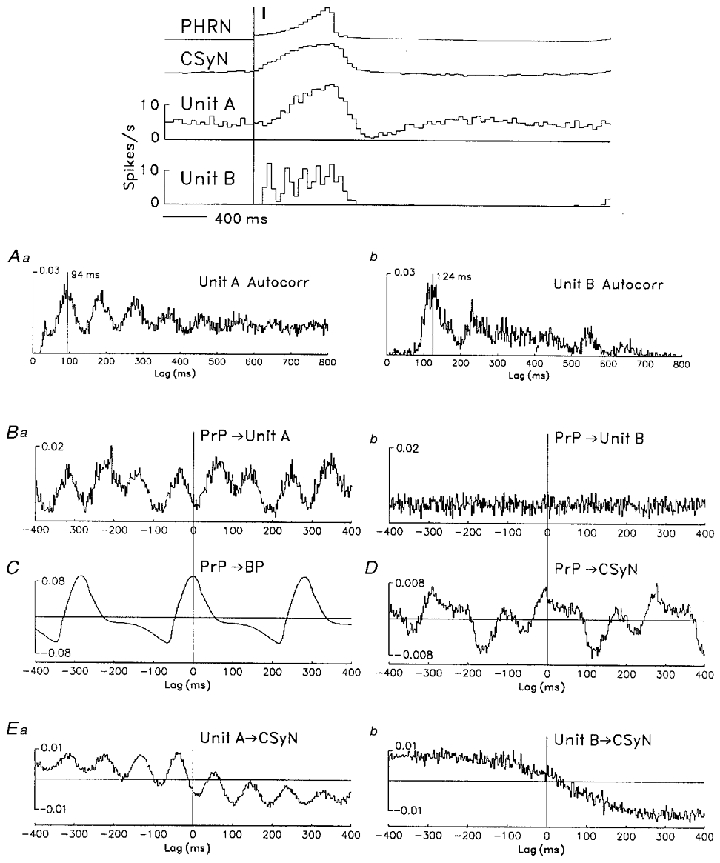
Time-domain analysis (auto- and crosscorrelations, 2 ms bins) of rhythms in discharges of the two simultaneously recorded CSy units of Fig. 5 (unit A, left column; unit B, right column). Top: CTHs show tonic I-modulated pattern of unit A and phasic I pattern of unit B, together with rectified PHRN and CSyN activities. Aa and b: autocorrelation histograms of unit firing show rhythmic components (unit A: 5012 spikes, 94 ms period; unit B: 1353 spikes, 124 ms period). Ba and b: CCHs of PrP (2850 pulses) vs. unit activities show correlation of unit A rhythm with the cardiac rhythm (Ba) and lack of such correlation for unit B (Bb). C: CCH of PrP vs. arterial pressure (BP). D: CCH of PrP vs. CSyN activity shows mixture of 10 Hz and cardiac rhythms. Ea and b: CCHs of unit vs. CSyN activity show correlated rhythm in unit A and nerve activities (Ea) and the lack of such correlation for unit B activity (Eb).
Frequency-domain analysis of unit A, unit B, and CSyN activity (Figs 15 and 16) allows a more precise specification of the unit activity rhythms and their relations to CSyN rhythms in two different conditions: before and after barodenervation.
In Figure 15, autospectra of the signals are shown before (left) and after (right) barodenervation. The autospectra of the PrP signal (Da andb) show that barodenervation had little effect on the cardiac rhythm (change of spectral peak from 3.5 to 3.4 Hz). For activity with intact baro-innervation, the CSyN (Aa) and unit A (Ba) autospectra show the presence of three rhythms that are common to nerve and unit activity: respiratory, cardiac at 3.5 Hz (together with two harmonics) and 10.6 Hz; the second harmonic of the cardiac rhythm (10.6 Hz) is superimposed on the broad 10.6 Hz peak. Barodenervation eliminated the cardiac-related peak and its two harmonics in both CSyN (Ab) and unit (Bb) autospectra without markedly affecting the 10 Hz component. In contrast, with intact baro-innervation the unit B autospectrum (Ca) had no cardiac-related peak but only a respiratory-related peak and a broad peak around 8.1 Hz; the latter peak was moderately affected by barodenervation (Cb), the midpoint of the peak being shifted to 7.4 Hz. The absence of correlation of unit B activity to either the 3 Hz (cardiac) rhythm or the 10 Hz rhythm was also seen in the unit-cardiac and unit-nerve coherences (not shown in a figure).
The effect of barodenervation on the coherence between unit A and CSyN activity is shown in Figure 16. For activity with intact baro-innervation (Aa), the coherence spectrum had three components common to the two signals: respiratory, cardiac (with two harmonics), and 10 Hz (10.6 Hz). After barodenervation the cardiac peak and its harmonics disappeared from the coherence (Ab). A similar disappearance of the cardiac component can be seen in the partial coherence, (unitA-CSyN)PrP, of Figure 16Ba, obtained before barodenervation by the mathematical operation consisting of partialization of the ordinary coherence with the cardiac signal (PrP).
For both units A and B, the mean firing rate was less than the dominant autospectral frequency. Thus, before denervation unit A's mean firing rate was 6.2 s−1 and its dominant autospectral peak frequency was 10.6 Hz. This suggests that the unit autospectral frequency arose from a subset of intervals around a mean interval of 94 ms (indicated by the first peak in the ACH of Figure 14Aa). Similar considerations apply to the firing of unit B.
The existence of the 10 Hz peak in unit-CSyN coherences is based on correlated frequency components in the two activities. For 5 of the 9 units with significant 10 Hz unit-CSyN coherence (after barodenervation) there was a discernible 10 Hz peak in the unit autospectrum, which arose on a background level of a relatively flat spectrum. This condition is analogous to pattern 2 partialization described above. However, for 4/9 units there was no discernible 10 Hz unit autospectral peak, a condition analogous to pattern 1 partialization. This difference is probably due to the greater sensitivity of coherence analysis in detection of weak rhythmic components, a supposition supported by the observation that units of pattern 1 type had smaller 10 Hz coherence peak values than units of pattern 2 type (ranges 0.05-0.15 vs. 0.25-0.46, respectively).
It can be seen from Figs 15 and 16 that the frequency of the 10 Hz component (10.6 Hz) in both unit A and CSyN spectra was about three times the cardiac cycle frequency (3.5 Hz). This relation is associated with the occurrence of 3:1 locking of the two frequency components that is observed in the CCHs (Figure 14Ba and D). As shown in Figs 15 and 16, the 10 Hz component was minimally affected (with respect to both peak frequency and amplitude) by barodenervation. Nevertheless, the locking of the 10 Hz rhythm to the cardiac cycle was completely eliminated by barodenervation, as indicated by the absence of the cardiac component in the unit and nerve autospectra and in the unit-nerve coherence; this was also indicated by the flatness of the PrP-unit A and the PrP-CSyN CCHs (not shown in a Figure). These results suggest that the 10 Hz rhythm arises independently of lower-frequency rhythms, but that it can be entrained to the cardiac cycle by baroreceptor afferent input.
DISCUSSION
In this study, we have used crosscorrelation and spectral methods to investigate three types of rhythm in CSy nerve and unit discharges: respiratory related, 3 Hz range (often correlated to the cardiac rhythm) and 10 Hz range.
Respiratory modulation of CSy discharges
We found that all CSyN discharges as well as discharges of almost all (73/74) CSy units had significant respiratory modulation. The incidence of respiratory modulation of CSy unit discharges was higher than in some earlier studies of this preganglionic population (Gilbey et al. 1986; Boczek-Funcke et al. 1992b). This difference may be due to the absence of general anaesthesia in the decerebrate preparations of the present study, since it has been shown that anaesthesia markedly reduces the degree of respiratory modulation of sympathetic nerve discharge (Gootman & Cohen, 1983).
In preparations with intact vagi that were ventilated with the cycle-triggered pump system (Cohen & Feldman, 1984), the effects of lung afferent input on CSy activities were studied by use of the no-inflation test, where the lung inflation normally coincident with the central I phase is withheld. This removal of phasic vagal afferent input resulted in an increase of CSyN discharge and of discharge of most (7/9) CSy units that were tested when the vagi were intact. This effect indicates that lung afferent input depresses those activities by means of inhibition somewhere in the networks(s) that transmit respiratory modulation to CSy neurones.
It is of interest that a similar depressant (inhibitory) action of lung afferent input is observed for discharge of rostral pontine I-modulated neurones in the nucleus parabrachialis medialis and Kölliker-Fuse regions (Shaw et al. 1989).
Cardiac-related modulation of CSy discharges
When baroreceptor innervation (aortic depressor and carotid sinus nerves) was intact, crosscorrelation and spectral methods showed that all CSyN discharges and a large fraction of discharges of CSy units (20/34 or 59 %) had a cardiac-related component in the 3 Hz range. A similar high incidence of cardiac modulation was reported in earlier studies (Gilbey et al. 1986; Boczek-Funcke et al. 1992a) that used time-domain (crosscorrelation) analysis.
For the units in the present study which were identified by crosscorrelation as having cardiac-modulated discharge, frequency-domain (autospectral and coherence) analysis allowed additional information to be obtained. In these cases, unit-nerve coherences showed that unit and nerve activities had a common cardiac-related component. For three of these units whose activity was recorded both before and after baroreceptor denervation, the cardiac component (3 Hz range) disappeared after denervation. For these units, application of partialization (derivation of residual autospectra and partial coherences) before barodenervation produced spectral patterns that were almost identical to those seen (without partialization) after barodenervation (Fig. 12). This similarity justifies the use of partialization analysis to produce a ‘mathematical denervation’ for evaluation of the influence of cardiac-related baroreceptor input.
With intact baro-innervation, autospectral analysis revealed the existence of cardiac-related rhythms, manifested as autospectral peaks at the cardiac frequency, in CSy unit firing. However, these spectra also showed that the cardiac-related peaks arose on a background of a spectral distribution range with power of approximately constant amplitude, sometimes together with peaks in the 2–10 Hz range whose frequencies were unrelated to cardiac frequency (Figs 10–12). Thus the autospectral distributions indicate that usually only a relatively small fraction of the power in unit discharge is concentrated at the cardiac frequency; as a consequence the mean discharge rate of the unit is usually less than heart rate.
After partialization with a cardiac-related signal about half (11/20) of the units with cardiac-related coherence still had discharge rhythms in the 3 Hz range of the unit-nerve coherence. The existence of such residual rhythms after partialization has been reported in several earlier studies of sympathetic nerve discharges (Gebber et al. 1994a; Kocsis, 1995; Kocsis et al. 1999). This result suggests that baroreceptor input entrains intrinsic brainstem rhythms in this range (Gebber et al. 1990) that are derived independently of baroreceptor input. Moreover, even when such distinct residual rhythms are not present, there is still considerable power in the frequency range corresponding to the cardiac cycle period, so that entrainment of interspike intervals to that period is possible.
When baroreceptor innervation was intact, 14/34 units (41 %) had no cardiac-related coherence. Autospectra of these unit activities showed that the average autospectral frequency for this population was comparable to that of the cardiac-correlated units (median 3.8 and 3.4 Hz, respectively). In fact, a considerable fraction of the units had autospectral frequency peaks in the most commmon frequency range (3.0-4.0 Hz) of the cardiac cycle frequency. Therefore the lack of entrainment shown by these units could be attributed to weakness of inputs from brainstem neurones having cardiac-related firing.
After barodenervation, there was of course no longer any coherence between unit activity (50 units) and the cardiac signal. The autospectra revealed that the average autospectral frequency peak of the 39 units that had such peaks was considerably higher (median 6.8 Hz) than that of the units recorded before denervation. This might indicate that baroreceptor input exerts a more general inhibitory effect on CSy unit activity, in addition to its entrainment of discharge rhythms.
10 Hz rhythms in CSy unit discharges
The 10 Hz rhythm in CSy unit firing, which was also present in CSyN activity and in the unit-nerve coherences, was found in 7/34 units before barodenervation and in 9/50 units after denervation. With intact barodenervation, it always coexisted with the 3 Hz cardiac-related rhythm. The occurrence of the 10 Hz rhythm in many types of sympathetic discharge has been reported earlier (Barman et al. 1992, 1995) and is considered to be an intrinsic feature of the sympathetic-generating system (Barman et al. 1995). Its presence in CSyN discharge has previously been reported (Cohen et al. 1991) and is now reported for CSy unit activity.
In cases where both the 3 Hz (cardiac related) and the 10 Hz frequency components were present in a unit's discharge, the 10 Hz component became entrained to the cardiac cycle (Figs 14–16). With either partialization (Figure 16, Aa vs. Ba) or barodenervation (Figure 16, Aa vs.Ab), the cardiac component and its harmonics were eliminated while the 10 Hz component was little changed. This indicates that the two rhythms arise independently, but may become entrained in a 3:1 relation by baroreceptor input. However, one must state the caveat that the linear spectral analysis used here would not reveal possible non-linear interactions of the two frequency components.
Functional implications
The presence of several different frequency components in CSy discharges indicates that there is convergence of different inputs on sympathetic-related neurones. The several inputs may be differentially activated under different conditions. The site of this convergence is not necessarily at the spinal level, since a similar mixture of components has been found in medullary sympathetic-related neurone activity (Cohen et al. 1998).
A relation between occurrence of fast coherent rhythms and the properties of the slow (respiratory) component is indicated by the observation that the incidence of fast rhythmic components (3 Hz or 10 Hz) in CSy unit-nerve coherences depended on the respiratory pattern of the unit activities. The incidence of the fast components was much higher among tonic (mainly I-modulated) than among phasic (mainly I) units: 52 vs. 13 %, respectively. This might be related to differences of target organ between the two groups of neurones.
Among the possible targets is the pupil (Borgdorff, 1975; Ohtsuka et al. 1988), since it is innervated by the CSyN and also has a strong respiratory modulation of its diameter. The strength of the modulation might suggest that it is produced by the phasic I neurones, which are strongly modulated. However, it seems that the pupillary respiratory modulation is not abolished by cervical sympathectomy (Borgdorff, 1975), so that it is presumably due to parasympathetic input.
For the group of tonic (mainly I-modulated) CSy units, the high incidence of cardiac-related coherences suggests that these neurones are involved in vasomotor regulation. A similar conclusion has been reached in a study of lumbar sympathetic neurones (Boczek-Funcke et al. 1992c). There have been several studies that demonstrated vasoconstrictor action of CSy activity on cranial blood vessels (Granstam & Nilsson, 1991; Lacroix et al. 1994), including important actions on nasal vasculature (Asakura et al. 1985; Maeda et al. 1994).
An interesting feature of CSy neurone activity is the high incidence of respiratory modulation of discharge. It cannot be determined how specific this feature is to CSy activity, since unitary studies of other sympathetic neurone populations that had a somewhat lower (yet still high) incidence were conducted under different conditions (Boczek-Funcke et al. 1992c).
However, one might speculate that this feature is related to existence of a strong innervation of the nasal vasculature, which produces increased vasoconstriction during the I phase and resultant dilation of the nasal airway. This would reinforce the effect of nostril dilation during I that is due to alae nasi contraction (Strohl, 1985) produced by facial nerve activity (Hwang et al. 1988). This concurrent dilation would be even stronger with removal of phasic lung afferent input during I (no-inflation test), which increases both CSy and alae nasi activity. In the intact animal with nasal congestion and consequent partial obstruction, a similar effect would aid ventilation.
In conclusion, the mixture of rhythmic activities (respiratory related, 3 Hz, 10 Hz) in CSyN and unit activities is broadly similar to that found in other sympathetic nerve activities, but may also have features that are specialized for this output.
Acknowledgments
This research was supported by the National Heart, Lung, and Blood Institute of the National Institutes of Health (Grant HL-27300).
References
- Asakura K, Hoki K, Kataura A, Kasaba T, Aoki M. Control of the nasal mucosa by the tonic activities of the automomic nervous system in dogs. Acta Otolaryngologica. 1985;100:450–455. doi: 10.3109/00016488509126570. [DOI] [PubMed] [Google Scholar]
- Bachoo M, Polosa C. Properties of the inspiration-related activity of sympathetic preganglionic neurones of the cervical trunk in the cat. The Journal of Physiology. 1987;385:545–564. doi: 10.1113/jphysiol.1987.sp016507. [DOI] [PMC free article] [PubMed] [Google Scholar]
- Barman SM, Gebber GL, Zhong S. The 10-Hz rhythm in sympathetic nerve discharge. American Journal of Physiology. 1992;262:R1006–1014. doi: 10.1152/ajpregu.1992.262.6.R1006. [DOI] [PubMed] [Google Scholar]
- Barman SM, Orer HS, Gebber GL. A 10-Hz rhythm reflects the organization of a brainstem network that specifically governs sympathetic nerve discharge. Brain Research. 1995;671:345–350. doi: 10.1016/0006-8993(94)01402-4. [DOI] [PubMed] [Google Scholar]
- Bendat JS, Piersol AG. Random Data. Analysis and Measurement Procedures. New York: Wiley; 1986. p. 566. [Google Scholar]
- Boczek-Funcke A, Dembowsky K, Häbler H-J, Jänig W, Mcallen RM, Michaelis M. Classification of preganglionic neurones projecting into the cat cervical sympathetic trunk. The Journal of Physiology. 1992a;453:319–339. doi: 10.1113/jphysiol.1992.sp019231. [DOI] [PMC free article] [PubMed] [Google Scholar]
- Boczek-Funcke A, Dembowsky K, Häbler H-J, Jänig W, Michaelis M. Respiratory-related activity patterns in preganglionic neurones projecting into the cat cervical sympathetic trunk. The Journal of Physiology. 1992b;457:277–296. doi: 10.1113/jphysiol.1992.sp019378. [DOI] [PMC free article] [PubMed] [Google Scholar]
- Boczek-Funcke A, Häbler H-J, Jänig W, Michaelis M. Respiratory modulation of the activity in sympathetic neurones supplying muscle, skin and pelvic organs in the cat. The Journal of Physiology. 1992c;449:333–361. doi: 10.1113/jphysiol.1992.sp019089. [DOI] [PMC free article] [PubMed] [Google Scholar]
- Borgdorff P. Respiratory fluctuations in pupil size. American Journal of Physiology. 1975;228:1094–1102. doi: 10.1152/ajplegacy.1975.228.4.1094. [DOI] [PubMed] [Google Scholar]
- Christakos CN, Cohen MI, Barnhardt R, Shaw C-F. Fast rhythms in phrenic motoneuron and nerve discharges. Journal of Neurophysiology. 1991;66:674–687. doi: 10.1152/jn.1991.66.3.674. [DOI] [PubMed] [Google Scholar]
- Cohen MI. Discharge patterns of brain-stem respiratory neurons in relation to carbon dioxide tension. Journal of Neurophysiology. 1968;31:142–165. doi: 10.1152/jn.1968.31.2.142. [DOI] [PubMed] [Google Scholar]
- Cohen MI, Barnhardt R, Shaw C-F. Interrelations between slow and fast rhythms in sympathetic discharge. In: Koepchen H-P, Huopaniemi T, editors. Cardiorespiratory and Motor Coordination. Berlin: Springer; 1991. pp. 9–15. [Google Scholar]
- Cohen MI, Feldman JL. Discharge properties of dorsal medullary inspiratory neurons: relation to pulmonary afferent and phrenic efferent discharge. Journal of Neurophysiology. 1984;51:753–776. doi: 10.1152/jn.1984.51.4.753. [DOI] [PubMed] [Google Scholar]
- Cohen MI, Gootman PM. Periodicities in efferent discharge of splanchnic nerve of the cat. American Journal of Physiology. 1970;218:1092–1101. doi: 10.1152/ajplegacy.1970.218.4.1092. [DOI] [PubMed] [Google Scholar]
- Cohen MI, Yu Q, Huang W-X. Preferential correlations of a medullary neuron's activity to different sympathetic outflows as revealed by partial coherence analysis. Journal of Neurophysiology. 1995;74:474–478. doi: 10.1152/jn.1995.74.1.474. [DOI] [PubMed] [Google Scholar]
- Cohen MI, Yu Q, Huang W-X. Coexistence of respiratory-related and fast sympathetic-related rhythms in discharges of medullary neurons. Society for Neuroscience Abstracts. 1998;24:1029. [Google Scholar]
- Dembowsky K, Czachurski J, Seller H. Three types of sympathetic preganglionic neurones with different electrophysiological properties are identified by intracellular recordings in the cat. Pflügers Archiv. 1986;406:112–120. doi: 10.1007/BF00586671. [DOI] [PubMed] [Google Scholar]
- Gebber GL, Barman SM, Kocsis B. Coherence of medullary unit activity and sympathetic nerve discharge. American Journal of Physiology. 1990;259:R561–571. doi: 10.1152/ajpregu.1990.259.3.R561. [DOI] [PubMed] [Google Scholar]
- Gebber GL, Zhong S, Barman SM, Orer HS. Coordination of the cardiac-related discharges of sympathetic nerves with different targets. American Journal of Physiology. 1994a;267:R400–407. doi: 10.1152/ajpregu.1994.267.2.R400. [DOI] [PubMed] [Google Scholar]
- Gebber GL, Zhong S, Barman SM, Paitel Y, Orer HS. Differential relationships among the 10-Hz rhythmic discharges of sympathetic nerves with different targets. American Journal of Physiology. 1994b;267:R387–399. doi: 10.1152/ajpregu.1994.267.2.R387. [DOI] [PubMed] [Google Scholar]
- Gilbey MP, Numao Y, Spyer KM. Discharge patterns of cervical sympathetic preganglionic neurones related to central respiratory drive in the rat. The Journal of Physiology. 1986;378:253–265. doi: 10.1113/jphysiol.1986.sp016218. [DOI] [PMC free article] [PubMed] [Google Scholar]
- Gootman PM, Cohen MI. Inhibitory effects on fast sympathetic rhythms. Brain Research. 1983;270:134–136. doi: 10.1016/0006-8993(83)90800-4. [DOI] [PubMed] [Google Scholar]
- Gootman PM, Sica AL. Spectral analysis: a tool for study of neonatal sympathetic systems. News in Physiological Sciences. 1994;9:233–236. [Google Scholar]
- Granstam E, Nilsson SFE. Effects of cervical sympathetic nerve stimulation and neuropeptide Y (NPY) on cranial blood flow in the cat. Acta Physiologica Scandinavica. 1991;142:21–32. doi: 10.1111/j.1748-1716.1991.tb09124.x. [DOI] [PubMed] [Google Scholar]
- Häbler H-J, Bartsch T, Jänig W. Rhythmicity in single fiber postganglionic activity supplying the rat tail. Journal of Neurophysiology. 1999;81:2026–2036. doi: 10.1152/jn.1999.81.5.2026. [DOI] [PubMed] [Google Scholar]
- Häbler H-J, Jänig W, Michaelis M. Respiratory modulation in the activity of sympathetic neurones. Progress in Neurobiology. 1994;43:567–606. doi: 10.1016/0301-0082(94)90053-1. [DOI] [PubMed] [Google Scholar]
- Halliday DM, Rosenberg JR, Amjad AM, Breeze P, Conway BA, Farmer SF. A framework for the analysis of mixed time series/point process data – Theory and application to the study of physiological tremor, single motor unit discharges and electromyograms. Progress in Biophysics and Molecular Biology. 1995;64:237–278. doi: 10.1016/s0079-6107(96)00009-0. [DOI] [PubMed] [Google Scholar]
- Huang W-X, Cohen MI, Barnhardt R. Respiratory and cardiac modulation of fast rhythms in cervical sympathetic unit and nerve activities. FASEB Journal. 1992;6:A1166. [Google Scholar]
- Hwang J-C, Chien C-T, St John WM. Characterization of respiratory-related activity of the facial nerve. Respiration Physiology. 1988;73:175–188. doi: 10.1016/0034-5687(88)90065-5. [DOI] [PubMed] [Google Scholar]
- Jenkins GM, Watts DG. Spectral Analysis and its Applications. Oakland: Holden-Day; 1968. p. 525. [Google Scholar]
- Kirsten EB, St John WM. A feline decerebration technique with low mortality and long-term homeostasis. Journal of Pharmacological Methods. 1978;1:263–268. [Google Scholar]
- Kocsis B. Baroreceptor influence on the relationships between discharges of different sympathetic nerves of the cat. The Journal of Physiology. 1995;482:687–696. doi: 10.1113/jphysiol.1995.sp020551. [DOI] [PMC free article] [PubMed] [Google Scholar]
- Kocsis B, Karlsson T, Wallin BG. Cardiac- and noncardiac-related coherence between sympathetic drives to muscles of different human limbs. American Journal of Physiology. 1999;276:R1608–1616. doi: 10.1152/ajpregu.1999.276.6.R1608. [DOI] [PubMed] [Google Scholar]
- Lacroix JS, Ulman LG, Potter EK. Sympathetic and parasympathetic interaction in vascular control of the nasal mucosa in anaesthetized cats. The Journal of Physiology. 1994;480:325–331. doi: 10.1113/jphysiol.1994.sp020362. [DOI] [PMC free article] [PubMed] [Google Scholar]
- Mclachlan EM, Häbler H-J, Jamieson J, Davies PJ. Analysis of the periodicity of synaptic events in neurones in the superior cervical ganglion of anaesthetized rats. The Journal of Physiology. 1998;511:461–478. doi: 10.1111/j.1469-7793.1998.461bh.x. [DOI] [PMC free article] [PubMed] [Google Scholar]
- Maeda M, Hayashida Y, Nakai M, Krieger AJ, Sapru HN. Cerebral vasoconstrictive response produced by chemical stimulation of the caudal ventrolateral medullary depressor area is mediated via the rostral ventrolateral medullary pressor area and the cervical sympathetic nerves. Journal of the Autonomic Nervous System. 1994;49:S25–29. doi: 10.1016/0165-1838(94)90082-5. [DOI] [PubMed] [Google Scholar]
- Malpas SC. The rhythmicity of sympathetic nerve activity. Progress in Neurobiology. 1998;56:65–96. doi: 10.1016/s0301-0082(98)00030-6. [DOI] [PubMed] [Google Scholar]
- Ohtsuka K, Asakura K, Kawasaki H, Sawa M. Respiratory fluctuations of the human pupil. Experimental Brain Research. 1988;71:215–217. doi: 10.1007/BF00247537. [DOI] [PubMed] [Google Scholar]
- Orem J, Dick T. Consistency and signal strength of respiratory neuronal activity. Journal of Neurophysiology. 1983;50:1098–1107. doi: 10.1152/jn.1983.50.5.1098. [DOI] [PubMed] [Google Scholar]
- Rosenberg JR, Halliday DM, Breeze P, Conway BA. Identification of patterns of neuronal connectivity-partial spectra, partial coherence, and neuronal interactions. Journal of Neuroscience Methods. 1998;83:57–72. doi: 10.1016/s0165-0270(98)00061-2. [DOI] [PubMed] [Google Scholar]
- Shaw C-F, Cohen MI, Barnhardt R. Inspiratory-modulated neurons of the rostrolateral pons: effects of pulmonary afferent input. Brain Research. 1989;485:179–184. doi: 10.1016/0006-8993(89)90681-1. [DOI] [PubMed] [Google Scholar]
- Strohl KP. Respiratory activation of the facial nerve and alar muscles in anaesthetized dogs. The Journal of Physiology. 1985;363:351–362. doi: 10.1113/jphysiol.1985.sp015715. [DOI] [PMC free article] [PubMed] [Google Scholar]