Abstract
Amperometric recordings were conducted to investigate the ability of hypoxia and anoxia to evoke quantal catecholamine secretion from isolated type I cells of the rat carotid body.
Hypoxia (PO2 8–14 mmHg) consistently failed to evoke catecholamine secretion from type I cells, when cells were perfused either at room temperature (21-24 °C) or at 35–37 °C, and regardless of whether Hepes- or HCO3−/CO2-buffered solutions were used.
Elevating extracellular [K+] caused concentration-dependent secretion from individual type I cells, with a threshold concentration of approximately 25 mM. In the presence of this level of extracellular K+, hypoxia (PO2 8–14 mmHg) caused a marked enhancement of secretion which was fully blocked by 200 μM Cd2+, a non-specific blocker of voltage-gated Ca2+ channels.
Anoxia (N2-equilibrated solution containing 0·5 mM dithionite) evoked exocytosis from type I cells when extracellular [K+] was 5 mM. This secretion was completely inhibited by removal of extracellular Ca2+, but was not significantly affected by Cd2+ (200 μM), Ni2+ (2 mM), Zn2+ (1 mM) or nifedipine (2 μM). Secretion was also observed when 0·5 mM dithionite was added to air-equilibrated solutions.
Anoxia also evoked secretion from chemoreceptive phaeochromocytoma (PC12) cells, which was wholly Ca2+ dependent, but unaffected by Cd2+ (200 μM).
Our results suggest that hypoxia can evoke catecholamine secretion from isolated type I cells, but only in the presence of elevated extracellular [K+]. This may be due to the cells being relatively hyperpolarized following dissociation. In addition, we have shown that dithionite evokes catecholamine release regardless of PO2 levels, and this release is due mainly to an artefactual Ca2+ influx pathway activated in the presence of dithionite.
The carotid body responds rapidly to reduced arterial O2 levels by increasing the discharge frequency of afferent chemosensory neurones, thereby relaying information to central respiratory centres, a process integral to the initiation of corrective changes in ventilation (Fidone & Gonzalez, 1986; Gonzalez et al. 1992, 1994). Detection of altered O2 levels within the carotid body occurs at the level of the type I (glomus) cell. Clusters of these cells lie in synaptic contact with afferent chemosensory nerve endings, and a hypoxic stimulus is generally believed to be transduced into altered afferent nerve activity via Ca2+-dependent release of neurotransmitters from type I cells onto afferent nerve endings (Gonzalez et al. 1994; Peers & Buckler, 1995; Peers, 1996; Lopez-Barneo, 1996). Several different neurotransmitters are known to co-exist in type I cells, the roles of which are poorly understood at present (Gonzalez et al. 1994; Prabhakar, 1994). However, the release of catecholamines (in particular dopamine) from the carotid body in response to hypoxia is particularly well documented, and is believed to be an essential step in chemotransduction (Obeso et al. 1992; Gonzalez et al. 1994; Urena et al. 1994).
The mechanism(s) by which hypoxia evokes neurotransmitter release from type I cells has received much attention over the past decade (Gonzalez et al. 1994; Peers & Buckler, 1995; Peers, 1996; Lopez-Barneo, 1996). Several workers have used patch-clamp recordings to show that hypoxia causes rapid and reversible inhibition of K+ channels in isolated type I cells (Lopez-Barneo et al. 1988; Delpiano & Hescheler, 1989; Peers, 1990; Stea & Nurse, 1991; Buckler, 1997) which leads to membrane depolarization sufficient to activate voltage-gated Ca2+ channels (Buckler & Vaughan-Jones, 1994a). The subsequent Ca2+ influx is then presumed to trigger neurosecretion. However, there is a notable lack of direct evidence demonstrating that hypoxia can evoke secretion from isolated type I cells of the rat. To date, only one group has reported hypoxia-evoked release of catecholamines, using type I cells isolated from carotid bodies of the rabbit (Urena et al. 1994; Montoro et al. 1996).
Most electrophysiological studies aimed at elucidating the mechanisms of chemotransduction have used type I cells isolated either from rabbit or rat carotid bodies. There are clear and important differences in the electrophysiological properties of cells from these two species (reviewed by Lopez-Lopez & Peers, 1997). Therefore, results gained from rabbit type I cells cannot necessarily be assumed to be representative of the chemoreceptive process in other species.
In the present study, we have investigated the ability of hypoxia to evoke catecholamine release from isolated rat type I carotid body cells. To this end, we have used amperometric recordings which allow the resolution of released contents of individual secretory vesicles (Wightman et al. 1991; Chow & Von Ruden, 1995). Our results support the idea that hypoxic stimulation of catecholamine release occurs via voltage-gated Ca2+ entry, but also suggest that secretory responses to hypoxia of type I cells may be influenced by their isolation. In addition, our findings indicate that the use of dithionite to achieve anoxic solutions generates artefactual responses.
METHODS
Cell isolation
Type I cells were isolated as previously described (e.g. Carpenter & Peers, 1997) from carotid bodies of Wistar rats aged 10–14 days (2 rats per preparation). Each rat was anaesthetized by breathing 5 % halothane (balance O2) through a face mask. When deeply anaesthetized, the carotid artery bifurcations were exposed and intact carotid bodies identified under a × 40 dissection microscope. They were removed and placed in ice-cold phosphate-buffered saline (PBS) containing collagenase (0.05 % w/v; type I, Worthington, activity 195 U mg−1), trypsin (0.025 % w/v; Sigma, activity 8600 U mg−1) and 50 μM Ca2+ until the required number of organs had been collected. All donor animals were killed by decapitation whilst still deeply anaesthetized. To achieve enzymatic dissociation of the organs, they were incubated in the PBS at 37°C for 20 min, after which they were teased apart using fine forceps, and were incubated at 37°C for a further 5 min. The tissue was then centrifuged at 200 g for 5 min, after which the pellet was washed with Ham's F-12 culture medium containing 84 u l−1 insulin, 100 i.u. l−1 penicillin, 100 μg ml−1 streptomycin and 10 % heat inactivated fetal bovine serum. The tissue was then centrifuged again, using the same parameters, and the resultant pellet resuspended in Ham's F-12 medium. The suspension was triturated and the resultant isolated cells were plated onto a poly-D-lysine-coated coverslip. Cells were maintained in a humidified incubator (5 % CO2 in air) and used for electrophysiological or electrochemical study the following day.
Phaeochromocytoma (PC12) cells were maintained in continuous culture and plated onto poly-D-lysine-coated coverslips for electrochemical recordings as previously described (Taylor & Peers, 1999).
Experimental solutions
In most experiments reported here, fragments of coverslip with attached cells were transferred to a recording chamber (vol. ca 80 μl) and perfused under gravity (1-2 ml min−1) with a solution of composition (mM): NaCl 135, KCl 5, MgSO4 1.2, CaCl2 2.5, Hepes 5 and glucose 10 (pH 7.4) at room temperature (21-24°C). To prevent activation of swelling-activated Cl− currents (Carpenter & Peers, 1997), the osmolarity of the perfusate was increased to 300 mosmol l−1 by addition of sucrose. In some cases (Fig. 1) this solution was warmed to 35–37°C, but pH was maintained at 7.4. In other studies, a HCO3−-buffered solution was employed, composed of (mM): NaCl 119, KCl 4.7, KH2PO4 1.17, MgSO4 1.17, NaHCO3 25, CaCl2 2.5 and glucose 5.5 (pH 7.4) either at 35–37°C or at 21–24°C (in the latter case, the NaHCO3 concentration was reduced to 24 mM to maintain pH at 7.4). Normoxic, Hepes-buffered solutions were air-equilibrated, and normoxic HCO3−-buffered solutions were gassed with 5 % CO2 in air. Hypoxic, Hepes-buffered solutions were gassed with N2, and hypoxic HCO3−-buffered solutions were gassed with 5 % CO2, 95 % N2. In Ca2+-free solutions, 1 mM EGTA replaced CaCl2. In experiments where the K+ levels were raised, equimolar substitution of KCl for NaCl was employed.
Figure 1. Hypoxia does not evoke catecholamine release from isolated rat type I carotid body cells.
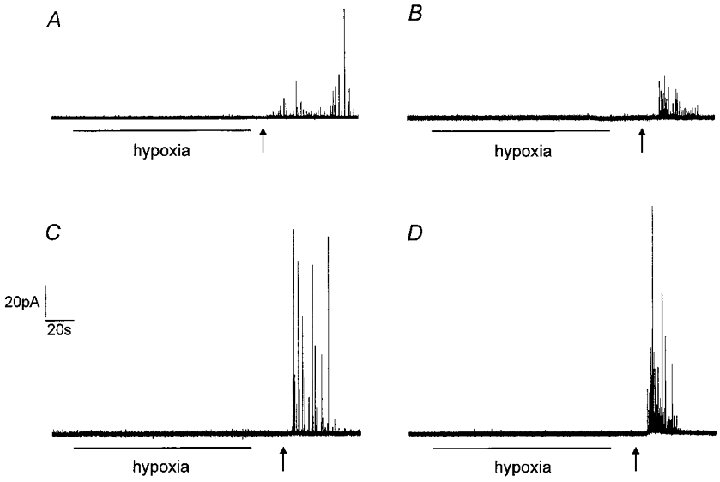
Example amperometric recordings from type I cells exposed to hypoxia (PO2 8–14 mmHg) for the period indicated by the horizontal bar, and then to normoxic solution containing 50 mM K+, beginning at the time point indicated by the arrow. Cells were either perfused at 21–24 °C (A and C) or 35–37 °C (B and D) with extracellular solution buffered either with Hepes (A and B) or HCO3−/CO2 (C and D). Note the lack of secretory response to hypoxia in all cases. The presence of an intact secretory apparatus was confirmed in each cell by the application of 50 mM K+. Scale bars apply to all traces.
Amperometry
Carbon fibre microelectrodes (proCFE, Axon Instruments or Dagan Instruments; 5 μm diameter) were positioned adjacent to individual type I cells and were polarized to +800 mV to allow oxidation of released catecholamine. Resulting currents were recorded using an Axopatch 200A amplifier (with extended voltage range) or a VA10 amplifier (NPI Electronics), filtered at 1 kHz and digitized at 2 kHz before storage on computer. All acquisition was performed using a Digidata 1200 interface and Fetchex software from the pCLAMP 6.0.3 suite (Axon Instruments). Catecholamine secretion was apparent as discrete spike-like events, each corresponding to the released contents of a single vesicle of catecholamine (Wightman et al. 1991; Chow & Von Ruden, 1995). Secretory events were never seen unless the electrode was polarized and adjacent to a cell. Quantification of release was achieved by determining spike number or frequency using Mini Analysis Program (Synaptosoft Inc., Leonia, NJ, USA). This allowed visual inspection of each event so that artefacts could be rejected from analysis. The same software allowed quantification of quantal size, from clearly resolved individual events by integration of each event to obtain charge, Q, as previously described (Finnegan et al. 1996):
where n is the number of electrons released on oxidation of a catecholamine molecule (n = 2 for both dopamine and noradrenaline), F is Faraday's constant, C is the concentration of catecholamine in the vesicle and V is the vesicle volume. Thus if C is assumed constant, Q is proportional to V and so Q1/3 is proportional to vesicle radius.
The same amperometric equipment was also used to monitor PO2 levels in the recording chamber, except that the polarity of the microelectrode was reversed to -800 mV (see Mojet et al. 1997). The time course of fall of PO2 in the recording chamber was highly reproducible for any given degree of hypoxia or anoxia.
Membrane potential recordings
Membrane potential was recorded using the amphotericin-perforated patch technique (Rae et al. 1991). Patch pipettes (resistance 4–7 MΩ) were filled with (mM): KCl 120, CaCl2 1, MgSO4 2, NaCl 10, EGTA 11 and Hepes 11 (pH 7.2), and amphotericin was included at a final concentration of 240 μg ml−1 (from a stock solution of 60 mg ml−1 in dimethylsulphoxide). Recordings were conducted under low light intensity. Membrane potential was monitored in current-clamp (I = 0) mode using an Axopatch 200A amplifier; signals were filtered at 1 kHz and digitized at 2 kHz using pCLAMP software in combination with a digidata 1200 interface (Axon Instruments).
All results are presented as individual examples and means ±s.e.m. (each mean value determined from cells isolated from at least 4 rats) and statistical comparisons were made using Student's unpaired t test.
RESULTS
Figure 1 illustrates representative amperometric recordings from individual rat carotid body type I cells. Our initial studies examined the ability of hypoxia (PO2 8–14 mmHg) to evoke release when cells were perfused with a Hepes-buffered solution at room temperature (21-24°C). In 40 cells examined (e.g. Fig. 1A), hypoxia failed to evoke secretion. A similar lack of secretory response was found when cells were perfused with Hepes-buffered solution at 35–37°C (e.g. Fig. 1B, representative of 9 cells examined). Previous studies have suggested that transduction of hypoxic stimuli is dependent on the presence of HCO3− in the perfusate (Shirahata & Fitzgerald, 1991). We therefore examined the ability of hypoxia to evoke secretion whilst cells were perfused with a solution buffered with HCO3−/CO2 at both room temperature (Fig. 1C, representative of 15 cells tested) and 35–37°C (Fig. 1D, representative of 13 cells tested). Again, this level of hypoxia consistently failed to evoke secretion. This lack of response to acute hypoxia was not due to cells being unable to undergo exocytosis, since when they were subsequently exposed to a solution of 50 mM K+ after returning to normoxia, secretion was always observed (Fig. 1A–D; 50 mM K+ applied at the time point indicated by the arrow).
Since the levels of hypoxia used here failed to evoke secretion, but have previously been shown by us to cause inhibition of K+ currents and membrane depolarization in rat type I cells (Wyatt et al. 1995; Wyatt & Peers, 1995), we speculated that hypoxia-induced depolarization might be insufficient to cause significant Ca2+ influx required for triggering catecholamine release. To investigate this further, we firstly examined the relationship between membrane depolarization (caused by raising extracellular [K+]) and exocytosis. Results are plotted in Fig. 2. Secretion was only detected at [K+]o levels of 25 mM or higher, and appeared to peak at 75 mM, with a slight decline in the secretory response at 100 mM. This secretion was entirely due to Ca2+ influx through voltage-gated Ca2+ channels, since bath application of the non-selective Ca2+ channel blocker Cd2+ (200 μM) completely abolishes high [K+]o-evoked secretion (Hatton & Peers, 1997). In order to determine how membrane potential changed with varying extracellular [K+], we also recorded membrane potential over the same range of [K+]o levels, using the perforated-patch technique. As illustrated in Fig. 3, the relationship between membrane potential and [K+]o deviated significantly from that predicted if cells were purely K+ permeable (indicated by dashed line), suggesting that other ionic conductances exert important influences on membrane potential. Since our previous voltage-clamp studies indicated that type I cells display a ‘window’ Ca2+ channel current (i.e. there may be significant, tonic Ca2+ channel activity; Peers et al. 1996), the measured membrane potential values could be positive to that predicted for a purely K+-permeable membrane because of Ca2+ influx through voltage-gated Ca2+ channels. To test this idea, we examined the effects of 200 μM Cd2+ (which completely blocks Ca2+ channel currents in these cells) on membrane potential ([K+]o 5 mM). As illustrated in Fig. 4, Cd2+ most commonly (4 out of 6 cells) caused membrane depolarization (mean depolarization 8.9 ± 1.2 mV), and in two other cells was without effect. If Cd2+ selectively blocked tonic Ca2+ influx at the resting membrane potential, a hyperpolarization would have been expected. This observation therefore suggests that tonic Ca2+ influx through voltage-gated Ca2+ channels does not contribute to resting membrane potential. The effects of Na+ removal (equimolar replacement with N-methyl-D-glucamine) were also investigated. As Fig. 4 exemplifies, removal of Na+ consistently caused a marked, reversible hyperpolarization (mean -21.0 ± 2.8 mV, n = 6 cells). This observation is in accordance with the study of Buckler & Vaughan-Jones (1994b), and indicates that a tonic Na+ influx is the major factor underlying the positive deviation of measured membrane potential in type I cells from values predicted for a purely K+-selective membrane.
Figure 2. Elevated [K+]o evokes graded secretion from rat type I carotid body cells.
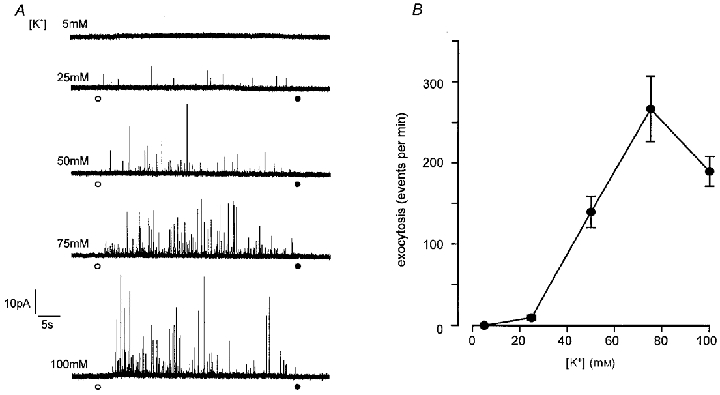
A, example amperometric recordings from 5 different type I cells. For the periods indicated by the circles, the perfusate was changed from one containing 5 mM K+ (at point indicated by open circle) to one containing the different concentration of K+ indicated in each case, and then solution containing 5 mM K+ was reapplied (filled circle). Scale bars apply to all traces. B, plot of mean (with vertical s.e.m. bars) number of exocytotic events per minute versus extracellular [K+]. Each point was determined from 16–20 cells.
Figure 3. The relationship between [K+]o and membrane potential in isolated rat type I carotid body cells.
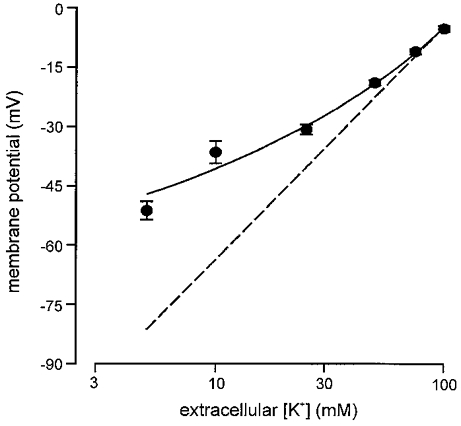
Resting membrane potential was determined using perforated-patch recordings from cells perfused with Hepes-buffered solution containing 5–100 mM K+. Each plotted point is the mean value (with vertical s.e.m. bars) determined from between 6 and 27 cells. The continuous line was fitted by eye. The dashed line represents the relationship predicted from the Nernst equation for a purely K+-selective membrane.
Figure 4. Effects of Cd2+ application and Na+ removal on membrane potential of type I cells.
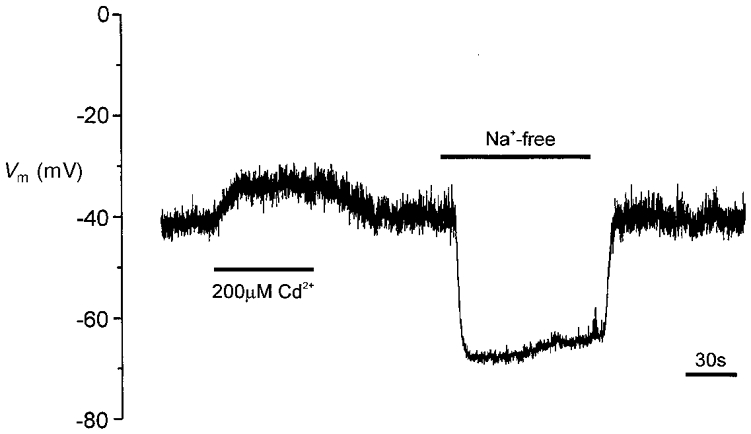
Example membrane potential recording from a type I cell. For the period indicated by the left-hand horizontal bar, Cd2+ (200 μM) was applied via the perfusate. For the period indicated by the right-hand bar, extracellular Na+ was replaced by an equimolar amount of N-methyl-D-glucamine.
To examine further our speculation that isolated type I cells were unable to depolarize sufficiently to activate voltage-gated Ca2+ entry, we examined the ability of hypoxia to evoke secretion in the presence of an elevated [K+]o level of 25 mM. As indicated in Fig. 5, this level of [K+]o was sufficient in itself to evoke a small amount of secretion (see also Fig. 2), and when hypoxia was co-applied, secretion was increased nearly 3-fold (Fig. 5A and B) as compared with the secretion evoked by 25 mM K+ alone. This enhancement of secretion caused by hypoxia was most likely to be due to Ca2+ influx through voltage-gated Ca2+ channels, since it was completely abolished by Cd2+ (200 μM; Fig. 5A and B).
Figure 5. Hypoxia evokes exocytosis from type I cells in the presence of elevated [K+]o.
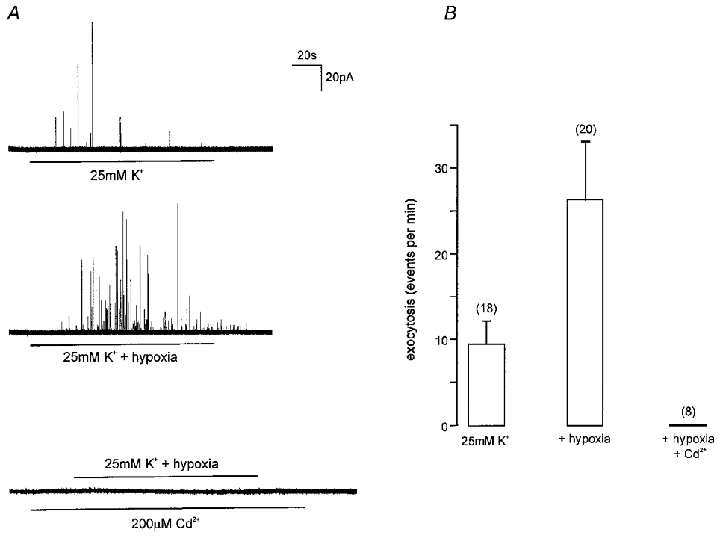
A, example amperometric recordings from type I cells under different experimental conditions, as indicated. Upper trace, the cell was exposed to a solution containing 25 mM K+ for the period indicated by the horizontal bar. Middle trace, the cell was exposed to a hypoxic solution (PO2 8–14 mmHg) containing 25 mM K+ for the period indicated by the horizontal bar. Lower trace, the cell was exposed to a hypoxic solution containing 25 mM K+ for the period indicated by the upper horizontal bar, but in the presence of 200 μM Cd2+ (applied for the period indicated by the lower horizontal bar). Scale bars apply to all traces. B, bar graph showing mean (with vertical s.e.m. bars) secretion (expressed as number of amperometric events per minute) under the conditions indicated, as exemplified in A. The number of cells studied in each case is indicated in parentheses.
Integration of individual, clearly resolved exocytotic events was performed, in order to compare the quantal size of events evoked under normoxic and hypoxic conditions (see Methods). Results are presented in Fig. 6 for events evoked by 25 mM K+ in normoxia (Fig. 6A), 25 mM K+ in hypoxia (Fig. 6B; PO2 8–14 mmHg), and 50 mM K+ in normoxia (Fig. 6C). Clearly, the distributions were approximately normal in each case, and mean values were similar also (means ±s.d. 0.29 ± 0.06, 0.28 ± 0.08 and 0.30 ± 0.06 pC1/3, respectively). Thus, increasing release rate under normoxic conditions by application of 50 mM K+ instead of 25 mM K+ did not affect quantal size, and release evoked by hypoxia in the presence of 25 mM K+ (the frequency of which was intermediate between 25 mM and 50 mM K+ under normoxic conditions) was also similar. These findings suggest that hypoxia and raised K+ levels evoke release of the same intracellular pool of vesicles.
Figure 6. Comparative distributions of quantal size determined from events evoked by 25 mM K+ and hypoxia.
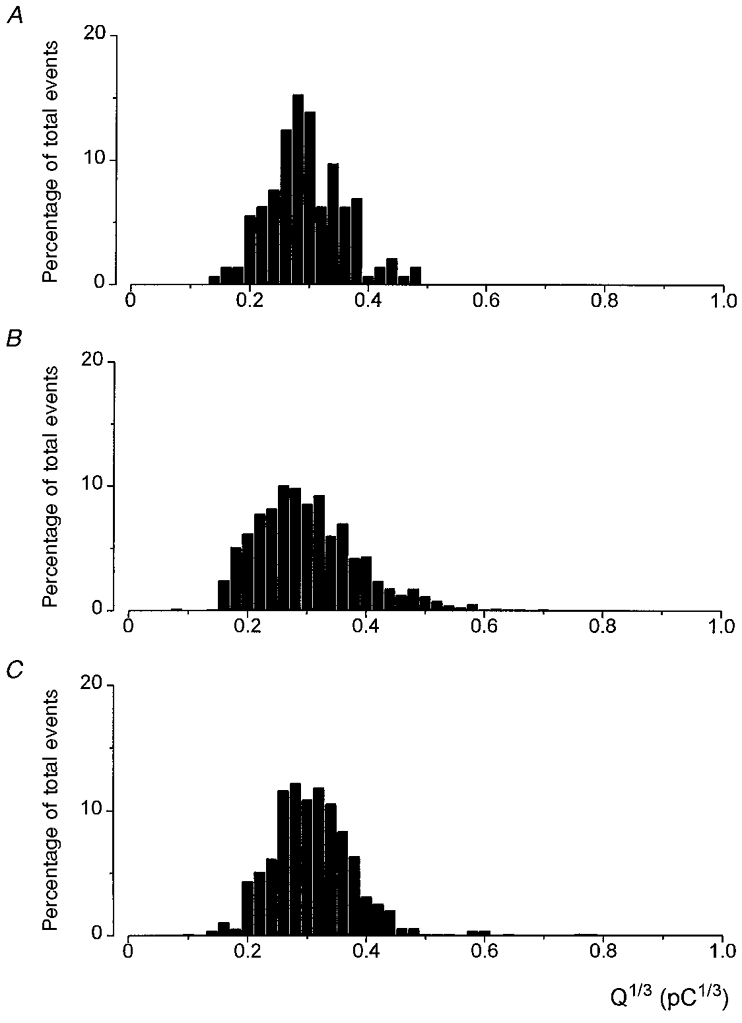
Plot of the percentage distribution of Q1/3 determined from integration of exocytotic events evoked from cells exposed to 25 mM K+ alone (A; total number of events = 143), 25 mM K+ under hypoxic conditions (B; 550 events, PO2 8–14 mmHg), and 50 mM K+ under normoxic conditions (C; 1017 events). Events recorded from at least 5 cells in each case.
In addition to examining the effects of hypoxia in the presence of raised [K+]o, we also examined the effects of an anoxic stimulus, achieved by addition of sodium dithionite (0.5 mM) to N2-equilibrated solutions containing the control K+ level of 5 mM. As illustrated in Fig. 7A, the presence of dithionite itself interfered with the polarized carbon fibre electrodes, giving rise to a substantial, sustained offset current which returned to control levels when the solution was changed back to a normoxic one. Nevertheless, when the electrode was placed adjacent to a type I cell, quantal events could be resolved, superimposed on the large offset current (Fig. 7B). Thus, anoxia was able to evoke catecholamine secretion in the presence of 5 mM , and this was a consistent observation (n = 19 cells), with a mean exocytotic rate of 25 ± 6 events per minute. We did not analyse these events for determination of Q, since the reactivity of dithionite itself with the electrodes may introduce inaccuracies.
Figure 7. Amperometric detection of anoxia-evoked catecholamine release from type I carotid body cells.
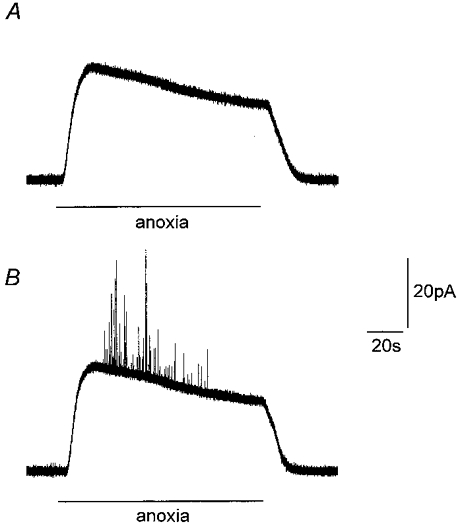
A, amperometric recording from a carbon fibre microelectrode immersed in perfusate in the absence of cells before, during and after exposure to a N2-bubbled solution containing 0.5 mM dithionite (applied for the period indicated by horizontal bar). Note the large offset current; an artefact arising from the presence of dithionite in the anoxic perfusate. B, amperometric recording from a type I cell exposed to anoxic solution containing 0.5 mM dithionite (as in A). Note appearance of secretory events superimposed on the large offset current. Scale bars apply to both traces.
We next investigated the Ca2+ dependency of the secretory response of type I cells to anoxia, and this response was consistently abolished by removal of extracellular Ca2+ (replaced with 1 mM EGTA; e.g. Fig. 8A). However, in contrast to the effects of either raised [K+]o (Hatton & Peers, 1997), or hypoxia in the presence of raised [K+]o (see Fig. 5), application of Cd2+ (200 μM) did not significantly affect anoxia-evoked secretion (Fig. 8B). This observation raised the question of whether release was being evoked by anoxia (achieved by dithionite addition), or by the presence of dithionite itself. To investigate this, we applied an air-equilibrated solution containing 0.5 mM dithionite to type I cells, and found that this solution (which had a measured PO2 of 130 mmHg in the recording chamber) was also capable of evoking exocytosis (Fig. 8C). Indeed, the number of exocytotic events evoked per minute was not significantly different from that evoked by anoxia (Fig. 8D). Furthermore, anoxia-evoked secretion was not significantly affected by 2 mM Ni2+ or 1 mM Zn2+ (Fig. 8D) or by nifedipine (2 μM; Fig. 8D). Thus, although anoxia-evoked secretion was entirely dependent on the presence of extracellular Ca2+, known blockers of voltage-gated Ca2+ channels could not prevent such secretion.
Figure 8. Anoxia-evoked catecholamine release from type I carotid body cells is Ca2+ dependent but unaffected by blockers of voltage-gated Ca2+ channels.
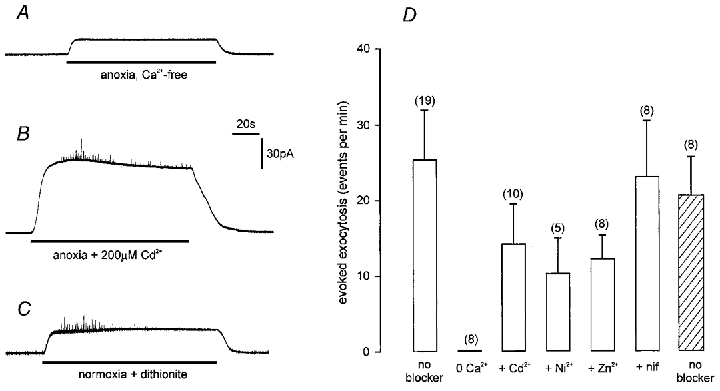
A, amperometric recording from a type I cell exposed to a Ca2+-free anoxic solution containing 0.5 mM dithionite, 1 mM EGTA and no added Ca2+. B, amperometric recording from a type I cell exposed to anoxic solution (with 2.5 mM Ca2+) containing 0.5 mM dithionite. Cd2+ (200 μM) was present throughout the recording. C, amperometric recording from another type I cell exposed to an air-equilibrated solution (with 2.5 mM Ca2+) containing 0.5 mM dithionite. Measured PO2 was 130 mmHg. Scale bars apply to all three traces. D, bar graph showing mean (with vertical s.e.m. bars) rate of secretion (number of events detected per minute) evoked by anoxic solutions (open bars) in the absence of blockers, in Ca2+-free solution, or in the presence of inhibitors of voltage-gated Ca2+ channels, as indicated. Hatched bar indicates secretory rate from cells exposed to dithionite under normoxic conditions (as exemplified in C). The number of cells used in each case is indicated in parentheses.
Given that previous studies had suggested that hypoxia-evoked secretion is dependent on voltage-gated Ca2+ entry (see Introduction and Discussion), results presented in Fig. 8 were unexpected, and suggested a possible effect of dithionite which has not previously been reported. To investigate this possibility further, we also examined anoxia-evoked catecholamine release from phaeochromocytoma (PC12) cells. These cells have been proposed as model chemoreceptor cells (Zhu et al. 1996; Conforti et al. 1999), and our previous studies have shown that hypoxia evokes release of catecholamines in a graded manner which is entirely dependent on Ca2+ influx through voltage-gated Ca2+ channels (Taylor & Peers, 1998). Anoxia also evoked secretion from PC12 cells (e.g. Fig. 9A and D), and this was fully abolished by removal of extracellular Ca2+ (Fig. 9B and D). However, Cd2+ (200 μM) failed to suppress this secretory response (Fig. 9C and D). This finding was comparable to that seen in type I cells (Fig. 8), and suggested that under anoxic conditions (in the presence of dithionite) catecholamine release could be evoked in both cell types via Ca2+ influx which does not appear to be through Cd2+-sensitive channels. This is in contrast to hypoxia-evoked secretion in the presence of 25 mM K+, which was wholly dependent on Cd2+-sensitive channels (see Fig. 5).
Figure 9. Anoxia-evoked catecholamine release from PC12 cells is Ca2+ dependent but unaffected by Cd2+.
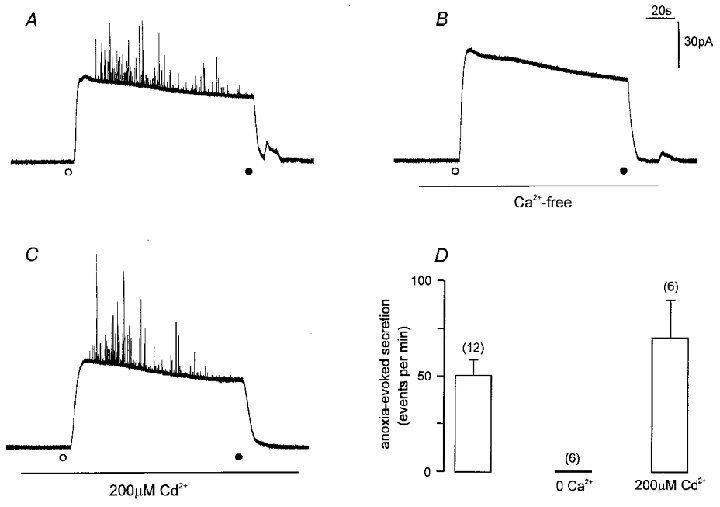
A-C, amperometric recordings from individual PC12 cells exposed to anoxic solution (containing 0.5 mM dithionite). In each case, anoxic solution was applied at the time point indicated by the open circle, and removed at the time point indicated by the filled circle. Recordings were made in solutions containing 2.5 mM Ca2+ (A and C) in the absence (A) or presence (C) of 200 μM Cd2+ (applied for the period indicated by horizontal bar). In B, the cell was exposed to Ca2+-free medium for the period indicated by the horizontal bar, before, during and after exposure to anoxia. Scale bars apply to all traces. D, bar graph showing mean (with vertical s.e.m. bars) number of events per minute detected from PC12 cells in response to anoxia under conditions exemplified in A–C, as indicated. The number of cells studied in each case is indicated in parentheses.
DISCUSSION
The main aim of the present study was to investigate directly whether hypoxia could evoke catecholamine release from isolated type I cells of the rat carotid body and, if so, whether evoked release was dependent on Ca2+ influx through voltage-gated Ca2+ channels. A wealth of previous studies have provided indirect evidence that hypoxia-evoked catecholamine release from type I cells is a requisite step in carotid body chemotransduction (reviewed by Gonzalez et al. 1994), but direct evidence of such release from type I cells in the absence of other cell types is lacking. Recently, such direct evidence for hypoxia-evoked dopamine release from rabbit type I cells was published (Urena et al. 1994; Montoro et al. 1996), providing convincing support for the widely held idea that release requires membrane depolarization and Ca2+ influx through voltage-gated Ca2+ channels (Gonzalez et al. 1994; Peers & Buckler, 1995). However, marked species differences exist when comparing the biophysical properties of rabbit and rat type I cells (reviewed by Lopez-Lopez & Peers, 1997) and, perhaps most importantly, rabbit type I cells spontaneously generate action potentials in normoxia (Lopez-Barneo, 1996). The frequency of these action potentials increases during hypoxia, owing to selective inhibition of a specific, voltage-gated K+ channel, termed the KO2 channel (Ganfornina & Lopez-Barneo, 1992). By contrast, rat type I cells do not fire spontaneous action potentials in normoxia but under hypoxic conditions they show a persistent depolarization (Buckler & Vaughan-Jones, 1994a; Wyatt & Peers, 1995), termed a receptor potential (Buckler & Vaughan-Jones, 1994a; Buckler, 1997), superimposed on which may appear Ca2+-dependent action potentials (Buckler & Vaughan-Jones, 1994a; Buckler, 1997). Owing to these species differences, it was important to demonstrate hypoxia-evoked secretion from rat type I cells, and to investigate whether such release could be accounted for by voltage-gated Ca2+ entry.
Our finding that raised [K+]o could evoke secretion in a graded manner (Fig. 2) and also caused graded membrane depolarization (Fig. 3) supports the idea that voltage-dependent exocytosis does occur in rat type I cells, as previously described (Hatton & Peers, 1997). In order to investigate the magnitude of depolarization required to evoke secretion in response to elevating [K+]o, we also studied the relationship between [K+]o and membrane potential. This relationship deviated markedly from that predicted from a purely K+-selective membrane, such that at lower [K+]o levels, the same change in [K+]o produces a smaller depolarization that at higher [K+]o levels. At present, other ionic conductances which contribute to membrane potential in the presence of a physiological K+ gradient are not fully determined. Type I cells also possess a significant Cl− conductance, but only under either a swelling osmotic gradient or when intracellular cAMP levels increase (Carpenter & Peers, 1997), so this conductance is not likely to contribute to determining resting potential. In the present study, we also found no evidence to suggest that a tonic ‘window’ Ca2+ current contributed a depolarizing influence (Fig. 4), but we did find that removal of extracellular Na+ caused a marked hyperpolarization (Fig. 4), indicating that Na+ influx was a major factor in setting resting membrane potential in these cells, as previously suggested (Buckler & Vaughan-Jones, 1994b).
Results presented in Fig. 2 indicate that secretion is only detectable under normoxic conditions when [K+]o is elevated to 25 mM or higher concentrations. Elevation of [K+]o to 25 mM causes a membrane depolarization of approximately 15 mV (Fig. 3). Our previous studies have shown that hypoxia (PO2 12–20 mmHg, a similar range to the levels of hypoxia used in the present study) causes a membrane depolarization of approximately 8 mV (Wyatt & Peers, 1995; Wyatt et al. 1995). According to data presented in Fig. 2, this is unlikely to be a sufficiently large depolarization to cause exocytosis and, in accordance with this idea, similar levels of hypoxia consistently failed to evoke secretion (Fig. 1). This lack of secretory effect was found regardless of temperature, or whether the extracellular solution was buffered with Hepes or with HCO3−/CO2 (Fig. 1). Thus, this level of hypoxia, which is known to excite the carotid body in situ (see Gonzalez et al. 1994), and cause depolarization and a detectable rise of [Ca2+]i in isolated rat type I cells (Buckler & Vaughan-Jones, 1994a; Wyatt & Peers, 1995), is insufficient to evoke catecholamine release. However, when the same level of hypoxia was applied to cells in the presence of 25 mM [K+]o secretion was significantly enhanced (Fig. 5). Furthermore, this hypoxia-evoked secretion was abolished by the non-selective Ca2+ channel blocker, Cd2+ (Fig. 5A). The simplest interpretation of these findings is that the degree of depolarization caused by hypoxia in cells already exposed to the depolarizing influence of 25 mM K+ is sufficient to evoke catecholamine release. Thus our results would support previous suggestions from studies in rat type I cells (Buckler & Vaughan-Jones, 1994a; Wyatt & Peers, 1995) and more direct evidence from intact (Obeso et al. 1992) and dissociated (Urena et al. 1994; Montoro et al. 1996) rabbit carotid body tissue that hypoxia-evoked catecholamine release requires Ca2+ influx through voltage-gated Ca2+ channels. It is conceivable that 25 mM K+ provides an influx of Ca2+ that in some way ‘primes’ type I cells so that they release transmitter in response to hypoxia in a Cd2+-resistant manner. We cannot discount this possibility at present, but consider it unlikely, and it is not supported by previous studies, detailed above.
In common with many other workers (Biscoe & Duchen, 1990; Pang & Eyzaguirre, 1992; Buckler & Vaughan-Jones, 1994a; Buckler, 1997), we intensified the hypoxic stimulus applied to type I cells by addition of dithionite to the N2-equilibrated solution, giving rise to solutions which were near anoxic (PO2 < 2–3 mmHg). This severe hypoxic/anoxic stimulus (applied with perfusate [K+] of 5 mM) consistently evoked secretion from type I cells and, as predicted if such release required Ca2+ influx through voltage-gated Ca2+ channels, such secretion was entirely dependent on the presence of extracellular Ca2+ (Figs 7 and 8). However, anoxia-evoked exocytosis was not significantly affected by any of the pharmacological agents known to inhibit most or all voltage-gated Ca2+ influx (Ni2+, Cd2+, nifedipine; also Zn2+; Fig. 8). This suggested that under anoxic conditions in the presence of dithionite, a Cd2+-resistant Ca2+ influx pathway was activated. To examine this further, we measured catecholamine secretion from PC12 cells, which have previously been shown to undergo exocytosis in response to hypoxia in a graded manner due to Ca2+ influx through voltage-gated Ca2+ channels (Taylor & Peers, 1999). Anoxia was capable of producing a robust secretory response in these cells (Fig. 9) but, as was the case in type I cells, this could only be prevented by removal of extracellular Ca2+ and not by application of Cd2+. Thus, dithionite appears to induce an unidentified Ca2+ influx pathway which can contribute to the secretory response in both cell types. The mechanisms underlying such an effect of dithionite are unknown at present, but may be associated with free radical damage to the plasma membrane (Archer et al. 1995). Clearly, these findings serve as a caution against the use of dithionite in studies of the effects of severe hypoxia or anoxia in chemoreceptive cells.
Although the present study has demonstrated hypoxia-evoked secretion from type I carotid body cells, this was only observed when extracellular K+ was elevated (Fig. 5). This finding appears to contrast with previous studies which have shown hypoxia to evoke catecholamine release from intact carotid body preparations in vitro (e.g. Obeso et al. 1992). We cannot account for this discrepancy at present, but suggest that it may be due to type I cells being relatively hyperpolarized following the isolation procedure. In the intact carotid body, type I cells form tight clusters which are in synaptic contact with afferent sensory nerve endings as well as autonomic nerve endings (e.g. Verna, 1997). This raises the likely possibility that they are under the tonic, paracrine influence of basal levels of neurotransmitters (such as catecholamines, acetylcholine and numerous others; Gonzalez et al. 1994; Prabhakar, 1994) released from neighbouring cells. Certainly, type I cells possess receptors for many of these transmitter types (e.g. Benot & Lopez-Barneo, 1990; Wyatt & Peers, 1993; Dasso et al. 1997). In support of this idea, the membrane potential observed in the present study (-51 mV; [K+]o 5 mM; in good agreement with other studies; Buckler & Vaughan-Jones 1994a, b,) is more negative than values reported in more intact preparations (e.g. Eyzaguirre et al. 1989), although a note of caution should be added when making such comparisons of values determined by patch-clamp versus intracellular microelectrode techniques.
In summary, the present study indicates that hypoxia can evoke catecholamine release from isolated type I cells of the rat carotid body. This release is dependent on Ca2+ influx through voltage-gated Ca2+ channels, but was only observed in the presence of elevated [K+]o. This may be due to type I cells being artificially relatively hyperpolarized when isolated. Anoxia could evoke release of catecholamines from both type I cells and PC12 cells, but this was at least partly due to stimulation of an unidentified Ca2+ influx pathway which was not sensitive to known blockers of voltage-gated Ca2+ channels. We suggest that this pathway should be considered as an experimental artifact.
Acknowledgments
This work was supported by The Wellcome Trust and The British Heart Foundation.
References
- Archer SL, Hampl V, Nelson DP, Sidney E, Peterson DA, Wier EK. Dithionite increases radical formation and decreases vasoconstriction in the lung. Evidence that dithionite does not mimic alveolar hypoxia. Circulation Research. 1995;77:174–181. doi: 10.1161/01.res.77.1.174. [DOI] [PubMed] [Google Scholar]
- Benot AR, Lopez-Barneo J. Feedback inhibition of Ca2+ currents by dopamine in glomus cells of the carotid body. European Journal of Neuroscience. 1990;2:809–812. doi: 10.1111/j.1460-9568.1990.tb00473.x. [DOI] [PubMed] [Google Scholar]
- Biscoe TJ, Duchen MR. Responses of type I cells dissociated from the rabbit carotid body to hypoxia. The Journal of Physiology. 1990;428:39–59. doi: 10.1113/jphysiol.1990.sp018199. [DOI] [PMC free article] [PubMed] [Google Scholar]
- Buckler KJ. A novel oxygen-sensitive potassium current in rat carotid body type I cells. The Journal of Physiology. 1997;498:649–662. doi: 10.1113/jphysiol.1997.sp021890. [DOI] [PMC free article] [PubMed] [Google Scholar]
- Buckler KJ, Vaughan-Jones RD. Effects of hypoxia on membrane potential and intracellular calcium in rat neonatal carotid body type I cells. The Journal of Physiology. 1994a;476:423–428. doi: 10.1113/jphysiol.1994.sp020143. [DOI] [PMC free article] [PubMed] [Google Scholar]
- Buckler KJ, Vaughan-Jones RD. Effects of hypercapnia on membrane potential and intracellular calcium in rat carotid body type I cells. The Journal of Physiology. 1994b;478:157–171. doi: 10.1113/jphysiol.1994.sp020239. [DOI] [PMC free article] [PubMed] [Google Scholar]
- Carpenter E, Peers C. Swelling- and cAMP-activated Cl− currents in isolated rat carotid body type I cells. The Journal of Physiology. 1997;503:497–511. doi: 10.1111/j.1469-7793.1997.497bg.x. [DOI] [PMC free article] [PubMed] [Google Scholar]
- Chow RH, von Ruden L. Electrochemical detection of secretion from single cells. In: Sakmann B, Neher E, editors. Single Channel Recording. 2. New York: Plenum Press; 1995. pp. 245–275. [Google Scholar]
- Conforti L, Kobayashi S, Beitner-Johnson D, Conrad PW, Freeman T, Millhorn DE. Regulation of gene expression and secretory functions in oxygen-sensing pheochromocytoma cells. Respiration Physiology. 1999;115:249–260. doi: 10.1016/s0034-5687(99)00022-5. [DOI] [PubMed] [Google Scholar]
- Dasso LLT, Buckler KJ, Vaughan-Jones RD. Muscarinic and nicotinic receptors raise intracellular Ca2+ levels in rat carotid body type I cells. The Journal of Physiology. 1997;498:327–338. doi: 10.1113/jphysiol.1997.sp021861. [DOI] [PMC free article] [PubMed] [Google Scholar]
- Delpiano MA, Hescheler J. Evidence for a PO2-sensitive K+ channel in the type-I cell of the rabbit carotid body. FEBS Letters. 1989;249:195–198. doi: 10.1016/0014-5793(89)80623-4. [DOI] [PubMed] [Google Scholar]
- Eyzaguirre C, Monti-Bloch L, Baron M, Hayashida Y, Woodbury JW. Changes in glomus cell membrane properties in response to stimulants and depressants of carotid nerve discharge. Brain Research. 1989;477:265–279. doi: 10.1016/0006-8993(89)91414-5. [DOI] [PubMed] [Google Scholar]
- Fidone S, Gonzalez C. Initiation and control of chemoreceptor activity in the carotid body. In: Cherniack NS, Widdicombe JG, editors. Handbook of Physiology, section 3, The Respiratory System, Control of Breathing. II. Bethesda, MD, USA: American Physiological Society; 1986. pp. 247–312. [Google Scholar]
- Finnegan JM, Pihel K, Cahill PS, Huang L, Zerby SE, Ewing AG, Kennedy RT, Wightman RM. Vesicular quantal size measured by amperometry at chromaffin, mast, pheochromocytoma and pancreatic β cells. Journal of Neurochemistry. 1996;66:1914–1923. doi: 10.1046/j.1471-4159.1996.66051914.x. [DOI] [PubMed] [Google Scholar]
- Ganfornina MD, Lopez-Barneo J. Potassium channel types in arterial chemoreceptor cells and their selective modulation by oxygen. Journal of General Physiology. 1992;100:401–426. doi: 10.1085/jgp.100.3.401. [DOI] [PMC free article] [PubMed] [Google Scholar]
- Gonzalez C, Almaraz L, Obeso A, Rigual R. Oxygen and acid chemoreception in the carotid body chemoreceptors. Trends in Neurosciences. 1992;15:146–153. doi: 10.1016/0166-2236(92)90357-e. [DOI] [PubMed] [Google Scholar]
- Gonzalez C, Almaraz L, Obeso A, Rigual R. Carotid body chemoreceptors: from natural stimuli to sensory discharges. Physiological Reviews. 1994;74:829–898. doi: 10.1152/physrev.1994.74.4.829. [DOI] [PubMed] [Google Scholar]
- Hatton CJ, Peers C. Electrochemical detection of K+-evoked quantal secretory events from isolated rat type I carotid body cells. Experimental Physiology. 1997;82:415–418. doi: 10.1113/expphysiol.1997.sp004036. [DOI] [PubMed] [Google Scholar]
- Lopez-Barneo J. Oxygen-sensing by ion channels and the regulation of cellular functions. Trends in Neurosciences. 1996;19:435–440. doi: 10.1016/0166-2236(96)10050-3. [DOI] [PubMed] [Google Scholar]
- Lopez-Barneo J, Lopez-Lopez JR, Urena J, Gonzalez C. Chemotransduction in the carotid body: K+ current modulated by PO2 in type I chemoreceptor cells. Science. 1988;241:580–582. doi: 10.1126/science.2456613. [DOI] [PubMed] [Google Scholar]
- Lopez-Lopez JR, Peers C. Electrical properties of chemoreceptor cells. In: Gonzalez C, editor. The Carotid Body Chemoreceptors. Austin, TX, USA: Landes Bioscience; 1997. pp. 65–77. [Google Scholar]
- Mojet MH, Mills E, Duchen MR. Hypoxia-induced catecholamine secretion in isolated newborn rat adrenal chromaffin cells is mimicked by inhibition of mitochondrial respiration. The Journal of Physiology. 1997;504:175–189. doi: 10.1111/j.1469-7793.1997.175bf.x. [DOI] [PMC free article] [PubMed] [Google Scholar]
- Montoro RJ, Urena J, Fernandez-Chacon R, Alvarez de Toledo G, Lopez-Barneo J. Oxygen sensing by ion channels and chemotransduction in single glomus cells. Journal of General Physiology. 1996;107:133–143. doi: 10.1085/jgp.107.1.133. [DOI] [PMC free article] [PubMed] [Google Scholar]
- Obeso A, Rocher A, Fidone S, Gonzalez C. The role of dihydropyridine-sensitive Ca2+ channels in stimulus-evoked catecholamine release from chemoreceptor cells of the carotid body. Neuroscience. 1992;47:463–472. doi: 10.1016/0306-4522(92)90260-9. [DOI] [PubMed] [Google Scholar]
- Pang L, Eyzaguirre C. Different effects of hypoxia on the membrane potential and input resistance of isolated and clustered carotid body glomus cells. Brain Research. 1992;575:167–173. doi: 10.1016/0006-8993(92)90440-k. [DOI] [PubMed] [Google Scholar]
- Peers C. Hypoxic suppression of K+ currents in type I carotid body cells: selective effect on the Ca2+-activated K+ current. Neuroscience Letters. 1990;119:253–256. doi: 10.1016/0304-3940(90)90846-2. [DOI] [PubMed] [Google Scholar]
- Peers C. O2 sensing by the carotid body. Primary Sensory Neuron. 1996;1:197–208. [Google Scholar]
- Peers C, Buckler KJ. Transduction of chemostimuli by the type I carotid body cell. Journal of Membrane Biology. 1995;144:1–9. doi: 10.1007/BF00238411. [DOI] [PubMed] [Google Scholar]
- Peers C, Carpenter E, Hatton CJ, Wyatt CN, Bee D. Ca2+ channel currents in type I carotid body cells of normoxic and chronically hypoxic neonatal rats. Brain Research. 1996;739:251–257. doi: 10.1016/s0006-8993(96)00832-3. [DOI] [PubMed] [Google Scholar]
- Prabhakar N. Neurotransmitters in the carotid body. Advances in Experimental Biology and Medicine. 1994;360:57–69. doi: 10.1007/978-1-4615-2572-1_6. [DOI] [PubMed] [Google Scholar]
- Rae J, Cooper K, Gates P, Watsky M. Low access resistance perforated patch recordings using amphotericin B. Journal of Neuroscience Methods. 1991;37:15–26. doi: 10.1016/0165-0270(91)90017-t. [DOI] [PubMed] [Google Scholar]
- Shirahata M, Fitzgerald RS. The presence of CO2/HCO3− is essential for hypoxic chemotransduction in the in vivo perfused carotid body. Brain Research. 1991;545:297–300. doi: 10.1016/0006-8993(91)91301-g. [DOI] [PubMed] [Google Scholar]
- Stea A, Nurse CA. Whole-cell and perforated-patch recordings from O2-sensitive rat carotid body cells grown in short- and long-term culture. Pflügers Archiv. 1991;418:93–101. doi: 10.1007/BF00370457. [DOI] [PubMed] [Google Scholar]
- Taylor SC, Peers C. Hypoxia evokes catecholamine secretion from rat pheochromocytoma PC12 cells. Biochemical and Biophysical Research Communications. 1998;248:13–17. doi: 10.1006/bbrc.1998.8905. [DOI] [PubMed] [Google Scholar]
- Taylor SC, Peers C. Chronic hypoxia enhances the secretory response of rat phaeochromocytoma (PC12) cells to acute hypoxia. The Journal of Physiology. 1999;514:483–491. doi: 10.1111/j.1469-7793.1999.483ae.x. [DOI] [PMC free article] [PubMed] [Google Scholar]
- Urena J, Fernandez-Chacon R, Benot AR, Alvarez de Toledo G, Lopez-Barneo J. Hypoxia induces voltage-dependent Ca2+ entry and quantal dopamine secretion in carotid body glomus cells. Proceedings of the National Academy of Sciences of the USA. 1994;91:10208–10211. doi: 10.1073/pnas.91.21.10208. [DOI] [PMC free article] [PubMed] [Google Scholar]
- Verna A. The mammalian carotid body: morphological data. In: Gonzalez C, editor. The Carotid Body Chemoreceptors. Austin, TX, USA: Landes Bioscience; 1997. pp. 1–29. [Google Scholar]
- Wightman RM, Jankowski JA, Kennedy RT, Kwagoe KT, Schroeder TJ, Leszczyszyn DJ, Near JA, Diliberto EJ, Jr, Viveros OH. Temporally resolved catecholamine spikes correspond to single vesicle release from individual chromaffin cells. Proceedings of the National Academy of Sciences of the USA. 1991;88:10754–10758. doi: 10.1073/pnas.88.23.10754. [DOI] [PMC free article] [PubMed] [Google Scholar]
- Wyatt CN, Peers C. Nicotinic acetylcholine receptors in isolated type I cells of the neonatal rat carotid body. Neuroscience. 1993;54:275–281. doi: 10.1016/0306-4522(93)90399-z. [DOI] [PubMed] [Google Scholar]
- Wyatt CN, Peers C. Ca2+-activated K+ channels in isolated type I cells of the neonatal rat carotid body. The Journal of Physiology. 1995;483:559–565. doi: 10.1113/jphysiol.1995.sp020606. [DOI] [PMC free article] [PubMed] [Google Scholar]
- Wyatt CN, Wright C, Bee D, Peers C. O2-sensitive K+ currents in carotid body chemoreceptor cells from normoxic and chronically hypoxic rats and their roles in hypoxic chemotransduction. Proceedings of the National Academy of Sciences of the USA. 1995;92:295–299. doi: 10.1073/pnas.92.1.295. [DOI] [PMC free article] [PubMed] [Google Scholar]
- Zhu WH, Conforti L, Czyzyk-Krzeska MF, Millhorn DE. Membrane depolarization in PC12 cells during hypoxia is regulated by an O2-sensitive K+ current. American Journal of Physiology. 1996;271:C658–665. doi: 10.1152/ajpcell.1996.271.2.C658. [DOI] [PubMed] [Google Scholar]


