Abstract
Myocytes were dissociated from the sinoatrial (SA) node of rat heart using a new enzymatic dissociation technique. Only a small number of isolated SA node myocytes showed regular rhythmic contractions and spontaneous action potentials, and these were used in the present study.
The spontaneous action potential was resistant to TTX, and the action potential parameters were similar to those of rabbit and guinea-pig pacemaker cells. Major time- and voltage-dependent currents were the delayed rectifier K+ current IKr, the L-type Ca2+ current ICa,L and the sodium current INa. The hyperpolarization-activated cation current (If) was recorded from ≈50 % of the cells with hyperpolarization beyond -90 mV.
The instantaneous current jump at the onset of a hyperpolarizing pulse showed inward rectification and was largely blocked by Ba2+. This Ba2+-sensitive current corresponded well to the inward rectifier K+ current (IK1), although it was much smaller in amplitude than in the ventricle.
A sustained inward current was activated on depolarization from -80 mV to the voltage range of slow diastolic depolarization. The current was blocked by nicardipine, enlarged by isoprenaline and was insensitive to removal of external Ca2+. These characteristics were similar to the sustained inward current, Ist, previously described in the rabbit and guinea-pig SA node cells.
The role of Ist was considered by constructing empirical equations, which were applied to the experimental record of the action potential. It is demonstrated that the voltage-dependent activation of Ist constitutes a positive feedback loop with the depolarization of the membrane.
The ionic mechanisms underlying the spontaneous action potential in sinoatrial (SA) node cells have been studied almost exclusively in rabbit heart (Irisawa et al. 1993), in addition to the frog sinus venosus (Brown et al. 1976a,b; Hume & Giles, 1981, 1983; Brown et al. 1982; Giles & Shibata, 1985; Bois & Lenfant, 1990). The following three types of voltage-dependent gating of ionic channels have been suggested to drive the slow diastolic depolarization in the absence of inward rectifier K+ channel (IK1): (1) the time- and voltage-dependent deactivation of delayed rectifier K+ current (IKr and/or IKs) during diastole; (2) the activation of hyperpolarization-activated cation current (If) near the maximum diastolic potential; and (3) the activation of L-type Ca2+ current (ICa,L) during the later third to a half period of diastole. Recently the activation of sustained inward current (Ist) has been demonstrated on depolarization from -80 mV to the diastolic potential range in rabbit (Guo et al. 1995) and guinea-pig SA node cells (Guo et al. 1997), and in the rabbit atrio-ventricular (AV) node (Guo & Noma, 1997). Since the Na+-sensitive, but Ca2+-insensitive, nature of Ist was different from ICa,L, it was suggested that a distinct type of ionic channel might be responsible for Ist (see Mitsuiye et al. 1999, for single channel recording of Na+-sensitive currents). The voltage-dependent activation of Ist over the diastolic potential range suggested its pivotal role in driving the membrane depolarization.
There may be a large variation in the ionic mechanisms underlying the slow diastolic depolarization among different species. For example, the presence of If seems to be variable in spontaneously active single cells isolated from frog sinus venosus; it is absent in Rana catesbeiana (Hume & Giles, 1983; Giles & Shibata, 1985), but is activated in Rana esculenta at potentials more negative than -60 mV (Bois & Lenfant, 1990). The prominent component of the delayed rectifier K+ current is the rapid type (IKr, human ether-à-go-go related (HERG) type) in rabbit (Ito & Ono, 1995; Ono & Ito, 1995; Verheijck et al. 1995), whereas it is the slow type (IKs, KvLQT type) in guinea-pig (Anumonwo et al. 1992; Guo et al. 1997) and most probably in frog (Giles & Shibata, 1985). In fact there is a large variation in heart rate among different species. Thus, comparative studies are essential in understanding the ionic mechanisms of the cardiac pacemaker activity.
The rat heart is frequently used to study mechanical and electrical activities of cardiac muscle not only in normal animals, but also in various animal models of disease. However, its pacemaker activity has scarcely been studied. This is because of difficulty in recording pacemaker action potentials by penetration of conventional microelectrodes into the rat SA node tissue. A technique was developed in the present study to dissociate pacemaker cells from rat SA node, which analysed action potentials as well as membrane currents of rat pacemaker cells. Our primary aim was to look for the presence of Ist in rat SA node cells. Surprisingly the presence of IK1 was observed in all rat pacemaker cells examined. This study describes individual current systems in relation to the pacemaker mechanisms rather than examining their characteristics in detail.
Methods
All experiments were carried out according to the guidelines laid down by the Kyoto University animal welfare committee.
Preparation of single cells
The pacemaker cells were dissociated by treating rat or rabbit SA node with collagenase. The method of cell isolation from the rabbit heart was exactly the same as described previously (Guo et al. 1995). Briefly, the rabbits (1.3-1.5 kg body weight) were deeply anaesthetized with an intra-venous injection of an overdose of pentobarbital sodium (sodium 5-ethyl-(1-methylbutyl) barbiturate (∼100 mg (kg body weight)−1). The heart was dissected out and mounted on a Langendorff apparatus, and the coronary vessels were perfused with physiological saline. After the perfusion of a Ca2+-free solution containing collagenase, the SA node was dissected out and incubated further in the same solution with the addition of elastase. After 20–30 min enzyme treatment, the tissue was put in modified Kraftbrühe (KB) solution and myocytes were dissociated.
The same method as used for the rabbit was initially applied to the rat heart. However, the rat SA node tissue was hardly perfused with the enzyme solution using the Langendorff-type apparatus. Therefore, we developed a new dissociation technique. The rats (Wistar, 250–350 g body weight) were deeply anaesthetized with an intra-peritoneal injection of an overdose of pentobarbital sodium (∼5-10 mg (100 g body weight)−1). Under artificial respiration the chest cavity was opened. An injection needle, connected to a perfusion line, was pushed through the right atrial wall, and control Tyrode solution was directly infused into the atrial cavity at a rate of ∼10 ml min−1 at a hydrostatic pressure of ∼70 cmH2O. To avoid mixing of the perfusate with venous return, and also to expand the atrial cavity using the perfusion pressure, the superior and inferior venae cavae were ligatured. The inferior vena cava was then cut distal to the ligature to allow drainage of perfusate, which passed through the pulmonary and then the systemic circulation. Within several minutes the drainage became largely blood free. Spontaneous heart beat was stopped by switching the perfusate from control Tyrode solution to a nominally Ca2+-free Tyrode solution. Then the Ca2+-free Tyrode solution containing trypsin (Trypsin, Wako Pure Chemicals, Japan, 40 mg dl−1) was applied for ∼5-6 min to remove the endocardial endothelium. Collagenase solution (Collagenase, Wako, Japan, 85 mg dl−1 Ca2+-free Tyrode solution) was then perfused for ∼5 min. After perfusing the right atrial cavity with trypsin and then collagenase, the heart was dissected out into fresh collagenase solution. The right atrium was opened by cutting along the atrial septum and also by cutting the ventral wall of the superior vena cava. The atrial tissue including the SA node was dissected out and was gently shaken in the collagenase solution containing elastase (1 mg (10ml)−1; Elastase, Boehringer Mannheim GmbH, Germany). The total duration of the enzyme treatment was 20–25 min, adjusted by examining the extent of tissue digestion under a dissection microscope. Finally, the digested tissue (see Fig. 1) was put in modified KB solution (see below), and trimmed with scissors into a small SA node fragment of ∼1 mm in width and 3∼4 mm in length. The area enclosed by the hexagon in Fig. 1A indicates the approximate area from where a small fragment of the tissue was dissected out. The major bundle of atrial cells running through crista terminalis was discarded. The small fragment of SA node tissue was placed in fresh KB solution (in a 35 mm dish) and SA node cells were dissociated by gently puffing KB solution onto the tissue. The dissociated cells were stored in the same solution at 4°C for use within about 5 h. The present study did not separate the true and follower-type pacemaker cells, if present. To compensate for this, we carefully examined action potential, whole-cell current and cell morphology (see Results).
Figure 1. Rat sinoatrial (SA) node tissue after enzyme treatment (A) and a myocyte isolated by enzyme treatment (B).
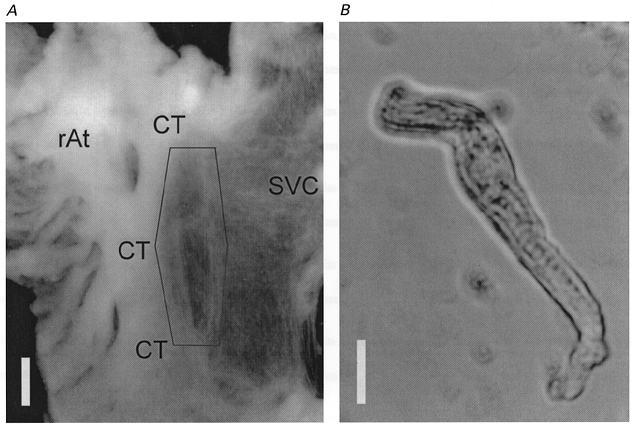
A, atrial tissue after enzyme treatment was mounted on the bottom of a chamber with the endocardial side up. The crista terminalis (CT), right atrium (rAt) and thin vein wall of superior vena cava (SVC) were clearly visible even after the enzyme treatment. The hexagon indicates the area from where the tissue was dissected to dissociate the SA node cells. The calibration bar is 1 mm. B, the SA node cell in the recording chamber was spindled shaped and showed spontaneous action potentials with slow diastolic depolarization. The calibration bar is 10 μm. The cell ends are out of focus because both cell ends bent upward from the bottom of the recording chamber.
In three experiments the rate of spontaneous contractions was measured, using a tension transducer, on man-made tissue strips, which were dissected parallel to the crista terminalis from the SA node area enclosed by the hexagon in Fig. 1.
Solutions
The control Tyrode solution contained (mM): NaCl 140.0, KCl 5.4, NaH2PO4 0.33, CaCl2 1.8, MgCl2 0.5, glucose 5.5 and N-(2-hydroxyethyl)piperizine-N’-(2-ethanesulphonic acid) (Hepes) 5.0; pH was adjusted to 7.4 with NaOH. The content of CaCl2 was decreased to 0.1 or 0 mM (nominally Ca2+-free solution) when appropriate. The modified KB solution (high-K+, low-Cl− solution; Isenberg & Klöckner, 1982) contained (mM): glutamic acid 70.0, KCl 25.0, KH2PO4 10.0, 2-aminoethane sulphonic acid (taurine) 10.0, glucose 11.0, O,O ‘-bis(2-aminoethyl) ethylene-glycol-N,N,N’,N’-tetraacetic acid (EGTA) 0.5 and Hepes 10.0; pH was adjusted to 7.2 with KOH. CsCl (2 or 5 mM) or BaCl2 (0.5 mM) was added to the control Tyrode solution without any replacement when required.
The composition of K+-rich internal solution was (mM): KOH 120.0, aspartic acid 110.0, KCl 20.0, MgCl2 1.0, adenosine 5′-triphosphate dipotassium salt (ATP-K2) 5.0, guanine 5′-triphosphate sodium salt (GTP-Na) 0.1, adenine 3′,5′-cyclic monophosphate (cyclic AMP) 0.05, EGTA 5.0 and Hepes 10.0; pH was adjusted to 7.2 with KOH. The Cs+-rich pipette solution contained (mM): CsOH 130.0, tetraethyl-ammonium chloride (TEA-Cl) 20.0, EGTA 5.0, CaCl2 1.1, ATP-Mg 5.0, GTP-Na 0.1, cyclic AMP 0.05 and Hepes 10.0; pH was adjusted to 7.2 with aspartic acid.
E4031, a blocker of IKr, was a gift from Eisai Pharmaceutical (Tokyo, Japan) and was dissolved in distilled water as a 1 mM stock solution and was then added to the bath solution. Nicardipine was purchased from Sigma and tetrodotoxin (TTX) was from Wako Pure Chemicals Inc., Osaka, Japan.
Whole-cell recordings
Using a patch clamp amplifier (EPC-7; List, Darmstadt, Germany), the whole-cell current or membrane potential of dissociated myocytes was recorded. The external tip diameter of patch electrodes was 2–3 μm and the electrical resistance was 3–7 MΩ. The input capacitance of myocytes was determined by integrating capacitive current at the onset of a voltage jump. A liquid junction potential of -10 mV was assumed between the pipette solution and Tyrode solution, and was corrected for all potential measurements. All experiments were carried out at 35–37°C.
Results
Spontaneous action potentials
A picture of a single SA node myocyte, which showed regular spontaneous action potentials, is shown in Fig. 1B. This cell showed faint sarcomere striations and slender cell ends. These spontaneous cells were typically 60–100 μm in length and less than 10 μm in width. The whole-cell recording from single myocytes was frequently interrupted by a progressive run-down of all voltage- and time-dependent currents or by a marked increase of leak current. Paired or triplet cells, which could not always be discriminated from a single cell under the microscope, provided more stable recording, and were used in addition to single cells unless a sign of clamp failure, such as the delayed peak time of transient inward current, was evident. Thus, the input capacitance of the preparation, as measured soon after establishing whole-cell clamp, varied over a wide range of 43–158 pF.
Figure 2A shows two examples of spontaneous action potentials recorded using the K+-rich pipette solution. In all these records, the smooth transition is evident from the slow diastolic depolarization to the rising phase of the action potential. One of the criteria of cardiac pacemaker cells may be the presence of If. Cells were separated into two groups, which showed evident If (Fig. 2A1) and no obvious If (Fig. 2A2) as examined by hyperpolarizing voltage clamp pulses beyond -140 mV. Table 1 compares the action potential parameters in these two groups of cells. No significant differences were found in parameters between groups A and B. The new finding here is that the spontaneous action potential was observed even in myocytes showing no obvious If.
Figure 2. Spontaneous action potentials of rat SA node cells.

A, original recordings of action potentials obtained from a cell showing If at hyperpolarizing test pulses beyond -100 mV (A1) and from one which did not show If even at potentials beyond -140 mV (A 2). B, the action potentials in the upper panel (B 1) were obtained before, and those in the lower panel (B 2) after the application of 3 μM TTX. The horizontal lines indicate zero potential. The pipette solution was K+-rich pipette solution, and the bath solution control Tyrode solution.
Table 1.
Action potential parameters of rat sino-atrial node cells
| Groups | n | Overshoot(mV) | MDP(mV) | Amplitude(mV) | 50% duration(ms) | Upstroke velocity(V s−1) | Beat rate(min−1) |
|---|---|---|---|---|---|---|---|
| A | 5 | 14.8 ± 10.8 | −57.6 ± 7.6 | 72.5 ± 17.9 | 73.9 ± 16.4 | 4.4 ± 3.9 | 214 ± 58 |
| B | 7 | 19.6 ± 5.7 | −53.0 ± 7.0 | 72.5 ± 9.6 | 95.3 ± 29.7 | 2.4 ± 1.2 | 165 ± 28 |
A, parameters of rat cells showing If. B, parameters of cells of rats which did not show If. MDP, maximum diastolic potential. Values are the means ±s.d. No significant differences were found between groups A and B.
The effect of TTX on spontaneous action potentials was examined in Fig. 2B. After recording the control (Fig. 2B1), action potentials were obtained about 60 s after applying 3 μM TTX (Fig. 2B2). In five experiments, the rate of spontaneous action potentials had decreased to 90.6 ± 4.0 % (mean ±s.d.) of the control of 254 ± 30 min−1. Since the spontaneous rate was not always stable in the dissociated cells attached to the patch electrode, the effect of TTX was also tested in multi-cellular preparations. When 3 μM TTX was applied to man-made tissue strips of SA node, the spontaneous rate of contraction decreased by 18, 12 and 9 % from 247, 272 and 211 min−1, respectively, in a reversible manner.
Time-dependent currents of the rat SA node
To characterize the rat pacemaker cells further and also to compare them with those of other species, whole-cell currents were recorded with the standard pulse protocol. The test pulses were applied in 10 mV increments from a holding potential of -40 mV. Figure 3 shows original current records (A) and early (•) and late (^) current-voltage (I–V) relationships (B). The membrane conductance was very small over the range from -30 to -70 mV (Fig. 3B), and time-dependent current changes were minimal (Fig. 3A), except for the transient inward current on switching off hyperpolarizing pulses of -60 to -80 mV. This transient inward current is attributable to Na+ channels activated by the depolarizing voltage step at the end of negative pulses, since Na+ inactivation is partially removed by the preceding hyperpolarization. With larger depolarizing pulses (-20 to +20 mV), the activation of inward Ca2+ current was evident at the onset of depolarizing pulses. The depolarizing pulses also induced the time-dependent increase of outward currents, accompanied by the outward tail current on repolarization. In the I–V relationship, the activation of Ca2+ currents was obvious at potentials positive to -30 mV and the peak amplitude was obtained between -10 and 0 mV. The transient inward current, measured as time-dependent current, reversed its polarity at potentials positive to +50 mV. This I–V relationship, as well as the nicardipine block (see below), is consistent with the L-type Ca2+ channel.
Figure 3. Whole-cell membrane currents of a rat SA node pacemaker cell.
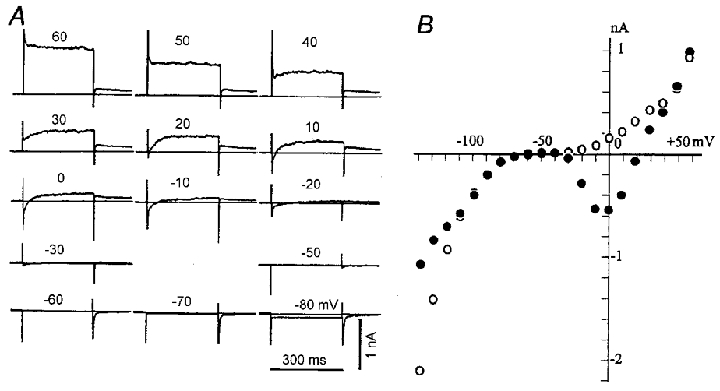
A, original current recordings induced by test pulses of 300 ms in duration to potentials indicated above traces (in mV). The holding potential was -40 mV. The horizontal line in each panel indicates the zero current. Peaks of the capacitive currents were trimmed. Internal solution was K+-rich pipette solution. B, I-V relationships of peak initial currents (•) and late currents (measured immediately before pulse offset, ^). The cell capacitance was 49 pF (a single cell).
On hyperpolarization beyond -90 mV, the membrane conductance immediately after the pulse onset markedly increased in a voltage-dependent manner as shown in Fig. 4A. At potentials more negative than -100 mV, following the inward jump at the pulse onset, the current clearly decayed within 30 ms, which is similar to the inactivation of inward rectifier K+ current (IK1). The hyperpolarization-activated cation current If was identified by the slow and continuous increase in the inward current during pulses beyond -110 mV. Approximately 50 % of SA node cells did not show If, and the current trace was nearly flat after the initial 30 ms decay, even at potentials more negative than -120 mV (data not shown).
Figure 4. Effects of Ba2+ on whole-cell membrane currents in rat.
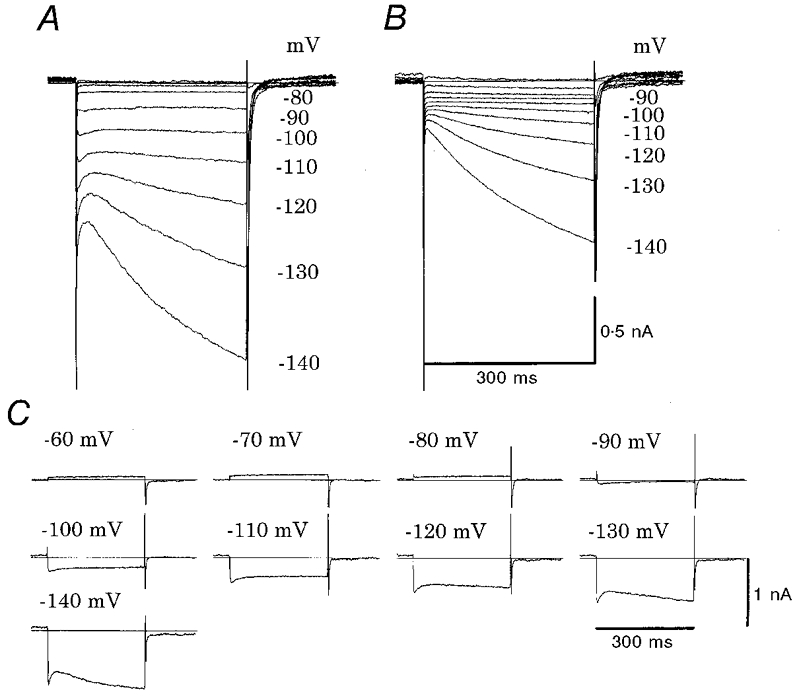
Membrane currents induced by various test pulses (300 ms duration) in 10 mV increments were superimposed in control (A) and in the presence of 0.5 mM Ba2+ (B) in control Tyrode solution. The holding potential was -40 mV. Note that the current traces at -50, -60 and -70 mV nearly overlapped with each other because of small membrane conductance. C, Ba2+-sensitive currents were calculated by subtracting the currents in the Ba2+ solution from those in the control Tyrode solution at potentials indicated. The horizontal line indicates zero current. The same cell as in Fig. 3.
Ba2+- and Cs+-sensitive currents
The presence of IK1 was unexpected in the SA node pacemaker cells (Irisawa et al. 1993). To separate IK1 from If at negative potentials, 0.5 mM Ba2+ or 2–5 mM Cs+ was applied to the bath solution. In the experiment shown in Fig. 4, Ba2+ was applied after recording the control (Fig. 4A). In the presence of Ba2+ (Fig. 4B), the initial current jump on hyperpolarization was largely depressed and concomitantly the rapid current decay within the initial 30 ms disappeared. The difference current, obtained by subtracting currents in the presence of Ba2+ from the control, revealed the marked inward rectification with a reversal potential between -80 and -90 mV (Fig. 4C). It should be noted that the difference current in Fig. 4C shows a small Ba2+-sensitive outward current over the range from -60 to -80 mV, typical for IK1. The slow increase in the difference current at approximately -120 to -140 mV can be explained by the partial inhibition of If by Ba2+ (DiFrancesco et al. 1991). The I–V curves for the difference currents are shown in Fig. 6 (IK1), where the reversal potential was -83.4 ± 3.7 mV (n= 9) in cells having obvious If (Fig. 6A) and -84.6 ± 7.4 mV (n = 7) in cells with no If (Fig. 6B).
Figure 6. I–V relationships for various current components.
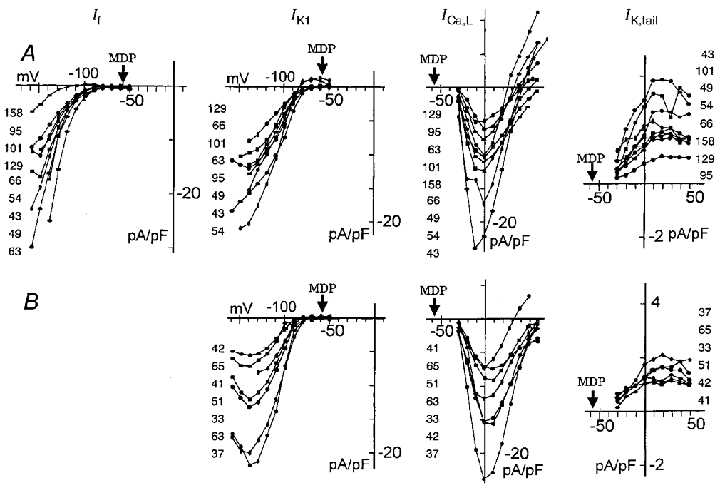
Upper panels (A) show I–V curves in the cells which showed If, and lower panels (B) show those cells which did not show If. The current components are indicated at the top of each column. The amplitude of If was determined as the time-dependent increase from the level at 30 ms after the onset of the test pulse to that near the pulse end. IK1, Ba2+-sensitive currents measured 30 ms after the pulse onset. The decrease of current amplitude beyond -130 mV is most probably due to the ionic block of the channel. ICa,L, the amplitudes measured from the current level at 100 ms to the peak of transient inward current. IK,tail, peak current values of the outward tail current on repolarization. The current density (pA pF−1) was determined by dividing the current amplitude by the cell capacitance (pF); these values are indicated for each I–V relationship on the left (or right in IKtail) approximately in order of increasing current amplitude. MDP, average maximum diastolic potential of -57.3 mV.
Since the presence of IK1 has not been examined in terms of the Ba2+-sensitive current, we recorded currents of rabbit SA node pacemaker cells. Figure 5 demonstrates a representative experiment, where records in panel A were obtained in control Tyrode solution, and in panel B were made in the presence of 0.5 mM Ba2+. It is evident that the rapid current decay observed in the rat within 30 ms after the pulse onset was absent in the rabbit even at -150 mV. Furthermore, Ba2+ failed to depress the initial jump as much as was observed in the rat myocytes. The arrows indicate the initial current level at the end of the capacitive current on hyperpolarizations to -150 mV. The slight decrease in the initial jump in the Ba2+ solution can be explained by a decrease in leak conductance as suggested by the slight decrease in the initial jump of the outward current at +40 and +50 mV. The slight depression of the outward tail current (IK) by Ba2+ observed in the upper panel of Fig. 5B is consistent with findings in a previous study (Osterrieder et al. 1982).
Figure 5. Effects of Ba2+ on whole-cell membrane currents in rabbit.
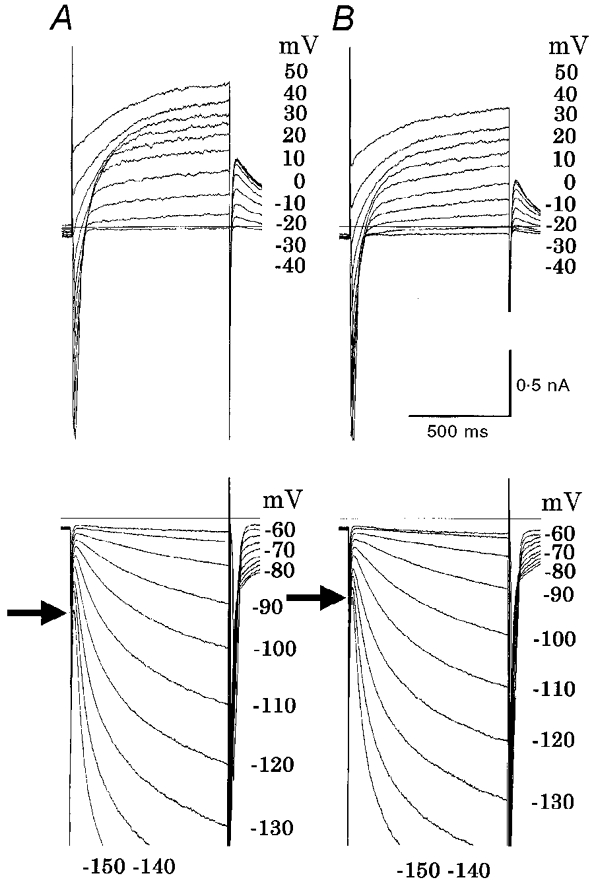
The same explanation as in Fig. 4A and B, except that the holding potential was -50 mV in this particular experiment. A, control; B, 0.5 mM Ba2+. The arrow indicates the initial current level immediately after the decay of capacitive current at -150 mV.
I–V relationships of individual current components
The time-dependent increase of inward current at potentials more negative than -90 mV remained in the Ba2+ solution, but was suppressed by applying 2–5 mM Cs+ (not shown) as in the case of rabbit If. Thus, the presence of INa, ICa,L, If, IKr and IK1 was suggested in rat SA node pacemaker cells. It might be suggested that the transient outward current, which is the most prominent current in rat ventricular myocytes, might be largely inactivated by the holding potential of -40 mV in Fig. 3. However, this is unlikely since we could not record marked transient outward current even when a more negative holding potential was used.
To examine cell-to-cell variation of these currents, amplitudes of the Cs+-sensitive current (If), the Ba2+-sensitive current (IK1), the amplitude of ICa,L measured from the current level at 100 ms to the peak of the transient inward current, and the outward tail current (IK,tail) were plotted in Fig. 6. IK,tail was plotted since it reflects the extent of activation of IKr during the preceding depolarizing pulses. The magnitude of outward current during depolarization cannot be a direct measure of activation because of strong voltage-dependent rectification of IKr (Ito & Ono, 1995). The data were all obtained from cells that showed typical spontaneous action potentials accompanied by slow diastolic depolarization. The cells showing an obvious activation of If are illustrated in the upper panels and the cells in which If was absent are shown in the lower panels. The activation of If was observed in only 9 out of 16 cells. Furthermore, activation of If was observed at potentials far more negative than the maximum diastolic potential (MDP in Fig. 6). It is also noted that the dynamic potential range of rat If activation was more negative (< -90 mV) than in the rabbit SA node cells, where the activation threshold was between -60 and -70 mV (Fig. 5).
The Ba2+-sensitive current (IK1, Fig. 6) was found in all cells irrespective of the presence of If, but with different current densities. The reversal potential at approximately -90 to -80 mV, and the rapid current decay at the onset of a strong hyperpolarizing pulse (Fig. 4C) are both consistent with IK1 so far described. However, in most cells the magnitude of outward IK1 was negligibly small over the range of the slow diastolic depolarization (less negative than -65 mV), so that the presence of IK1 will not interfere with the slow diastolic depolarization.
The 10 mV depolarization from -40 mV activated minimal ICa,L as shown in both the original record (Fig. 3) and I–V curves in Fig. 6 (ICa,L), and evident ICa,L was observed positive to -20 mV. The activation threshold at around -30 mV as well as the peak amplitude at around 0 mV is in good agreement with the measurement in the rabbit SA node (Hagiwara et al. 1988).
Since the outward tail current recorded on repolarization to -40 mV (IK,tail) was almost completely blocked by E4031 (n = 4, not shown), a selective blocker of IKr, the voltage-dependent activation of IKr was evaluated from IK,tail. The activation of current was already evident with the initial 10 mV depolarization and saturated near +10 to +20 mV (Fig. 6). This voltage range of activation agrees well with that for the rapid component of the delayed rectifier K+ current (IKr), but clearly differs from the slow component IKs, which is activated positive to 0 mV and saturates at +50 mV. The presence of outward tail current supports the view that the slow diastolic depolarization is primarily due to the time-dependent decay of IKr (Verheijck et al. 1995; Ono & Ito, 1995).
The sustained components of inward current
To examine whether Ist exists in rat SA node cells, depolarizing pulses were applied from the holding potential of -80 mV. To facilitate isolation of Ist, the membrane K+ conductance was blocked using the Cs+-rich internal solution, and If was blocked by adding 5 mM Cs+ to the external solution, which contained 1.8 mM Ca2+ as in control. All cells used showed regular spontaneous beating in the control solution. After recording control currents evoked by various test pulses, the same pulse protocol was repeated in the presence of 1 μM nicardipine. Figure 7A shows currents in control (^) and in the presence of nicardipine (•) superimposed at individual test potentials. The stable recording of the membrane current before and after the nicardipine application is indicated by the absence of the nicardipine-sensitive current during the hyperpolarizing pulses. Figure 7B shows I–V relationships measured near the pulse end in the control (^) and in the presence of the drug (•). It is obvious that a nicardipine-sensitive sustained inward current was activated by depolarization to -60 mV, and became larger with increasing depolarization up to -30 mV. In the original recordings in Fig. 7A, depolarizations beyond -30 mV evoked larger transient inward currents, which might be largely due to ICa,L. In addition, at the very beginning of depolarizing pulses (> -60 mV) a rapid inward current was recorded by the activation of INa.
Figure 7. Sustained inward currents blocked by nicardipine.
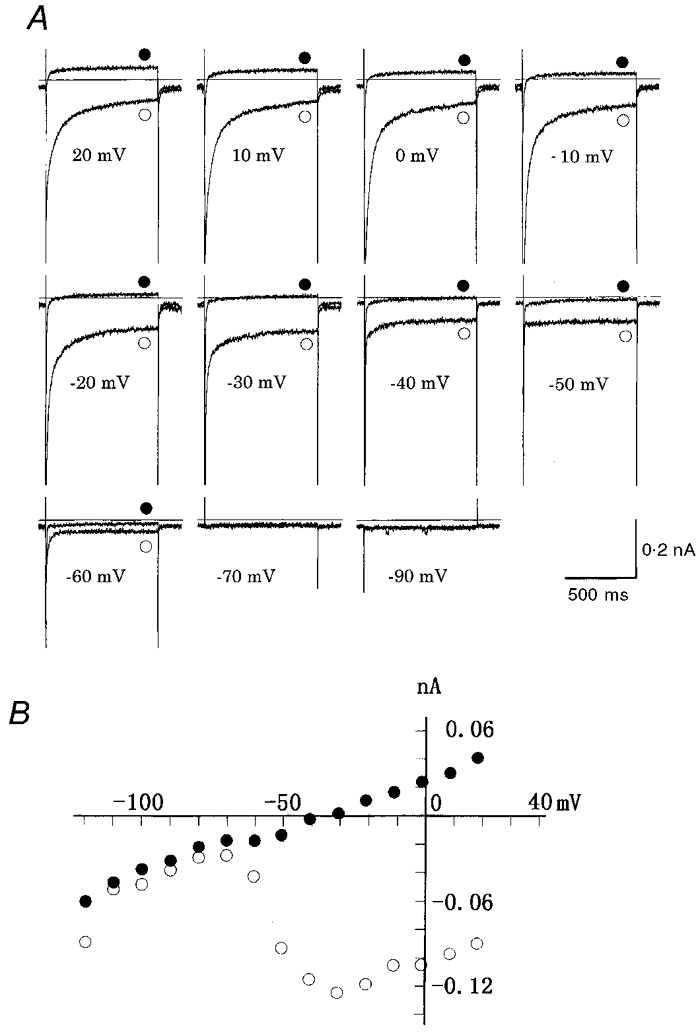
A, current recordings obtained in 5 mM Cs+ Tyrode solution (^) were superimposed on those obtained in the presence of 1 μM nicardipine (•) at the test potentials indicated. At -70 and -90 mV the two traces almost overlapped. The Cs+-rich pipette solution was used. The duration of test pulse was 800 ms and the holding potential was -80 mV. The concentration of Ca2+ in the Tyrode solution was 1.8 mM. B, late I–V relationships measured near the pulse end in control (^) and in the presence of nicardipine (•). The input capacitance was 52 pF (a single cell).
Ist in 0.1 mM [Ca2+]o solution
In Fig. 7A, the nicardipine-sensitive component should be the sum of Ist and ICa,L. In previous studies (Guo et al. 1995, 1997; Guo & Noma, 1997) the sustained inward current was separated from ICa,L by removing external Ca2+, because ICa,L is abolished by decreasing [Ca2+]o to less than 0.1 mM. The sustained inward current was also not depressed in the present study by decreasing external Ca2+ from 1.8 to 0.1 mM. Figure 8A shows the current records (^) in the test solution of 0.1 mM [Ca2+]o, obtained more than 50 s after switching the perfusate in the recording chamber. After recording the control, 100 nM isoprenaline was applied in the external 0.1 mM [Ca2+]o solution (^, Fig. 8B). Lastly 1 μM nicardipine was applied to suppress the sustained inward current. The nicardipine records (•) were superimposed on both sets of the recordings in Fig. 8A and B. It is evident that the amplitude of nicardipine-sensitive currents was increased by isoprenaline. The time-dependent decrease of the inward current during the initial 300 ms at -30 mV (Fig. 8B) might be due to either inactivation of Ist or overlapping ICa,L. Since the amplitude of ICa,L was enlarged by more than two-fold by isoprenaline, overlap of ICa,L could not be excluded at 0.1 mM [Ca2+]o. In fact, the time course of the inward current (Fig. 8B) is similar to ICa,L in normal [Ca2+]o solution. The I–V relationship of the nicardipine-sensitive current in the 0.1 mM [Ca2+] solution was measured near the end of the pulse, in order to avoid the overlapping ICa,L, and is shown in Fig. 8C. The peak value of nicardipine-sensitive current was at about -30 mV, and the magnitude became smaller with larger depolarizations and reversed between +10 and +20 mV.
Figure 8. Isoprenaline-induced increase of the nicardipine-sensitive currents at 0.1 mM [Ca2+]o.
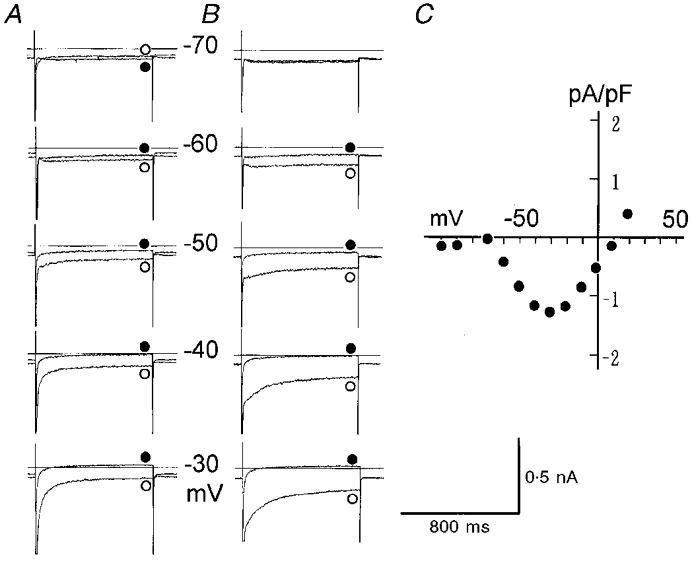
A and B, ICa,L was suppressed by decreasing [Ca2+]o to 0.1 mM, and the sustained inward current was obtained as the difference between the control (^) and that in the presence of 1 μM nicardipine (•) at test potentials indicated. The recording was repeated before (A) and during (B,^) the application of 100 nM isoprenaline in the same cell (input capacitance = 61 pF). The holding potential was -80 mV and the pulse duration was 800 ms. C, I-V relationships of the nicardipine-sensitive late current obtained in a different cell from that in A at 0.1 mM [Ca2+]o (input capacitance = 62 pF).
Ist was not recorded from quiescent SA node cells (n > 5). Furthermore, the current density of Ist showed a broad variation even in the cells showing a steady rhythm of spontaneous action potentials as shown in Fig. 9. The Ist amplitudes measured at -50 mV varied from 0 to 2.8 pA pF−1. Current densities larger than 2 pA pF−1 are similar to those described in the rabbit SA node cells (Guo et al. 1995), and are larger than those of the guinea-pig (0.6 pA pF−1; Guo et al. 1997). The reason for this large variation may partly be due to spontaneous run-down of the current after starting the whole-cell recording. In extreme cases the sustained inward current at -50 mV progressively decayed, accompanied by an increase in leak conductance.
Figure 9. Variable magnitudes of Ist among SA node cells.
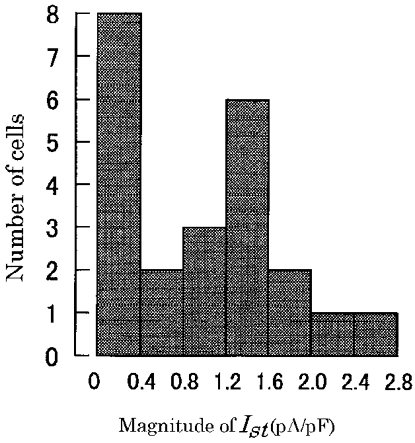
The ordinate indicates number of cells and the abscissa the amplitude of Ist at -50 mV, normalized to the cellular input capacitance. Total number of cells was 28.
Discussion
The present study demonstrates for the first time a patch clamp study of the cardiac pacemaker myocyte dissociated from rat SA node. The parameters of spontaneous action potentials were very similar to those recorded from other mammalian SA node cells (Irisawa et al. 1993). The activation of Ist over the potential range of slow diastolic depolarization was demonstrated in the spontaneously active myocytes, but Ist was absent in quiescent cells. Unexpectedly IK1 was recorded from all of the pacemaker cells examined in the present study. Since the voltage range for observing both If and IK1 was more negative than the maximum diastolic potential of ∼-60 mV, it is suggested that If and IK1 are not involved in developing the slow diastolic depolarization in rat. ICa,L will take the primary role in the rising phase, and IKr in the repolarization phase of the action potential, as suggested in the rabbit SA node cells. The deactivation of IKr after the maximum diastolic potential may contribute to the slow diastolic depolarization.
A gradual increase in the density of IK1 channels from node to atrium has been assumed in relation to the regional difference in the electrical activity of the rabbit SA node (Bouman et al. 1994). This assumption might be tested by conducting the patch clamp experiment in dissociated cells. However, it is still difficult to clearly discriminate between the true pacemaker and follower-type cells in spontaneously beating SA node cells after enzymatic dissociation. Honjo et al. (1996) made a partial success of correlating dissociated myocytes with regional differences. They demonstrated that the current density of If and INa were well correlated with the cellular input capacitance in the rabbit SA node, and that the action potential parameters of smaller cells corresponded well to those recorded from the central pacemaker region, while those of larger cells corresponded to the peripheral SA node region. However, IK1 was present in neither the larger nor the smaller cells of rabbit SA node. This is in strong contrast to the presence of IK1 in all spontaneously active cells examined in the present study. Since the region of tissue from where the cells were obtained in the present study should include the central pacemaker region (Fig. 1), it is strongly suggested that in rat the true pacemaker cells possess IK1.
In the neonatal rabbit SA node (Baruscotti et al. 1996), a relatively large contribution of INa was found, in contrast to the adult rabbit. In the present study TTX slightly decreased the spontaneous action potential rate of the rat SA node (by ∼10 %), which might be comparable to the TTX effect on the adult rabbit SA node. Although INa should be largely inactivated during the slow diastolic depolarization, it may contribute a small fraction of the net inward current during diastole. The presence of ICa,T could not be examined in the present study, since the membrane current became unstable after depleting external Na+.
The absence of If in about half of the spontaneously active cells and the very negative potential range of its activation (Fig. 6) might be caused artificially by dialysis of the intracellular medium with the pipette solution (DiFrancesco et al. 1986). To test this possibility, we checked If activated at very negative potentials from the beginning of whole-cell voltage clamp, and excluded the possibility of a marked run-down of If during the course of experiments. Furthermore, we added 50 μM cAMP to the pipette solution to inhibit run-down of the cAMP-dependent channel. We also confirmed that spontaneous action potentials resumed immediately after switching off the voltage clamp in the absence of If, or in the presence of If but at very negative potentials. Therefore, we conclude that the spontaneous action potentials recorded in the present study are independent of the activation of If.
Estimation of Ist amplitude during the slow diastolic depolarization
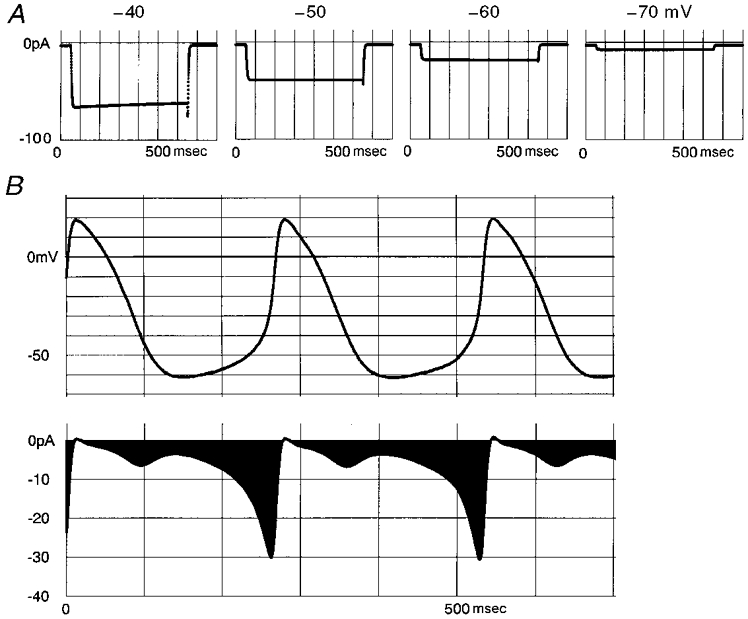
Although several pacemaker models have been published (Yanagihara et al. 1980; Noble & Noble, 1984; Wilders et al. 1991), the ionic mechanisms in the rat SA node can only be estimated by constructing new empirical equations for rat currents. If empirical equations can successfully reconstruct the voltage clamp records, irrespective of molecular gating mechanisms, these equations can be used to estimate the current size during the spontaneous action potentials recorded in experiments (van Ginneken & Giles, 1991; Maruoka et al. 1994). The same strategy was used to visualize how Ist contributes to the slow diastolic depolarization. In formulating the empirical equations for Ist, three assumptions were made: (1) the nicardipine-sensitive sustained inward current recorded at potentials more negative than the activation threshold of ICa,L (∼-40 mV) is attributable to Ist in rat (present study), guinea-pig (Guo et al. 1997), and rabbit (Guo et al. 1995); (2) the reversal potential of single channel current (Mitsuiye et al. 1999) corresponds to that of whole-cell Ist, which is actually close to the reversal potential of the nicardipine-sensitive current measured in the 0.1 mM [Ca2+]o solution (Fig. 8C); (3) the same formalism as ICa,L is applicable to Ist, since a molecular basis similar to the L-type Ca2+channel is assumed for Ist:
| (1) |
where Ist is a whole-cell current (32 pF cell) in pA, d and f are the activation and inactivation gate parameters of Ist, respectively, and E is the membrane potential (mV). The voltage dependence of the rate constants αd, βd, αf and βf were tentatively assumed as described in the legend to Fig. 10. The equations simulated the nicardipine-sensitive current well under voltage clamp between -60 and -40 mV (Fig. 7) as shown in Fig. 10A. The action potentials shown in Fig. 10B were recorded from a rat pacemaker cell and sampled to the computer memory at 2 kHz. State transitions of Ist were calculated bit by bit during each sampling interval (0.5 ms) at the voltage of individual sample points using the equations. The current density of Ist (1 pA pF−1) was simply set near to the mean value in Fig. 9. Ist is activated in a voltage-dependent manner during diastole (Fig. 10B). The amplitude of Ist becomes almost zero at the overshoot potential of the action potential, which is nearly equal to the reversal potential of Ist. During the early phase of repolarization, the driving force for Ist becomes larger, but near the maximum diastolic potential the channel is largely deactivated.
Figure 10.
| (2) |
| (3) |
| (4) |
| (5) |
It should be noted that the activation of Ist and gradual depolarization constitute a positive feedback loop during diastole to drive the slow diastolic depolarization. The same mechanism was previously suggested for ICa,L in rabbit (Verheijck et al. 1999). This mechanism is in contrast to the self-limiting process of voltage-dependent deactivation of the delayed rectifier K+ channels during diastole. In good agreement with the above consideration, the spontaneous beat was stopped by applying nicardipine at more than 0.2 μM to SA node tissue preparations (authors’ unpublished observation).
Comparison of the pacemaker cells between rat and rabbit
In the dissected rat SA node tissue preparation, the glass microelectrode technique usually fails to record the slow diastolic depolarization, which is followed by the smooth transition to the upstroke of the action potential. Thus, it was not practical to obtain single myocytes from the leading pacemaker and the follower pacemaker sites. In the rabbit SA node, the space constant for the electrotonic spread of the potential change ranged from 0.5 to 0.8 mm (Bonke, 1973; Seyama, 1976), and a homogeneous potential profile was obtained during the spontaneous action potentials by preparing a small specimen of ∼0.3 mm (Noma & Irisawa, 1976). We prepared such a small specimen from rat SA node tissue, which showed regular beating. In our preliminary recordings, however, it was difficult to record the pacemaker depolarization even in such a small tissue preparation. We assume that the size of the cell cluster, which takes the role of primary pacemaker within the tissue preparation, may be much smaller than in the rabbit heart. Alternatively, it may be speculated that the electrical coupling through gap junction channels between rat SA node cells may be poorly developed. We speculate that the former possibility is likely, since the number of spontaneously beating cells was very small in the dissociated rat SA node cells.
Acknowledgments
The authors thank Dr T. Mitsuiye, K. Ono and M. Takano for their discussion during the work, Mr M. Fukao for his technical assistance and Kanako Fujita for her secretarial services. The work was supported by a research grant from the Ministry of Education, Science and Culture of Japan and CREST (Core Research for Evolutional Science and Technology) of Japan Science and Technology Corporation.
References
- Anumonwo JMB, Freeman LC, Kwok WM, Kass RS. Delayed rectification in single cells isolated from guinea pig sinoatrial node. American Journal of Physiology. 1992;262:H921–925. doi: 10.1152/ajpheart.1992.262.3.H921. [DOI] [PubMed] [Google Scholar]
- Baruscotti M, DiFrancesco D, Robinson RB. A TTX-sensitive inward sodium current contributes to spontaneous activity in newborn rabbit sino-atrial node cells. The Journal of Physiology. 1996;492:21–30. doi: 10.1113/jphysiol.1996.sp021285. [DOI] [PMC free article] [PubMed] [Google Scholar]
- Bois P, Lenfant J. Isolated cells of the frog sinus venosus: properties of the inward current activated during hyperpolarization. Pflügers Archiv. 1990;416:339–346. doi: 10.1007/BF00392071. [DOI] [PubMed] [Google Scholar]
- Bonke FIM. Electrotonic spread in the sinoatrial node of the rabbit heart. Pflügers Archiv. 1973;339:17–23. doi: 10.1007/BF00586978. [DOI] [PubMed] [Google Scholar]
- Bouman LN, Verheijck EE, van Ginneken ACG. Atrio-sinus interaction in rabbit SA node demonstrated by blockade of delayed rectifier (IK) The Journal of Physiology. 1994;479.P:68P. [Google Scholar]
- Brown HF, Clark A, Noble SJ. Identification of the pace-maker current in frog atrium. The Journal of Physiology. 1976a;258:521–545. doi: 10.1113/jphysiol.1976.sp011434. [DOI] [PMC free article] [PubMed] [Google Scholar]
- Brown HF, Clark A, Noble SJ. Analyses of the pace-maker and repolarization currents in frog atrial muscle. The Journal of Physiology. 1976b;258:547–577. doi: 10.1113/jphysiol.1976.sp011435. [DOI] [PMC free article] [PubMed] [Google Scholar]
- Brown HF, Giles W, Noble S. Membrane currents underlying activity in frog sinus venosus. The Journal of Physiology. 1982;271:783–816. doi: 10.1113/jphysiol.1977.sp012026. [DOI] [PMC free article] [PubMed] [Google Scholar]
- DiFrancesco D, Ferroni A, Mazzanti M, Tromba C. Properties of the hyperpolarization-activated current (if) in cells isolated from the rabbit sino-atrial node. The Journal of Physiology. 1986;377:61–88. doi: 10.1113/jphysiol.1986.sp016177. [DOI] [PMC free article] [PubMed] [Google Scholar]
- DiFrancesco D, Porciatti F, Cohen IS. The effects of manganase and barium on the cardiac pacemaker current, if, in rabbit sino-atrial node myocytes. Experientia. 1991;47:449–452. doi: 10.1007/BF01959940. [DOI] [PubMed] [Google Scholar]
- Giles WR, Shibata EF. Voltage clamp of bull-frog cardiac pace-maker cells: a quantitative analysis of potassium currents. The Journal of Physiology. 1985;368:265–292. doi: 10.1113/jphysiol.1985.sp015857. [DOI] [PMC free article] [PubMed] [Google Scholar]
- Guo J, Mitsuiye T, Noma A. The sustained inward current in sino-atrial node cells of guinea-pig heart. Pflügers Archiv. 1997;433:390–396. doi: 10.1007/s004240050293. [DOI] [PubMed] [Google Scholar]
- Guo J, Noma A. Existence of a low-threshold and sustained inward current in rabbit atrio-ventricular node cells. Japanese The Journal of Physiology. 1997;47:355–359. doi: 10.2170/jjphysiol.47.355. [DOI] [PubMed] [Google Scholar]
- Guo J, Ono K, Noma A. A sustained inward current activated at the diastolic potential range in rabbit sino-atrial node cells. The Journal of Physiology. 1995;483:1–13. doi: 10.1113/jphysiol.1995.sp020563. [DOI] [PMC free article] [PubMed] [Google Scholar]
- Hagiwara N, Irisawa H, Kameyama M. Contribution of two types of calcium currents to the pacemaker potentials of rabbit sino-atrial node cells. The Journal of Physiology. 1988;395:233–253. doi: 10.1113/jphysiol.1988.sp016916. [DOI] [PMC free article] [PubMed] [Google Scholar]
- Honjo H, Boyett MR, Kodama I, Toyama J. Correlation between electrical activity and the size of rabbit sino-atrial node cells. The Journal of Physiology. 1996;496:795–808. doi: 10.1113/jphysiol.1996.sp021728. [DOI] [PMC free article] [PubMed] [Google Scholar]
- Hume JR, Giles W. Active and passive electrical properties of single bullfrog atrial cells. Journal of General Physiology. 1981;78:19–42. doi: 10.1085/jgp.78.1.19. [DOI] [PMC free article] [PubMed] [Google Scholar]
- Hume JR, Giles W. Ionic currents in single isolated bullfrog atrial cells. Journal of General Physiology. 1983;81:153–194. doi: 10.1085/jgp.81.2.153. [DOI] [PMC free article] [PubMed] [Google Scholar]
- Irisawa H, Brown HF, Giles W. Cardiac pacemaking in the sino-atrial node. Physiological Reviews. 1993;73:197–227. doi: 10.1152/physrev.1993.73.1.197. [DOI] [PubMed] [Google Scholar]
- Isenberg G, Klöckner U. Calcium tolerant ventricular myocytes prepared by incubation in a ‘KB medium’. Pflügers Archiv. 1982;395:6–18. doi: 10.1007/BF00584963. [DOI] [PubMed] [Google Scholar]
- Ito H, Ono K. A rapidly activating delayed rectifier K+ channel in rabbit sionoatrial node cells. American Journal of Physiology. 1995;269:H443–452. doi: 10.1152/ajpheart.1995.269.2.H443. [DOI] [PubMed] [Google Scholar]
- Maruoka F, Nakashima Y, Takano M, Ono K, Noma A. Cation-dependent gating of the hyperpolarization-activated cation current in the rabbit sino-atrial node cells. The Journal of Physiology. 1994;477:423–435. doi: 10.1113/jphysiol.1994.sp020204. [DOI] [PMC free article] [PubMed] [Google Scholar]
- Mitsuiye T, Guo J, Noma A. Nicardipine-sensitive Na+ channels in sinoatrial node cells of guinea-pig heart. The Journal of Physiology. 1999;521:69–79. doi: 10.1111/j.1469-7793.1999.00069.x. [DOI] [PMC free article] [PubMed] [Google Scholar]
- Noble D, Noble SJ. A model of sino-atrial node electrical activity based on a modification of the DiFrancesco-Noble (1984) equations. Proceedings of the Royal Society B. 1984;222:295–304. doi: 10.1098/rspb.1984.0065. [DOI] [PubMed] [Google Scholar]
- Noma A, Irisawa H. Membrane currents in the rabbit sinoatrial node cell as studied by the double microelectrode method. Pflügers Archiv. 1976;364:45–52. doi: 10.1007/BF01062910. [DOI] [PubMed] [Google Scholar]
- Ono K, Ito H. Role of rapidly activating delayed rectifier K+ current in sinoatrial node pacemaker activity. American Journal of Physiology. 1995;269:H453–462. doi: 10.1152/ajpheart.1995.269.2.H453. [DOI] [PubMed] [Google Scholar]
- Osterrieder W, Yang Q-F, Trautwein W. Effect of barium on the membrane currents in the rabbit S-A node. Pflügers Archiv. 1982;394:78–84. doi: 10.1007/BF01108311. [DOI] [PubMed] [Google Scholar]
- Seyama I. Characteristics of the rectifying properties of the sino-atrial node cell of the rabbit. The Journal of Physiology. 1976;255:379–397. doi: 10.1113/jphysiol.1976.sp011285. [DOI] [PMC free article] [PubMed] [Google Scholar]
- van Ginneken ACG, Giles W. Voltage clamp measurements of the hyperpolarization-activated inward current If in single cells from rabbit sino-atrial node. The Journal of Physiology. 1991;434:57–83. doi: 10.1113/jphysiol.1991.sp018459. [DOI] [PMC free article] [PubMed] [Google Scholar]
- Verheijck EE, van Ginneken ACG, Bourier J, Bouman LN. Effects of delayed rectifier current blockade by E-4031 on impulse generation in single sinoatrial nodal myocytes of the rabbit. Circulation Research. 1995;76:607–615. doi: 10.1161/01.res.76.4.607. [DOI] [PubMed] [Google Scholar]
- Verheijck EE, van Ginneken ACG, Wilders R, Bouman LN. Contribution of L-type Ca2+ current to electrical activity in sinoatrial nodal myocytes of rabbits. American Journal of Physiology. 1999;276:H1064–1077. doi: 10.1152/ajpheart.1999.276.3.H1064. [DOI] [PubMed] [Google Scholar]
- Wilders R, Jongsma HJ, van Ginneken AC. Pacemaker activity of the rabbit sinoatrial node. A comparison of mathematical models. Biophysical Journal. 1991;60:1202–1216. doi: 10.1016/S0006-3495(91)82155-5. [DOI] [PMC free article] [PubMed] [Google Scholar]
- Yanagihara K, Noma A, Irisawa H. Reconstruction of sino-atrial node pacemaker potential based on the voltage clamp experiments. Japanese Journal of Physiology. 1980;30:841–857. doi: 10.2170/jjphysiol.30.841. [DOI] [PubMed] [Google Scholar]


