Abstract
A chloride current with mild outward rectification was induced in the native bovine non-pigmented ciliary epithelial (NPCE) cells by a 23 % hypotonic solution. The current showed no or little inactivation at depolarized steps.
ATP blocked 88 and 61 % of the outward and inward components of the volume-activated chloride current (ICl,vol) with an IC50 of 5.3 and 9.6 mm, respectively.
The volume-activated chloride current was decreased and the activation of the current was delayed by inhibiting endogenous ClC-3 expression using a ClC-3 antisense oligonucleotide. The inhibition of the current as a function of antisense concentration was asymptotic with a maximum about 60 %. The remaining current was probably not derived from ClC-3 and was inhibited by ATP.
ClC-3 expression in the bovine NPCE cells was verified by immunofluorescence studies. ClC-3 immunofluorescence was distributed throughout the cells but with the predominant location within the nucleus. The expression of ClC-3 protein was diminished by the ClC-3 antisense oligonucleotide with the greatest diminution occurring in the nuclear region.
The size of the volume-activated chloride current was positively correlated with the ClC-3 immunofluorescence level.
Regulatory volume decrease of the NPCE cells was reduced by ClC-3 antisense oligonucleotide.
We conclude that endogenous ClC-3 is associated with the volume-activated chloride current and is involved in cell volume regulation, but that it can only contribute towards a proportion of the current in NPCE cells.
The nuclear predominance of ClC-3 immunofluorescence in NPCE cells, the absence of basal activity of chloride current and the marked pharmacological differences between IClC-3 and ICl,vol argue against ClC-3 being the only, or even the main, volume-activated chloride channel in NPCE cells.
Volume-activated chloride currents play an important role in cell homeostasis and the regulation of cell volume (reviewed by Strange, 1994; Okada, 1997; Lang et al. 1998). Several proteins, among them ClC-2 (Gründer et al. 1992), ClC-3 (Duan et al. 1997), both members of the ClC gene family of chloride channels, mat-8 (Morrison et al. 1995), phospholemman (Moorman et al. 1995; Kowdley et al. 1997), pICln (Paulmichl et al. 1992) and P-glycoprotein (P-gp) (Valverde et al. 1992; Gill et al. 1992; Wu et al. 1996), have been reported to be associated with this current in a variety of cell types. Although volume-activated chloride currents are usually referred to collectively, there are reports of a number of separate, independent volume-activated chloride channels at the single channel level. For example, Zhang & Jacob (1997) report three different single chloride channels in ciliary epithelial cells, identified by cell-attached patch clamping, with conductances of 8, 19 and 105 pS, all of which are activated by cell swelling. In A6 cells three different channels, with linear conductances of 12, 30 and 42 pS, were characterized on the basis of their I–V relationships; a fourth, outwardly rectifying, channel had inward and outward conductances of 16 and 57 pS, respectively (Banderali & Ehrenfeld, 1996). When expressed in Xenopus oocytes, ClC-3 gives rise to currents that are similar to volume-activated chloride currents in other cells (Kawasaki et al. 1994). Duan et al. (1997) have demonstrated that the current resulting from the expression of a cardiac clone of ClC-3 in NIH/3T3 cells was strongly modulated by volume. P-gp (Wu et al. 1996), ClC-3 and pICln (Coca-Prados et al. 1996) have all been identified in ciliary epithelial cells and it has been hypothesized that both P-gp and pICln are chloride channel regulators (Coca-Prados et al. 1995; Wu et al. 1996; Zhang & Jacob, 1997). On the basis of the similarity between volume-activated currents in these cells and that arising from ClC-3 expression in oocytes (Kawasaki et al. 1994), it has been suggested that ClC-3 is the volume-activated chloride channel (Coca-Prados et al. 1996). However, no study has been made on the effect of abolishing endogenous ClC-3 expression. We have tested the hypothesis that ClC-3 is the volume-activated Cl− channel by using antisense inhibition techniques to reduce expression of ClC-3 in non-pigmented ciliary epithelial cells and monitoring the effect on the volume-activated chloride current, ClC-3 immunofluorescence and cell volume regulation.
METHODS
Preparation of cells
Non-pigmented ciliary epithelial cells were prepared by a method similar to that described by Jacob et al. (1993). Fresh bovine eyes were obtained from local abattoirs. After the sclera and the cornea were removed from the tissue, the tips of the ciliary body were dissected from the eyes, washed 5 times with the sterilizing Ca2+-Mg2+-free buffer (mM: 125 NaCl, 5 KCl, 10 NaHCO3, 10 Hepes, 5 glucose and 20 sucrose, pH 7.4), and then dissociated using 0.25 % trypsin (Sigma) with 0.02 % EDTA in the Ca2+-Mg2+-free buffer for 30–40 min at 37°C. The tissue was triturated in a solution of culture medium E199 (Sigma) with 10 % fetal calf serum, spun at 500 g for 5 min, and washed twice. The cells were resuspended in E199 with 10 % fetal calf serum, 100 i.u. ml−1 penicillin and 100 μg ml−1 streptomycin, and plated on 6 mm uncoated glass coverslips, which were then put into 24-well tissue culture plates (3 coverslips in one well) and incubated overnight (14–18 h) at 37°C.
Antisense study
The antisense and sense oligonucleotides corresponding to the initiation codon region (−3 to +12) of the human ClC-3 mRNA (Borsani et al. 1995) were synthesized and purified by high performance liquid chromatography (HPLC; Severn Biotech Ltd, Milton Keynes, UK). The sequences of the guinea-pig (Duan et al. 1997), the mouse (Borsani et al. 1995), the rat (Kawasaki et al. 1994) and human (Borsani et al. 1995) ClC-3 gene are identical in this region. The antisense sequence was 5′-TCC ATT TGT CAT TGT-3′. The sense oligonucleotide had the sequence 5′-ACA ATG ACA AAT GGA-3′. The first three bases at either end in both oligonucleotides were phosphorothioated. For the measurement of the oligonucleotide uptake by the cells the oligonucleotides were labelled with fluorescein at the fifth and the eleventh bases in the antisense and at the seventh and the fifteenth bases in the sense. To facilitate the uptake of the oligonucleotides by the cells, the transfection agent lipofectin (Gibco-BRL, Paisley, UK) was used in the experiments. The cells on the coverslips, which were prepared as above and incubated overnight, were rinsed with serum-free E199. They were then cultured in serum-free E199 (0.5 ml) with or without oligonucleotide and lipofectin for 48 h before oligonucleotide fluorescence measurements, immunofluorescence detections, electrophysiological recordings and volume regulation experiments. All experiments using sense or antisense oligonucleotides were repeated at least 4 times, and the results obtained were reproducible.
Electrophysiological recordings
Whole-cell currents of single non-pigmented ciliary epithelial cells were recorded using the patch-clamp technique previously described (Jacob, 1991) with a List EPC-7 patch-clamp amplifier (List Electronic, Darmstadt, Germany). The small coverslips (6 mm) containing the prepared cells were stuck on large 22 mm coverslips and then stuck onto the base of the recording chamber (0.5 ml). The chamber was continuously perfused throughout the experiment at a rate of 5 ml min−1. Changes in tonicity were brought about by changing the solution perfusing the recording chamber. The experiments were performed at room temperature (20–24°C). The patch-clamp pipettes were manufactured from standard wall borosilicate glass capillaries with an inner filament (Clark Electromedical Instruments, Pangbourne, UK) on a two-stage vertical puller (PB-7, Narishige, Tokyo) and gave a resistance of 5–10 MΩ when filled with the pipette solution. The junction potential was corrected when the pipette entered the bath. Series resistance compensation was used. The command voltage and whole-cell currents were recorded simultaneously on a computer via a laboratory interface (CED 1401, Cambridge, UK) with a sampling rate of 1 kHz. The currents were filtered at 3 kHz using a 3-pole Bessel filter. Whole-cell currents are expressed as a function of cell capacitance (in pA pF−1). Cell capacitance was between 16 and 20 pF. If access resistance and leak currents did not remain constant during the experiment the results were discarded. The voltage pulse generation, data collection and current analysis were performed by the computer using the EPC software package (CED). Throughout the whole-cell recordings the cells, unless otherwise indicated, were held at the chloride equilibrium potential (0 mV), and then stepped to ± 40 and ± 80 mV for 200 ms, with a sojourn at 0 mV between each pulse, and with 4 s intervals between pulses. For I–V curves the cells were started at a voltage of −120 mV and stepped to 120 mV in 20 mV steps, each potential was held for 200 ms and the cell was returned to 0 mV. If more than one I–V curve was performed a 30 s interval was allowed. Otherwise the cells were continuously cycled through the voltage protocol. In the analysis of the data collected, all current measurements were made at 10 ms after the onset of each voltage step.
Whole-cell chloride currents were recorded using an intracellular solution containing (mM): 105 N-methyl-D-glucamine chloride (NMDG-Cl), 1.2 MgCl2, 10 Hepes, 1 EGTA, 70 D-mannitol and 2 ATP. The isotonic bath solution contained (mM): 105 NaCl, 0.5 MgCl2, 2 CaCl2, 10 Hepes and 70 D-mannitol. The osmolarity of the intracellular solution and the isotonic bath solution was adjusted to 300 mosmol l−1 with sucrose. The hypotonic bath solution was achieved by omitting the D-mannitol from the solution, giving an osmolarity of 230 mosmol l−1. The osmolarity of the solutions was confirmed by use of a freezing point osmometer (Osmomat 030, Gonotec, Berlin, Germany). The pH of the intracellular and bath solutions was adjusted to 7.25 and 7.4, respectively, with Tris base.
Detection of oligonucleotide fluorescence
The cells grown on coverslips and treated with or without fluorescein-labelled oligonucleotide and lipofectin for 48 h were washed with bath solution twice. The oligonucleotide fluorescence in the cells was then detected using an Odyssey real-time laser confocal microscope (Noran Instruments, Middleton, WI, USA). The focus was adjusted until the peak signal was obtained, then the images were acquired. To obtain a good signal-to-noise ratio 128 frames were averaged before image acquisition. For each field selected under the microscope, a pair of images (transmitted light image and the confocal fluorescence image) with the same focus and in the same position was acquired. The fluorescence intensity (grey level) of the fluorescence image of individual non-pigmented ciliary epithelial cells was measured by using the MetaMorph image analysis system (Universal Imaging Corporation, West Chester, PA, USA). The mean grey level in a group of cells was then calculated. The fluorescence (grey level) values are expressed in units on an 8-bit scale, where 0 = black and 255 = white.
Immunocytochemistry
The expression of ClC-3 was detected by using an immunocytochemical (immunofluorescence) technique. The cells, grown on coverslips and treated with or without oligonucleotide and lipofectin for 48 h, were briefly washed in pre-warmed phosphate-buffered saline (PBS; 37°C), and then fixed for 15 min in 4 % paraformaldehyde, 0.12 M sucrose, in PBS. After washing the cells 6 times with PBS, cells were permeabilized by incubation in 0.3 % Triton X-100 in PBS for 5 min, rinsed 6 times with PBS, blocked with 10 % sheep serum (Sigma) in PBS for 45 min, washed once with 1 % sheep serum in PBS, and then incubated in the refrigerator (4°C) overnight in the presence and absence of the primary antibody (rabbit anti-ClC-3 polyclonal antibody; diluted 1:10 in 1 % sheep serum in PBS; Alomone Labs, Jerusalem, Israel). Afterwards, the cells were washed 6 times with 1 % sheep serum in PBS and incubated for 1 h in secondary antibody (sheep anti-rabbit IgG conjugated with fluorescein isothiocyanate, diluted 1:50 in 1 % sheep serum in PBS; Sigma). Finally, the coverslips with cells were washed 6 times in PBS, inverted onto Vectashield mounting medium (Vector Laboratories Inc., Burlingame, CA, USA) on glass slides, sealed with nail varnish and examined by confocal microscopy in a way similar to that for oligonucleotide fluorescence measurement.
Volume measurements
Volume changes of the cells were monitored using a light reflection and light scattering technique (Chen et al. 1999). Briefly, under control conditions the monolayer of cells reflects a proportion of the incident beam of light onto the detector. When the cells swell, their shape changes, more of the incident light is scattered and less is reflected onto the detector. The glass coverslips with the cells that had been treated with or without oligonucleotide and lipofectin for 48 h were fixed in the perfused cuvette of the luminescence spectrometer (Perkin Elmer, Beaconsfield, Bucks, UK) at 45 deg to the incident beam of light. The cells were then illuminated with an excitation beam of 345 nm and reflected light was collected by the detector via a 392 nm monochromator to avoid saturating the detector. The experiments were carried out at room temperature (20–24°C). The isotonic and hypotonic bath solutions were the same as those used in electrophysiological experiments.
Statistical analysis
Statistical differences of the data were evaluated by Student's t test and considered significant at P < 0.05. Data are expressed as means ± standard error of the mean (n = number of observations).
RESULTS
Volume-activated chloride current
The whole-cell currents in single NPCE cells were recorded using the patch-clamp technique. Volume-activated chloride currents were induced by perfusing the cells with the hypotonic (230 mosmol l−1) solution. The chloride currents were activated after a certain latency (taken as the time between the exposure to hypotonic solution and the activation of the current). In control cells (no additives), the activated currents reached the peak or gradually levelled off 5–7 min after the exposure to hypotonic solution, although in some cells the currents continued to increase slowly. Thus the current 7 min after the activation was taken as the peak current activated. When isotonic solution was returned to the bath, the currents declined gradually toward control values. The cells appeared swollen and remained so under the microscope unless the bath solution had been changed back to the isotonic condition. Similar to the previous experiments (Chen et al. 1999), the hypotonic-activated currents exhibited mild outward rectification and time independence. The currents showed no or very little inactivation, even if the cells were depolarized to +120 mV. The hypotonic-activated currents reversed at −4.9 ± 0.5 mV (n = 26). In this study, there was no K+ present either in the electrode or bath solutions. The concentrations of Cl− inside and outside the cells were equal, giving 0 mV for ECl, which was very close to the reversal potential in the experiments. Under these conditions, we have previously demonstrated that the hypotonic-activated currents were primarily carried by Cl− (Wu et al. 1996; Chen et al. 1999).
The properties of ATP inhibition of volume-activated chloride current
At low concentrations, extracellularly applied ATP (1 mM) inhibited hypotonic-activated outward current, induced by a +80 mV step, by 17 % (P < 0.05, n = 6) (Fig. 1), but increased the inward current elicited by a −80 mV step by 21 % (P < 0.05, n = 6). Increasing the ATP concentration caused an inhibition of both the outward and inward currents. At 10 mM, ATP inhibited 88 % of the outward current (P < 0.01, n = 5) and 61 % of the inward current (P < 0.01, n = 5). The IC50 for ATP was 5.3 and 9.6 mM for the outward and inward components of ICl,vol, respectively.
Figure 1. Effects of ATP on the hypotonic-induced currents.
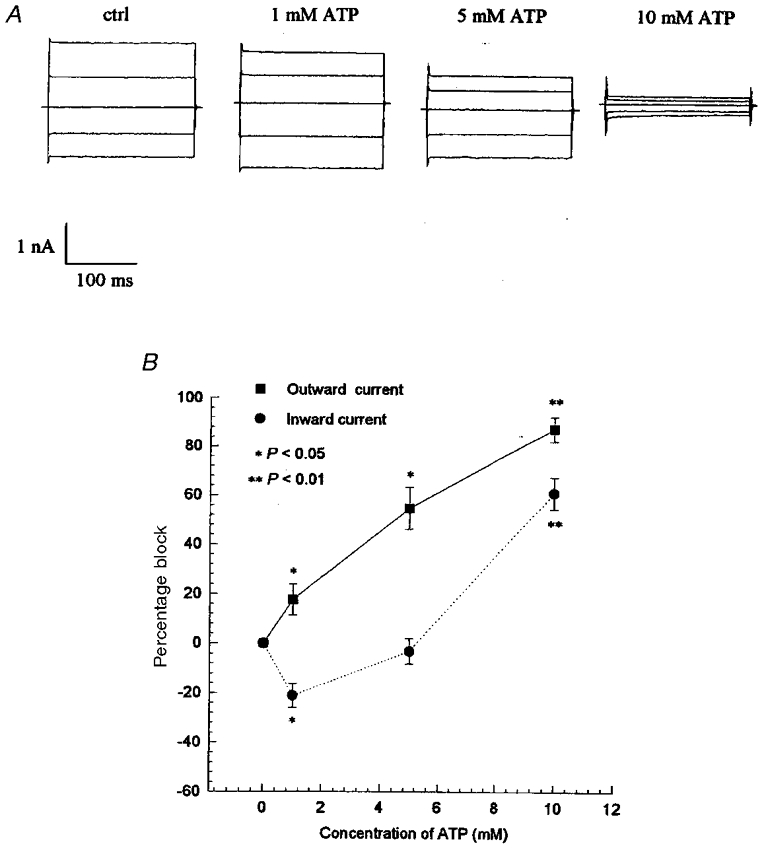
After the chloride currents were activated by hypotonic solution for 7 min, the hypotonic bath solution was changed to hypotonic solution containing 0 (ctrl, n = 5), 1 mM (n = 6), 5 mM (n = 4) and 10 mM ATP (n = 5), and then changed back to isotonic bath solution 10 min after ATP treatments. A, the typical whole-cell current traces of the volume-activated currents under different treatments in the NPCE cells cycled through the 200 ms voltage steps (±40, 0, ±80 mV; 4 s interval). B, the percentage inhibition of mean outward (induced by a +80 mV step) and inward currents (induced by a −80 mV step) activated by hypotonic solution. The data represent the means ±s.e.m. of the number of experiments indicated above.
Inhibition of volume-activated chloride current by ClC-3 antisense oligonucleotide
To investigate the role of endogenous ClC-3 in the activation of the volume-activated chloride current, we designed an antisense oligonucleotide to hybridize to the initiation codon region of ClC-3 mRNA. The ciliary epithelial cells were incubated in the culture medium containing 0.1, 1, 10, 50 or 200 μg ml−1 ClC-3 antisense oligonucleotide with 20 μg ml−1 lipofectin for 48 h. The whole-cell currents of the non-pigmented ciliary epithelial cells under isotonic and hypotonic conditions were then recorded.
Similar to the situation with the control cells (no additives) only small currents were recorded under isotonic conditions. However, the hypotonic-activated chloride currents of the cells treated with ClC-3 antisense oligonucleotide were quite different from those of control cells (Fig. 2). The volume-activated chloride currents activated with more difficulty and more slowly in hypotonic solution (230 mosmol l−1) and the currents were diminished after antisense treatment.
Figure 2. The time course of the hypotonic-activated chloride current.
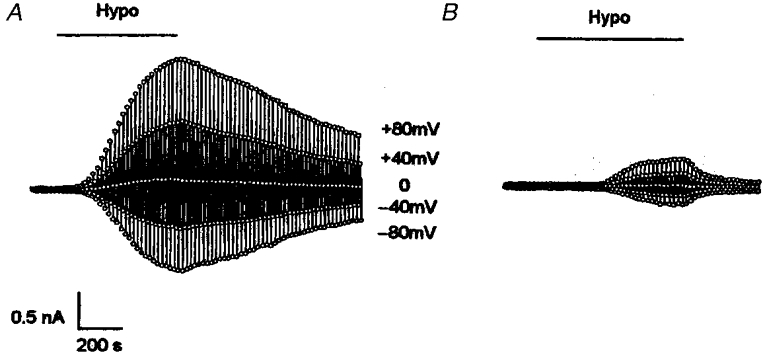
The value of the whole-cell current of the NPCE cells, taken 10 ms after the start of the 200 ms voltage steps (±40, 0, ±80 mV; 4 s interval), is plotted as a function of time following exposure to hypotonic solution (230 mosmol l−1). A, whole-cell currents in the cell incubated in control solution (no additives) for 48 h. B, whole-cell currents in the cell treated with 200 μg ml−1 ClC-3 antisense oligonucleotide and 20 μg ml−1 lipofectin for 48 h. Note that ClC-3 antisense oligonucleotide delayed the activation and inhibited the size of the volume-activated chloride current.
Furthermore, the effects of the ClC-3 antisense oligonucleotide on the volume-activated chloride currents were dose dependent. Figure 3 illustrates the inhibition of the volume-activated chloride current of the non-pigmented cells by antisense treatments. The currents taken 7 min after activation in response to all voltage steps (±40, 0, ±80 mV) were decreased in a dose-dependent manner. Along with the decline of the currents, the latency of activation of the volume-activated chloride currents was increased from 136.1 ± 16.9 s (control, n = 26) to 161.8 ± 34.4 s (n = 6), 257.9 ± 54.8 s (P < 0.01, n = 8), 266.0 ± 56.7 s (P < 0.01, n = 5), 280.5 ± 48 s (P < 0.01, n = 10) and 260.7 ± 28.3 s (P < 0.01, n = 17) in 20 μg ml−1 lipofectin plus 0.1, 1, 10, 50 and 200 μg ml−1 antisense, respectively.
Figure 3. Inhibition of volume-activated chloride current by ClC-3 antisense oligonucleotide in NPCE cells.
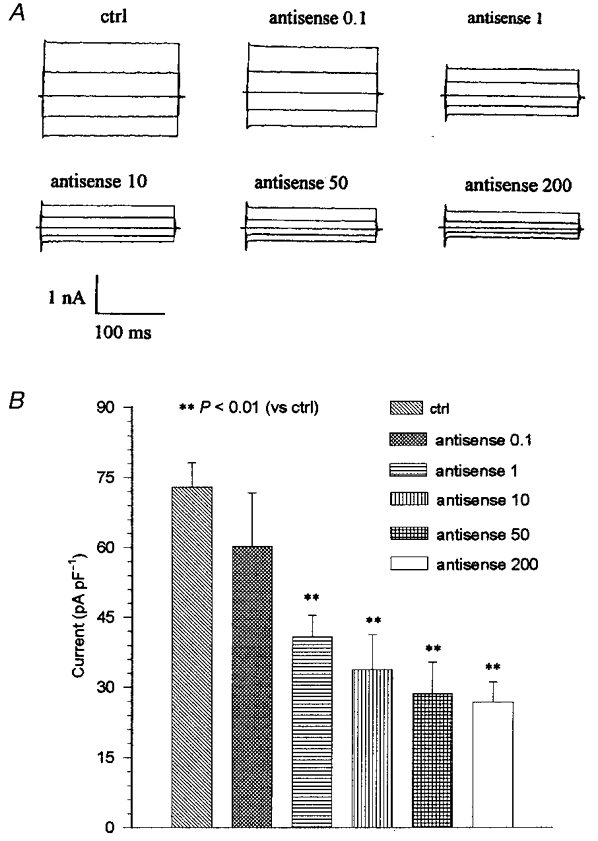
The ciliary epithelial cells were incubated in culture medium containing 0, 0.1, 1, 10, 50 or 200 μg ml−1 ClC-3 antisense oligonucleotide with 20 μg ml−1 lipofectin for 48 h (termed antisense 0.1, 1, 10, 50 and 200, respectively). A, the whole-cell current traces of the volume-activated currents under different treatments in the NPCE cells cycled through the 200 ms voltage steps (±40, 0, ±80 mV; 4 s interval). B, the mean values of the currents in a group of NPCE cells, measured 10 ms after the start of the +80 mV step, under different conditions. The number of cells used in each condition was: control, n = 26 and for 0.1, 1, 10, 50 and 200 μg ml−1 antisense n = 6, 8, 5, 10 and 17, respectively. The currents were inhibited by the ClC-3 antisense oligonucleotide in a dose-dependent manner.
The data above demonstrated that the ClC-3 antisense oligonucleotide could only inhibit a proportion of the volume-activated chloride current. However, a combination of antisense treatment and the extracellular application of ATP inhibited the current further. In the ClC-3 antisense group (incubating the cells with 200 μg ml−1 antisense oligonucleotide for 48 h), ATP blocked the remaining hypotonic-induced outward current by almost 100 % (n = 7, P < 0.01) and inward current by 71 % (n = 7, P < 0.01) (Fig. 4).
Figure 4. Inhibition of volume-activated chloride current by ClC-3 antisense oligonucleotide and ATP.
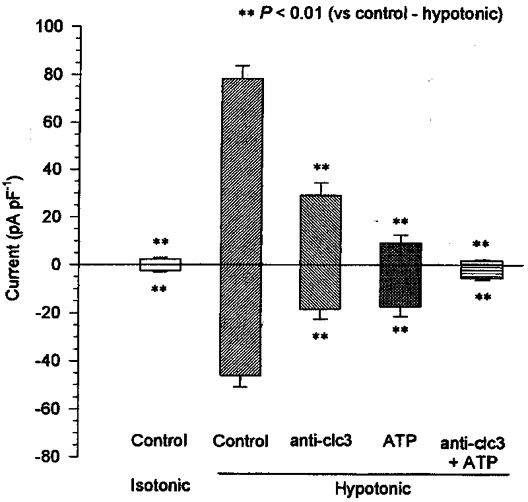
The mean outward currents (positive currents, induced by a +80 mV step) and inward currents (negative currents, induced by a −80 mV step) were measured in isotonic solution or after activation by hypotonic solution in the presence or absence of antisense oligonucleotide/inhibitor. Control, the cells (n = 26) were cultured in control solution (no additives). Anti-ClC-3, 48 h treatment with 200 μg ml−1 ClC-3 antisense oligonucleotide and 20 μg ml−1 lipofectin (n = 17). ATP, cells (n = 7) incubated with 10 mM extracellular ATP; and anti-ClC3 + ATP, cells (n = 7) incubated with 10 mM extracellular ATP after treatment with 200 μg ml−1 antisense oligonucleotide and 20 μg ml−1 lipofectin for 48 h (n = 7). The procedure for adding ATP was similar to that in Fig. 1.
Effects of the transfection agent lipofectin and sense oligonucleotide on the volume-activated chloride current
As demonstrated above, ClC-3 antisense oligonucleotide inhibited the volume-activated chloride current. However, this could be the non-specific effect of the transfection agent lipofectin, which was used to facilitate the uptake of antisense oligonucleotide in the experiments. For this reason the effect of lipofectin on volume-activated chloride current in non-pigmented cells was tested. The cells were incubated in 20 μg ml−1 lipofectin for 48 h, and then the whole-cell currents were recorded under isotonic and hypotonic conditions. The results demonstrated that there was no significant effect of lipofectin (20 μg ml−1) on the volume-activated chloride current. The latency (142.5 ± 27.2 s, n = 13) and the volume-activated chloride current 7 min after activation at the +80 mV step (71.6 ± 6.6 pA pF−1, n = 13) were similar to those of the control cells (136.1 ± 16.9 s and 73.0 ± 5.2 pA pF−1, n = 26, P < 0.05).
Although it was demonstrated that the inhibition of the volume-activated chloride current was not induced by the transfection agent lipofectin there was another possibility: that this inhibition was caused by the non-specific effect of the antisense oligonucleotide. To control for this, a sense oligonucleotide that contained the same GC content as that of the antisense oligonucleotide was synthesized and its effect on the volume-activated chloride current was investigated. Similar to lipofectin alone, the sense oligonucleotide plus lipofectin (20 μg ml−1) had no significant effect either on the latency of activation or on the mean value of the volume-activated chloride current at any of the applied concentrations (100, 200 and 400 μg ml−1) (Fig. 5). The mean values in Fig. 5B were obtained from 26 control cells and 8, 8 or 10 cells treated with 100, 200, or 400 μg ml−1 sense oligonucleotide plus 20 μg ml−1 lipofectin, respectively.
Figure 5. Effect of ClC-3 sense oligonucleotide on the volume-activated chloride current in NPCE cells.
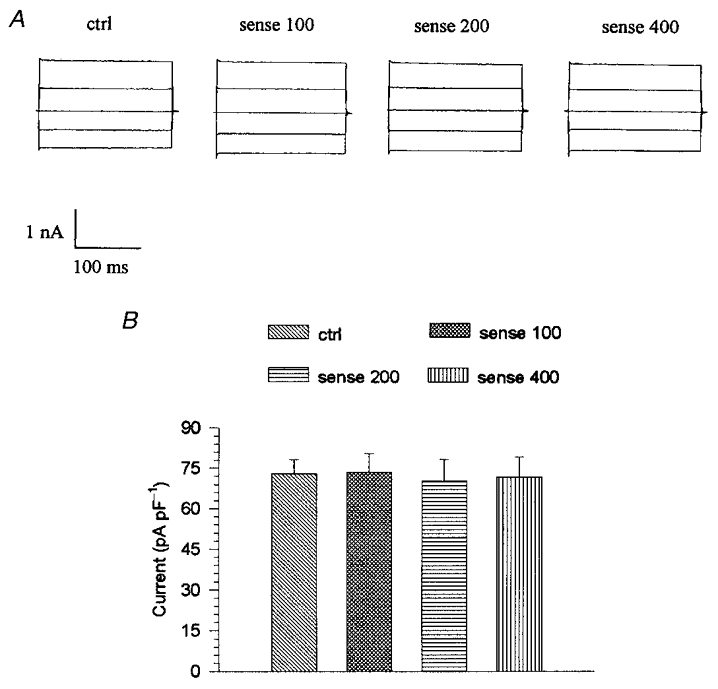
The ciliary epithelial cells were incubated in the culture medium containing 100, 200 or 400 μg ml−1 ClC-3 sense oligonucleotide with 20 μg ml−1 lipofectin for 48 h (termed sense 100, 200 and 400, respectively). There was no significant difference between the volume-activated chloride currents under any of these conditions. A, the whole-cell current traces of the volume-activated currents under different treatments in the NPCE cells cycled through the 200 ms voltage steps (±40, 0, ±80 mV; 4 s interval). B, the mean values of the currents in different groups of cells, measured 10 ms after the start of the +80 mV step.
Comparing the ClC-3 antisense group with the sense groups at the same concentration (200 μg ml−1), the volume-activated chloride current at +80 mV step was inhibited by 62 % and the latency was increased by 108 %.
The uptake of antisense and sense oligonucleotides
To attack their target mRNA, oligonucleotides must pass through the cell membrane and accumulate inside the cells. In our experiments the transfection agent lipofectin was used to facilitate these processes. To demonstrate the uptake of oligonucleotides by the cells the oligonucleotides were labelled with fluorescein. After a 48 h incubation in the presence of the oligonucleotides with lipofectin, the fluorescence in the cells was detected with confocal microscopy. Under control conditions the fluorescence in the cells was negligible, but the fluorescence in cells treated with either antisense or sense oligonucleotides was greatly increased. Figure 6 shows the average fluorescence intensity (grey level of the confocal fluorescence images) in the NPCE cells under different treatments. The data indicated that both the sense (data not shown) and antisense oligonucleotides were taken up by the NPCE cells in a dose-dependent manner.
Figure 6. Dose-dependent uptake of fluorescently labelled oligonucleotides by NPCE cells.
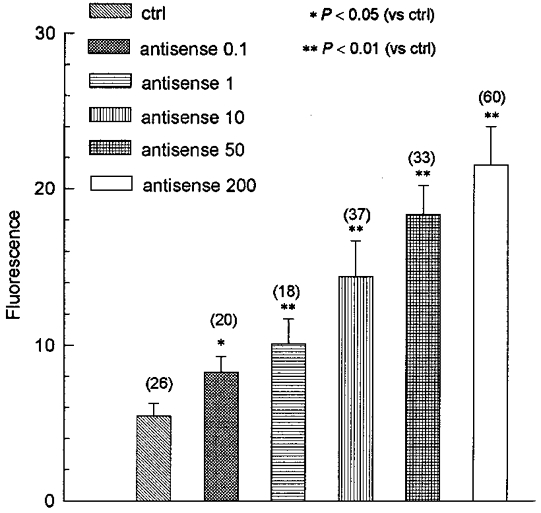
The uptake of the fluorescein-labelled oligonucleotides by the cells is represented as a grey level (8-bit scale; 0 = black, 255 = white) of fluorescence measured by confocal microscopy. There was no significant difference in the fluorescence between control (ctrl, no additives, n = 26) and lipofectin alone (20 μg ml−1, n = 24, data not shown) incubated for 48 h. However, the grey level (fluorescence) in the NPCE cells increased in a dose-dependent manner after treatment with fluorescently labelled ClC-3 antisense oligonucleotide plus 20 μg ml−1 lipofectin for 48 h. The numbers in parentheses represent the number of cells measured. The labels 0.1, 1, 10, 50 and 200 refer to incubation of cells in 20 μg ml−1 lipofectin with 0.1, 1, 10, 50 and 200 μg ml−1 antisense oligonucleotide, respectively.
Expression of ClC-3
To verify that the inhibition of volume-activated chloride current by the antisense oligonucleotide was as a consequence of inhibiting the ClC-3 expression in the cells, the expression levels of the ClC-3 protein in the ciliary epithelial cells were detected by an immunocytochemical technique and confocal microscopy. The freshly prepared ciliary epithelial cells were cultured in medium E199 plus 10 % fetal calf serum overnight and then incubated in serum-free E199 alone (control; no additives), or with sense or antisense oligonucleotides plus lipofectin for 48 h before immunofluorescence measurements.
Figure 7 demonstrates the ClC-3 expression in ciliary epithelial cells and the inhibition of the ClC-3 expression by ClC-3 antisense but not by sense oligonucleotides. The pairs of pictures in Fig. 7A upper and lower rows represent the transmitted light and the laser scanning confocal fluorescence images, respectively, of the same cells incubated for 48 h in control solution (no additives; ctrl 0 and ctrl 1), 200 μg ml−1 sense (sense 200) or antisense (antisense 200) oligonucleotides with 20 μg ml−1 lipofectin. During the immunofluorescence measurements, the cells were treated with the anti-ClC-3 antibody except the cells in the ‘ctrl 0’ group. In the presence of the anti-ClC-3 antibody, ClC-3 protein immunofluorescence was mainly present inside the ciliary epithelial cells (ctrl 1). This suggests that the ClC-3 gene is expressed in the native ciliary epithelial cells and this expression is detectable using immunofluorescence techniques. The non-pigmented cells exhibited a higher level of immunofluorescence than the pigmented cells. This could be because either the pigmented cells contain less ClC-3 protein or their pigment absorbs the fluorescence.
Figure 7. ClC-3 immunofluorescence.
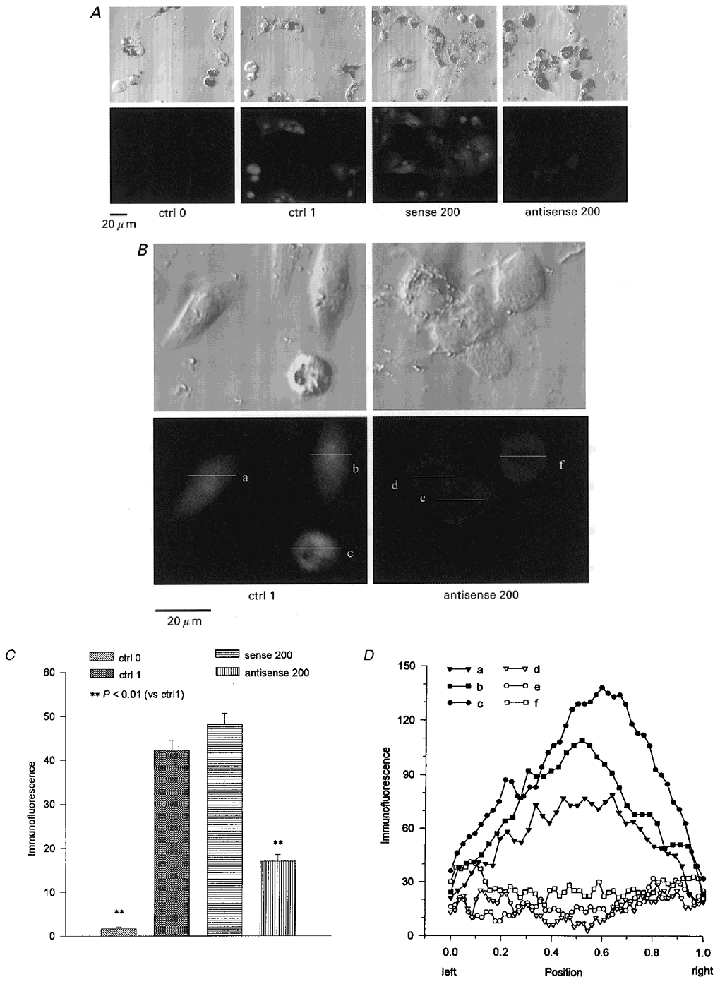
The ciliary epithelial cells were incubated in control solution (ctrl; no additives), 200 μg ml−1 ClC-3 sense (sense 200) or 200 μg ml−1 ClC-3 antisense (antisense 200) oligonucleotides with the transfecting agent lipofectin (20 μg ml−1) for 48 h. The ClC-3 immunofluorescence in the absence (ctrl 0) or presence (ctrl 1, sense 200, antisense 200) of anti-ClC-3 antibody, is represented as a grey level (8-bit scale, 0 = black, 255 = white). The images in the upper row are transmitted light micrographs of the same images as the laser scanning confocal immunofluorescence images in the lower row (in both A and B). The ClC-3 immunofluorescence in the NPCE cells was reduced by the antisense (A, far right; B, right) but not by the sense oligonucleotides. The majority of ClC-3 immunofluorescence was inside the cells (typically in the nuclear area) and it was significantly diminished by the ClC-3 antisense treatments (B). C, the ClC-3 immunofluorescence of NPCE cells under different treatments expressed in units of grey level. D, the immunofluorescence distribution along the lines (a, b, c, d, e, f) indicated in B. The X-axis shows the scanning position of the lines. Position 0 is the left end of the lines and 1 is the right end.
Figure 7A shows that the ClC-3 immunofluorescence in the cells incubated in sense oligonucleotide was similar to that in the control cells (sense 200). However, the level of the ClC-3 immunofluorescence in the cells was decreased greatly by 48 h incubation in 200 μg ml−1 ClC-3 antisense oligonucleotide with 20 μg ml−1 lipofectin (antisense 200). To compare the ClC-3 immunofluorescence level in the NPCE cells under different treatments, the fluorescence intensity was measured and expressed on a grey scale (0 units = black, 255 units = white) (Fig. 7C). The higher the units on this grey scale, the stronger the ClC-3 protein immunofluorescence level. In the cells treated with 200 μg ml−1 sense oligonucleotide the immunofluorescence (48.2 ± 2.5 units, n = 51) was not significantly different from that of the control cells (ctrl 1; 42.4 ± 2.3 units, n = 39), whereas the ClC-3 immunofluorescence in the cells treated with 200 μg ml−1 ClC-3 antisense oligonucleotide was decreased to 17.1 ± 1.5 units (n = 68).
As shown in Fig. 7A the ClC-3 immunofluorescence was mainly located inside the cells. For a better view of the immunofluorescence distribution, some typical cell images were enlarged (Fig. 7B). It seems that the strongest immunofluorescence was present in the region of the nucleus in the control cells (ctrl 1). However, the immunofluorescence, especially that in the central area (which seems to be the region of the nucleus), was reduced in the cells treated with antisense oligonucleotide (antisense 200). The distribution of the immunofluorescence was analysed by scanning the lines shown in Fig. 7B (lines a, b, c, d, e, f) using the confocal microscope. The results are shown in Fig. 7D. The X-axis shows the scanning position of the lines. Position 0 is the left end of the lines and 1 is the right end. The Y-axis is the fluorescence intensity (expressed on a grey scale; 0 units = black, 255 units = white). It is noticeable that the distribution patterns are different between control cells and the cells treated with antisense oligonucleotide. The peak of immunofluorescence in control cells is in the central area (nucleus), but the immunofluorescence in this position is the weakest in the cells treated with antisense oligonucleotide.
The correlation between the ClC-3 immunofluorescence and the volume-activated chloride current
We have demonstrated that the ClC-3 antisense oligonucleotide inhibited both the ClC-3 expression and the volume-activated chloride current as described above. What is the relationship between the ClC-3 expression and the volume-activated chloride current?Figure 8A shows that the ClC-3 expression and the volume-activated chloride current 7 min after activation decreased as the antisense oligonucleotide concentration in the medium increased. The effects of the antisense oligonucleotide on both the ClC-3 expression and the volume-activated chloride current reached a peak when the antisense oligonucleotide concentration was increased to 10 μg ml−1; further increasing the antisense concentration did not further inhibit significantly ClC-3 expression or the current. Comparing the ClC-3 immunofluorescence levels (Fig. 7B) and the currents measured under the same treatments, a positive correlation was obtained. A linear regression fit gave a correlation coefficient of r = 0.96 (P < 0.01).
Figure 8. The correlation between concentration of antisense oligonucleotide in the culture medium, the ClC-3 immunofluorescence and the currents activated by hypotonic solution.
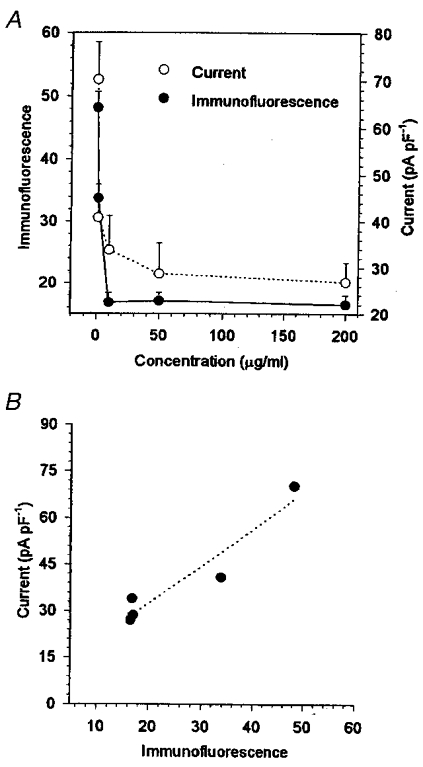
Incubation in 0, 1, 10, 50 and 200 μg ml−1 ClC-3 antisense oligonucleotide and 20 μg ml−1 lipofectin for 48 h caused a dose-dependent reduction of the ClC-3 immunofluorescence and the chloride current activated by the hypotonic solution at the +80 mV step in the NPCE cells (A). Comparing the immunofluorescence levels and the currents measured under the same treatments, a positive correlation between them was obtained (B), with a linear correlation coefficient r = 0.96 (P < 0.01). The dotted line in B represents a linear regression fit to the data.
Inhibition of regulatory volume decrease by ClC-3 antisense
In the control group (Fig. 9A, n = 4) the light intensity detected by a light scattering technique decreased when the cells swelled following exposure to hypotonic solution. The light intensity then returned to the control level although the cells were still bathed in hypotonic solution, reflecting the regulatory volume decrease (RVD) carried out to recover their original size. Treating the cells with 200 μg ml−1 ClC-3 antisense oligonucleotide and 20 μg ml−1 lipofectin for 48 h (Fig. 9B, n = 5) did not significantly change the cell swelling process under the same hypotonic conditions. However, the process of cell volume regulation was significantly inhibited by the antisense oligonucleotide treatment, resulting in a 53 % reduction of RVD, as indicated by the failure of the light signal to return to the control level. This inhibition of RVD by ClC-3 antisense oligonucleotide correlates well with the 61 % inhibition of the peak volume-activated current. There was no effect of ClC-3 sense oligonucleotide on the RVD (data not shown here).
Figure 9. Inhibition of regulatory volume decrease (RVD) by ClC-3 antisense oligonucleotide.
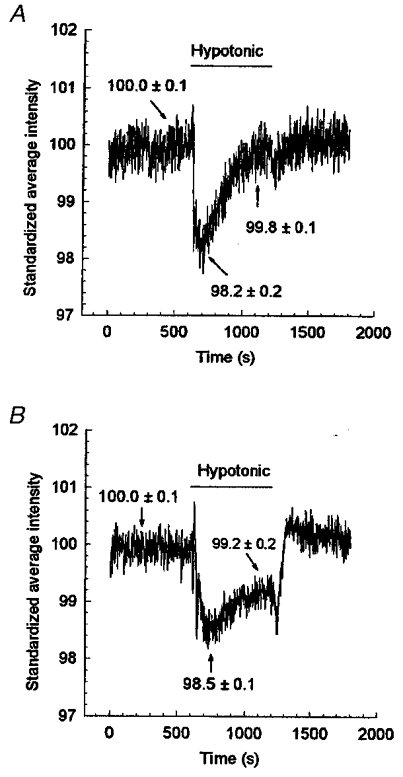
Volume changes of the ciliary epithelial cells were monitored using a light reflection/scattering technique. In the control group (A, no additives), cell swelling caused more scattering and less reflection, and thus the detected light intensity decreased. The light intensity returned to control levels as the cells underwent RVD to regain their normal volume. Incubation of cells in 200 μg ml−1 ClC-3 antisense oligonucleotide with 20 μg ml−1 lipofectin for 48 h prior to testing caused a reduction in the cells' ability to regulate volume, illustrated by the failure of the light intensity to return to control levels during exposure to the hypotonic shock (B). The data are the mean of 4 (in A) and 5 (in B) experiments.
DISCUSSION
Association of volume-activated chloride current with ClC-3
The protein encoded by the gene for ClC-3 has been cloned from rat kidney (Kawasaki et al. 1994), mouse liver and human fetal brain (Borsani et al. 1995), and guinea-pig heart (Duan et al. 1997). It has a similar hydrophobicity profile (12 putative transmembrane-spanning domains) to other ClC family members. Duan et al. (1997) reported that functional expression in NIH/3T3 cells of a cardiac clone of ClC-3 resulted in a large basally active chloride conductance, which was strongly modulated by cell volume. However, a note of caution should be injected at this point. Firstly, there have been difficulties in expressing ClC-3 in several systems and different laboratories (see Jentsch et al. 1999) and further work needs to be done before we accept ClC-3 unreservedly as the volume-activated chloride channel. Secondly, swelling-activated chloride currents are normally inactive until activated by swelling (see review by Okada, 1997). For example, in native epithelial cells (Wu et al. 1996; and present study), fibroblasts (Thoroed et al. 1999), a muscle cell line (Nilius et al. 1996), cultured chick cardiac myocytes (Zhang et al. 1997), human breast cancer cells and HeLa cells (Han et al. 1996), the volume-activated chloride current was not basally active. The ClC-3-related current of Duan et al. (1997) exhibited many properties identical to those of ICl,vol in native cells with respect to outward rectification, inactivation kinetics at positive potentials (but see below), anion selectivity of I− > Cl−, 4,4′-diisothiocyanostilbene-2,2′-disulphonate (DIDS) sensitivity, tamoxifen sensitivity and extracellular ATP sensitivity. These results indicate the possibility that ClC-3 encodes the volume-activated chloride channel. However, to date, there have been no data available for the effect(s) of abolishing endogenous ClC-3 expression. Thus the role of intrinsic ClC-3 in the activation of volume-activated chloride current has remained unclear. In this study, an antisense oligonucleotide complementary to the initiation codon region of ClC-3 mRNA has been used to block the ClC-3 expression. The electrophysiological experiments showed that the activation of volume-activated chloride current was delayed and the current was diminished by the antisense oligonucleotide treatment. Furthermore, the effects of the antisense oligonucleotide on the volume-activated chloride current were dose dependent. These results strongly suggest that ClC-3 is associated with the volume-activated chloride current in a native epithelial cell (NPCE cell). In case the effects were non-specific, a sense oligonucleotide, which had a sequence complementary to that of the antisense oligonucleotide and had hybridization characteristics similar to its antisense counterpart due to the equal content of G-C and A-T bases, was used as a control. The results showed that the sense oligonucleotide did not alter the volume-activated chloride current. This indicates the specificity of the effects of the antisense oligonucleotide.
Our immunofluorescence experiments showed that the ciliary epithelial cells expressed ClC-3 protein. We used a polyclonal antibody raised against residues 592–661 of the C-terminal part of the rat ClC-3 protein. Although there is some homology with ClC-4 and ClC-5 in this region, the antibody reacts in Western blotting with membrane preparations of Xenopus oocytes expressing exogenous ClC-3, but not ClC-4 or ClC-5 (Alomone Laboratories, 1999). ClC-3 protein expression was inhibited by the ClC-3 antisense oligonucleotide but not sense oligonucleotide. The expression level of ClC-3 protein was positively correlated to the volume-activated chloride current. These data strongly support the specificity of the antisense oligonucleotide effects and the association of endogenous ClC-3 with the volume-activated chloride current.
In this study, increasing the concentration of the antisense oligonucleotide in the culture medium resulted in an increasing uptake by the cells, as judged by the increase in fluorescence signal, but inhibition of the ClC-3 protein expression reached a peak at 10 μg ml−1 and was not further inhibited by increasing the antisense concentration, suggesting that all target mRNA was found at this concentration.
The role of ClC-3 in the volume-activated chloride current
ClC-3 cloned from guinea-pig heart induced an outwardly rectifying anion current when it was expressed in NIH/3T3 cells (Duan et al. 1997). We report here that antisense inhibition of endogenous ClC-3 does indeed reduce the volume-activated chloride current. This suggests that the intrinsic ClC-3 protein may work as a chloride channel. However, we cannot exclude the possibility that the endogenous ClC-3 may also work in some way to regulate the activation of volume-activated chloride current because the ClC-3 antisense oligonucleotide delayed the activation of the current (increased the latency) as well as decreasing the size of the current. ClC-3 may therefore act as a channel regulator as well as the volume-activated chloride channel itself, or it may co-operate with other proteins, for example pICln and P-gp, to form a complex that contributes to the modulation of, or constitutes, the volume-activated chloride current. When one of the proteins in the system is inhibited, then it is more difficult to activate the volume-sensitive current.
To function as a channel the ClC-3 protein should be present in the cell membrane. In this study, while ClC-3 protein was present in both the membrane and the intracellular compartment, the predominant localization of the ClC-3 immunofluorescence was in the nucleus. Intracellular distributions have been observed for ClC-6a and ClC-6c, which reside mainly in the endoplasmic reticulum (Buyse et al. 1998) and ClC-5, which, while it may be expressed at the plasma membrane, is predominantly expressed in endocytotic vesicles (Gunther et al. 1998). In both these cases it was suggested that the ClC proteins involved were intracellular chloride channels. If ClC-3 is the volume-activated chloride channel, what is it doing in the nucleus? Can the ClC-3 protein be translocated from the intracellular region into the plasma membrane during cell swelling in a similar fashion to pICln (Krapivinsky et al. 1994; Strange et al. 1996; Laich et al. 1996; Goldstein et al. 1997; Musch et al. 1997) and then exert its function? If true, this could account for the increased latency in the ClC-3 antisense treated cells. However, Emma et al. (1998) were unable to find any translocation of the cytoplasmic pICln signal to the membrane following cell swelling in rat C6 glioma cells. This area and that of the nuclear localization of ClC-3 need further study.
The present study suggests that if ClC-3 is the swelling-activated chloride channel then it is not the only channel contributing to the volume-activated chloride current, since increasing the external concentration of antisense resulted in increased entry into cells but the inhibition of the volume-activated chloride current tended towards an asymptote at about 60 %. The inhibition of volume regulatory capacity for this reduction of volume-activated chloride current was 53 %.
There are three major differences between the volume-activated chloride current in our ciliary epithelial cells and the current associated with ClC-3. Firstly, the characteristics of the volume-activated chloride currents are different; in the NPCE cells the currents showed mild outward rectification and presented no or, occasionally, little inactivation when the cells were deeply depolarized, whereas the outward rectification and the inactivation induced by depolarization in ClC-3-associated current (Duan et al. 1997) were more obvious. Secondly, ClC-3-associated current was inhibited by the activation of PKC (Kawasaki et al. 1994; Duan et al. 1997) while the inhibition of PKC had no effect on ICl,vol in PCE cells (Mitchell et al. 1997). And thirdly, ATP is able to block the volume-activated chloride current to a greater extent than ClC-3 antisense oligonucleotide. Together they virtually abolished all the current (Fig. 4), whereas in the study by Duan et al. (1997) ATP blocked only a proportion of the outward current, having little effect on the inward component of the volume-activated chloride current. This latter finding, the selective block by ATP of the outward component of the volume-activated Cl− current, is in common with studies on rat glioma cells (Jackson & Strange, 1995) and a human intestinal cell line, Intestine 407 (Tsumura et al. 1996). However, as our study shows (see Fig. 1) the ATP block of the inward current is concentration dependent. At low ATP concentrations (1 mM) the inward current is actually enhanced. At 5 mM it blocks outward and not inward current and only at 10 mM does it exhibit both outward and inward current block. Another important consideration is that the study of Duan et al. (1997) was conducted on recombinant ClC-3 overexpressed in NIH/3T3 cells whereas our studies were conducted on endogenous ClC-3 expressed in native cells. Such differences as mentioned above might be due to the expression levels of ClC-3 since overexpression of ClC-3 in heterologous cells may alter the interaction of ClC-3 with other proteins that influence the regulation of ClC-3 Cl− currents.
That ClC-3 cannot account for the volume-activated current in its entirety raises the possibility that there are other genes, as yet unidentified, that code for volume-activated chloride channels or even, heretically, that ClC-3 is yet another in the list of ‘activators’ of the swelling-activated chloride channel(s). The MDR1 (Valverde et al. 1992; Gill et al. 1992; Han et al. 1996; Wu et al. 1996), and pICln (Paulmichl et al. 1992; Krapivinsky et al. 1994; Gschwentner et al. 1995) genes are two of the other candidates. It has been reported that there were at least two separate volume-activated chloride channels in the non-pigmented ciliary epithelial cells (Zhang & Jacob, 1997). The mRNA for pICln and P-gp (the MDR1 gene product) was present in the transformed human non-pigmented ciliary epithelial cell line ODM-2 (Coca-Prados et al. 1995, 1996). Recently, we demonstrated that pICln (Chen et al. 1999), and P-gp (Wang et al. 1998) were present in the bovine ciliary epithelial cells using immunofluorescence techniques and that antisense inhibition of pICln or P-gp expression reduced the volume-activated chloride current. Antisense to MDR1 (200 μg ml−1) caused a 60 % inhibition of the volume-activated chloride current and a 45 % inhibition of volume regulatory capacity (Wang et al. 1998) and antisense to pICln caused a maximal 86 % inhibition of the volume-activated chloride current and an equivalent inhibition of volume regulation to that obtained with MDR1 antisense. None of the antisense oligonucleotides (ClC-3, MDR1, pICln) had a significant effect on the rate of swelling while all of them increased the latency of activation of the swelling-activated current. From these studies it would appear that firstly, the inhibition of ClC-3, MDR1 and pICln would not be additive suggesting that they co-operate forming a volume-responsive system rather than each contributing a separate conductance. And secondly, because the ClC-3 antisense inhibition reached an asymptote and further antisense, although it entered the cell, did not cause further inhibition, ClC-3 cannot account for all the volume-activated chloride current in NPCE cells. There must be an additional current(s).
Putting these data together one could postulate that ClC-3 may work co-operatively with other proteins (e.g. pICln and P-gp) as an activation system; or these proteins may work separately as different chloride channels and contribute to the total volume-activated chloride current.
ClC-3 and regulatory volume decrease
The volume-activated chloride current plays an important role in the cell regulatory volume decrease (RVD) (reviewed by Okada, 1997; Lang et al. 1998). Thus inhibition of the current by the ClC-3 antisense oligonucleotide should cause a reduction of RVD in the cells. This has been demonstrated in this study. Treating the ciliary epithelial cells with the ClC-3 antisense oligonucleotide induced an inhibition of the RVD in the cells in a similar proportion to the inhibition of the volume-activated chloride current. This again indicates that ClC-3 is a gene, but not the only gene, that accounts for the volume-activated chloride current associated with volume regulation.
The story remains incomplete and it is certainly more complex than was first believed. It now appears that there are several different swelling-activated channels (Banderali & Ehrenfeld, 1996; Zhang & Jacob, 1997) and diverse pathways of activation (reviewed in Kawasaki et al. 1994; Jacob et al. 1998). Given that cell volume control is an essential part of cellular homeostasis this is hardly surprising. The pathway and channel(s) activated may depend upon the state of the cell and the type, strength and duration of the stimulus.
Acknowledgments
We would like to thank the MRC for their financial support, the Royal Society for equipment grants and the Royal National Institute for the Blind for a project grant.
References
- Alomone Laboratories. Antibodies to voltage-gated Cl− channels. The Modulator. 1999;(10):7. [Google Scholar]
- Banderali U, Ehrenfeld J. Heterogeneity of volume-sensitive chloride channels in basolateral membranes of A6 epithelial cells in culture. Journal of Membrane Biology. 1996;154:23–33. doi: 10.1007/s002329900129. [DOI] [PubMed] [Google Scholar]
- Borsani G, Rugarli EI, Taglialatela M, Wong C, Ballabio A. Characterization of a human and murine gene (CLCN3) sharing similarities to voltage-gated chloride channels and to a yeast integral membrane protein. Genomics. 1995;27:131–141. doi: 10.1006/geno.1995.1015. [DOI] [PubMed] [Google Scholar]
- Buyse G, Trouet D, Voets T, Missiaen L, Droogmans G, Nilius B, Eggermont J. Evidence for the intracellular location of chloride channel (ClC)-type proteins: co-localization of ClC-6a and ClC6b with the sarco/endoplasmic reticulum Ca2+ pump SERCA2b. Biochemical Journal. 1998;330:1015–1021. doi: 10.1042/bj3301015. [DOI] [PMC free article] [PubMed] [Google Scholar]
- Chen L, Wang L, Jacob TJC. Association of intrinsic pICln with volume-activated Cl− current and volume regulation in a native epithelial cell. American Journal of Physiology. 1999;276:C182–192. doi: 10.1152/ajpcell.1999.276.1.C182. [DOI] [PubMed] [Google Scholar]
- Coca-Prados M, Anguita J, Chalfant ML, Civan MM. PKC-sensitive Cl− channels associated with ciliary epithelial homologue of pICln. American Journal of Physiology. 1995;268:C572–579. doi: 10.1152/ajpcell.1995.268.3.C572. [DOI] [PubMed] [Google Scholar]
- Coca-Prados M, Sánchez-Torres J, Peterson-Yantorno K, Civan MM. Association of ClC-3 channel with Cl− transport by human nonpigmented ciliary epithelial cells. Journal of Membrane Biology. 1996;150:197–208. doi: 10.1007/s002329900044. [DOI] [PubMed] [Google Scholar]
- Duan D, Winter C, Cowley S, Hume JR, Horowitz B. Molecular identification of a volume-regulated chloride channel. Nature. 1997;390:417–421. doi: 10.1038/37151. [DOI] [PubMed] [Google Scholar]
- Emma F, Breton S, Morrison R, Wright S, Strange K. Effect of cell swelling on membrane and cytoplasmic distribution of pICln. American Journal of Physiology. 1998;274:C1545–1551. doi: 10.1152/ajpcell.1998.274.6.C1545. [DOI] [PubMed] [Google Scholar]
- Gill DR, Hyde SC, Higgins CF, Valverde MA, Mintenig GM, Sepulveda FV. Separation of drug transport and chloride channel functions of the human multidrug resistance P-glycoprotein. Cell. 1992;71:23–32. doi: 10.1016/0092-8674(92)90263-c. [DOI] [PubMed] [Google Scholar]
- Goldstein L, Davis-Amaral EM, Vandenburgh HH, Musch MW. Hypotonic exposure stimulates translocation of the swelling-activated channel protein pICln neonatal rat myocytes. Journal of General Physiology. 1997;110:36. a abstract. [Google Scholar]
- Gründer S, Thiemann A, Pusch M, Jentsch TJ. Regions involved in the opening of ClC-2 chloride channel by voltage and cell volume. Nature. 1992;360:759–762. doi: 10.1038/360759a0. [DOI] [PubMed] [Google Scholar]
- Gschwentner M, Nagl UO, Wöll E, Schmarda A, Ritter M, Paulmichl M. Antisense oligonucleotides suppress cell-volume-induced activation of chloride channels. Pflügers Archiv. 1995;430:464–470. doi: 10.1007/BF00373882. [DOI] [PubMed] [Google Scholar]
- Gunther W, Luchow A, Cluzeaud F, Wnadewalle A, Jentsch TJ. ClC-5, the chloride channel mutated in Dent's disease, colocalises with the proton pump in endocytotically active kidney cells. Proceedings of the National Academy of Sciences of the USA. 1998;95:8075–8080. doi: 10.1073/pnas.95.14.8075. [DOI] [PMC free article] [PubMed] [Google Scholar]
- Han EH, Vanoye CG, Altenberg GA, Ruess L. P-glycoprotein-associated chloride currents revealed by specific block by an anti-P-glycoprotein antibody. American Journal of Physiology. 1996;270:C1370–1378. doi: 10.1152/ajpcell.1996.270.5.C1370. [DOI] [PubMed] [Google Scholar]
- Jackson PS, Strange K. Characterization of the voltage-dependent properties of a volume-sensitive anion conductance. Journal of General Physiology. 1995;105:661–677. doi: 10.1085/jgp.105.5.661. [DOI] [PMC free article] [PubMed] [Google Scholar]
- Jacob TJC. Identification of a low-threshold T-type calcium channel in bovine ciliary epithelial cells. American Journal of Physiology. 1991;261:C808–813. doi: 10.1152/ajpcell.1991.261.5.C808. [DOI] [PubMed] [Google Scholar]
- Jacob TJC, Stelling JW, Gooch AJ, Zhang JJ. Transport mechanisms in ocular epithelia. In: Wallis DI, editor. Electrophysiology: A Practical Approach. Oxford: Oxford University Press; 1993. pp. 29–48. [Google Scholar]
- Jacob TJC, Wang L, Chen L. Cell volume regulation: the role of chloride channels. In: Okada Y, editor. Cell Volume Regulation: The Molecular Mechanism and Volume Sensing Machinery. The Netherlands: Elsevier Science B. V.; 1998. pp. 109–124. [Google Scholar]
- Jentsch TJ, Friedrich T, Schriver A, Yamada H. The ClC chloride channel family. Pflügers Archiv. 1999;437:783–795. doi: 10.1007/s004240050847. [DOI] [PubMed] [Google Scholar]
- Kawasaki M, Uchida S, Monkawa T, Miyawaki A, Mikoshiba K, Marumo F, Sasaki S. Cloning and expression of a protein kinase C-regulated chloride channel abundantly expressed in rat brain neuronal cells. Neuron. 1994;12:597–604. doi: 10.1016/0896-6273(94)90215-1. [DOI] [PubMed] [Google Scholar]
- Kowdley GC, Ackerman SJ, Chen Z, Szabo G, Jones LR, Moorman JR. Anion, cation, and zwitterion selectivity of phospholemman channel molecules. Biophysical Journal. 1997;72:141–145. doi: 10.1016/S0006-3495(97)78653-3. [DOI] [PMC free article] [PubMed] [Google Scholar]
- Krapivinsky GB, Ackerman MJ, Gordon EA, Krapivinsky LD, Clapham DE. Molecular characterization of a swelling-induced chloride conductance regulatory protein, pICln. Cell. 1994;76:439–448. doi: 10.1016/0092-8674(94)90109-0. [DOI] [PubMed] [Google Scholar]
- Laich A, Furst UO, Nagl M, Gschwentner M, Paulmichl M. The transposition of the swelling-dependent chloride channel ICln from the cytosol to the membrane is regulated by cell volume. Journal of General Physiology. 1996;108:24. a abstract. [Google Scholar]
- Lang F, Busch GL, Ritter M, Völkl H, Waldegger S, Gulbins E, Häussinger D. Functional significance of cell regulatory mechanisms. Physiological Reviews. 1998;8:1–45. doi: 10.1152/physrev.1998.78.1.247. [DOI] [PubMed] [Google Scholar]
- Mitchell CH, Zhang JJ, Wang L, Jacob TJC. Volume-sensitive chloride current in pigmented ciliary epithelial cells: role of phospholipases. American Journal of Physiology. 1997;272:C212–222. doi: 10.1152/ajpcell.1997.272.1.C212. [DOI] [PubMed] [Google Scholar]
- Moorman JR, Ackerman SJ, Kowdley GC, Griffin MP, Mounsey JP, Chen Z, Cala SE, O'Brian JJ, Szabo G, Jones LR. Unitary anion currents through phospholemman channel molecules. Nature. 1995;377:737–740. doi: 10.1038/377737a0. [DOI] [PubMed] [Google Scholar]
- Morrison BW, Moorman JR, Kowdley GC, Kobayashi YM, Jones LR, Leder P. Mat-8, a novel phospholemman-like protein expressed in human breast tumours, induces a chloride conductance in Xenopus oocytes. Journal of Biological Chemistry. 1995;270:2176–2182. doi: 10.1074/jbc.270.5.2176. [DOI] [PubMed] [Google Scholar]
- Musch MW, Luer CA, Davis-Amaral EM, Goldstein L. Hypotonic stress induces translocation of the osmolyte channel protein pICln in embryonic skate (Raja eglanteria) heart. Journal of Experimental Zoology. 1997;277:460–463. doi: 10.1002/(sici)1097-010x(19970415)277:6<460::aid-jez6>3.0.co;2-m. [DOI] [PubMed] [Google Scholar]
- Nilius B, Eggermont J, Voets T, Droogmans G. Volume-activated Cl− channels. General Pharmacology. 1996;27:1131–1140. doi: 10.1016/s0306-3623(96)00061-4. [DOI] [PubMed] [Google Scholar]
- Okada Y. Volume expansion-sensing outwardly rectifying Cl− channel: fresh start to the molecular identity and volume sensor. American Journal of Physiology. 1997;237:C755–789. doi: 10.1152/ajpcell.1997.273.3.C755. [DOI] [PubMed] [Google Scholar]
- Paulmichl M, Li Y, Wickman K, Ackerman M, Peralta E, Clapham D. New mammalian chloride channel identified by expression cloning. Nature. 1992;356:238–241. doi: 10.1038/356238a0. [DOI] [PubMed] [Google Scholar]
- Strange K. Cellular and Molecular Physiology of Cell Volume Regulation. Boca Raton, FL, USA: CRC Press; 1994. [Google Scholar]
- Strange K, Emma F, Jackson PS. Cellular and molecular physiology of volume-sensitive anion channels. American Journal of Physiology. 1996;270:C711–730. doi: 10.1152/ajpcell.1996.270.3.C711. [DOI] [PubMed] [Google Scholar]
- Thoroed SM, Bryan-Sisneros A, Doroshenko P. Protein phosphotyrosine phosphatase inhibitors suppress regulatory volume decrease and the volume-sensitive Cl− conductance in mouse fibroblasts. Pflügers Archiv. 1999;438:133–140. doi: 10.1007/s004240050890. [DOI] [PubMed] [Google Scholar]
- Tsumura T, Oiki T, Ueda S, Okuma M, Okada Y. Sensitivity of volume-sensitive Cl− conductance in human epithelial cells to extracellular nucleotides. American Journal of Physiology. 1996;271:C1872–1878. doi: 10.1152/ajpcell.1996.271.6.C1872. [DOI] [PubMed] [Google Scholar]
- Valverde MA, Diaz M, Sepulveda M, Gill DG, Hyde SC, Higgins CF. Volume regulated chloride channels are associated with the human multidrug-resistance P-glycoprotein. Nature. 1992;355:830–833. doi: 10.1038/355830a0. [DOI] [PubMed] [Google Scholar]
- Wang L, Chen L, Walker V, Jacob TJC. Antisense to MDR1 mRNA reduces P-glycoprotein expression, swelling-activated Cl− current and volume regulation in bovine ciliary epithelial cells. The Journal of Physiology. 1998;511:33–44. doi: 10.1111/j.1469-7793.1998.033bi.x. [DOI] [PMC free article] [PubMed] [Google Scholar]
- Wu J, Zhang JJ, Koppel H, Jacob TJC. P-glycoprotein regulates a volume-activated chloride current in bovine non-pigmented ciliary epithelial cells. The Journal of Physiology. 1996;491:743–755. doi: 10.1113/jphysiol.1996.sp021254. [DOI] [PMC free article] [PubMed] [Google Scholar]
- Zhang JJ, Jacob TJC. Three different Cl− channels in the bovine ciliary epithelium activated by hypotonic stress. The Journal of Physiology. 1997;499:379–389. doi: 10.1113/jphysiol.1997.sp021935. [DOI] [PMC free article] [PubMed] [Google Scholar]
- Zhang J, Larsen TH, Lieberman M. F-actin modulates swelling-activated chloride current in cultured chick cardiac myocytes. American The Journal of Physiology. 1997;273:C1215–1224. doi: 10.1152/ajpcell.1997.273.4.C1215. [DOI] [PubMed] [Google Scholar]


