

Abstract
The relationship between single-channel conductance and ion binding affinity in Ca2+ channels was investigated by measuring differences in the apparent binding affinity (K′D) for Ca2+ among naturally occurring conductance states of an L-type (α1C) Ca2+ channel heterologously expressed in Xenopus oocytes. Using cell-attached patch recordings, three or more conductance levels were observed when Ca2+, Ba2+ or Li+ was used as the permeating ion.
With Li+ as the charge carrier, low concentrations of Ca2+ (0.1–3.0 μM) produced discrete blocking events in all conductance states. Measurements of open and blocked times as a function of Ca2+ concentration were used to calculate rates of block and unblock.
K′D was calculated for three of the conductance levels. Binding affinity for Ca2+ increased as conductance decreased (K′D: large = 7.5 μM, medium = 4.0 μM, small = 2.7 μM). The lower K′D values of the smaller conductance states arose from a combination of larger on-rates and smaller off-rates.
These results imply that permeant ions such as Ca2+ have both easier access to, and longer dwell time in, the Ca2+ binding locus in the pore when the channel opens to a subconductance level as compared to the fully open level.
The difference in K'D between the large and small conductance levels corresponds to a small difference in the free energy of binding, ΔΔG≈ 1kBT, where kB is Boltzmann's constant and T is absolute temperature (kelvin). Nonetheless, an Eyring model of Ca2+ channel permeation incorporating the state-specific on- and off-rate constants for Ca2+ was able to reproduce the large difference in channel conductance, indicating that small differences in binding energy may be able to account for large differences in amplitude between conductance states.
Most kinds of ion channels are able to open to more than one conducting level. Once considered a minor nuisance, this behaviour has recently received increased scrutiny, with considerable interest focused upon connections between subconductance levels and intermediate channel conformations that occur during normal activation (Ferguson et al. 1993; Chapman et al. 1997; Zheng & Sigworth, 1997; Ruiz & Karpen, 1997; Rosenmund et al. 1998). Interest has also been focused upon connections between the binding or permeability of ions and channel conductance level.
Generally, the relationship between single-channel conductance and permeability for a given ion species is complex. For example, diverse types of K+ channels exhibit similar high ion selectivity, yet their single-channel conductance values range over two orders of magnitude, from amongst the lowest to near the highest values for all ion channels (Hille, 1992). The differences in K+ channel structure that allow such a wide range of conductances while preserving high ion selectivity have yet to be discovered. As another example, mutagenesis work on Ca2+ channels has revealed that pore region mutations which reduce permeant ion binding affinity (Ellinor et al. 1995) in some instances increase, but in other instances decrease, single-channel conductance (Parent & Gopalakrishnan, 1995; authors' unpublished observations). For ion channels that possess multiple conductance states, it might be expected that ion selectivity would differ among states. Yet for many kinds of channels studied, the selectivity of subconductance states has been found to be similar to that of the main conductance state (Hamill et al. 1981; Auerbach & Sachs, 1984; Fox, 1985; Bormann et al. 1987; Schreibmayer et al. 1989; Liu et al. 1989; Bosma & Moody, 1990). In a few cases, however, differences in the ion selectivity of conductance states have been identified, either from dissimilarity of reversal potentials (Hanke & Boheim, 1980; Zheng & Sigworth, 1997; Schneggenburger & Ascher, 1997) or of ion binding affinity in the pore (Premkumar & Auerbach, 1996).
Particularly useful channels for examining how natural differences in the binding of permeant ions affect channel conductance are the dihydropyridine-sensitive, L-type Ca2+ channels because these channels have several conductance states (Chen & Hess, 1987; Talvenheimo et al. 1987; Ma & Coronado, 1988; Kunze & Ritchie, 1990; Church & Stanley, 1996; Gondo et al. 1998) and because a great deal is already known about the role of ion binding in specifying the selectivity properties of these channels. In the absence of Ca2+, L-type Ca2+channels conduct monovalent cations very well; millimolar amounts of Ca2+ reduce monovalent flux to virtually zero, with Ca2+ carrying essentially all of the current through the channel. In between these two extremes, that is with micromolar concentrations of Ca2+ present in the monovalent cation solution, single-channel recording reveals discrete block and unblock events as Ca2+ transiently binds in the pore and obstructs the flow of monovalent ions. Extensive study of these kinetic events, together with other properties of ion selectivity, has led to the development of detailed models of ion permeation in Ca2+ channels (Almers & McCleskey, 1984; Hess & Tsien, 1984; Lansman et al. 1986; Hess et al. 1986; Kuo & Hess, 1993a,b; Dang & McCleskey, 1998).
The selective permeability properties of L-type Ca2+ channels from brain, heart and skeletal muscle have been investigated in previous work, and subsequently cDNAs encoding the α1 subunits of four L-channel isoforms have been identified: α1C (heart, smooth muscle, brain), α1D (brain, neuroendocrine), α1S (skeletal muscle) (Hofmann et al. 1999) and α1F (retina). Investigations into the structural basis of selective permeation in Ca2+ channels have employed primarily the α1C isoform. These studies have identified a quartet of glutamate residues (EEEE locus) as the dominant structural element supporting pore binding of Ca2+ (Yang et al. 1993; Kim et al. 1993; Tang et al. 1993; Ellinor et al. 1995). Each of four homologous domains of the α1 subunit contributes one glutamate to the EEEE locus, but the glutamates are non-equivalent in their interactions with permeating ions (Yang et al. 1993; Mikala et al. 1993; Ellinor et al. 1995).
We have investigated the relationship between single-channel conductance and permeant ion binding affinity in α1C channels heterologously expressed in Xenopus oocytes by comparing binding and unbinding rates for Ca2+ among naturally occurring conductance states of this channel. We found that, compared to the case for the full open state, entry of Ca2+ was faster and exit slower in the subconductance states. The corresponding Ca2+ binding affinities are related to conductance level in a simple way, so that as ion binding affinity increases, conductance decreases. Based on a standard Eyring reaction rate description of selective permeation in Ca2+ channels, the conductance state-dependent differences in ion binding affinity can plausibly account for the differences in unitary current amplitude between the conductance states.
METHODS
Expression of α1C Ca2+ channels in Xenopus oocytes
Ca2+ channels (α1C) were heterologously expressed in Xenopus laevis oocytes, with a subunit composition of α1Cβ2bα2/δ, as previously described (Ellinor et al. 1995). Briefly, Ca2+ channel cRNAs were synthesized by in vitro transcription using the recombinant plasmids pCARDHE (α1C; constructed by subcloning the rabbit α1C insert from pCARD3 into a modified version of the pGEM-3Z vector bearing the 5′ and 3′ untranslated regions of the Xenopusβ globin gene (Liman et al. 1992)), pBH17 (β2b), and pCA1S (α2/δ; derived from pSPCA1, 3′ truncated, and subcloned into pCDNA3) (Mikami et al. 1989; Hullin et al. 1992). Oocytes (stage V and VI) were injected with ∼50 nl cRNA mixture containing α1C (0.3 μg ml−1), β2b (1.0 μg ml−1), and α2/δ (0.8 μg ml−1). To obtain oocytes, female Xenopus laevis were anaesthetized by ∼30 min immersion in a 0.2 % tricaine methanesulfonate solution, ovarian tissue was removed via an abdominal incision, and the incision was then sutured. Animals were allowed to recover for 24 h before being returned to the animal care facility. Individual oocytes were dissociated from ovarian tissue by agitation for 90 min in Ca2+-free OR-2 solution (mM: 82.5 NaCl, 2 KCl, 1 MgCl2, 5 Hepes, pH 7.5 with NaOH) containing 2 mg ml−1 collagenase B (Boehringer-Mannheim). The oocytes were rinsed in fresh OR-2 solution and stage V and VI oocytes were selected by hand. Injected oocytes were maintained in an incubator at 18°C in ND-96 solution containing (mM): 96 NaCl, 2 KCl, 1.8 CaCl2, 1 MgCl2, 5 Hepes, pH 7.6, supplemented with 2.5 mM sodium pyruvate, penicillin (100 u ml−1; Sigma) and streptomycin (0.1 mg ml−1; Sigma). Oocytes were incubated for 4–12 days prior to electrophysiological recording. All experiments were conducted according to the guidelines established by the University of Colorado Health Sciences Center Animal Care and Use Committee.
Single-channel recording
The vitelline membrane was manually removed from oocytes expressing α1C Ca2+ channels immediately before patch-clamp experiments. For recording, oocytes were bathed in a high K+ solution in order to fix the membrane potential at ∼0 mV. The solution contained (mM): 100 KCl, 10 EGTA, 10 Hepes, pH 7.4 with KOH. Cell-attached patch recordings (Hamill et al. 1981) were made using borosilicate glass containing either a divalent solution (mM: 110 BaCl2 or 110 CaCl2, 10 Hepes, pH 7.4 with tetraethylammonium (TEA)-OH) or a monovalent solution (mM: 100 LiCl, 10 Hepes, 10 N-(2-hydroxyethyl) ethylenediamine-N,N′,N′-triacetic acid (HEDTA), 14 TEA-Cl, pH 7.4 with TEA-OH). For Ca2+ block of Li+ experiments, Ca2+ was included in the pipette solution and buffered to the appropriate concentrations with HEDTA. Single-channel currents were recorded with an Axopatch 200B amplifier (Axon Instruments). Records were filtered at 2 kHz with an 8-pole Bessel filter (Frequency Devices, Haverhill, MA, USA) and acquired at 100 μs intervals using Pulse software (HEKA, distributed by Instrutech Corp., Great Neck, NY, USA). To promote long-lasting channel openings, the majority of experiments were carried out with 2 μM of the benzoylpyrrole FPL 64176 in the bath solution (RBI). All membrane potentials are expressed as conventional transmembrane potentials, which corresponds to the negative of the potential imposed on the recording pipette. Membrane potentials are reported without correction for liquid junction potentials.
Data analysis
Single-channel current records were initially examined for the presence of subconductance states using all-points histograms. Amplitude histograms were fitted by a sum of Gaussian distributions, yielding an estimate of the number of conductance states and their mean amplitudes. Most patches exhibited three to four conductance levels. The largest three were used for kinetic analysis and are identified in the text as large, medium and small.
Analysis of channel gating and of Ca2+ block kinetics was performed with TAC software (Bruxton Corp., Seattle, WA, USA), using a 50 % threshold criterion. Records were analysed separately for the large, medium and small conductance levels using a threshold appropriate to the substate amplitude. Openings that reached the 50 % threshold for a given conductance state and that were also smaller than the next largest state were included. For analysis of gating or block kinetics, bursts that contained openings to multiple conductance levels were not analysed. In examining the kinetics of conductance-state gating, all open-close transitions for a given conductance state were accepted into the analysis. In analysing block data, we selected events that appeared to be single long openings interrupted by Ca2+ block events; the number of block events varied with [Ca2+]. These apparent ‘bursts’ to a given conductance level were selected in order to reduce the proportion of open-close transitions relative to block-unblock transitions. The selected bursts were bordered by closures ≈≥ 20 ms in duration, and in general encompassed several transitions between open and shut levels. Single, brief (≈≤ 2 ms) open events bordered by closures ≈≥ 20 ms were not included in the analysis of block. This empiric definition of bursts was useful in reducing the proportion of gating events accepted into the analysis of Ca2+ block, but was not intended to exclude all gating events from the analysis of block; the time constants for gating and block did not differ by large enough factors to allow application of more rigorous criteria for burst definition (Colquhoun & Sigworth, 1995). The degree of bias potentially introduced into the analysis of channel block kinetics by relying on the empirical definition of bursts was estimated using simulations of gating and block kinetics (SIMU, QuB software suite, SUNY Buffalo, 1998; the program and documentation are available at http://www.qub.buffalo.edu). Lifetime histograms of blocked and unblocked states were constructed from idealized records, binned logarithmically (20 bins decade−1), and plotted against a square root transformation of the ordinate (number of events per bin). With this representation, peaks in the function fitted to a histogram correspond to the time constants of the underlying exponential functions (Sigworth & Sine, 1987).
The rise time of our recording system (0.166 ms) limited resolution of kinetic events to those lasting ≥0.2 ms; shorter duration events were excluded from the analysis. Artifactual lengthening of the observed open time as a result of missed brief closures was corrected for according to the following equation (Colquhoun & Hawkes, 1995):
where τO is the corrected open-state lifetime, τO,obs is the open-state lifetime obtained from histogram fitting, Td is the system dead time (0.090 ms), and τC is the lifetime of the shortest fitted component in the closed-state histogram. The complimentary problem of missed brief openings artificially lengthening the measured shut lifetime was minimized by the use of FPL 64176, which prolongs channel open time from ∼1 ms to ∼10–50 ms. Omitting the correction does not affect our major conclusion that the rate constants for association and dissociation of a pore blocking ion are different between Ca2+ channel conductance levels.
Block rates for the large and small conductance levels were evaluated and compared using a linear models method (Snedecor & Cochran, 1989). The block rate data at each conductance level were fitted with linear regressions, and the slopes derived from the regressions were compared using an F test. SAS PROC GLM was used for the analysis (SAS/STAT, Cary, NC, USA).
Open channel noise was determined as the standard deviation of Gaussian fits to all-points histograms of individual openings (open level only). Numerical values are reported as the mean ± standard error of the mean, unless stated otherwise, with the number of measurements (n) indicated in parentheses.
Permeation model
Simplified pore energy profiles were calculated from the kinetics of Ca2+ block and unblock. The Ca2+ on-rate (kon) was used to calculate the entry barrier height as a Gibbs free energy relative to bulk fluid: ΔGbarrier = −kBTln(kon/vM), where kB and T are Boltzmann's constant and absolute temperature (Kelvin), v is the fastest possible reaction rate and taken as the atomic vibration frequency (5.8 × 10¹² s−1), and M represents the standard condition of a 1 M concentration for the blocking ion. The free energy of Ca2+ bound in the pore is given by: ΔGwell = −kBTln(K′D/M), where K′D is the apparent binding affinity for Ca2+ and is equal to koff/kon. The computer program used to calculate unitary current versus voltage relationships, based on the calculated barrier and well energies, has been described (Almers & McCleskey, 1984). Our measurements of Ca2+ block kinetics were obtained at −60 mV, and because koff (but not kon) depends on membrane potential, koff values were adjusted by a factor of e-fold/25 mV for use in the Eyring model (Kuo & Hess, 1993a).
RESULTS
Oocytes expressing α1C Ca2+ channels show multiple conductance levels
Like many other kinds of channels, α1C Ca2+ channels expressed in Xenopus oocytes show multiple subconductance levels in addition to the largest and main open state of the channel. Examples of these substates are illustrated in Fig. 1A, obtained using 110 mM Ca2+ as the permeant ion. Clear openings to three distinct conductance levels were observed at −20 mV. Using 110 mM Ba2+ as the charge carrier, we found that the subconductance levels were also prominent. In the patch illustrated in Fig. 1B, four conductance levels were resolved at 0 mV. On average, the largest amplitude was the predominant open state, comprising 49 ± 2 % of the openings (n = 3), with openings to the smaller substates occurring 26 ± 14 % (medium, n = 3), 16 ± 12 % (small, n = 3) and 9 % (tiny, n = 2) of the time.
Figure 1. Subconductance levels of α1C Ca2+ channels.

A, left hand panel shows Ca2+ channel openings evoked by voltage jumps to −20 mV and using 110 mM Ca2+ as the charge carrier. The dashed lines indicate closed, substate and fully open levels. Right hand panel shows the amplitude histogram of openings to level -1 (one channel open) from the same patch. The histogram was fitted by the sum of 3 Gaussian distributions (thick line). Individual Gaussians are indicated by the thin lines and had mean amplitudes of 0.59 pA (63 %), 0.35 pA (29 %) and 0.24 pA (8 %). B, records and amplitude histogram from a patch using 110 mM Ba2+ as the charge carrier and voltage jumps to 0 mV. The histogram was fitted by the sum of 4 Gaussians with mean amplitudes of 1.4 pA (55 %), 0.94 pA (14 %), 0.58 pA (19 %) and 0.34 pA (12 %). C, records and amplitude histogram from a patch using 100 mM Li+ as the charge carrier and voltage jumps to −60 mV. The fourth record is reproduced on an expanded scale to illustrate the smallest conductance level. The histogram was fitted by the sum of 4 Gaussian distributions with mean amplitudes of 1.7 pA (17 %), 0.91 pA (38 %), 0.61 pA (35 %) and 0.3 pA (9 %). The arrows mark apparent direct transitions between substates. Holding potentials were −60 mV for Ca2+ and Ba2+, and −100 mV for Li+.
In the absence of divalent ions, Ca2+ channels conduct monovalent ions very well. Using 100 mM Li+ as the permeant ion, substates were very prominent (Fig. 1C). Amplitude histograms for the open channel were best fitted by the sum of four Gaussian distributions. At −60 mV, the channel opened most frequently to the second largest amplitude. In most patches, only the three larger conductance levels were observed, with the proportion of openings to the different levels, from largest to smallest, being 22 ± 5, 58 ± 4 and 20 ± 9 % (n = 4 patches). These proportions were preserved between −70 and −50 mV (n = 3) with no discernible correlation between the proportions and membrane potential. For 13 patches, the average amplitudes of unitary Li+ currents (−60 mV) carried by the medium and small conductance states were 56 ± 1 and 44 ± 2 % of the size of the largest conductance state (P < 0.001).
Figure 2 illustrates unitary current-voltage (i–V) relationships for the α1C substates. In many patches, only three conductance levels were observed. However, as the driving force was increased by membrane hyperpolarization, a fourth and smaller conductance level was clearly detectable in a few patches when using either Ba2+ or Li+ solutions (Fig. 2B and D). In 110 mM Ba2+, the single-channel slope conductances measured between −60 and +10 mV were 27, 21, 10 and 9 pS for the four conductance states. We did not attempt to estimate reversal potentials of single-channel Ba2+ currents from extrapolations of the linear fits to our data because of the well-established rectification of the i–V relationship near reversal when the ions on either side of the membrane (Ba2+versus K+) differ greatly in binding affinity. In 100 mM Li+, the slope conductances measured between −100 and −40 mV were 28, 19, 10 and 7 pS. In this case (Li+versus K+), the permeant ions on either side of the membrane do not differ greatly in pore binding affinity, allowing linear extrapolations of the four Li+ conductance levels to reversal, that is zero current. This yielded reversal potentials near 0 mV, as expected for Ca2+ channel currents carried by monovalent cations. In 110 mM Ca2+, the predominant open level had a conductance of 10 pS between −50 and 0 mV.
Figure 2. Single channel current-voltage (i–V) relationships for different conductance levels of α1C channels.

A, i–V plot for channels with 110 mM Ba2+ as the charge carrier. The conductance levels obtained from the linear regression fit to the data (continuous lines) were 27, 21, 10 and 9 pS. Each data point represents 3–5 patches. B, representative openings at two voltages for each conductance state, with Ba2+ as the charge carrier. C, i-V plot using 100 mM Li+ as the charge carrier. Conductance levels were 28, 19, 10 and 7 pS. D, representative openings at two voltages of each conductance state, with Li+ was the charge carrier. Holding potential was −60 mV for Ba2+ and −100 mV for Li+. Conductance levels: ▴, tiny; □, small; ▾, medium; ○, large.
Multiple conductance levels arise from the α1C channel
The conductance states described above apparently all arise from expressed α1C Ca2+ channels and not from endogenous oocyte channel types, based on the following observations. First, oocytes lack endogenous L-type Ca2+ channels, yet all substates were sensitive to selective L-type Ca2+ channel drugs. The dihydropyridine nimodipine (3 μM), a selective antagonist of L-type channels, reduced the open probability (Po) of all substates regardless of the ion species used as the charge carrier (Fig. 3A and B). Also, substates were sensitive to the L-type channel agonist FPL 64176. Figure 3C shows records of Ca2+ channel openings in the absence of FPL 64176 and using Li+ as the charge carrier. Although these openings were very brief, there were well-resolved openings to each of the different conductance levels. Thus, like the main conductance state, the substates were sensitive to FPL 64176 but were not induced by the binding of FPL 64176 to the channel. Second, in recordings from oocytes injected solely with cRNA encoding the α1C subunit (neither β2b nor α2/δ injected), all four conductance levels were observed (Fig. 3D). Using 100 mM Li+ as the permeant ion, the amplitudes of the openings at −60 mV were 1.74 ± 0.02, 1.01 ± 0.03, 0.67 ± 0.04, and 0.39 ± 0.01 pA (n = 4). In two patches, 1 μM Ca2+ was included in the patch pipette and produced flicker block characteristic of α1C coexpressed with both β2b and α2/δ subunits (see below). Third, no channels with the conductance or gating properties characteristic of α1C Ca2+ channels were observed in uninjected oocytes. Fourth and finally, apparent direct transitions between all open levels were observed (arrows in Fig. 1B and C; Table 1), although so infrequently that whether these are truly direct transitions is unproven.
Figure 3. The conductance levels all arise from α1C channels.

A, consecutive records from a patch under control conditions and 5 min after addition of 3 μM nimodipine to the bath. The charge carrier was 110 mM Ba2+ and Vm = −10 mV. Note that both conductance levels seen in the control records are inhibited by nimodipine. B, group data from 6 cells showing inhibition of Ca2+ channel activity following application of 3 μM nimodipine. Data pooled from patches recorded in Li+, Ba2+ or Ca2+ solutions (n = 2 for each ion). C, example records from a patch in which FPL 64176 was not included in the bathing solution. Li+ (100 mM) was used as the charge carrier and Vm = −70 mV. The dashed lines indicate conductance levels. D, example openings to each of the conductance levels when α1C was expressed in the absence of auxiliary subunits. Li+ was used as the charge carrier and Vm = −60 mV. Holding potential was −60 mV for Ca2+ and Ba2+, and −100 mV for Li+.
Table 1.
Mean transition rates between conductance levels
| Transition | Rate (s−1) | s.d. |
|---|---|---|
| L → S | 0.5 | 0.5 |
| S → L | 1.4 | 1.3 |
| L → M | 0.8 | 0.4 |
| M → L | 1.6 | 2.0 |
| M → S | 1.7 | 2.0 |
| S → M | 1.4 | 1.3 |
| L → C | 61 | 31 |
| M → C | 344 | 274 |
| S → C | 465 | 85 |
State definitions: L, large; M, medium; S, small; C, closed. Approximate transition rates were determined for each patch by first counting the number of transitions from one particular conductance level to another fixed level (e.g. only large-to-small transitions) and then dividing this number by the total time spent in the first conductance level (e.g. total time in the large conductance state). Closing rates are included as a comparison to illustrate the very low transition rates between conductance levels. The method of calculating transition rates used here, that is by counting transitions per unit time, yielded closing rate values only modestly different from those determined from the extrapolation to 0[Ca2+] of the line fitted to the Ca2+ block rate data in Fig. 8A. Test potential was −60 mV, holding potential was −100 mV and the permeant ion was 100 mm Li+. n = 4 patches for each value.
State definitions: L, large; M, medium; S, small; C, closed. Approximate transition rates were determined for each patch by first counting the number of transitions from one particular conductance level to another fixed level (e.g. only large-to-small transitions) and then dividing this number by the total time spent in the first conductance level (e.g. total time in the large conductance state). Closing rates are included as a comparison to illustrate the very low transition rates between conductance levels. The method of calculating transition rates used here, that is by counting transitions per unit time, yielded closing rate values only modestly different from those determined from the extrapolation to 0 [Ca2+] of the line fitted to the Ca2+ block rate data in Fig. 8A. Test potential was −60 mV, holding potential was −100 mV and the permeant ion was 100 mM Li+. n = 4 patches for each value.
Figure 8. Rates of block and unblock by Ca2+ differ between conductance states.
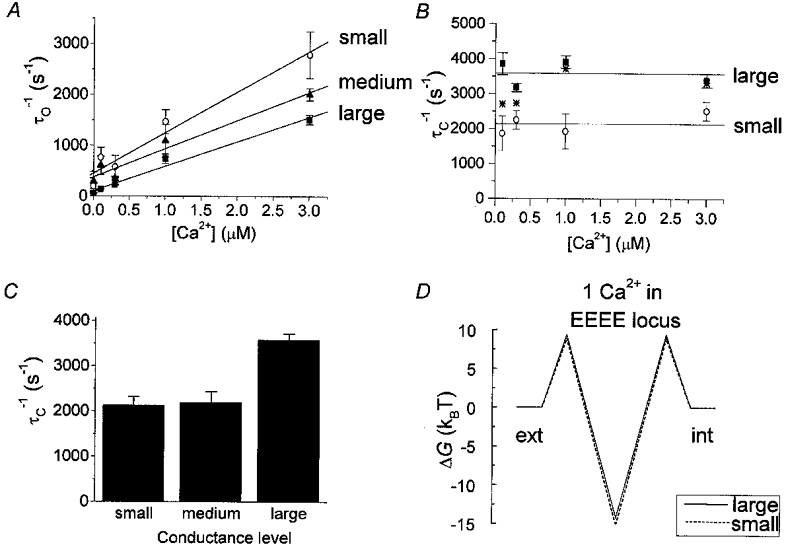
A, block rate (reciprocal of the open time constants) plotted as a function of [Ca2+] for the large, medium and small conductance levels. Each point represents data (corrected for missed events) from 3–5 patches. The straight lines are least-squares fits to the data. For the small conductance level, the slope was 8.0 × 10⁸± 1.0 × 10⁸ M−1 s−1 (standard deviation) and the y-intercept was 453 s−1. For the medium conductance level the slope was 5.5 × 10⁸± 0.7 × 10⁸ M−1 s−1 and the y-intercept was 379 s−1. For the large conductance level the slope was 4.8 × 10⁸± 0.4 × 10⁸ M−1 s−1 and the y-intercept was 107 s−1. The y-intercept provides an indication of the closing rate with no Ca2+ present. Test potential was −60 mV, holding potential was −100 mV. B, unblock rate (reciprocal of the shut time constant) plotted as a function of [Ca2+] for the large and small conductance level. Continuous lines indicate the average unblock rate over the range of Ca2+ concentrations. For the small conductance level the mean was 2135 s−1 and for the large conductance level it was 3582 s−1 (P < 0.001, Student's t test). Asterisks (*) indicate unblock rates for the large conductance state after adjusting for a scenario of contamination of unblock by a brief closed time component (simulated in Fig. 7). Test potential was −60 mV, holding potential was −100 mV (same data as in A). C, average unblock rate for the small, medium, and large conductance levels. D, superimposed energy profiles for Ca2+ block of Li+ current in the large (continuous line) and small (dashed line) conductance states. Barrier heights and well depths at 0 mV were calculated as described in Methods, after adjusting koff values from their measured values at −60 mV to 0 mV (adjustment factor was e-fold/25 mV). For the large conductance state, external and internal flanking barrier height was +9.4kBT and well depth was −14.2kBT. For the small conductance state, flanking barrier height was +8.9kBT, and well depth was −15.2kBT. The electrical distances to the middle of the symmetrical barriers and well were δ = 0.17, 0.5, and 0.83 for both large and small conductance states.
The α1C conductance levels represent true conductance states
The Ca2+ channel substates appear to be true openings to smaller conductance states and did not arise from filtering artefacts. Openings to the substates were well resolved, greatly exceeding the filter rise time (shortest open time of the small substate = 3 ms; filter rise time = 166 μs), so they were not produced by unresolved transitions of relatively slow interconversions between open and closed conformations. Nor do the substates arise from rapid flickering between a single fully open level and the closed level. We measured the standard deviation of the open channel noise for the large and small conductance levels and, compared to open channel noise in the large state, we found no noise broadening in the smaller substate and thus found no evidence of rapid transitions between only a single open level and the closed level. The standard deviations of the large and the small conductance open-channel noise were 0.15 ± 0.01 pA (n = 17 openings) and 0.15 ± 0.05 pA (n = 14), respectively (P > 0.1, Student's t test). Furthermore, increasing the filter bandwidth to 5 kHz did not alter the amplitude of the substates nor reveal any increase in the open channel noise of the smaller substate relative to the larger one (n = 2), rendering unlikely the idea that substates are nothing more than sampling artefacts.
Under some conditions, L-type Ca2+ channels display a rapid switching between substates caused by protonation of specific binding sites in the channel pore (Prod'hom et al. 1987; Chen et al. 1996). The substate behaviour described here is not related to protonation, however: first, proton-induced subconductances never occur with Li+, Ba2+ or Ca2+ as charge carriers (Prod'hom et al. 1989), and yet we describe subconductance levels in all three of these ionic solutions; and second, increasing the pH from 7.4 to 8.1 had no effect on the amplitude or frequency of the substates (n = 2). These results indicate that substates of the α1C Ca2+ channel do not arise from rapid gating or blocking events of the full conductance open level but instead reflect true changes in ion conduction.
Conductance state gating kinetics
Prior to analysing Ca2+ block of the conductance states, we examined the kinetics of conductance state gating. Figure 4 (top) presents examples of single-channel records obtained in 0 Ca2+, at −60 mV and in the presence of 2 μM FPL 64176. The distributions of open times (τO) for the conductance states were all best described by the sum of three exponential components (Fig. 5A). The time constants of the three open states for the individual conductance states were (n = 4 for each conductance level):
 |
Figure 4. Records illustrating block by external Ca2+ of Li+ currents carried by three conductance states of the α1C channel.

Test potential was −60 mV, holding potential was −100 mV, Li+ concentration was 100 mM, and 2 μM FPL 64176 was present in the bath solution.
Figure 5. Lifetime histograms for unitary Li+ currents carried by α1C Ca2+ channels.

A, open time histograms in the absence of blocker ([Ca2+] = 0). Recordings were made using 100 mM Li+ as the charge carrier and 2 μM FPL 64176 was present in the bath solution. Histograms were best fitted by the sum of 3 exponential components. The open time constants for the illustrated patches were: small, 0.5 ms (46 %), 2.7 ms (50 %) and 13.8 ms (4 %); medium, 0.8 ms (35 %), 3.2 ms (13 %) and 20.6 ms (52 %); large, 0.4 ms (23 %), 3.8 ms (11 %) and 25.5 ms (66 %). The test potential was −60 mV, holding potential was −100 mV. B, block by external Ca2+ of Li+ currents carried by three different conductance states of the α1C channel. Open and shut time histograms for the three conductance levels obtained for two concentrations of Ca2+. The open time histograms were well fitted by a monoexponential function and the time constants derived from the fits are indicated to the right of each histogram. The value of the open time constant after correction for missed events is shown in parentheses. The shut time histograms were fitted by two or three exponential functions with the briefest shut time (component that includes block events) indicated to the right of each histogram. Thin lines indicate the individual exponential components and the thick line indicates the sum of exponentials. Time axis tick marks are 0.2 decades per tick. Test potential was −60 mV; holding potential was −100 mV.
We were primarily interested in the longest open time component for use in measuring discrete block events by divalent cations.
Closed time (τC) distributions were also best described by the sum of three exponential components, with the briefest component most likely to represent closings within a burst of openings for one channel. The longer duration components could not be assigned to any particular closed state because patches contained an unknown but multiple number of channels: these two closed time components describe the times during which all channels in the patch were closed, and were shorter than the true inter-burst intervals for one channel as a consequence of the opening of any of the several channels present in the patch. The longer duration closed components therefore have little physical significance, though they were measured for use in simulations of channel kinetics. The mean long-closed time constants were (n = 4):
 |
Most critical for the simulations were the brief closings within a burst, because the mean lifetime of these events was similar to that of the Ca2+ block events. For small, medium and large conductance states, the value of the brief component time constant was:
 |
Ca2+ block of the conductance states
If state-dependent differences in conductance arise from true differences in ion conduction, it might be expected that each conductance state would have a unique binding affinity for permeant ions. To assess this possibility, we measured the kinetics of block and unblock by Ca2+ of Li+ current for three of the conductance levels and then compared the conductance state-dependent binding affinities derived from these rate data. In Li+ (100 mM), the relatively high frequency of openings to each of the conductance states facilitated our measurements of Ca2+ block kinetics.
With 0.1–3.0 μM Ca2+ included in the Li+ solution in the patch pipette, discrete block events were observed when a channel opened to any of the conductance states (Fig. 4, bottom). Analysis of the kinetics of open transitions for the three largest conductance states (28, 19 and 10 pS) showed that, with block activity present, the open time histograms were best fitted by a single exponential component, and as expected for a block process (Ca2+ entry into the pore), the open time constant became briefer as [Ca2+] was increased (Fig. 5B). The longer, gating-related open time components described in Fig. 5A were not evident in the block data because block events accounted for almost all of the shutting events, dominating over channel closing (gating) events even at the lower concentrations of Ca2+ employed.
The shut time histograms were best fitted by two exponential components (Fig. 5B). The longer shut time component is attributable to closed times between bursts, but as described above (Conductance state gating kinetics), has little physical significance. The briefer shut time component arose primarily from channel block (see simulations below), and reflects dissociation of Ca2+ from its binding site in the pore. Consistent with an unblock process, the value of the brief shut time constant did not vary with changes in [Ca2+] for a given conductance state. However, the measured mean shut time was longer for the small conductance state than for the large state (0.5 ms versus 0.3 ms), suggesting that koff for Ca2+ might be relatively faster for the large conductance state. Given the dissimilarities in gating behaviour between the conductance states, are the differences between the measured mean blocked times reliable?
Reliability in estimating kinetic parameters: simulations
Based on the pattern of gating kinetics observed for the conductance states, we considered three potential sources of artefact in our determinations of Ca2+ block kinetics: (1) brief open time contamination of the Ca2+ on-rate, (2) long closed time contamination of the Ca2+ off-rate and (3) brief closed time contamination of the Ca2+ off-rate. We first examined the possibility that, among the conductance states, the differing frequencies of brief, gating-related open times might lead to error in determining whether the conductance states differ in kon for Ca2+. As a specific formulation of the problem, it was hypothesized that the small and large conductance states have identical block rates (kon for Ca2+), and that the faster measured shutting rate (combination of block and closing) for the small conductance state was simply a consequence of its more frequent closings (greater incidence of brief, gating-related open events). Using a computer model (SIMU) and the state diagram illustrated in Fig. 6A, we initially reproduced the gating behaviour of the small conductance state (left). Rate constants for closing were taken as the three measured closing rates (short, middle, long) for the small conductance state, and rate constants for opening were chosen to reproduce the measured proportions of the three experimental open time components observed for the small state. Examples of a record from the simulation and of the three-component open time histogram are shown in Fig. 6A (left) for this case of zero block (0 Ca2+). Simulations that incorporated Ca2+ block were also carried out. In these cases, the unblock rate was taken as the value obtained for the small conductance state (koff = 2135 s−1; Fig. 8B); based on the hypothesis that the block rates for small and large states were identical, block rates were taken as the values measured at each [Ca2+] for the large conductance state. On the right of Fig. 6A are illustrated the state diagram, a simulated single-channel record, and the open time histogram for [Ca2+] = 3 μM. The open time histogram contained only one distinguishable component (τO = 0.6 ms) because blocking events were much more frequent than the slow closing events at this [Ca2+]. Simulations were carried out for 0, 0.3, 1 and 3 μM [Ca2+], and the inverses of the open times determined from histogram fits are plotted (filled squares) versus[Ca2+] in Fig. 6B. The linear regression line fit to these results shows that the shutting rate (τO−1) varied approximately linearly with [Ca2+]. Further, the τO−1 values obtained from exponential fits to open time histograms (filled squares) closely approximated the block rates used to generate the simulated data (open circles). Based on the simulation results, the greater incidence of brief open times in the small conductance state does not significantly alter determination of block rate, and more generally it is evident that kon measurements are little affected by normal channel closing transitions. This conclusion is not surprising because the open time constants for experimental block data varied linearly with [Ca2+], which is expected for a block process but not for a closing process.
Figure 6. Simulating effects of channel gating on determination of Ca2+ block and unblock rates.

A, two kinetic schemes and corresponding examples of simulated records generated using the schemes (scale bars: 0.5 pA, 5 ms). The illustrated open time histograms were obtained from analysis of simulated records. The rate constants for closing in this simulation (left) were set equal to the three closing rates measured for the small conductance state (0 Ca2+). Thus the open time histogram for the simulated data was fitted by the sum of 3 exponential components, with time constants of 0.3 ms (50 %), 2.8 ms (46 %) and 12.0 ms (4.0 %). These fit values correspond very closely to the values measured for experimental data: 0.3 ms (51 %), 2.9 ms (44 %) and 14.3 ms (4 %). The opening rates in the simulation were chosen to make the relative proportions of the three components match those measured for the small conductance state. On the right side of A, Ca2+ block and unblock transitions were added to the simulation. In the simulation, rates for Ca2+ block and unblock were assumed to be equivalent for each of the gating states. The unblock rate was taken from the horizontal line fit to the closed time data for the small state (Fig. 8B; koff = 2135 s−1). The block rates were taken as the values measured at given [Ca2+] for the large state (e.g. 1511 s−1 at 3 μM). The illustrated histogram was best fitted by a monoexponential function, with a time constant of 0.6 ms. B, dependence of shutting rate (τO−1) on [Ca2+] in the simulation. Straight line is a least-squares fit to the data (▪), with a slope of 5.0 × 10⁸ M−1 s−1. The block rates used to generate the simulated data are also plotted (○). C, results of a simulation designed to examine the effect of a longer duration closed time component (τC2) on the determination of mean block time (τB). The kinetic scheme was C2⇌ O ⇌ B, where C2 indicates a relatively longer duration closed state. Simulated records were analysed and shut time histograms constructed as for experimental data. In this simulation, the rate constant for dissociation of blocker was set to koff = 3582 s−1 (the unblocking rate for the large conductance channel) and the rate constant for channel opening was set to k-C2 = 435 s−1 (the inverse of the average second closed time constant for the small conductance channel). The fraction of long closing events (τC2) in the total population of shut events was varied by manipulating the two transition rates away from the open state (kon[Ca2+], kC2). The effect of increasing the proportion of τC2 on unblock rate (koff = τB−1) is illustrated in the plot, where the abscissa is kC2/(kC2+kon[Ca2+]). The horizontal line indicates the simulated unblock rate, i.e. when there are no closings (3582 s−1).
However, because shut times were independent of [Ca2+], and because shut time histograms contained multiple components, it was crucial to consider whether closed times originating from channel gating could lead to mis-measure of block times for the various conductance states. We considered two potential sources of closed time artefact: (1) might longer, gating-related closed times lead to erroneously low estimates of Ca2+ unblock for the small conductance, and (2) might brief, gating-related closed times lead to erroneously high estimates of Ca2+ unblock for the large conductance? To resolve both of these questions, we again used computer simulations of channel kinetics and a simple state diagram of the following form:
 |
where Cn, O and B represent closed, open and blocked states; kCn and k-Cn represent closing and opening rates; Ca represents [Ca2+] and kon and koff represent association and dissociation rate constants for Ca2+.
The issue with long closed time contamination arose because the small conductance state had more frequent sojourns in a longer closed state (C2; τC2 = 2–4 ms) than did the large conductance state, raising the possibility that mean blocked time was more significantly overestimated for the small state as a consequence of its greater incidence of C2 events. As a worst case, the mean blocked times (τB = 1/koff) of large and small channels could be supposed to be identical to one another, with the measured differences in this parameter originating solely from the differing prevalence of C2. In simulating this problem, the unblock rate was set to the measured value for the large conductance state (koff = 3582 s−1; Fig. 8B); τC2 was set to the measured value for the middle component of gating (0 Ca2+) of the small conductance state, corresponding to an opening rate of k-C2 = 435 s−1. The number of opening events relative to unblocking events was varied by manipulating the ratio of closing (kC2 = 100–200 s−1) to blocking (kon[Ca2+] = 10–1200 s−1) events. Figure 6C shows the estimated Ca2+ unblock rate (τB−1) as a function of the fraction of closed events in the total pool of shut events (kC/{kC+kon[Ca2+]}), and the horizontal line marks the true value of the Ca2+ unblock rate (koff) in the simulation. Although there is some deviation of the measured τB−1 values from the true unblock rate, these deviations are very small and do not vary in any systematic way. Thus differences in the proportions of longer, gating-related closed times between conductance states do not significantly affect estimated Ca2+ unblock rates.
The final question addressed using simulations derived from the fact that the conductance states differed from one another in relative prevalence and mean lifetime of the brief closed events that were present in the absence of Ca2+ (τC1,large = 0.15 ms, τC1,small = 0.29 ms). We specifically tested whether the apparently faster rate of unblock for the large conductance state originated as an artefact of a relatively greater incidence of brief closures in the large conductance state, with Ca2+ unblock in fact occurring at the same rate in large and small states. In simulating this scenario, the unblock rate for Ca2+ was set to the measured value for the small conductance state (koff = 2135 s−1; Fig. 8B); the brief closed time constant was set to the measured value of the shortest closed time constant for the large state (0 Ca2+), corresponding to an opening rate of k-C1 = 6667 s−1. The number of opening events relative to unblocking events was, once again, varied by manipulating the ratio of closing (kC1 = 107 s−1) to blocking (kon[Ca2+] = 27–1000 s−1) events. Figure 7A illustrates this scheme for a case where 80 % of the shut events were in fact closing events (left), and for a case where only 10 % of the shut events were closing events (right). Shut time histograms for these simulations were best fitted by a monoexponential, rather than biexponential, function because the time constants for the brief closures (0.15 ms) and for block (0.47 ms) were not well separated.
Figure 7. Simulation of the effect of a brief closed time component (τC1) on the measurement of mean block time (τB).

A, two kinetic schemes and example records generated using the schemes (scale bars = 0.5 pA, 5 ms). Shut time histograms illustrate cases where the fraction of shut times in the blocked state was 0.20 (left) and 0.90 (right). The opening rate was set to k-C1 = 6667 s−1 (the inverse of the shortest shut time constant for the large conductance state) and the blocker dissociation rate was set to koff = 2135 s−1 (the inverse of the block time for the small conductance state). The channel closing rate was set to kC1 = 107 s−1, the estimated closing rate for the large conductance state in the absence of blocker (y-intercept in Fig. 8A). The rate of block (kon[Ca2+]) was varied to give increasing amounts of block. B, relationship between shutting rate and fraction of shut events in the blocked state. Simulated data (▪) are plotted versus the fraction of shut events in the blocked state, kon[Ca2+])/(kon[Ca2+]+kC1). Experimental data for the large conductance channel (▿) were plotted at the intersection of the measured shutting rates (τO−1) with the curve drawn through the simulated data (B-spline). In this manner, this graphical relationship was used to determine the fraction of shut events in the blocked state for the [Ca2+] (upper x-axis) used in experiments (example for 1 μM Ca2+ shown as dashed lines). C, relationship between estimated unblock rate (τS−1) and the fraction of shut events in the blocked state. With increasing block, the measured unblock rates become slower, approaching the rate of block (B-spline curve drawn through simulated data). Normalizing the y-axis using the relation (τS−1– 2135)/(6667 – 2135) gives the fractional error. Experimental data (▿) were plotted based on the fraction of shut events in the blocked state for each [Ca2+], as determined in B (dashed lines again illustrate an example for 1 μM Ca2+). The fractional error determined for each Ca2+ concentration was: 0.30 at 0.1 μM; 0.14 at 0.3 μM; 0.05 at 1 μM; and 0.02 at 3 μM.
To determine the fractional error in measurement of the unblocking rate as a function of the amount of block present, we carried out a two step analysis. First, the dependence of the shutting rate (τO−1) upon the fraction of blocked events in the total pool of shut events (closed plus blocked) was calculated from the simulated data, yielding the plot in Fig. 7B. Results from the simulations are plotted as filled squares, and a curve is drawn through these points. This plot is used to determine the fraction of shut events in the blocked state (kon[Ca2+]/{kon[Ca2+]+kC1}) at any given [Ca2+], information that cannot be obtained from the shut times (τS). As an example, at 1 μM Ca2+, the measured τO−1 for our experimental data was 722 s−1, and reading down to the block axis from the point where this τO−1 value intersects the curve (open triangle) yields the fraction of shut events in the blocked state, in this case 0.85 (dashed lines).
The second step in the analysis is based on a plot of the dependence of the unblocking rate (τS−1) upon the fraction of blocked events in the total pool of shut events (Fig. 7C). Again, results from the analysis of simulated data are plotted as filled squares and a curve is drawn through these values. Using the fraction of shut events in the blocked state obtained from the plot in Fig. 7B, the fractional error in the determination of the unblocking rate at each [Ca2+] can be estimated. For example, continuing with the case for 1 μM Ca2+, reading across from the point of intersection of the block fraction with the curve (0.85, open triangle) yields a fractional error of 0.05 (dashed lines). In this particular case, most of the shut events were in fact blocked events, so that the measured rate of unblock was very little affected by brief closed events. According to the simulations, the errors at the three higher [Ca2+] employed were < 15 % and the brief channel closings would thus have little effect on our measurements of Ca2+ unblocking rate.
As the simulated worst-case scenarios indicated that neither short open times, nor long closed times, nor short closed times appeared to much affect our ability to estimate Ca2+ block and unblock rates, we proceeded to estimate these rates for the different conductance states.
Subconductance states have a higher binding affinity for Ca2+
The reciprocals of the mean open times (obtained as in Fig. 5) were plotted versus Ca2+ concentration, and the slopes of these linear relationships yielded rate constants for block by Ca2+ (Lansman et al. 1986). In Fig. 8A, these rate data are plotted for each of the three conductance levels. The slopes of the fitted lines yielded rate coefficients for block (kon) of 8.0 × 10⁸ M−1 s−1 for the small conductance level, 5.5 × 10⁸ M−1 s−1 for the medium conductance level, and 4.8 × 10⁸ M−1 s−1 for the large conductance level. Using a linear models method, the slopes of the large and small conductance levels were found to be significantly different from one another (F = 58.67; df = 1, 23; P < 0.001), meaning that the calculated kon values differ from one another in a conductance state-dependent manner. The [Ca2+] dependence of the block rates argues strongly against the idea that the measured differences in block rate arise from differences in conductance state gating. Note that the measured on-rate for block of the large conductance state is similar to that obtained in the simulations presented in Fig. 6B (5.0 × 10⁸ M−1 s−1).
Unblock rate constants (koff) were calculated as the reciprocal of the mean shut time constants and did not change with Ca2+ concentration. Figure 8B shows that the unblock rate coefficient was lower for the small conductance state (2135 ± 137 s−1) than it was for the large conductance state (3582 ± 181 s−1; P < 0.001, Student's t test). Note that because blocked time (1/koff) is independent of [Ca2+] (Hess et al. 1986; Kuo & Hess, 1993a) and that the error in determining koff is minimized at high [Ca2+] (Fig. 7B), the data obtained with the highest [Ca2+] provide the most reliable estimate of the difference in koff between conductance states. Simulations indicated that neither contamination of kon by brief open events nor contamination of koff by long closed times had any significant consequences in our work (Fig. 6B and C). The simulations described in Fig. 7 indicated that brief closed time contamination of blocked time measurements could be very significant, depending upon the number of blocked events relative to the number of closed events. This in turn depends upon the [Ca2+], and simulations allowed estimation of the fractional error owing to this problem (Fig. 7). The resulting worst-case adjusted koff values are plotted in Fig. 8B as asterisks. Even in this worst-case scenario (*), large and small conductance states clearly differ from one another in their koff values. Figure 8C presents the mean unblock rates for all three conductance levels analysed.
These results indicate that when the α1C channel has opened to a smaller substate instead of to the full open state, two parameters of Ca2+ binding in the pore are different. First, kon is larger, meaning that Ca2+ has better access to the binding locus. Second, koff is smaller, meaning that Ca2+ is released from its binding locus more slowly. The apparent dissociation constant, calculated as the ratio of the unblock and block rate constants (K′D = koff/kon), yields apparent K′D values for Ca2+ of 2.7 μM for the small conductance state, 4.0 μM for the medium conductance state, and 7.5 μM for the large conductance state. Thus, for the α1C Ca2+ channel there is a clear correlation between the binding affinity of the channel and the conductance state in which it resides.
Based on the measured kon and calculated K′D values, Ca2+ entry and exit can be operationally described using simple free energy profiles. As illustrated in Fig. 8D, the large (continuous lines) and small (dashed lines) conductance states differ in both barrier and well energies by only a small amount, ∼1kBT.
Direct transitions between substates
We noticed during our experiments that while the α1C Ca2+ channel opened frequently to various conductance levels from the closed state, direct transitions between the conductance states were rarely observed. For openings in 100 mM Li+, we calculated the apparent transition rate from one conductance level to another by counting the number of transitions from the first state to the second state and dividing this by the total time spent in the first conductance state. These values are listed in Table 1. Apparent transition rates ranged between 0.5 and 1.7 s−1, with the majority of transitions occurring at the onset or termination of the channel burst (83 %). In comparison, the channel closing rate was much faster, ranging from 61 s−1 for the large state to 465 s−1 for the small state. As can be seen from the very low transition rates, the channel did not usually open to a substate en route to another conductance level (probability of a transition ∼1 %). Instead, after opening to a particular conductance state, the channel returned to the closed state before reopening.
These low rates may in fact represent upper limits for direct transitions between different conductance levels. Given the limited time resolution of our recording system, it is likely that we have missed some brief closures separating what appear to be direct transitions between conductance levels. Taking this argument one step further, it is also possible that channels never make transitions between conductance levels, always closing in between openings to different conductance levels.
DISCUSSION
Substate behaviour has been described previously for Ca2+ channels in native tissue (Chen & Hess, 1987; Kunze & Ritchie, 1990; Church & Stanley, 1996), heterologous expression systems (Gondo et al. 1998; Hans et al. 1999), and lipid bilayers (Talvenheimo et al. 1987; Ma & Coronado, 1988). Generally, subconductance levels have been reported to occur with greater frequency in studies employing heterologous expression systems or lipid bilayers, and using the Xenopus oocyte expression system we, too, have observed a relatively high proportion of openings to subconductance levels. Whatever the source of the enhanced substate behaviour, though, the goal of the present work has been to study the relationship between permeant ion binding and flux for conductance states of α1C Ca2+ channels.
Our principal finding is that the conductance levels of a voltage-gated Ca2+ channel differ amongst themselves in binding affinity for Ca2+: we found that two subconductance states of the α1C channel have a higher apparent binding affinity (K′D) for Ca2+ than does the full open state. These conductance state-dependent differences in K′D arise from differences in the rates of both block and unblock by Ca2+. Compared to the full open state, the substates exhibited increased rates of block, reflecting easier access of Ca2+ to its binding site in the EEEE locus, and decreased rates of unblock, reflecting longer dwell times for Ca2+ at the binding locus.
It is not experimentally feasible to resolve the very fast rates of Ca2+ entry and exit when Ca2+ is the exclusive current carrying ion: with Ca2+ in the millimolar range, these individual kinetic events have lifetimes of ∼1 μs, which is at least an order of magnitude too brief to resolve. However, by lowering external Ca2+ into the ∼micromolar range, and using block and unblock of Li+ current as a high-gain signal detector, we have been able to measure Ca2+ entry into, and departure from, the pore by the channel's natural permeant ion. It has previously been demonstrated that Ca2+ ions bound in the pore exit with the flow of (Li+) current, which in all of our experiments is into the cytosol (Hess et al. 1986; Kuo & Hess, 1993a). Thus, the conductance state-dependent differences in block and unblock that we have measured are likely to pertain to conductance state-dependent differences in Ca2+ permeation: Ca2+ block results from entry of extracellular Ca2+ into the pore, just as does Ca2+ flux, and Ca2+ unblock results from release of bound Ca2+ from the EEEE locus into the cytosol. Although currents through the various conductance states were carried by Li+ in the Ca2+ block experiments, α1C channels also exhibited several conductance levels when Ca2+ was the exclusive current carrying ion. A tenable view, then, is that the conductance states measured with Li+ as the current carrier represent the same α1C conformational states as those measured with Ca2+ as the current carrier.
Accounting for distinct conductances using a rate-theory model of the permeation pathway
Can the small differences in the energetics of Ca2+ block and unblock illustrated in Fig. 8D plausibly account for the differences in unitary current between the conductance states? To investigate this idea we have used a theoretical model to test whether measured block and unblock rates predict measured unitary currents. Several useful models are available (Almers & McCleskey, 1984; Hess & Tsien, 1984; Dang & McCleskey, 1998; Nonner & Eisenberg, 1998). We have chosen to use simple Eyring rate models as operational descriptions of block and flux in Ca2+ channels, and for clarity, we focus upon comparison of the large (full open level) and small conductance states.
Ca2+ entry into the pore was determined as the on-rate for Ca2+ block of Li+ current, and this rate is related to the height of the flanking barrier at the external entrance to the pore (Fig. 8D). Compared to the large conductance state, the small one had a higher Ca2+ block rate, meaning greater accessibility of Ca2+ to the binding locus, and therefore the small conductance state is characterized in the model as having a lower energy barrier controlling access to the pore. The lower external flanking barrier for the small conductance state may possibly reflect a slight structural alteration in the pore entrance where Ca2+ may be attracted by negative charges. Whatever the structural rearrangement might be, however, the greater rate of Ca2+ entry into the small conductance state obviously does not account for its lower conductance.
Ca2+ exit from the pore and into the cytosol is determined as the off-rate for Ca2+ block of Li+ current, and this rate is related to the total energy difference between the bottom of the well and the top of the more intracellularly disposed flanking barrier (the internal barrier, Fig. 8D). Assuming for the sake of simplicity that the internal and external barriers are identical in height, the slower unblock rate measured for the small conductance state is modelled with a deeper well as compared to that for the large conductance state. Once again, a small difference in pore structure, perhaps in the EEEE locus itself, is all that is likely to be required to produce this change in unbinding of Ca2+. Significantly, the smaller Ca2+koff is in accord with the smaller amplitude of the small conductance state.
For Ca2+ block of Li+ current, external [Ca2+] was low and the EEEE locus was occupied by either 0 or 1 Ca2+ ions. With 110 mM external [Ca2+], the probability that 2 Ca2+ ions simultaneously occupy the EEEE locus becomes significant (∼0.1–0.5), and the negative cooperativity owing to double occupancy is essential for fast Ca2+ flux (Almers & McCleskey, 1984; Hess & Tsien, 1984; Lansman et al. 1986). To calculate unitary current amplitude for 110 mM external [Ca2+], interaction between the Ca2+ ion pairs in the EEEE locus must be incorporated into the model, and again, several approaches exist: negative cooperativity between Ca2+ ions in the doubly occupied EEEE locus has been ascribed variously to electrostatic repulsion between ions (Almers & McCleskey, 1984; Hess & Tsien, 1984), to competition between ions for liganding groups (Yang et al. 1993; Kuo & Hess, 1993a,b; Ellinor et al. 1995), or has been represented as sequential potential energy steps into and out of the pore (Dang & McCleskey, 1998). For simplicity in calculating unitary current amplitudes, we employed a version of the rate model utilizing electrostatic repulsion (parameters in Fig. 9 legend). The modelling results are shown in Fig. 9A as continuous (large conductance level) and dashed lines (small conductance level), and these are superimposed on the experimentally measured single-channel current amplitudes (open and filled symbols). The model predicts a large reduction in single-channel conductance for Ca2+ from 11.7 pS in the full open state to 4.2 pS in the small substate, and the predicted current amplitudes agree very closely with the measured ones. Virtually identical results were obtained using a step-model (Dang & McCleskey, 1998; not shown). Thus, independent of the physical origin of negative cooperativity (repulsion, competition, steps) in the EEEE locus, the differences in binding kinetics between Ca2+ channel conductance levels can theoretically account for the observed differences in amplitude between the conductance states. Figure 9B illustrates the differences in energy between the large and small conductance states when the EEEE locus is simultaneously occupied by 2 Ca2+ ions.
Figure 9. Accounting for conductance levels in α1C Ca2+ channels using rate theory models.

A, comparison of measured conductance state-dependent unitary current amplitude with predicted amplitudes from the model. Continuous and dashed lines represent unitary current amplitude predicted by the model. Symbols represent single-channel data obtained with 110 mM Ca2+ as the permeant ion (○, small conductance level; ▪, large conductance level). The model included external and internal flanking barriers, and two Ca2+ binding sites separated by a middle barrier. For both the large and small conductance states, external and internal flanking barrier heights were identical to those shown in Fig. 8D (9.4, 8.9kBT). Middle barrier height was +0.8kBT for both large and small conductance states. Well depth was −14.2kBT for the large conductance state, and −15.2kBT for the small conductance state. Negative cooperativity in the binding of two Ca2+ ions was modelled as pure electrostatic repulsion, which increased Ca2+ unbinding by a factor of 20000 (Almers & McCleskey, 1984; Hess & Tsien, 1984). In the model, repulsion affected ion exit but not entry (Almers & McCleskey, 1984). Since the known voltage dependence of koff (Kuo & Hess, 1993a) is consistent in a simple way with exiting Ca2+ ions experiencing 50 % of the electric field, we positioned the more internal well in the model at δ = 0.5 for both large and small conductance states. Inward rectification was preserved in the modelled i–V relationships by positioning the more external well at a significant electrical distance from the internal well, at δ = 0.2 (large and small states). For both large and small conductance states, electrical distances to the barrier peaks were δ = 0.05, 0.35 and 0.95. B, simplified symmetric energy profile describing the permeation pathway during Ca2+ flux. This profile describes the pore only when simultaneously occupied by 2 Ca2+ ions, which is ≈50 % of the time at 0 mV. The remainder of the time, the conductance state energy profiles for Ca2+ are similar to those shown in Fig. 8D. The shallowness of the wells results from negative cooperativity in the binding of Ca2+ ions. The continuous line represents the energy profile for the large conductance state and the dashed line represents the energy profile for the small conductance state. Flanking barrier heights for the large and small conductance states are the same as for Ca2+ block of Li+ (Fig. 8D). The other energies are (in units of kBT): middle barrier +0.9, and well depths −4.3 for the large conductance and −5.3 for the small conductance. Electrical distances are as listed in A.
From a chemical point of view, the ∼1kBT difference in Ca2+ binding energy (Figs 8D and 9B) between the large and small conductance states is equivalent to ∼2.5 kJ mol−1 (∼0.6 kcal mol−1), which is indeed small: hydrogen bond energies are in the range of 4–40 kJ mol−1 (1–10 kcal mol−1), Van der Waals interactions are in the order of 4 kJ mol−1 (1 kcal mol−1), and the molar thermal energy of atoms at room temperature is 2.5 kJ mol−1 (0.6 kcal mol−1). Hence the physical and chemical rearrangements in pore structure that generate the different conductance states could reasonably be very small. It is interesting, then, that pore structure remains stable in one conductance state or another for measurable periods of time.
Rare direct transitions between conductance levels and the origin of substates
Because differences between conductances states in the energetics of Ca2+ binding are so small, one might imagine that the differences in structure that underlie these differences in free energy are also small and that the channel could, as a consequence, easily fluctuate between conductance states. It seems surprising, therefore, that direct transitions between conductance levels were rarely observed. As summarized in Table 1, transition rates between conductance states were ∼1 per second of conductance state dwell time, or in the order of 1 % of conductance state closing rate. These low transition rates suggest the existence of a very large energy barrier (ΔG≡ 29kBT) that prevents the channel from switching between conductance levels once it has opened.
Although ion channel gating and permeation have traditionally been viewed as two separate and physically distinct processes, there is considerable evidence that they are in fact intimately related to one another in both ligand-gated and voltage-gated channels (Marchais & Marty, 1979; Swenson & Armstrong, 1981; Pusch et al. 1995; Schneggenburger & Ascher, 1997). In some cases, substates are linked to the mechanism of channel activation, with examples including cyclic nucleotide-gated channels, glutamate receptor channels and voltage-gated K+ channels (Ferguson et al. 1993; Chapman et al. 1997; Zheng & Sigworth, 1997; Ruiz & Karpen, 1997; Rosenmund et al. 1998). Recent work on voltage-gated K+ channels, in particular, has demonstrated that during activation, these channels pass through intermediate levels of conductance on their way to the fully open state (Ferguson et al. 1993; Chapman et al. 1997; Zheng & Sigworth, 1997). For these kinds of K+ channels, which are comprosed of four subunits homologous to the four domains of the Ca2+ channel α1 subunit, it has been proposed that the permeation pathway becomes available in discrete steps as each subunit changes from a non-conducting state to a conformation that allows permeation.
Unlike the case with K+ channels, we found that the probability of α1C channels residing in any particular conductance state was not related to the membrane potential. However, the fact that direct transitions between conductance states were, at most, very rare and that instead the probability of changing conductance state was strongly correlated with channel opening suggests the possibility that Ca2+ channel subconductance openings are indeed analogous to the substates seen during activation and deactivation of voltage-gated K+ channels. The pore-forming subunit of Ca2+ channels (α1) is a single polypeptide encompassing four homologous but non-identical domains. During activation, all four domains undergo conformational changes that ultimately lead to channel opening and ion permeation (Bezanilla & Stefani, 1994). The four domains are likely to be non-equivalent in function, just as the glutamate residue contributed by any particular domain to the EEEE locus is functionally distinct from each of the other three contributed glutamates (Ellinor et al. 1995). Perhaps the temporal order in which these non-equivalent domains respond to changes in membrane potential is variable, with distinct orders specifying the conductance level of the activated channel.
Other potential origins of subconductance levels
The subconductance levels that we have studied are apparently true substates: increasing the recording bandwidth did not affect the amplitude of the subconductance levels, indicating that substates were not produced by a filtering artefact, and neither did substates exhibit more open channel noise as compared to the fully open level, contrary to predictions of a fluctuating barrier model for subconductance activity (Dani & Fox, 1991; Moss & Moczydlowski, 1996). Most directly, we were able to measure differences in binding affinity between the large and small conductance states, thus excluding rapid state-switching models of subconductance activity that predict identical binding affinities for the substates and fully open state.
It is possible that the conductance states observed in this study correspond to the opening of α1C-based channels with distinct subunit compositions (e.g. α1C+β2b+α2/δ, α1C+α2/δ, α1C+β2b, α1C). However, the α1C subunit when expressed alone exhibited the same subconductance levels as when it was coexpressed with β2b and α2/δ. In addition, other workers using a different heterologous expression system have also shown that the α1C channel opens to identical subconductance levels when α1C is expressed alone or coexpressed with a β subunit (Gondo et al. 1998).
Finally, subconductance states of various kinds of channels have been reported to be regulated by processes such as phosphorylation (Greif et al. 1995), G-protein coupled receptor activation (Kuo & Bean, 1993) or plasticity-inducing stimulation (Benke et al. 1998). Perhaps the α1C substates described here are induced by some kind of cellular signalling mechanism as well. Whether α1C subconductances have a role in normal cell function is unknown, but identification of biochemical pathways regulating relative occupancy of conductance states would support such an hypothesis. At present, however, possible physiological roles and the origin of the substates of α1C Ca2+ channels, like those of many other channel types, remain to be discovered.
Acknowledgments
We thank Susan Cibulsky and Serguei Ovtchinnikov for technical assistance, and Anna Williamson, Susan Cibulsky and John Caldwell for critical reading of the manuscript. We also thank Emily Liman for the gift of a vector bearing the 5′- and 3′-untranslated regions from the Xenopusβ globin gene, and Tsutomu Tanabe, Veit Flockerzi and Franz Hofmann for gifts of the α1C, α2/δ and β2b subunit cDNAs. Edwin McCleskey supplied the computer model of ion permeation, and software used to simulate single-channel kinetics was provided by Feng Qin, Anthony Auerbach and Fred Sachs (SIMU; © SUNY Buffalo, 1998). This work was supported by a fellowship from the American Heart Association of Colorado and Wyoming CWFW-14–97 (R.K.C.), and NIH grants NS35245 and AG04418 (W.A.S.).
References
- Almers W, McCleskey EW. Non-selective conductance in calcium channels of frog muscle: calcium selectivity in a single-file pore. The Journal of Physiology. 1984;353:585–608. doi: 10.1113/jphysiol.1984.sp015352. [DOI] [PMC free article] [PubMed] [Google Scholar]
- Auerbach A, Sachs F. Single-channel currents from acetylcholine receptors in embryonic chick muscle. Biophysical Journal. 1984;45:187–198. doi: 10.1016/S0006-3495(84)84147-8. [DOI] [PMC free article] [PubMed] [Google Scholar]
- Benke TA, Luthi A, Isaac JTR, Collingridge GL. Modulation of AMPA receptor unitary conductance by synaptic activity. Nature. 1998;393:793–797. doi: 10.1038/31709. [DOI] [PubMed] [Google Scholar]
- Bezanilla F, Stefani E. Voltage-dependent gating of ionic channels. Annual Review of Biophysics and Biomolecular Structure. 1994;23:819–846. doi: 10.1146/annurev.bb.23.060194.004131. [DOI] [PubMed] [Google Scholar]
- Bormann J, Hamill O, Sakmann B. Mechanism of anion permeation through channels gated by glycine and gamma-aminobutyric acid in mouse cultured spinal neurones. The Journal of Physiology. 1987;385:243–296. doi: 10.1113/jphysiol.1987.sp016493. [DOI] [PMC free article] [PubMed] [Google Scholar]
- Bosma MM, Moody WJ. Macroscopic and single-channel studies of two Ca2+ channel types in oocytes of the ascidian Ciona intestinalis. Journal of Membrane Biology. 1990;114:231–243. doi: 10.1007/BF01869217. [DOI] [PubMed] [Google Scholar]
- Chapman ML, Vandongen HMA, Vandongen AMJ. Activation-dependent subconductance levels in the drk1 K channel suggest a subunit basis for ion permeation and gating. Biophysical Journal. 1997;72:708–719. doi: 10.1016/s0006-3495(97)78707-1. [DOI] [PMC free article] [PubMed] [Google Scholar]
- Chen CF, Hess P. A complex new gating pattern detected in L-type calcium channels from guinea-pig ventricular myocytes and mouse 3T3 fibroblasts. The Journal of Physiology. 1987;390:80. P. [Google Scholar]
- Chen XH, Bezprozvanny I, Tsien RW. Molecular basis of proton block of L-type Ca2+ channels. Journal of General Physiology. 1996;108:363–374. doi: 10.1085/jgp.108.5.363. [DOI] [PMC free article] [PubMed] [Google Scholar]
- Church PJ, Stanley EF. Single L-type calcium channel conductance with physiological levels of calcium in chick ciliary ganglion neurons. The Journal of Physiology. 1996;496:59–68. doi: 10.1113/jphysiol.1996.sp021665. [DOI] [PMC free article] [PubMed] [Google Scholar]
- Colquhoun D, Hawkes AG. The principles of the stochastic interpretation of ion-channel mechanisms. In: Sakmann B, Neher E, editors. Single-Channel Recording. New York: Plenum Press; 1995. pp. 397–482. [Google Scholar]
- Colquhoun D, Sigworth FJ. Fitting and statistical analysis of single-channel records. In: Sakmann B, Neher E, editors. Single-Channel Recording. New York: Plenum Press; 1995. pp. 483–587. [Google Scholar]
- Dang TX, McCleskey EW. Ion channel selectivity through stepwise changes in binding affinity. Journal of General Physiology. 1998;111:185–193. doi: 10.1085/jgp.111.2.185. [DOI] [PMC free article] [PubMed] [Google Scholar]
- Dani JA, Fox JA. Examination of subconductance levels arising from a single ion channel. Journal of Theoretical Biology. 1991;153:401–423. doi: 10.1016/s0022-5193(05)80578-8. [DOI] [PubMed] [Google Scholar]
- Ellinor PT, Yang J, Sather WA, Zhang JF, Tsien RW. Ca2+ channel selectivity at a single locus for high-affinity Ca2+ interactions. Neuron. 1995;15:1121–1132. doi: 10.1016/0896-6273(95)90100-0. [DOI] [PubMed] [Google Scholar]
- Ferguson WB, McManus OB, Magleby KL. Opening and closing transitions for BK channels often occur in two steps via sojourns through a brief lifetime subconductance state. Biophysical Journal. 1993;65:702–714. doi: 10.1016/S0006-3495(93)81097-X. [DOI] [PMC free article] [PubMed] [Google Scholar]
- Fox JA. Conductance and selectivity properties of a substate of the rabbit sarcoplasmic reticulum channel. Biophysical Journal. 1985;47:573–576. doi: 10.1016/S0006-3495(85)83953-9. [DOI] [PMC free article] [PubMed] [Google Scholar]
- Gondo N, Ono K, Mannen K, Yatani A, Green SA, Arita M. Four conductance levels of cloned cardiac L-type Ca2+ channel α1 and α1/β subunits. FEBS Letters. 1998;423:86–92. doi: 10.1016/s0014-5793(98)00070-2. [DOI] [PubMed] [Google Scholar]
- Greif GJ, Lin YJ, Freedman JE. Role of cyclic AMP in dopamine modulation of potassium channels on rat striatal neurons: regulation of a subconductance state. Synapse. 1995;21:275–277. doi: 10.1002/syn.890210303. [DOI] [PubMed] [Google Scholar]
- Hamill OP, Marty A, Neher E, Sakmann B, Sigworth FJ. Improved patch-clamp techniques for high-resolution current recording from cells and cell-free membrane patches. Pflügers Archiv. 1981;391:85–100. doi: 10.1007/BF00656997. [DOI] [PubMed] [Google Scholar]
- Hanke W, Boheim G. The lowest conductance state of the alamethicin pore. Biochimica et Biophysica Acta. 1980;596:456–462. doi: 10.1016/0005-2736(80)90134-0. [DOI] [PubMed] [Google Scholar]
- Hans M, Luvisetto S, Williams ME, Spagnolo M, Urrutia A, Tottene A, Brust PF, Johnson EC, Harpold MM, Stauderman KA, Pietrobon D. Functional consequences of mutations in the human α1A calcium channel subunit linked to familial hemiplegic migraine. Journal of Neuroscience. 1999;19:1610–1619. doi: 10.1523/JNEUROSCI.19-05-01610.1999. [DOI] [PMC free article] [PubMed] [Google Scholar]
- Hess P, Lansman JB, Tsien RW. Calcium channel selectivity for divalent and monovalent cations. Journal of General Physiology. 1986;88:293–319. doi: 10.1085/jgp.88.3.293. [DOI] [PMC free article] [PubMed] [Google Scholar]
- Hess P, Tsien RW. Mechanism of ion permeation through calcium channels. Nature. 1984;309:453–456. doi: 10.1038/309453a0. [DOI] [PubMed] [Google Scholar]
- Hille B. Ionic Channels of Excitable Membranes. 2. Sunderland, MA, USA: Sinauer Associates, Inc.; 1992. [Google Scholar]
- Hofmann F, Lacinova L, Klugbauer N. Voltage-dependent calcium channels: from structure to function. Reviews of Physiology, Biochemistry and Pharmacology. 1999;139:33–87. doi: 10.1007/BFb0033648. [DOI] [PubMed] [Google Scholar]
- Hullin R, Singer-Lahat D, Freichel M, Biel M, Dascal N, Hofmann F, Flockerzi V. Calcium channel beta subunit heterogeneity: functional expression of cloned cDNA from heart aorta and brain. EMBO Journal. 1992;11:885–890. doi: 10.1002/j.1460-2075.1992.tb05126.x. [DOI] [PMC free article] [PubMed] [Google Scholar]
- Kim MS, Morii T, Sun Ol X, Imoto K, Mori Y. Structural determinants of ion selectivity in brain calcium channel. FEBS Letters. 1993;318:145–148. doi: 10.1016/0014-5793(93)80009-j. [DOI] [PubMed] [Google Scholar]
- Kunze D, Ritchie A. Multiple conductance levels of the dihydropyridine-sensitive calcium channel in GH3 cells. Journal of Membrane Biology. 1990;118:171–178. doi: 10.1007/BF01868474. [DOI] [PubMed] [Google Scholar]
- Kuo CC, Bean BP. G-protein modulation of ion permeation through N-type calcium channels. Nature. 1993;365:258–262. doi: 10.1038/365258a0. [DOI] [PubMed] [Google Scholar]
- Kuo CC, Hess P. Characterization of the high-affinity Ca2+ binding sites in the L-type Ca2+ channel pore in rat phaeochromocytoma cells. The Journal of Physiology. 1993a;466:657–682. [PMC free article] [PubMed] [Google Scholar]
- Kuo CC, Hess P. Ion permeation through the L-type Ca2+ channel in rat phaeochromocytoma cells: two sets of ion binding sites in the pore. The Journal of Physiology. 1993b;466:629–655. [PMC free article] [PubMed] [Google Scholar]
- Lansman JB, Hess P, Tsien RW. Blockade of current through single calcium channels by Cd2+, Mg2+, and Ca2+ Journal of General Physiology. 1986;88:321–347. doi: 10.1085/jgp.88.3.321. [DOI] [PMC free article] [PubMed] [Google Scholar]
- Liman ER, Tytgat J, Hess P. Subunit stoichiometry of a mammalian K+ channel determined by construction of multimeric cDNAs. Neuron. 1992;9:861–871. doi: 10.1016/0896-6273(92)90239-a. [DOI] [PubMed] [Google Scholar]
- Liu Q, Lai A, Rousseau E, Jones R, Meissner G. Multiple conductance states of the purified calcium release complex from skeletal sarcoplasmic reticulum. Biophysical Journal. 1989;55:415–424. doi: 10.1016/S0006-3495(89)82835-8. [DOI] [PMC free article] [PubMed] [Google Scholar]
- Ma J, Coronado R. Heterogeneity of conductance states in calcium channels of skeletal muscle. Biophysical Journal. 1988;53:387–395. doi: 10.1016/S0006-3495(88)83115-1. [DOI] [PMC free article] [PubMed] [Google Scholar]
- Marchais D, Marty A. Interaction of permeant ions with channels activated by acetylcholine in Aplysia neurones. The Journal of Physiology. 1979;297:9–45. doi: 10.1113/jphysiol.1979.sp013025. [DOI] [PMC free article] [PubMed] [Google Scholar]
- Mikala G, Bahinski A, Yatani A, Tang S, Schwartz A. Differential contribution by conserved glutamate residues to an ion-selectivity site in the L-type Ca2+ channel pore. FEBS Letters. 1993;335:265–269. doi: 10.1016/0014-5793(93)80743-e. [DOI] [PubMed] [Google Scholar]
- Mikami A, Imoto K, Tanabe T, Niidome T, Mori Y, Takeshima H, Narumiya S, Numa S. Primary structure and functional expression of the cardiac dihydropyridine-sensitive calcium channel. Nature. 1989;340:230–233. doi: 10.1038/340230a0. [DOI] [PubMed] [Google Scholar]
- Moss GWJ, Moczydlowski E. Rectifying conductance substates in a large conductance Ca2+-activated K+ channel: evidence for a fluctuating barrier mechanism. Journal of General Physiology. 1996;107:47–68. doi: 10.1085/jgp.107.1.47. [DOI] [PMC free article] [PubMed] [Google Scholar]
- Nonner W, Eisenberg B. Ion permeation and glutamate residues linked by Poisson-Nernst-Planck theory in L-type calcium channels. Biophysical Journal. 1998;75:1287–1305. doi: 10.1016/S0006-3495(98)74048-2. [DOI] [PMC free article] [PubMed] [Google Scholar]
- Parent L, Gopalakrishnan M. Glutamate substitution in repeat IV alters divalent and monovalent cation permeation in the heart Ca2+ channel. Biophysical Journal. 1995;69:1803–1813. doi: 10.1016/S0006-3495(95)80050-0. [DOI] [PMC free article] [PubMed] [Google Scholar]
- Premkumar LS, Auerbach A. Identification of a high affinity divalent cation binding site near the entrance of the NMDA receptor channel. Neuron. 1996;16:869–880. doi: 10.1016/s0896-6273(00)80107-5. [DOI] [PubMed] [Google Scholar]
- Prod'hom B, Pietrobon D, Hess P. Direct measurement of proton transfer rates to a group controlling the dihydropyridine-sensitive Ca2+ channel. Nature. 1987;329:243–246. doi: 10.1038/329243a0. [DOI] [PubMed] [Google Scholar]
- Prod'hom B, Pietrobon D, Hess P. Interactions of protons with single open L-type calcium channels. Journal of General Physiology. 1989;94:23–42. doi: 10.1085/jgp.94.1.23. [DOI] [PMC free article] [PubMed] [Google Scholar]
- Pusch M, Ludewig U, Rehfeldt A, Jentsch T. Gating of the voltage-dependent chloride channel CIC-0 by the permeant ion. Nature. 1995;373:527–531. doi: 10.1038/373527a0. [DOI] [PubMed] [Google Scholar]
- Rosenmund C, Stern-Bach Y, Stevens CF. The tetrameric structure of a glutamate receptor channel. Science. 1998;280:1596–1599. doi: 10.1126/science.280.5369.1596. [DOI] [PubMed] [Google Scholar]
- Ruiz ML, Karpen JW. Single cyclic nucleotide-gated channels locked in different ligand-bound states. Nature. 1997;389:389–392. doi: 10.1038/38744. [DOI] [PubMed] [Google Scholar]
- Schneggenburger R, Ascher P. Coupling of permeation and gating in an NMDA-channel pore mutant. Neuron. 1997;18:167–177. doi: 10.1016/s0896-6273(01)80055-6. [DOI] [PubMed] [Google Scholar]
- Schreibmayer W, Tritthart HA, Schindler H. The cardiac sodium channel shows a regular substate pattern indicating synchronized activity of several ion pathways instead of one. Biochemical and Biophysical Research Communications. 1989;986:172–186. doi: 10.1016/0005-2736(89)90288-5. [DOI] [PubMed] [Google Scholar]
- Sigworth FJ, Sine SM. Data transformations for improved display and fitting of single-channel dwell time histograms. Biophysical Journal. 1987;52:1047–1054. doi: 10.1016/S0006-3495(87)83298-8. [DOI] [PMC free article] [PubMed] [Google Scholar]
- Snedecor GW, Cochran WG. Statistical Methods. 8. Ames, IA, USA: Iowa State University Press; 1989. [Google Scholar]
- Swenson R, Armstrong C. K+ channels close more slowly in the presence of external K+ and Rb+ Nature. 1981;291:427–429. doi: 10.1038/291427a0. [DOI] [PubMed] [Google Scholar]
- Talvenheimo JA, Worley JFI, Nelson MT. Heterogeneity of calcium channels from a purified dihydropyridine receptor preparation. Biophysical Journal. 1987;52:891–899. doi: 10.1016/S0006-3495(87)83283-6. [DOI] [PMC free article] [PubMed] [Google Scholar]
- Tang S, Mikala G, Bahinski A, Yatani A, Varadi G, Schwartz A. Molecular localization of ion selectivity sites within the pore of a human L-type cardiac calcium channel. Journal of Biological Chemistry. 1993;268:13026–13029. [PubMed] [Google Scholar]
- Yang J, Ellinor PT, Sather WA, Zhang JF, Tsien RW. Molecular determinants of Ca2+ selectivity and ion permeation in L-type Ca2+ channels. Nature. 1993;366:158–161. doi: 10.1038/366158a0. [DOI] [PubMed] [Google Scholar]
- Zheng J, Sigworth FJ. Selectivity changes during activation of mutant Shaker potassium channels. Journal of General Physiology. 1997;110:101–117. doi: 10.1085/jgp.110.2.101. [DOI] [PMC free article] [PubMed] [Google Scholar]