

Abstract
The effect of motor unit recruitment on functional vasodilatation was investigated in hamster retractor muscle. Recruitment (i.e. peak tension) was controlled with voltage applied to the spinal accessory nerve (high = maximum tension; intermediate = ∼50% maximum; low = ∼25% maximum). Vasodilatory responses (diameter × time integral, DTI) to rhythmic contractions (1 per 2 s for 65 s) were evaluated in first, second and third orderarterioles and in feed arteries. Reciprocal changes in duty cycle (range, 2·5–25 %) effectively maintained the total active tension (tension × time integral, TTI) constant across recruitment levels.
With constant TTI and stimulation frequency (40 Hz), DTI in all vessels increased with motor unit recruitment. DTI increased from distal arterioles up through proximal feed arteries.
To determine whether the effect of recruitment on DTI was due to increased peak tension, the latter was controlled with stimulation frequency (15, 20 and 40 Hz) during maximum (high) recruitment. With constant TTI, DTI then decreased as peak tension increased.
To explore the interaction between recruitment and duty cycle on DTI, each recruitment level was applied at 2.5, 10 and 20 % duty cycle (at 40 Hz). For a given increase in TTI, recruitment had a greater effect on DTI than did duty cycle.
Functional vasodilatation in response to rhythmic contractions is facilitated by motor unit recruitment. Thus, vasodilatory responses are determined not only by the total tension produced, but also by the number of active motor units.
In exercising humans and animals, muscle blood flow increases in proportion to the intensity of contractile activity (Laughlin & Armstrong, 1982; Andersen & Saltin, 1985; Saltin et al. 1998). Increases in workload are met by increasing the frequency at which active motor units contract (i.e. rate coding) and through the recruitment of additional fibres in the motor unit pool (Milner-Brown et al. 1973; Burke, 1981; De Luca et al. 1982; Ray & Dudley, 1998). In isolated hindlimb preparations, increasing the frequency of stimulation to a constant (total) number of motor units has been shown to increase muscle blood flow in accord with the intensity of contractions (Kjellmer, 1964; Folkow & Halicka, 1968; Mackie & Terjung, 1983). In turn, when individual microvessels were observed in response to the direct activation of muscle fibres, arteriolar dilatation and capillary perfusion both increased with contraction frequency (Gorczynski et al. 1978; Marshall & Tandon, 1984; Berg et al. 1997). Motor unit recruitment has been proposed to facilitate microvascular perfusion (Fuglevand & Segal, 1997); however, there is a distinct lack of information specifically concerned with the effect of motor unit recruitment on microvascular responses to exercise.
In the present study, we investigated the effect of motor unit recruitment on functional vasodilatation. Experiments were performed using the hamster retractor muscle preparation (Nakao & Segal, 1995; Welsh & Segal, 1996), which enables microvascular responses to be evaluated concomitantly with contractile function (Welsh & Segal, 1997). Vasodilatory responses to rhythmic, isometric contractions were measured throughout the resistance network with defined amounts of tension produced per unit time (i.e. tension × time integral, TTI). The number of motor axons activated (and thereby the number of motor units recruited) was controlled by the voltage applied to the motor nerve (Burke, 1981; Mortimer, 1981). We addressed the following questions. (1) Does the number of active motor units influence functional vasodilatation at constant TTI? (2) Does functional vasodilatation at constant TTI depend on the strength of contractions? (3) Does the number of active motor units influence the relationship between TTI and functional vasodilatation?
METHODS
Animal care and preliminary surgery
All procedures were approved by the Institutional Animal Care and Use Committee of The John B. Pierce Laboratory and were performed in accordance with the Guide for the Care and Use of Laboratory Animals of the National Research Council (USA). Male golden hamsters (85–115 g, n = 31 animals; Charles River Breeding Laboratories, Kingston, NY, USA) were maintained at 24°C on a 14 h-10 h (light-dark) cycle and provided with rodent chow and water ad libitum.
Surgical procedures typically required 3–4 h and were performed using a stereo zoom microscope (model SZ-6 Plus; Cambridge Instruments, Buffalo, NY, USA). Hamsters were anaesthetised with pentobarbital sodium (60 mg kg−1i.p.) and tracheotomised with polyethylene (PE-90) tubing to ensure airway patency. Cannulae (PE-50) were secured (4–0 silk suture) in the left femoral vein to maintain body fluids and anaesthesia during experiments (10 mg ml−1 pentobarbital in isotonic saline; infused at 410 μl h−1). In 13 animals, the right carotid artery was cannulated (PE-50) to monitor pressure (CDX III transducer; Cobe, Arvada, CO, USA). Depth of anaesthesia was maintained according to blood pressure, lack of withdrawal to toe pinch and respiration rate. Oesophageal temperature was monitored (Digi-Sense; Cole Parmer, Vernon Hills, IL, USA) with a thermocouple wire and maintained at 35–38°C using conducted and radiant heat. At the end of the experimental procedures, the hamster was given an overdose of pentobarbital intravenously.
Retractor muscle preparation
Following preliminary surgery, the hamster was positioned on a custom-built transparent acrylic platform and the retractor muscle was prepared as described previously (Welsh & Segal, 1996). Briefly, an incision ∼3 cm long was made through the skin overlying the right retractor muscle. The exposed tissue was superfused continuously at ∼5 ml min−1 with a bicarbonate-buffered physiological salt solution (PSS; mM: 131.9 NaCl, 4.7 KCl, 2.0 CaCl2, 1.2 MgSO4 and 18 NaHCO3) equilibrated with 95 % N2-5 % CO2 (pH 7.4, ∼35°C). The effluent was aspirated continuously by a vacuum line. Reagents were obtained from J. T. Baker (Phillipsburg, NJ, USA) or Sigma (St Louis, MO, USA). Connective tissue covering the dorsal muscle surface was dissected away. The muscle was severed from its origin and insertion, each end was secured in a clamp, and the muscle was reflected to expose the ventral surface. For overall visibility and resolution of vasomotor responses, superficial connective tissue and fat were carefully removed from the muscle surface, from feed arteries and collecting veins, and from visible nerve branches. The hamster was then rolled onto its left side and the retractor muscle was reflected away from the body and positioned in a chamber (volume, ∼10 ml) that was integral to the acrylic platform. Throughout these procedures, great care was taken to minimise trauma to the vascular supply and nerve branches to the muscle.
The completed preparation was transferred to the stage of an intravital microscope (ACM; Zeiss, Thornwood, NY, USA). The clamps at each end of the muscle were connected to a micrometer spindle and the muscle was slowly extended to approximate in vivo resting length. The muscle chamber was continuously irrigated (∼10 ml min−1) with fresh PSS; the muscle was thereby superfused in a proximal-to-distal direction. To minimise the unstirred layer of fluid around the muscle, the PSS was delivered from above and below the proximal end of the muscle via three inlets. The effluent PSS was aspirated continuously by a vacuum line positioned to maintain a constant fluid level over the muscle and, thereby, a stable optical image.
Video microscopy and data acquisition
Feed arteries and arterioles were observed using bright-field microscopy (Zeiss ACH/APL condenser, numerical aperture (NA): 0.32) and either a Leitz UM32 (NA: 0.20) or Zeiss UD40 (NA: 0.41) objective. The optical image was coupled to a CCD video camera (C2400; Hamamatsu, Japan) and high-resolution monitor (PVM 1343 MD; Sony, Japan). Total magnification at the monitor face was either ×860 (UM32) or ×1310 (UD40).
Internal diameter (i.d.) was measured at the widest point of the vessel lumen or column of red blood cells with a video calliper calibrated against a stage micrometer (resolution: ≤ 2 μm). To record muscle tension, a transducer (LCL-1136; Omega, Stamford, CT, USA; 0–100 g, resolution: ± 0.1 g) was mounted on a load beam secured to one of the micrometer drives, and coupled to a Transbridge amplifier (TBM-4; World Precision Instruments (WPI), Sarasota, FL, USA). Upon completion of functional measurements (duration: 3–4 h), muscle length was measured with digital callipers (± 0.01 mm; Mitutoyo, Japan); the muscle was then severed from the clamps and weighed (± 0.1 mg; AE 240; Mettler, Hightstown, NJ, USA). To determine ‘specific’ tension (i.e. per area of muscle cross-section, mN mm−2), the cross-sectional area of each muscle was calculated (Welsh & Segal, 1997). All data were acquired at 100 Hz using a MacLab system (CB Sciences, Dover, NH, USA) coupled to a Macintosh IIVX computer.
Motor nerve stimulation
The spinal accessory nerve (SAN) controls the contractile activity of the retractor and spinotrapezius muscles (Priddy & Brodie, 1948; T. L. Jacobs & S. S. Segal, unpublished observations). Approximately 2 cm proximal from its first branch to the retractor muscle, the SAN was dissected underneath the spinotrapezius muscle over a length of ∼5 mm. To minimise extraneous movement during nerve stimulation, visible branches of the SAN to the spinotrapezius muscle were cut and the muscle was severed from its insertion. In our initial experiments (see below: Experiment 1, n = 6 animals) the SAN was ligated and severed proximally. The distal nerve stump was placed in a cuff electrode prepared from two platinum-iridium wires (90 % Pt-10 % Ir; diameter, 0.25 mm; Omega, Stamford, CT, USA) looped at the end and placed ∼3 mm apart within Silastic tubing (length, 5 mm; i.d., 1.5 mm). The cuff was positioned ∼1 mm above the fluid level in the muscle chamber.
In the remainder of these studies (Experiment 1, n = 5 animals; Experiments 2 and 3), the SAN was kept intact following dissection and isolation from the spinotrapezius muscle. The stimulating electrode comprised two multistranded 90 % Pt-10 % Ir wires (diameter, 0.15 mm; 10Ir9/49T; Medwire-Sigmund Cohn, Mt Vernon, NY, USA) positioned 1–2 mm apart. Each wire was looped at the end, positioned around the dissected nerve segment, and the leads were sutured to adjacent tissue (Warren et al. 1998). A silicone sealant (Kwik-Cast; WPI) secured the loops around the nerve to complete the cuff electrode.
For nerve stimulation, electrode leads were connected to a stimulus isolation unit (SIU-5; Grass Instruments, West Warwick, RI, USA), driven by a square-wave stimulator (S48; Grass), with the cathode directed towards the muscle (Mortimer, 1981). For all experiments, pulse duration was 0.1 ms.
Experimental protocols
General procedures
The preparation was equilibrated for ∼60 min on the stage of the intravital microscope. During this period, maximum stimulation voltage was determined by evaluating tension production to a pair of stimuli delivered 25 ms apart while increasing the voltage applied to the SAN. The maximum voltage (∼10 V) was then applied to determine optimal muscle length (Lo) for producing tension (Welsh & Segal, 1996). All further manoeuvres were done at Lo.
Feed arteries (FA), which control total blood flow into the muscle, were studied along with first (1A), second (2A) and third order (3A) arterioles, which govern the distribution and magnitude of blood flow within the muscle. One to three vessels were studied per preparation; each vessel was treated as a separate experiment. The order in which a particular vessel category was studied was varied between preparations. In all cases where vasodilatory responses to skeletal muscle activity were determined, vessel diameter was measured before, during and after 65 s of rhythmic, isometric contractions, with one contraction evoked every 2 s. Because tissue movement precluded diameter measurements during muscle contractions, vessel diameter was measured between contractions until the end of the stimulation period and then continuously until recovery to baseline. Between stimulation periods, vessels were allowed to recover for at least 5 min to restore resting (baseline) vasomotor tone.
Quantification of tension production and vasodilatation
The vasodilatory response was characterised by calculating the entire diameter × time integral above baseline (DTI). This measure reflects the sum of DTI during stimulation and that during complete recovery to baseline (Fig. 1). The peak diameter at the end of the stimulation period was determined, as was the latency of vasodilatation onset from the start of contractions. As an index of the total active tension developed by the muscle, the tension × time integral (TTI) above resting baseline (i.e. above resting tension at Lo) was calculated for each contraction and then summed for all contractions during the period of activity (Fig. 1). The peak tension was calculated for each contraction, and averaged for all contractions during a stimulation period (Fig. 1). At the end of the experimental procedures, maximum vessel diameter was determined by adding sodium nitroprusside (SNP, 10 μM; Sigma) to the PSS superfusing the retractor preparation.
Figure 1. Quantification of tension production and vasodilatory response.
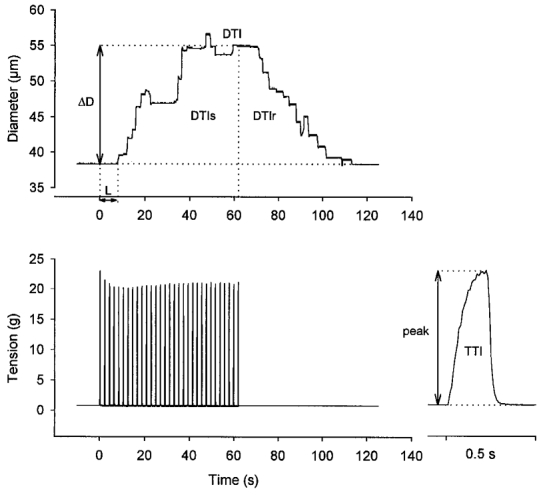
Diameter (upper panel, representative 1A) and tension (lower panel; right inset shows first contraction on an expanded time scale) before, during and after 65 s of muscle contractions (1 contraction per 2 s at 40 Hz; train duration = 200 ms). Contractions started at time = 0. After a brief latency (L), diameter increased and reached a steady-state increase (ΔD, taken as the difference between resting and peak diameter) after ≈40 s. Upon cessation of contractions, diameter recovered to baseline. The magnitude of the dilatory response is characterised by calculating the total diameter × time integral (DTI) above baseline, and is the sum of the integral during the stimulation period (DTIs) and that during the recovery period (DTIr). Total tension production by the muscle is indicated by the tension × time integral (TTI), summed for all individual contractions during the 65 s period of rhythmic contractions. The inset shows TTI determination for the first contraction. Peak tension (peak) is taken as the difference between maximum and resting tension.
Control experiments
The viability of the preparation over the course of each experiment was evaluated by assessing vasomotor tone, arterial blood pressure, and maximal active tension (a single 200 ms train of 10 V at 100 Hz to the SAN) at the beginning and end of the experimental protocol.
We tested whether stimulation of the SAN activated autonomic (e.g. sympathetic) nerves in addition to motor axons. For these experiments, arteriolar diameters were measured in response to SAN stimulation (10 V, 40 Hz, 200 ms train duration) during blockade of nicotinic ((+)-tubocurarine chloride, 30 μM; Aldrich, Milwaukee, WI, USA) and muscarinic (atropine sulfate, 1 μM; Sigma) receptors (Welsh & Segal, 1997). Respective antagonists were added to the superfusion solution and equilibrated for 10–15 min before testing for their effects. (Note: 40 Hz stimulation evokes ∼60 % of maximal tetanic tension (at ≥ 100 Hz) in the retractor muscle; Welsh & Segal, 1997; J. W. G. E. VanTeeffelen & S. S. Segal, data not shown.)
To determine whether isolation of the SAN may have damaged neuromuscular transmission, the peak tension developed in a single 200 ms train at 40 Hz through stimulation of the SAN (10 V) was compared with that evoked by depolarisation of neuromuscular junctions in an electrical field (Welsh & Segal, 1997). For field stimulation, platinum electrodes (50 mm × 3 mm × 0.2 mm) were positioned along either side of the muscle and connected to the stimulus isolation unit; 140 V (∼120 mA) evoked maximum tension.
Experiment 1: does functional vasodilatation to constant TTI depend on the number of active motor units?
With integrated tension held constant, we tested the hypothesis that the magnitude of vasodilatation would reflect the number of active motor units. Thus, vasomotor responses were evaluated at three levels of motor unit recruitment: ‘high’ (H), ‘intermediate’ (I) and ‘low’ (L). For each experiment, recruitment levels were defined empirically with stimulation at 40 Hz by controlling the voltage applied to the SAN while monitoring tension developed by the retractor muscle. Across preparations, maximum tension (reflecting activation of all motor units; H) was evoked by stimulating with 7.9 ± 1.9 V. For I (2.4 ± 0.5 V) and L (1.6 ± 0.3 V), peak tensions were ∼50 and ∼25 % of maximum, respectively. Recruitment levels were studied in random order across experiments.
The total tension produced during the 65 s period of muscle contractions was held constant across H, I and L recruitment. This was accomplished by reciprocally changing the duration of stimulation, i.e. the duty cycle ((work interval/total interval) × 100), with stimulation voltage. Thus, duty cycles of ∼5, 10 and 20 % were used with H, I and L, respectively. Due to an ∼25 % loss in maximal active tension during a typical experiment (see Results), particularly when more than one vessel was studied within a preparation, the duty cycle was adjusted slightly at each recruitment level to maintain constant TTI (Table 1).
Table 1.
Summary of experimental protocols
| Experiment no. | Test | Vessel category | Stimulation periods per vessel | Recruitment level | Stimulation frequency (Hz) | Duty cycle (%) |
|---|---|---|---|---|---|---|
| 1 (11 animals) | Effect of muscle fibre recruitment on vasodilatation at constant TTI | FA (7), 1A (6) | 3 | H | 40 | 2.5–5–7.5 |
| 2A (7), 3A (6) | I | 40 | 10–15 | |||
| L | 40 | 20–25 | ||||
| 2 (10 animals) | Effect of contraction intensity on vasodilatation at constant TTI | FA (6), 1A (6) | 4 | H | 40 | 2.5–3.75 |
| 2A (6), 3A (6) | H | 20 | 10–15 | |||
| H | 15 | 20–25 | ||||
| L | 40 | 20–25 | ||||
| 3 (10 animals) | Effect of muscle fibre recruitment on vasodilatation across range of TTI | 1A (7), 3A (8) | 9 | H | 40 | 2.5, 10, 20 |
| I | 40 | 2.5, 10, 20 | ||||
| L | 40 | 2.5, 10, 20 |
TTI, tension × time integral; FA, feed arteries; 1A, 2A, 3A: first, second and third order arterioles, respectively. H, high; I, intermediate; L, low. In Experiments 1 and 2, a constant TTI was maintained for each level of recruitment or stimulation frequency by manipulating the duty cycle. When studying multiple vessels in a preparation, the duty cycle was adjusted because of muscle fatigue during the course of an experiment. The range of duty cycles used in Experiments 1 and 2 is given in the right column. For Experiment 3 duty cycles were constant for each vessel studied, i.e. 2.5, 10 and 20%. In the third column (Vessel category), the number in parentheses is the number of vessels studied.
Experiment 2: does the magnitude of functional vasodilatation to constant TTI depend on the strength of muscle contraction?
In Experiment 1, both peak tension and the duration of each contraction varied between recruitment levels. To test the effect of contractile strength per se on vasodilatation, all muscle fibres were activated (H) and the strength of contraction was controlled by changing the stimulation frequency. Duty cycle was changed reciprocally to maintain TTI across stimulation frequencies. Thus, the SAN was stimulated using ∼20 % at 15 Hz, 10 % at 20 Hz and 2.5 % at 40 Hz (Table 1). These stimulus frequencies evoke ∼15, 25 and 60 % of maximal tetanic tension, respectively (Welsh & Segal, 1997). As a reference for Experiment 1, the same TTI was elicited with L to activate fewer active motor units (∼20 % duty cycle at 40 Hz). Across and within preparations, the four stimulation protocols were applied in random order.
Experiment 3: how does the relationship between TTI and DTI change with active motor unit number?
Only one TTI was considered in Experiments 1 and 2. Therefore, we questioned whether motor unit recruitment could influence functional vasodilatation through a range of TTI. In distal (3A) and proximal (1A) vessels, the vasodilatory response to rhythmic contractions was studied at H, I and L recruitment, each with duty cycles of 2.5, 10 and 20 %. The order in which recruitment levels and duty cycles were studied was randomised across and within experiments.
The three experimental protocols and number of vessels studied in each category are summarised in Table 1.
Data presentation and analysis
Summary data are reported as means ± s.e.m. Data were analysed (SigmaStat, version 2.03; SPSS, Chicago, IL, USA) with respect to vessel classification and recruitment level (Experiment 1) or stimulation frequency (Experiment 2) using one- and two-way repeated-measures analyses of variance (RMANOVA). In Experiment 2, differences between H and L stimulation at 40 Hz were tested with Student's paired t test. For Experiment 3, data were analysed with respect to duty cycle and stimulus voltage (i.e. recruitment level) using two-way RMANOVA. When significant F ratios were obtained, post hoc comparisons were performed using Tukey's test. Results were considered statistically significant with P ≤ 0.05.
RESULTS
Control experiments
Hamster retractor muscle preparations remained stable throughout each day's experiments as demonstrated by the consistent post-contraction recovery of resting tone in all vessel categories (data not shown), and by the stability of mean arterial pressure from the beginning to the end of the experiment (103 ± 5 vs. 98 ± 4 mmHg; n = 13 animals). Maximal tetanic tension (at 100 Hz for 200 ms) decreased from 137 ± 7 mN mm−2 at the beginning to 103 ± 6 mN mm−2 at the end of an experiment (P < 0.05, Student's paired t test; n = 15 animals). Nevertheless, through continuous monitoring of active tension and slight adjustments in duty cycle (Table 1), TTI was not significantly different when up to three vessels were studied (sequentially) in a given retractor preparation (data not shown). Further, the DTI to a particular stimulus condition was not different between vessels in each category that were studied initially, midway or last in a preparation (data not shown).
During stimulation of the intact SAN, arterial pressure changed by < 2 mmHg (n = 13 animals). During blockade of cholinergic receptors, resting tone was maintained and muscles no longer contracted during SAN stimulation (n = 5 animals). Thus, muscle fibres were activated through neuromuscular junctions without activating autonomic nerves.
Developed tensions evoked by SAN stimulation (40 Hz for 200 ms) were not significantly different from those evoked with field electrodes (69 ± 4 vs. 73 ± 4 mN mm−2, respectively; n = 16 animals), indicating that isolation and stimulation of the motor nerve did not result in appreciable damage to the neuromuscular apparatus.
Experiment 1: vasodilatation to constant TTI increases with the number of active motor units
As peak tension increased with recruitment level, the total tension produced per contraction (TTI) was held constant by decreasing the duty cycle. Neither developed tension nor vasodilatory responses were different between experiments in which the SAN was cut and those in which it was left intact; therefore, these data were pooled. Representative responses for a 1A (Fig. 2) illustrate that the magnitude of vasodilatation increased (and latency decreased) with motor unit recruitment; in this example, the diameter increased by 6 μm at L, 16 μm at I and 25 μm at H. The diameter consistently returned to baseline following the cessation of contractile activity and post-contraction vasodilatation was prolonged when more fibres were recruited.
Figure 2. Representative effect of motor unit recruitment on vasodilatation in a 1A.
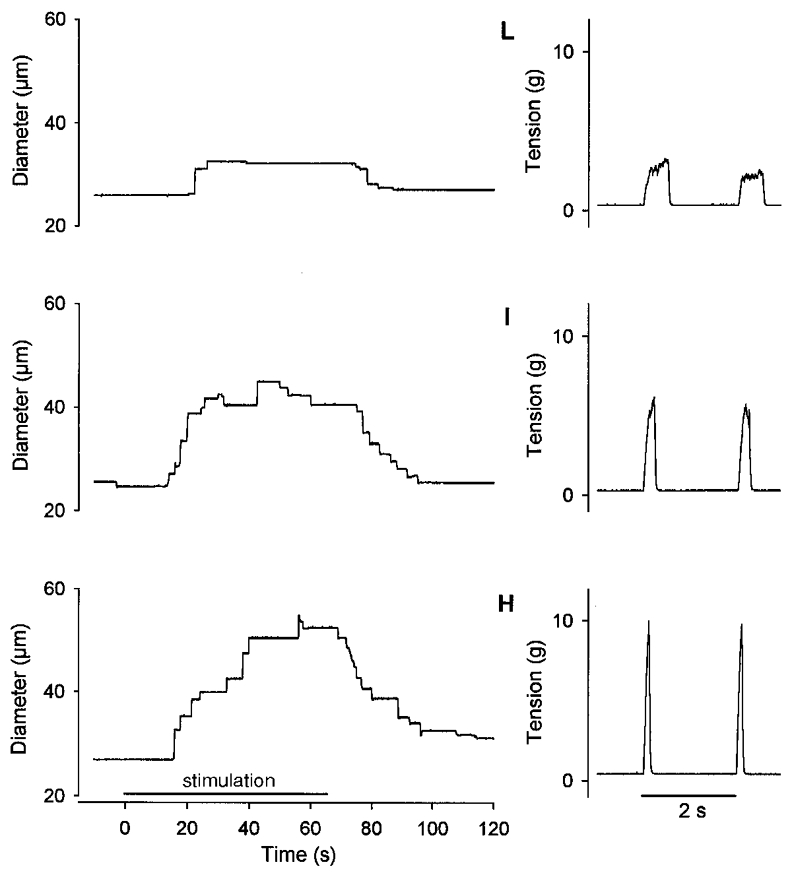
Left panels, diameter responses during stimulation (65 s) of the SAN to evoke 1 contraction per 2 s at low (L), intermediate (I) and high (H) levels of motor unit recruitment (see Methods). Right panels, corresponding tension records of two successive tetanic contractions. Vasodilatation increased with motor unit recruitment from low to high. Despite differences in peak tension, TTI was constant across recruitment levels. Maximum diameter was 62 μm.
Mean diameter changes in arterioles and feed arteries in response to rhythmic contractions are shown in Fig. 3. For each vessel category, the diameter increase at the end of the activity period was smallest at L and increased (P < 0.05) with peak tension production (i.e. motor unit recruitment). The peak change in diameter increased with vessel size (see legend to Fig. 3) across recruitment levels (P < 0.001). For example, at H the diameter increase was 6 ± 1 μm in 3A, 9 ± 1 μm in 2A, 12 ± 3 μm in 1A and 16 ± 2 μm in FA. Across vessel categories, the latency of vasodilatation decreased as the recruitment level increased (L: 20.3 ± 0.7 s; I: 18.8 ± 0.7 s; H: 17.8 ± 0.7 s; P < 0.05). Across stimulation levels, there was a tendency (P = 0.062) for latency to increase with vessel size (3A: 16.6 ± 1.1 s; 2A: 17.6 ± 0.9 s; 1A: 19.8 ± 0.7 s; FA: 21.9 ± 1.3 s).
Figure 3. Mean diameter changes in arterioles and feed arteries for Experiment 1.
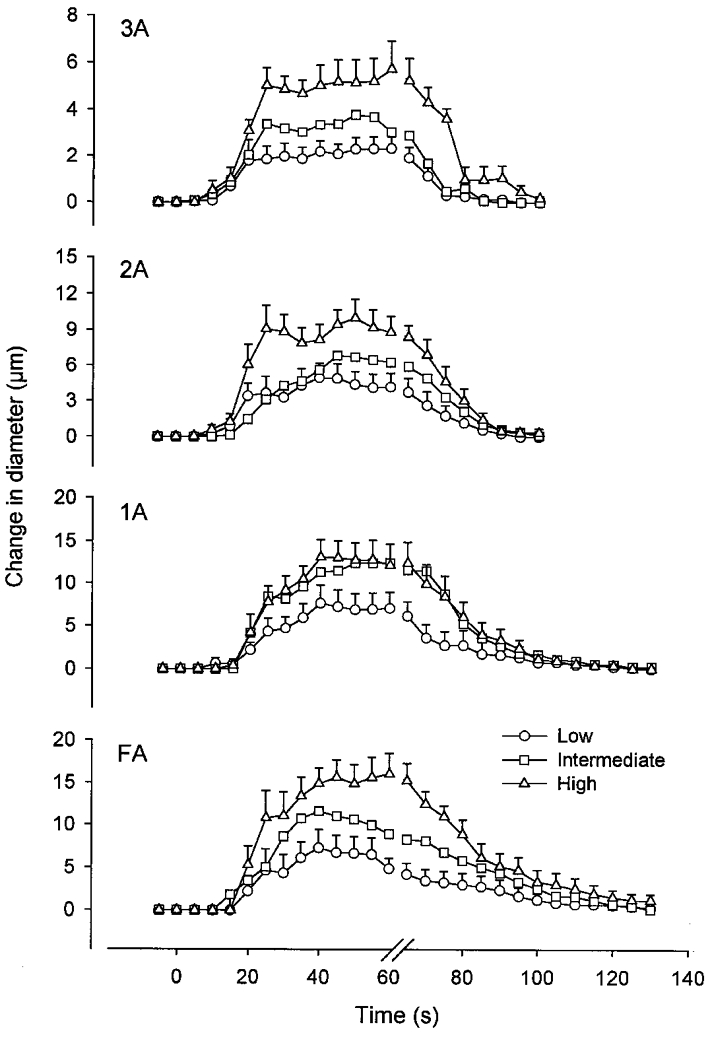
Vessel diameters were measured between each contraction and continuously during recovery; for clarity, only consecutive 5 s data points are shown. Stimulation began at time = 0 and ended at time = 65 s. Data represent means ± s.e.m.; s.e.m. for intermediate data points were similar and are not shown for clarity. Low, Intermediate and High refer to motor unit recruitment levels as defined in Methods. For all vessel categories studied, the vasodilatory response increased with recruitment. Baseline diameters were: 51 ± 3 μm (FA), 28 ± 2 μm (1A), 23 ± 2 μm (2A) and 11 ± 1 μm (3A). Maximum diameters with 10 μM SNP were: 99 ± 5 μm (FA), 66 ± 3 μm (1A), 56 ± 6 μm (2A) and 23 ± 2 μm (3A). The number of vessels studied in each category is given in Table 1.
Summary data for Experiment 1 are shown in Fig. 4. Peak tension increased consistently with recruitment level (Fig. 4C; P < 0.001) and was not different across vessel categories. In spite of differences in peak tension with recruitment level, TTI did not differ between recruitment levels or between vessel categories (Fig. 4B). Thus, the TTI for each recruitment level was maintained successfully by controlling duty cycle. Across vessel categories, recruitment had a significant effect on total DTI (Fig. 4A; P < 0.001), such that the magnitude of vasodilatation increased with the number of active motor units. This effect of motor unit recruitment on DTI was manifest both during stimulation (DTIs) and during the post-contraction period of recovery (DTIr; Fig. 4A). Across recruitment levels, the total DTI increased with vessel size, from 3A to FA (Fig. 4A; P < 0.001).
Figure 4. Vasodilatation is directly related to the level of motor unit recruitment.
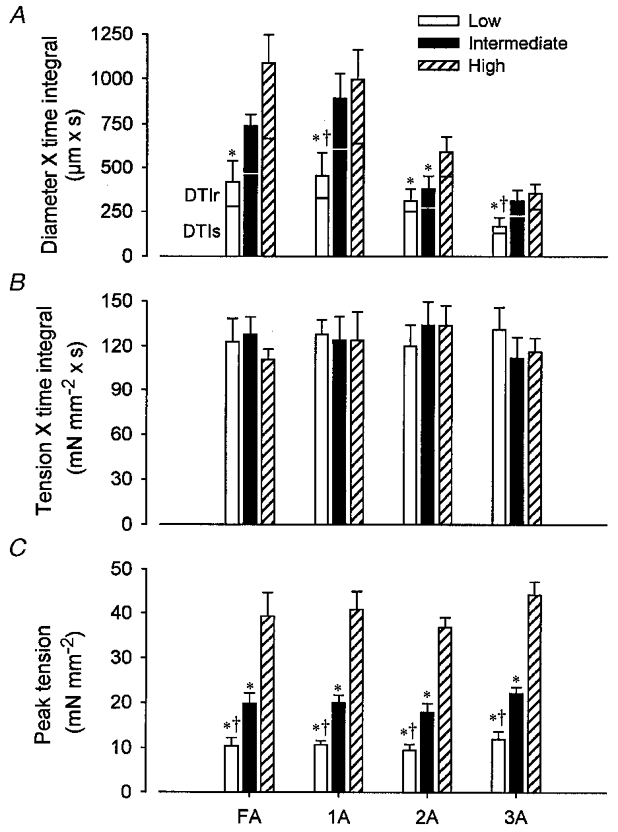
A, total diameter × time integral (DTI), summed for the response during stimulation (DTIs) and that during recovery (DTIr). B, tension × time integral (TTI). C, peak tension (see Fig. 1). Low, Intermediate and High refer to recruitment levels as defined in Methods. Peak tension increased with recruitment level. Whereas TTI was not different between conditions or vessel categories, DTI increased with recruitment for each vessel category. Vessel diameters are given in the legend to Fig. 3; the corresponding number of vessels studied is given in Table 1. *P < 0.05vs. High; †P < 0.05vs. Intermediate.
Across vessel categories, the relative contribution of vasodilatation during stimulation to the total vasodilatory response decreased as recruitment increased: DTIs/DTI was 0.76 ± 0.03 for L, 0.71 ± 0.03 for I and 0.70 ± 0.02 for H (P < 0.05). Further, DTIs/DTI decreased as vessel size increased (3A: 0.78 ± 0.04; 2A: 0.79 ± 0.04; 1A: 0.70 ± 0.04; FA: 0.64 ± 0.04; P < 0.05), illustrating that a greater portion of the total vasodilatory response occurred during the stimulation period in the smaller (distal) vessels when compared with larger (proximal) vessels.
Experiment 2: vasodilatation to constant TTI does not reflect the strength of contraction
With H (i.e. all motor units active), peak tension at 40 Hz was nearly 3-fold greater than that at either 15 or 20 Hz (Fig. 5C; P < 0.001) due to tetani being unfused at the lower stimulus frequencies (Fig. 5D). Despite these differences in peak tension, TTI did not differ between stimulation protocols or vessel categories (Fig. 5B). Across vessel categories, DTI decreased (Fig. 5A; P < 0.001) and latency increased (P < 0.01) as frequency increased (15 Hz: 11.4 ± 1.3 s; 20 Hz: 12.3 ± 1.4 s; 40 Hz: 14.3 ± 1.4 s). With each vessel category considered individually, the effect of stimulus frequency on DTI was significant only in 1A and 2A (Fig. 5A), and on latency only in 2A (data not shown). As DTI had no relationship to peak tension (Fig. 5), these findings (with all motor units recruited at each stimulus frequency) argue against contractile strength per se as the primary determinant of the vasodilatory response.
Figure 5. Vasodilatation is related inversely to peak tetanic tension with all motor units recruited.
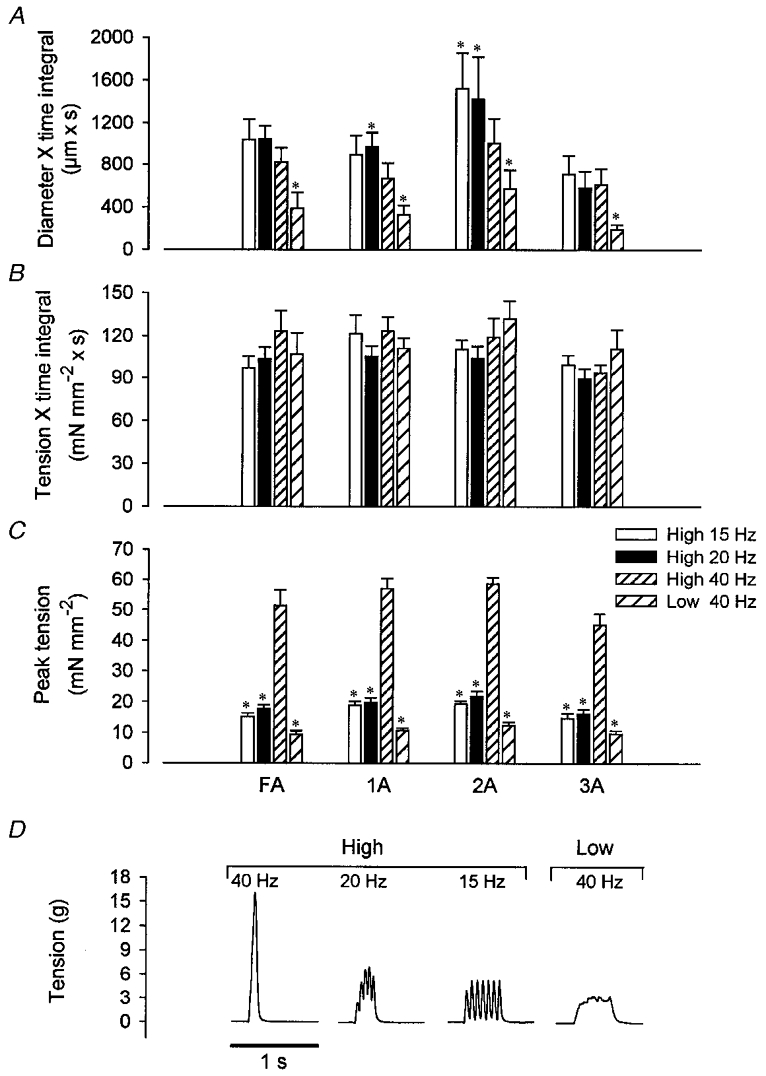
A, total diameter × time integral (DTI). B, tension × time integral (TTI). C, peak tension. D, representative tension traces of individual contractions. Peak tension with all motor units active (High) decreased with stimulation frequency, and decreased further at 40 Hz with Low. TTI was not different between conditions. With High, DTI increased as frequency decreased in 1A and 2A, yet was not different between frequencies in FA and 3A. In contrast, DTI in all vessels was significantly decreased at 40 Hz Low compared with 40 Hz High, despite the same TTI. The number of vessels in each category is given in Table 1. *P < 0.05vs. High 40 Hz.
Peak tension was less during L (at 40 Hz) than that during H at any frequency (Fig. 5C). With fewer motor units producing the same TTI during L, DTI was reduced significantly in all vessels compared with responses to H (Fig. 5A). These findings further illustrate that the magnitude of functional vasodilatation at constant TTI reflected the number of active motor units.
Experiment 3: relationships between TTI and DTI depend on the number of active motor units
Response curves for the relationships between TTI and DTI in 1A and 3A were constructed by stimulation at three duty cycles (2.5, 10 and 20 %) for each level of motor unit recruitment (Fig. 6). Both TTI and DTI increased with recruitment (P < 0.001) and with duty cycle (P < 0.001). There was a significant interaction between variables, indicating that the effect of recruitment on TTI and DTI depended upon duty cycle: the absolute increases in TTI and DTI due to motor unit recruitment were smallest at 2.5 % and increased at 10 and 20 % (Fig. 6).
Figure 6. Effects of motor unit recruitment and duty cycle on relationships between tension × time integral and diameter × time integral.
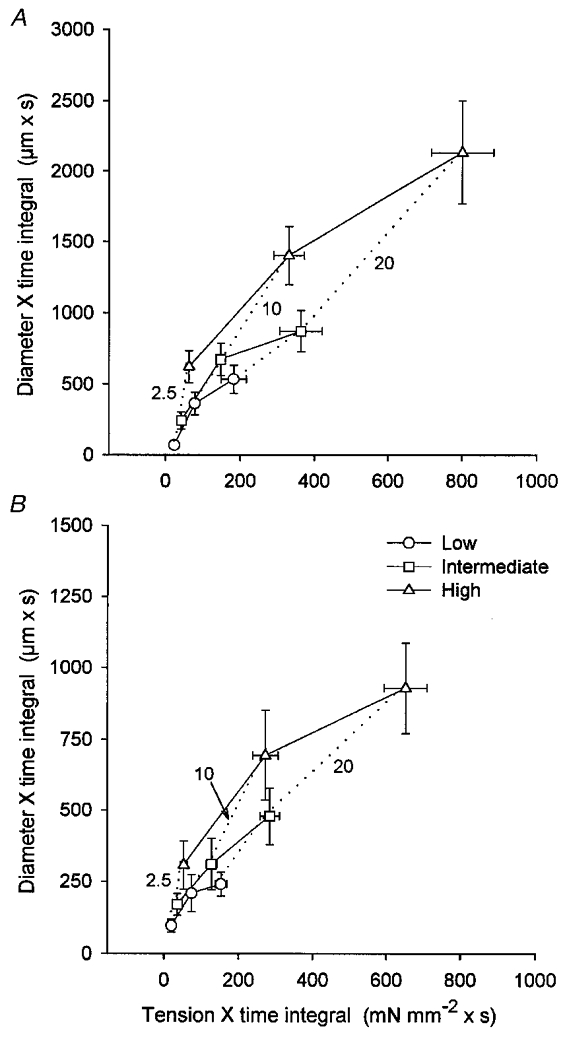
A, 1A; B, 3A. Continuous lines depict relationships for constant level of recruitment (Low, Intermediate and High) with increasing duty cycle; dotted lines depict relationships for constant duty cycle (2.5, 10 and 20 %) with increasing recruitment. Corresponding values for peak tension (mN mm−2) were: L: 11 ± 1 (2.5 %), 15 ± 1 (10 %), 15 ± 1 (20 %); I: 20 ± 2 (2.5 %), 26 ± 2 (10 %), 28 ± 2 (20 %); H: 34 ± 3 (2.5 %), 56 ± 5 (10 %), 61 ± 4 (20 %). The relative increase in DTI with TTI was greater when motor unit recruitment was increased within each duty cycle compared with when duty cycle was increased within each level of recruitment.
In both 1A and 3A, the effect of increasing recruitment at each duty cycle (dotted lines) differed from the effect of increasing duty cycle at each level of recruitment (continuous lines) with respect to the relationship between TTI and DTI. Thus, the relative increase in DTI with TTI was greater when recruitment was increased at each duty cycle, compared with when duty cycle was increased at each level of recruitment. This effect of motor unit recruitment on the vasodilatory response decreased as duty cycle increased. When averaged across recruitment levels for each duty cycle, DTI/TTI (expressed as: 106 μm3 mN−1) was highest at 2.5 % and decreased with duty cycle: 1A: 2.5 % = 6.9 ± 2.1, 10 % = 5.1 ± 1.2, 20 % = 3.3 ± 0.8; P = 0.052; 3A: 2.5 % = 5.3 ± 1.3, 10 % = 2.7 ± 0.8, 20 % = 1.6 ± 0.3; P < 0.001.
DISCUSSION
The present study is the first to specifically address the effect of motor unit recruitment on functional vasodilatation in the resistance network of skeletal muscle. With the amount of tension produced during the period of activity held constant by controlling recruitment level and duty cycle, vasodilatation to rhythmic, isometric contractions depended upon the number of motor units activated. Thus, as motor unit recruitment (and peak tension) increased, the dilatation of arterioles and feed arteries began sooner and increased in magnitude. In contrast, when all motor units were recruited and peak tension was determined by stimulation frequency, vasodilatory responses related inversely to peak tension. These findings uniquely demonstrate that the integrated vasodilatory response to rhythmic muscle contractions is determined not only by the (peak) active tension, but also by the number of motor units involved in producing the tension. In such manner, motor unit recruitment per se promotes vasodilatation throughout the resistance network.
Motor unit recruitment and microvascular perfusion
Measurements of total (Kjellmer, 1964; Folkow & Halicka, 1968; Andersen & Saltin, 1985) and regional (Laughlin & Armstrong, 1982; Mackie & Terjung, 1983) muscle blood flow are central to our understanding of aerobic performance. Nevertheless, it is difficult to resolve the response characteristics of the vascular elements of blood flow control without directly observing the microcirculation. Previously, through direct activation of single muscle fibres, bundles of fibres, or all fibres in cremaster and spinotrapezius muscles, arteriolar dilatation and capillary perfusion were found to increase with the frequency of contractions (Gorczynski et al. 1978; Marshall & Tandon, 1984; Berg et al. 1997). However, the tension produced by muscle fibres was not determined in these studies, and the direct activation of muscle fibres differs from the physiological recruitment of motor units. To overcome previous limitations, we activated motor units of the parallel-fibred retractor muscle by stimulating its motor nerve while recording tension production and observing specific vessels throughout the resistance network.
The functional unit of tension production in skeletal muscle is the motor unit (Burke, 1981). The fibres that comprise a motor unit are dispersed within a muscle and intermingle with fibres belonging to many other motor units (Burke & Tsairis, 1973). In turn, the smallest unit for controlling capillary perfusion to muscle fibres is the microvascular unit (MVU). On average, each MVU consists of a terminal arteriole that gives rise to a group of capillaries that supply adjacent segments of twenty to thirty muscle fibres within a discrete volume (< 1 mm3) of tissue (Delashaw & Duling, 1988; Emerson & Segal, 1997). Because of the dispersed nature of motor unit organisation, each fibre within an MVU may be derived from a different motor unit (Fuglevand & Segal, 1997). Collectively, this organisation implies that the effect of motor unit recruitment on the microvasculature will also be dispersed throughout the muscle, such that recruitment of a single motor unit will result in the perfusion of the many MVUs that supply the individual muscle fibres throughout the motor unit (Emerson & Segal, 1997; Fuglevand & Segal, 1997).
Contractile activity, metabolic demand and vasodilatation
Vasodilatation began sooner and DTI was enhanced when more motor units were activated. Moreover, these effects of motor unit recruitment on vasodilatation were manifested throughout the resistance network. The metabolic theory of blood flow control (Haddy & Scott, 1975; Sparks, 1980) states that skeletal muscle fibres govern their blood supply according to their metabolic demands by releasing substances that relax smooth muscle cells of arterioles in the vicinity of activity (Gorczynski et al. 1978). Thus, the dependency of functional vasodilatation on active fibre number shown here may well reflect the number of vasoactive ‘inputs’ to the resistance vasculature.
Vasoactive signals are conducted from cell to cell along the wall of arterioles and feed arteries of skeletal muscle (Segal, 1991; Segal et al. 1999). Through this signalling mechanism, vasoactive stimuli can be summed and integrated within the resistance vasculature, such that coincident stimulation of daughter branches produces additive responses in the parent vessel (Segal et al. 1989; Song & Tyml, 1993). This intrinsic property of the vascular network implies that, with motor unit recruitment, an increase in the number of sites releasing vasoactive stimuli will progressively promote the dilatation of arterioles embedded within the muscle fibres. As vasodilatory responses are integrated in proximal branches, feed arteries dilate progressively (Welsh & Segal, 1997), i.e. vasodilatation ‘ascends’ the resistance network as metabolic demand increases. The present data therefore demonstrate that motor unit recruitment not only promotes MVU perfusion (Fuglevand & Segal, 1997), but also governs the magnitude of vasodilatation throughout the resistance network during rhythmic contractile activity.
The retractor muscle is composed of 70 % fast-glycolytic, 16 % fast-oxidative-glycolytic and 14 % slow-oxidative fibres (Sullivan & Pittman, 1984). As the threshold for extracellular stimulation differs between motor unit types because of differences in axonal size (Mortimer, 1981), it may be argued that submaximal stimulation of the motor nerve (e.g. L and I conditions) resulted in the selective activation of fast motor units. Hence, the dependency of vasodilatation on stimulation voltage may have been caused by differences in the metabolic properties of ‘white’ vs. ‘red’ muscle fibres (Folkow & Halicka, 1968). However, motor axons do not appear to be regionally organised within the SAN (G. Gonzalez-Lomas & S. S. Segal, unpublished observations). Because a cuff electrode will activate motor axons in a centripetal manner (in accord with current density), all motor unit types were likely to have been recruited at the voltages applied.
Oxygen consumption has been shown to correlate with the TTI of single, prolonged (> 1 s) isometric tetanic contractions (Stainsby & Fales, 1973; Kushmerick & Paul, 1976). The energy cost for initiating and recovering from a contraction is higher than that for holding steady tension, resulting in a decrease in energy cost per stimulus when the duration of isometric contractions is prolonged (Stainsby & Fales, 1973; Hogan et al. 1998). To date, this effect of contraction duration on energy cost has been determined only for a constant number of active motor units (see e.g. Hogan et al. 1998). For the present study, the TTI for each 65 s period of activity was taken as the index of metabolic demand of the retractor muscle. In Experiment 1, all motor units were activated for a brief interval during H, such that the tension generated during each contraction did not plateau (Fig. 2). In contrast, during L and I, progressively fewer fibres were activated for correspondingly longer duty cycles, and tension plateaued in both conditions. How these respective conditions relate to the actual energetic cost (or oxygen consumption) for the retractor muscle was not determined. Nevertheless, because the retractor muscle constitutes only a small percentage of the total muscle mass of the hamster, blood flow to the muscle was not a limiting factor in our experiments. Thus, the intrinsic properties of the interaction between motor unit recruitment and vasomotor response characteristics throughout the resistance network have been revealed here for the first time.
From classic studies of the canine gastrocnemius muscle (Anrep & Von Saalfeld, 1935; Gray & Staub, 1967), it is hypothesised that mechanical squeezing and emptying of vessels increases with peak tension and is sustained for the duration of contraction, with resumption of flow between contractions and upon the cessation of contractile activity. In our studies, once steady-state vasodilatation was attained (Figs 2 and 3), we did not observe vessels to be ‘filling’ (i.e. the diameter remained stable) through the nearly 2 s intervals between contractions, nor did vessels dilate further upon cessation of contractile activity. It will be recognised that, in contrast to the complex 3-dimensional organisation of the gastrocnemious muscle, the retractor muscle is organised into a thin strap (Priddy & Brodie, 1948). We therefore suggest that mechanical impairment of blood flow documented in complex, 3-dimensional muscles need not apply to the retractor muscle, particularly with the muscle exteriorised and maintained at constant length. Further, because peak tension at our longest duty cycle was ≤ 15 % of maximal tetanic tension (see Methods), the effect of contraction duration on mechanical impairment of blood flow is likely to have been minimal.
The intensity of contraction was also varied in Experiment 2. However, the number of active motor units was constant, making extrapolation of TTI to metabolic energy cost less ambiguous. Analogous to Experiment 1, duty cycle varied inversely with stimulation frequency. The individual twitches shown in Fig. 5D illustrate that tetani were fused at 40 Hz, yet were unfused at both 20 and 15 Hz. In the canine gastrocnemius-plantaris muscle preparation, the oxygen uptake per impulse was higher for twitches than for tetani (Stainsby, 1970; Stainsby & Fales, 1973); this behaviour was attributed to the ‘extra’ energy cost related to activation and relaxation. Since motor units were continuously activated and deactivated during each duty cycle at 20 and 15 Hz, an increased energy cost may well explain the greater DTI at these lower stimulation frequencies when compared with responses at 40 Hz in the presence of constant TTI.
Implications for the control of muscle blood flow during exercise
During exercise, increases in workload are evoked by increasing the output of active motor units (rate coding), and by the recruitment of additional motor units (Milner-Brown et al. 1973; Burke, 1981; De Luca et al. 1982; Ray & Dudley, 1998). In Experiment 3, the interaction between both mechanisms on functional vasodilatation was investigated. Within each level of recruitment, vasodilatation (DTI) increased with duty cycle (Fig. 6; continuous lines). This finding is consistent with previous observations across a variety of preparations: with a constant number of active muscle fibres, blood flow, vasodilatation, and capillary red blood cell flux increased with the frequency of contractions (Kjellmer, 1964; Folkow & Halicka, 1968; Gorczynski et al. 1978; Mackie & Terjung, 1983; Marshall & Tandon, 1984; Berg et al. 1997).
The present findings further illustrate that, for each duty cycle, vasodilatation increased in direct proportion to motor unit recruitment (Fig. 6, dotted lines). This behaviour is consistent with observations in rats performing treadmill running, where blood flow distributed to locomotory muscles according to their level of recruitment (Laughlin & Armstrong, 1982). In humans performing rhythmic knee extensions, femoral arterial blood flow increased linearly with workload (Andersen & Saltin, 1985; Saltin et al. 1998). Magnetic resonance imaging has indicated that increased power output during knee extensions is achieved primarily through motor unit recruitment (Ray & Dudley, 1998). We propose, therefore, that the increase in femoral blood flow with workload in human studies illustrates the facilitating effect of motor unit recruitment on muscle perfusion. Further, Fig. 6 illustrates that it is not the workload per se that determines the vasodilatory response to contractile activity, but that the number of active motor units is a key determinant of vasodilatation throughout the resistance network. As demonstrated by the differences in slopes between the continuous and dotted lines for both distal and proximal vessels, motor unit recruitment promoted the vasodilatory response to increasing TTI relatively more than duty cycle, particularly at the lowest duty cycle. These findings imply that an increase in muscle performance accomplished through motor unit recruitment evokes relatively greater vasodilatation than does an increase in the output of previously active motor units. We conclude that motor unit recruitment in and of itself promotes muscle blood flow.
Acknowledgments
Andrew J. Fuglevand provided a critical review of this manuscript. Technical Services of The John B. Pierce Laboratory provided outstanding support in the design of experimental apparatus. This research was supported by the United States National Institutes of Health (Heart, Lung and Blood Institute) grants RO1-HL-56786 and RO1-HL-41026.
References
- Andersen P, Saltin B. Maximal perfusion of skeletal muscle in man. The Journal of Physiology. 1985;366:233–249. doi: 10.1113/jphysiol.1985.sp015794. [DOI] [PMC free article] [PubMed] [Google Scholar]
- Anrep GV, Von Saalfeld E. The blood flow through the skeletal muscle in relation to its contraction. The Journal of Physiology. 1935;85:375–399. doi: 10.1113/jphysiol.1935.sp003326. [DOI] [PMC free article] [PubMed] [Google Scholar]
- Berg BR, Cohen KD, Sarelius IH. Direct coupling between blood flow and metabolism at the capillary level in striated muscle. American Journal of Physiology. 1997;272:H2693–2700. doi: 10.1152/ajpheart.1997.272.6.H2693. [DOI] [PubMed] [Google Scholar]
- Burke RE. Motor units: anatomy, physiology, and functional organization. In: Brooks VB, editor. Handbook of Physiology, The Nervous System, Motor Control. II. Bethesda, MD, USA: American Physiological Society; 1981. pp. 345–422. section 1, part 1, chap. 10. [Google Scholar]
- Burke RE, Tsairis P. Anatomy and innervation ratios in motor units of cat gastrocnemius. The Journal of Physiology. 1973;234:749–765. doi: 10.1113/jphysiol.1973.sp010370. [DOI] [PMC free article] [PubMed] [Google Scholar]
- Delashaw JB, Duling BR. A study of the functional elements regulating capillary perfusion in striated muscle. Microvascular Research. 1988;36:162–171. doi: 10.1016/0026-2862(88)90016-7. [DOI] [PubMed] [Google Scholar]
- De Luca CJ, LeFever RS, McCue MP, Xenakis MP. Behaviour of human motor units in different muscles during linearly varying contractions. The Journal of Physiology. 1982;329:113–128. doi: 10.1113/jphysiol.1982.sp014293. [DOI] [PMC free article] [PubMed] [Google Scholar]
- Emerson GG, Segal SS. Alignment of microvascular units along skeletal muscle fibers of hamster retractor. Journal of Applied Physiology. 1997;82:42–48. doi: 10.1152/jappl.1997.82.1.42. [DOI] [PubMed] [Google Scholar]
- Folkow B, Halicka HD. A comparison between ‘red’ and ‘white’ muscle with respect to blood supply, capillary surface area and oxygen uptake during rest and exercise. Microvascular Research. 1968;1:1–14. [Google Scholar]
- Fuglevand AJ, Segal SS. Simulation of motor unit recruitment and microvascular unit perfusion: spatial considerations. Journal of Applied Physiology. 1997;83:1223–1234. doi: 10.1152/jappl.1997.83.4.1223. [DOI] [PubMed] [Google Scholar]
- Gorczynski RJ, Klitzman B, Duling BR. Interrelations between contracting striated muscle and precapillary microvessels. American Journal of Physiology. 1978;235:H494–504. doi: 10.1152/ajpheart.1978.235.5.H494. [DOI] [PubMed] [Google Scholar]
- Gray SD, Staub NC. Resistance to blood flow in leg muscles of dog during tetanic isometric contraction. American Journal of Physiology. 1967;213:677–682. doi: 10.1152/ajplegacy.1967.213.3.677. [DOI] [PubMed] [Google Scholar]
- Haddy FJ, Scott JB. Metabolic factors in peripheral circulatory regulation. Federation Proceedings. 1975;34:2006–2011. [PubMed] [Google Scholar]
- Hogan MC, Ingham E, Kurdak SS. Contraction duration affects metabolic energy cost and fatigue in skeletal muscle. American Journal of Physiology. 1998;274:E397–402. doi: 10.1152/ajpendo.1998.274.3.E397. [DOI] [PubMed] [Google Scholar]
- Kjellmer I. The effect of exercise on the vascular bed of skeletal muscle. Acta Physiologica Scandinavica. 1964;62:18–30. doi: 10.1111/j.1748-1716.1964.tb03947.x. [DOI] [PubMed] [Google Scholar]
- Kushmerick MJ, Paul RJ. Relationship between initial chemical reactions and oxidative recovery metabolism for single isometric contractions of frog sartorius at 0°C. The Journal of Physiology. 1976;254:711–727. doi: 10.1113/jphysiol.1976.sp011254. [DOI] [PMC free article] [PubMed] [Google Scholar]
- Laughlin MH, Armstrong RB. Muscular blood flow distribution patterns as a function of running speed in rats. American Journal of Physiology. 1982;243:H296–306. doi: 10.1152/ajpheart.1982.243.2.H296. [DOI] [PubMed] [Google Scholar]
- Mackie BG, Terjung RL. Blood flow to different skeletal muscle fiber types during contraction. American Journal of Physiology. 1983;245:H265–275. doi: 10.1152/ajpheart.1983.245.2.H265. [DOI] [PubMed] [Google Scholar]
- Marshall JM, Tandon HC. Direct observations of muscle arterioles and venules following contraction of skeletal muscle fibres in the rat. The Journal of Physiology. 1984;350:447–459. doi: 10.1113/jphysiol.1984.sp015211. [DOI] [PMC free article] [PubMed] [Google Scholar]
- Milner-Brown HS, Stein RB, Yemm R. The orderly recruitment of human motor units during voluntary isometric contractions. The Journal of Physiology. 1973;230:359–370. doi: 10.1113/jphysiol.1973.sp010192. [DOI] [PMC free article] [PubMed] [Google Scholar]
- Mortimer JT. Motor prostheses. In: Brooks VB, editor. Handbook of Physiology, The Nervous System, Motor Control. II. Bethesda, MD, USA: American Physiological Society; 1981. pp. 155–187. section 1, part 1, chap. 5. [Google Scholar]
- Nakao M, Segal SS. Muscle length alters geometry of arterioles and venules in hamster retractor. American Journal of Physiology. 1995;268:H336–344. doi: 10.1152/ajpheart.1995.268.1.H336. [DOI] [PubMed] [Google Scholar]
- Priddy RB, Brodie AF. Facial musculature, nerves and blood vessels of the hamster in relation to the cheek pouch. Journal of Morphology. 1948;83:149–180. doi: 10.1002/jmor.1050830202. [DOI] [PubMed] [Google Scholar]
- Ray CA, Dudley GA. Muscle use during dynamic knee extension: Implication for perfusion and metabolism. Journal of Applied Physiology. 1998;85:1194–1197. doi: 10.1152/jappl.1998.85.3.1194. [DOI] [PubMed] [Google Scholar]
- Saltin B, Rådegran G, Koskolou MD, Roach RC. Skeletal muscle blood flow in humans and its regulation during exercise. Acta Physiologica Scandinavica. 1998;162:421–436. doi: 10.1046/j.1365-201X.1998.0293e.x. [DOI] [PubMed] [Google Scholar]
- Segal SS. Microvascular recruitment in hamster striated muscle: role for conducted vasodilation. American Journal of Physiology. 1991;261:H181–189. doi: 10.1152/ajpheart.1991.261.1.H181. [DOI] [PubMed] [Google Scholar]
- Segal SS, Damon DN, Duling BR. Propagation of vasomotor responses coordinates arteriolar resistances. American Journal of Physiology. 1989;256:H832–837. doi: 10.1152/ajpheart.1989.256.3.H832. [DOI] [PubMed] [Google Scholar]
- Segal SS, Welsh DG, Kurjiaka DT. Spread of vasodilatation and vasoconstriction along feed arteries and arterioles of hamster skeletal muscle. The Journal of Physiology. 1999;516:283–291. doi: 10.1111/j.1469-7793.1999.283aa.x. [DOI] [PMC free article] [PubMed] [Google Scholar]
- Song H, Tyml K. Evidence for sensing and integration of biological signals by the capillary network. American Journal of Physiology. 1993;265:H1235–1242. doi: 10.1152/ajpheart.1993.265.4.H1235. [DOI] [PubMed] [Google Scholar]
- Sparks HV., Jr . Effect of local metabolic factors on vascular smooth muscle. In: Bohr DF, Somlyo AP, Sparks HV, editors. Handbook of Physiology, The Cardiovascular System, Vascular Smooth Muscle. II. Bethesda, MD, USA: American Physiological Society; 1980. pp. 475–513. section 2, chap. 17. [Google Scholar]
- Stainsby WN. Oxygen uptake for isotonic and isometric twitch contractions of dog skeletal muscle in situ. American Journal of Physiology. 1970;219:435–439. doi: 10.1152/ajplegacy.1970.219.2.435. [DOI] [PubMed] [Google Scholar]
- Stainsby WN, Fales JT. Oxygen consumption for isometric tetanic contractions of dog skeletal muscle in situ. American Journal of Physiology. 1973;224:687–691. doi: 10.1152/ajplegacy.1973.224.3.687. [DOI] [PubMed] [Google Scholar]
- Sullivan SM, Pittman RN. In vitro O2 uptake and histochemical fiber type of resting hamster muscles. Journal of Applied Physiology. 1984;57:246–253. doi: 10.1152/jappl.1984.57.1.246. [DOI] [PubMed] [Google Scholar]
- Warren GL, Ingalls CP, Armstrong RB. A stimulating nerve cuff for chronic in vivo measurements of torque produced about the ankle in the mouse. Journal of Applied Physiology. 1998;84:2171–2176. doi: 10.1152/jappl.1998.84.6.2171. [DOI] [PubMed] [Google Scholar]
- Welsh DG, Segal SS. Muscle length directs sympathetic nerve activity and vasomotor tone in resistance vessels of hamster retractor. Circulation Research. 1996;79:551–559. doi: 10.1161/01.res.79.3.551. [DOI] [PubMed] [Google Scholar]
- Welsh DG, Segal SS. Coactivation of resistance vessels and muscle fibers with acetylcholine release from motor nerves. American Journal of Physiology. 1997;273:H156–163. doi: 10.1152/ajpheart.1997.273.1.H156. [DOI] [PubMed] [Google Scholar]