

Abstract
Plasticity in functional connections of expiratory bulbospinal neurones was investigated by measurement of terminal potentials (TPs) and focal synaptic potentials (FSPs), recorded with spike-triggered averaging in the thoracic spinal cord of anaesthetized, paralysed cats. These measurements were made in normal cats and in those which had previously been subjected to spinal cord lesions that transected the axons of the bulbospinal neurones in the segment below that under investigation, either about 2 weeks or about 16 weeks previously.
In both groups of operated animals bulbospinal neurones with firing properties and conduction velocities similar to normal were present. The extracellular recordings that were averaged to reveal TPs and FSPs were made on two standard grids, each consisting of eight sites spaced 0.25 mm apart on two electrode tracks. One grid was positioned at a rostral and one at a caudal location within one segment (T7–T9).
In the normal animals TPs and FSPs were larger and/or more common at rostral sites than at caudal sites, by a factor of about 1.7. In both 2 week and 16 week animals, TPs and FSPs were observed, both showing normal time courses and latencies. At rostral sites in both the 2 week and 16 week animals the amplitudes and/or the frequency of occurrence of TPs and FSPs were similar to normal, as was the case for caudal sites in the 2 week animals. However, at caudal sites in the 16 week animals the FSPs were more common and/or significantly larger than normal, with the increase particularly marked on the lateral track, being equivalent to a factor of about 2. A corresponding increase in the amplitude and/or frequency of occurrence of TPs at caudal lateral sites was also seen, but was not significant.
The results are interpreted as evidence for short-range sprouting of the bulbospinal axons and the formation by them of new connections in the caudal parts of the segments concerned.
Techniques to enable the regrowth of axons across lesions of the adult spinal cord are becoming progressively more successful (Schwab & Bartholdi, 1996; Cheng et al. 1996; Li et al. 1998; Ramón-Cueto et al. 1998; Liu et al. 1999), but little is known of the ability of regenerating axons to make appropriate connections. To assess appropriateness, connections between identified neurones (i.e. single-unit connections) need to be studied. Despite the relative success in promoting regeneration, such connectivity studies in a regeneration experiment still face two major problems. Firstly, even in the most successful attempts (e.g. Liu et al. 1999) no more than about 10 % of the available axons show successful regeneration. Selecting identified single units from such a minority population is likely to be difficult. Secondly, in order to be able to judge appropriateness the axons concerned should be shown to have reached a suitable region of the spinal cord where their potential target neurones are located and their selectivity can be tested, i.e. the problem of pathfinding by such axons needs to be separated from that of selectivity of connections.
The experiments reported here represent the first stage in an alternative approach, in which the short-range sprouting that can occur from transected axons proximal to the site of transection (e.g. Bernstein & Bernstein, 1973) is studied, the hope being that any specificity shown in the connections made in these circumstances could represent that shown in regeneration. We have employed the axons of expiratory bulbospinal neurones in the cat. These neurones are defined physiologically as part of the ventral respiratory group and form a compact column in the nucleus retroambigualis of the caudal medulla, their axons crossing mostly at about the level of their somata and terminating in many segments of the thoracic and lumbar spinal cord (Holstege, 1989; Monteau & Hilaire, 1991; Iscoe, 1998). They were chosen for several reasons. Firstly, because they are known to give off collaterals at many different segmental levels (Merrill & Lipski, 1987; Kirkwood, 1995), it was hypothesized that the connections above a site of transection in the mid or lower thoracic cord would give sufficient trophic support to allow the survival of most of the neurones. Secondly, their spontaneous activity under anaesthesia allows methods such as spike-triggered averaging to be used to assess the connections of individual functionally identified neurones (Merrill & Lipski, 1987; Kirkwood, 1995). Thirdly, the narrow dimensions of the thoracic ventral horn and the presence of collaterals in most segments should allow short-range sprouting to be within range of contacting a variety of possible targets, appropriate or inappropriate. Some knowledge of the appropriate (i.e. normal) targets is already available (Merrill & Lipski, 1987; Kirkwood, 1995; Kirkwood et al. 1999). Finally, data are also available on the pattern of termination of these axons within a spinal segment. The density of terminations appears to be much weaker in the caudal part of a segment than in the rostral part (Kirkwood, 1995). The aim of this study was to look for evidence of short-range sprouting in the segment above a spinal cord lesion which transected the axons of the bulbospinal neurones. If this did occur, there would be an increase in the density of terminations, which we hypothesized would be most likely to be detectable in the region of normally weak terminations. If the presence of any such new terminations could be verified then subsequent detailed study of the individual connections would be worthwhile.
To investigate this, we have used the technique which was originally used to demonstrate the pattern of terminations; that is, the measurement of FSPs by means of extracellular spike-triggered averaging. This has the particular advantage of revealing directly the presence of functionally active connections. Preliminary reports have been published (Ford & Kirkwood, 1995; Ford et al. 1995).
METHODS
Control data were taken from 10 cats, of which 6 formed part of the study of Kirkwood (1995). Measurements were also made on 18 cats with chronic lesions of the spinal cord.
Lesions
Animals were selected for ease of handling and a relaxed disposition, to aid judgement of post-operative analgesia. Anaesthesia was induced with an intramuscular injection of ketamine and chlorpromazine (40 and 1 mg kg−1, respectively) and maintained with intravenous ketamine, as required for surgical anaesthesia. With aseptic precautions, the paraspinal muscles were retracted and the spinous process of one vertebra removed (T7–T9). The rostral part of the lamina of the next most caudal vertebra was removed and the dura opened widely. Using a no. 11 scalpel blade a transverse section of the left side of the cord was made, sparing the dorsal columns. The extent of the lesions in the transverse plane is described in Results. The position of the lesion was always within 0–5 mm caudal of the most rostral dorsal root entry of a segment (T8–10). The rostral dorsal roots of the segment were usually severed, but the roots or dorsal root ganglion of the more rostral segment were never damaged, as confirmed post-mortem. The dura was left open to avoid compression of the cord which otherwise might occur with post-operative oedema. The wound was closed in layers and the animal allowed to recover. All animals received antibiotic (amoxycillin, 150 mg, i.m.) and analgesic (buprenorphine, 0.03 mg, i.m.) at the time of the operation, together with further analgesic if needed on subsequent days (one or two administrations to a few animals only). In all animals but one (not included in the study), recovery was uneventful, the animals usually standing and showing normal bladder function on the day after the operation, normal bowel function within 3 days, using all four legs for locomotion within a week and demonstrating a near-normal gait within a month.
Terminal experiments
Animals with lesioned spinal cords were allowed to survive for 2 weeks or for 15–17 weeks (mostly 16 weeks, all taken as a single 16 week group) and then subjected to the same terminal experiment as the normal controls, as follows. The animals were anaesthetized with sodium pentobarbitone (initial dose 37.5 mg kg−1i.p., then i.v. as required), paralysed with gallamine triethiodide (subsequent to surgery) and artificially ventilated via a tracheal cannula with oxygen-enriched air, so as to bring the end-tidal CO2 fraction initially to about 4 %. CO2 was then added to the gas mixture to raise the end-tidal level to a value sufficient to give a brisk respiratory discharge in the mid-thoracic intercostal nerves (typically 6–7 %). Anaesthesia was assessed by continuous observations of the patterns of the respiratory discharges and the arterial blood pressure (measured via a femoral cannula) together with responses, if any, of both of these to a noxious pinch of the forepaw. Only minimal, transient responses were allowed before supplements (5 mg kg−1) of pentobarbitone were administered. The animal was supported by vertebral clamps at about T5 and T11, a clamp on the iliac crest and a plate screwed to the skull. The head was somewhat ventroflexed. Rectal temperature was maintained between 37 and 38°C by a thermostatically controlled heating blanket. The bladder was emptied by manual compression at intervals. Systolic blood pressure was above 100 mmHg throughout, maintained in a few animals by occasional infusions of 5 % dextran in saline.
The following nerves were prepared for stimulation or recording via platinum wire electrodes: the internal intercostal nerve and a bundle of dorsal ramus nerves (as in Kirkwood et al. 1988) on the left side of the segment above the lesion or of one segment (T7 or T8) in the controls, together with the left external intercostal nerve of T7 or a more rostral segment. Internal intercostal nerves of up to two more segments (T6-T11) on the left and up to two segments on the right were also prepared for recording efferent discharges, used in cross-correlation measurements (Ford & Kirkwood, 1995). Discharges in the external intercostal nerve were used to define the timing of central inspiration.
A thoracic laminectomy (two segments above and below the lesion, or caudal T6 to rostral T10) was made, the dura opened and small patches of pia removed from the dorsal columns of the segment above the lesion or of the chosen segment. The rounded end of a platinum wire was used to record cord dorsum volleys and hence assess the strengths of stimuli applied to the nerves of this segment. To stimulate descending axons on either side of the spinal cord, an array of four insulated stainless steel needles was inserted to a depth of about 3.5 mm in the segment below the lesion or one to two segments below the chosen segment, as in Kirkwood et al. (1988). In the lesioned animals a further pair of fine, glass-insulated tungsten wires was inserted on the left side at about the level of the most caudal dorsal root of the segment above the lesion (usually immediately rostral to the adherent scar tissue above the dorsal columns). The laminectomy and nerves on both sides were submerged in a single paraffin oil pool constructed from skin flaps. An occipital craniotomy was made, the dura opened and a small patch of pia removed from the right side of the medulla, 1–4 mm caudal to obex.
Recording
A glass-insulated, platinum-black coated tungsten microelectrode (A. Ainsworth, Northampton, UK) (Merrill & Ainsworth, 1972), with 25–50 μm of tip exposed, was inserted into the left side of the spinal cord via the prepared holes in the pia at an angle of 15 deg to the vertical in the transverse plane. Positions were determined for the maximum amplitudes of the motoneurone antidromic field potentials resulting from stimuli to the internal intercostal and the dorsal ramus nerves at five times nerve threshold for a series of electrode tracks spaced at 0.1 mm across the whole width of the ventral horn. Such a traverse was made at two positions; in the first millimetre of the segment (defined as caudal to the most rostral dorsal root), and in the caudal half of the segment, usually 5–6 mm caudal to the most rostral dorsal root, exact positions depending on the positions of the larger surface blood vessels. For each traverse these measurements were used to define a grid of recording sites, consisting of four sites evenly spaced 0.25 mm apart on each of two standard electrode tracks 0.25 mm apart, so as uniformly to sample the ventral horn, which is about 0.5 mm wide in these segments, as illustrated in Fig. 1. These sites were used for subsequent recordings of spike-triggered averaged field potentials as in Kirkwood (1995).
Figure 1. Location of recording grids.
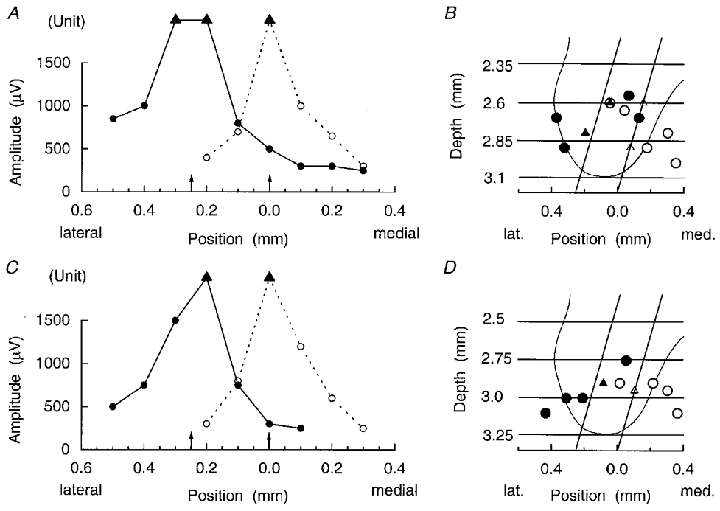
A and C, plots of the maximum amplitudes of motoneurone antidromic field potentials recorded on electrode tracks at different lateral positions (abscissa) in a 16 week cat. B and D, positions for these maxima superimposed on an average outline of the ventral horn as in Kirkwood (1995), together with the grid of recording sites used in each case. The recording sites are represented by the intersections of the two standard electrode tracks for each grid (diagonal lines) with the horizontal lines indicating the standardized depths. ○, dorsal ramus nerves; •, internal intercostal nerves; ▴, ▵, indeterminate field because of the presence of a large potential from a single unit, intracellular or extracellular. A and B, rostral position in the segment; C and D, caudal position in the segment. Arrows on the abscissae of A and C represent the positions of the standard tracks.
A glass microelectrode, external tip diameter about 3 μm, filled with 3 M NaCl or a platinum-plated, epoxy-insulated glass microelectrode (Ford et al. 1987) was introduced into the medulla through a hole in a small pressure plate so as to record, via a conventional band-pass amplifier, the extracellular activity of single units in the right caudal nucleus retroambigualis, around 2–3 mm caudal to obex. Expiratory bulbospinal neurones with axons descending on the left side as far as the T9 or T10 stimulating electrodes in the normal animals or to the more rostral pair in the lesioned animals were identified by antidromic responses to stimuli (0.1 ms pulses) delivered via these electrodes. Identification was always confirmed by a collision test and by double stimuli to show that the minimum interval in the collision test was not due to soma refractoriness. In the lesioned animals, identified units were then also tested for antidromic responses from the caudal electrodes. The criterion for a negative result was the absence of a response to either polarity of stimulation up to 50 V, with stimuli tested with ascending intensities, to avoid errors occurring via anodal block. The thresholds of positively identified units were usually below 20 V.
Procedures and analysis
For each bulbospinal unit, about 30 min of data, comprising the unit discharge together with the efferent discharges in the nerves, were recorded on magnetic tape. At the same time, the projections of units to the selected recording sites on the rostral and/or the caudal grids were assessed by spike-triggered averaging of the signal from the tungsten electrode, which was band-pass filtered, usually 3 dB at 10 Hz and 10 kHz (4096 sweeps at each site). Only units where averages were completed from all eight sites on a grid are included in the analysis and for most units, recordings at both a rostral and a caudal grid were completed. In some of the control animals (Kirkwood, 1995) recordings were made on more than one grid both rostral and caudal. Here, only the first of each of these grids is included in the analysis. Averaged potentials in the illustrations that follow are shown with the convention positive up.
Relative rostrocaudal positions of the recording grids, lesions, stimulating electrodes and the rostral ends of relevant segments were all noted to an accuracy of 0.5 mm. Conduction distances from the medulla were calculated via a table of values which related the distance from obex to rostral T8 to the weight of the animal and which was derived from the animals used by Davies et al. (1985) and Kirkwood (1995). At the end of the experiment the animals were killed with an overdose of anaesthetic (controls) or an overdose of anaesthetic plus transcardiac perfusion with a saline rinse followed by fixative (composition dependent on the particular use of the spinal cord material in other anatomical studies). Blocks containing the lesions were post-fixed in 10 % formol saline and wax-embedded. Serial transverse sections (15 μm) through the lesions were prepared and stained with cresyl violet and luxol fast blue. Lesions were reconstructed by drawing these sections via a drawing tube attached to a microscope.
RESULTS
The bulbospinal neurones
The population of bulbospinal neurones in the normal animals consisted of all 10 units in Kirkwood (1995) where measurements had been made on a standard grid of recording sites, together with 10 more not previously described. Their general properties were similar to those of the whole population in Kirkwood (1995) and are summarized by the measurements of conduction velocity and maximum firing frequency shown in Fig. 2 (top). In the lesioned animals of either group (2 week or 16 week), the microelectrode recordings in the medulla were subjectively normal, with an apparently normal density and frequency of occurrence of expiratory bulbospinal units. The units selected for study (20 at 2 weeks, 31 at 16 weeks) also showed similar characteristics to those in normal animals, including incrementing discharges during expiration, some modulation of firing by the respiratory pump and similar distributions of conduction velocities and maximum firing rates (Fig. 2). The small differences between the mean conduction velocity for the 2 week animals (57.6 m s−1) and that for the normal (64.8 m s−1) or the 16 week (63.7 m s−1) animals were not significant (Kruskal-Wallis test). It should be noted that the distributions of firing rates for both normal and lesioned animals were influenced by our selection of reasonably fast-firing units, which were suitable for the large numbers of sweeps required in the spike-triggered averaging, so the proportions of units with low firing rates will not be adequately represented in these distributions. However, our subjective impression was that such slow firing units were not unusually common or rare in the lesioned animals.
Figure 2. Characteristics of bulbospinal neurones.

Distributions of conduction velocities (left) and maximum firing frequencies (right) for bulbospinal units from the three groups of animals. Arrowheads indicate mean values.
For most units, conduction velocity in the lesioned animals was estimated from conduction times to the rostral stimulating electrodes, as calculated from the collision test (Davies et al. 1985; Kirkwood, 1995). However, in a few cases the conduction times calculated from the collision test differed by more than 0.2 ms from those deduced from axonal potentials in the spike-triggered averages. For these units, the times calculated from the axonal potentials were taken as correct. It was not possible always to use axonal potentials instead of the collision times, since axonal potentials were not always observed.
The situation here differed from that in Kirkwood (1995), where agreement was always very close between these two measures (within 0.18 ms). The discrepancies here were always in the direction that the time from the axonal potential was less than that from the collision test. We assume that there was an error in the time calculated from the collision test because a similar discrepancy was seen for some units which conducted past the lesion, where the conduction velocity to the upper electrodes appeared to be less than that to the lower ones. A possible explanation is that the upper electrodes, being rather fine, may have stimulated collateral branches rather than the stem axon.
For the lesioned animals this report deals only with units whose axons were severed by the lesions, identified here by showing an antidromic response from the rostral electrodes but not from the caudal electrodes. The validity of this criterion depends on additional measurements on expiratory bulbospinal neurones in three normal cats (J. D. Road, T. W. Ford & P. A. Kirkwood, unpublished results). In these experiments, 45/48 units which showed antidromic activation from T8 or T9 could also be similarly activated from T10 or T11, respectively. The proportion of axons with a normal caudal limit of projection within the lesioned segment or the one below (about 20 mm) is thus likely to be no more than 6 %. Moreover, because the lesion was close to the rostral electrodes, only a few of even this minority of axons would have escaped severance. These could include a very few with a normal caudal limit in the 3 mm between the rostral electrodes and the lesion (6 %× 3/20), plus some that escaped as a result of the lesions being incomplete. The proportion of these can be estimated from the overall proportion of units that could be activated from below the lesion in all the animals in this series (13/71, see below). Thus the likely proportion of axons erroneously identified as being severed can be estimated as no more than 6 %× (3/20 + 13/71), i.e. about 2 %.
Lesions
Drawings of three lesions, chosen to illustrate the variation in their extent, are shown in Fig. 3. The lesions were intended to interrupt most of the expiratory bulbospinal axons. In the transverse plane these axons are found widely dispersed in the ventral/ventrolateral white matter, on the lateral side extending as far dorsal as the intermediolateral column and on the medial side at least as far dorsal as the tip of the ventral horn (Kirkwood et al. 1999). Lesions such as that in Fig. 3A, which was one of the most complete of the series, must have severed most of the axons on one side. All three axons tested here were identified as severed. In contrast, the lesion shown in Fig. 3B, which is one of the two most restricted lesions of the series, would be expected to have missed some of the axons, both ventro-medially and in the surviving lateral white matter. This proved to be the case: all four of the axons tested in this animal were found to conduct past the lesion and this is one of the two animals which did not contribute units to this report and which are not included in the statistics (see Table 1). An intermediate situation applies to the lesion in Fig. 3C, where less white matter survived both laterally and medially, and 2/6 units were found to conduct past the lesion.
Figure 3. Examples of spinal cord lesions.
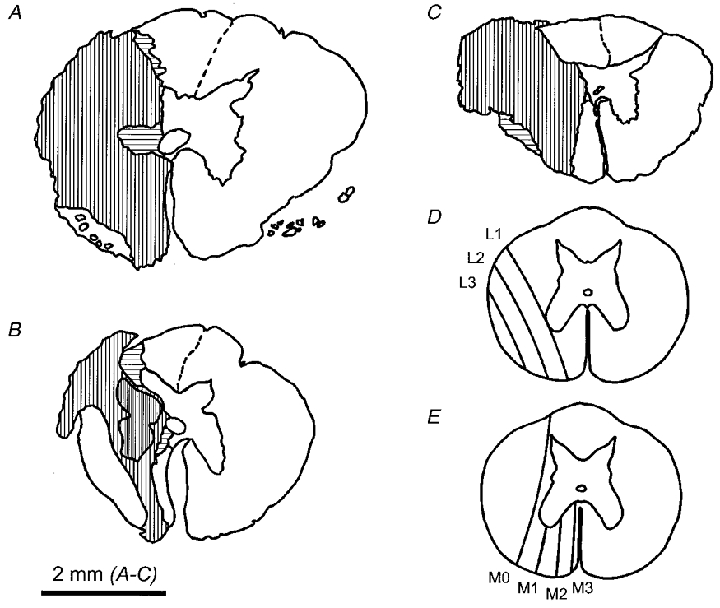
Drawings of two examples of lesions from 16 week animals (A and B) and one example from a 2 week animal (C). Vertical hatching indicates areas of gliosis with no neurones or fibres detected. Horizontal hatching indicates areas with partial preservation. Close vertical hatching in B indicates a cyst. The non-hatched area lateral to the lesion in A was a loose area of scar, containing intact ventral roots. The scheme for classifying the lesions is shown in D for the lateral borders of the lesions and in E for the medial borders. A lesion complete laterally was classified as L4, one complete medially, M4. The lesion in A was assigned a score L4, M4; that in B, L1, M3; and that in C, L3, M2.
Table 1.
Properties of the lesions
| Lesion category | Animal reference | Proportion of axons severed | Axons used for STA |
|---|---|---|---|
| 2 week | |||
| L1, M2 | A89 | 0/5 | — |
| L2, M3 | A66 | 2/5 | 2 |
| L3, M2 | A67 | 3/3 | 2 |
| A69 | 4/6 | 2 | |
| A70 | 3/3 | 2 | |
| L3, M4 | B2 | 3/4 | 3 |
| B4 | 6/6 | 6 | |
| L4, M2 | A65 | 3/3 | 3 |
| Total (excluding A89) | 24/30 | 20 | |
| 16 week | |||
| L1, M3 | A56 | 0/4 | — |
| L2, M0 | A74 | 3/6 | 3 |
| L3, M2 | A71 | 5/5 | 4 |
| A72 | 4/4 | 3 | |
| L4, M0 | A83 | 6/8 | 5 |
| L4, M1 | A79 | 2/2 | 2 |
| A82 | 3/4 | 3 | |
| L4, M2 | A80 | 4/5 | 4 |
| L4, M3 | B11 | 4/4 | 4 |
| L4, M4 | A53 | 3/3 | 3 |
| Total (excluding A56) | 34/41 | 31 | |
Lesion categories are as illustrated in Fig. 3D and E. The numbers of axons used for spike-triggered averages (STA) are less than those listed as severed because the recordings were not all sufficiently stable to perform STA at all sites on a rostral or caudal grid.
Lesions were classified according to their extent laterally or medially, as illustrated in Fig. 3D and E and listed in Table 1. The table also lists the numbers of units tested and those conducting past each lesion. The proportion of axons surviving appeared to be unrelated to the medial extent of the lesion, but probably did depend on the lateral extent (Table 1: units listed in order of lateral score). The 2 week and 16 week lesions were broadly similar in extent. If anything, the 2 week lesions were more complete medially (mean lesion scores, calculated per unit used for spike-triggered average, M3.0 vs. M1.65), but a little less complete laterally (L3.05 vs. L3.58).
General properties of TPs and FSPs
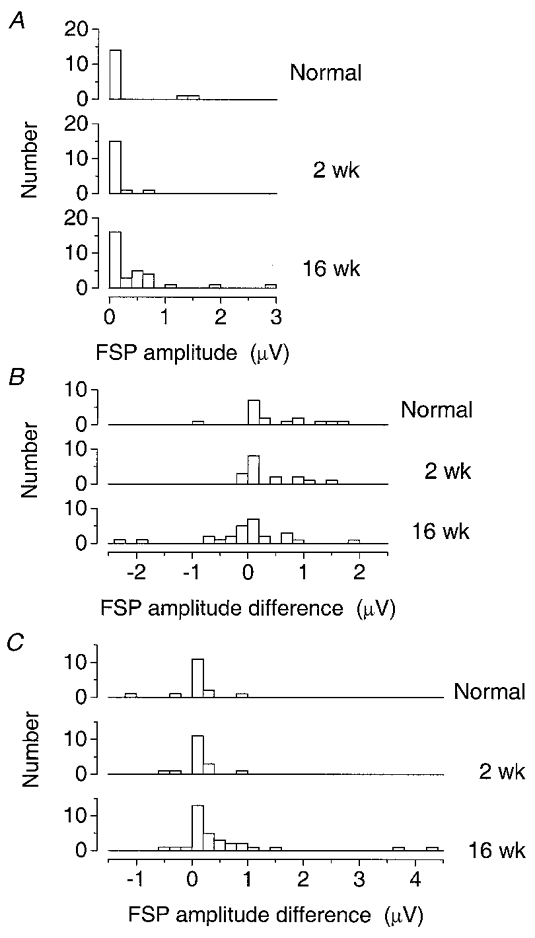
The TPs and FSPs in the normal animals have already been described (Kirkwood, 1995). Examples from operated animals are illustrated in Fig. 4A (2 week) and 4B (16 week). Individual TPs and FSPs from the operated animals were qualitatively indistinguishable from normal. The same criteria as in Kirkwood (1995) were used for judging the occurrence of a TP or FSP. Although at some sites very small TPs or FSPs could be observed, in others noise prevented TPs with amplitudes < 1.5 μV or FSPs < 1 μV from being detected, so waveforms of amplitude less than these limits were noted as absence of a potential (see below). The limit used for TPs was higher than for FSPs because the noise was generally ‘spiky’ in character, with prominent components being similar in shape to the TPs. The limits were the same as used by Kirkwood (1995) because, overall, the noise levels appeared similar to those of that study for all three groups of animals (cf. Fig. 4 with the illustrations in Kirkwood, 1995). There were a few, but only a few, complex TPs (Kirkwood, 1995; cf. Munson & Sypert 1979) in the lesioned animals, just as in the normal animals (Kirkwood, 1995).
Figure 4. Examples of TPs and FSPs.
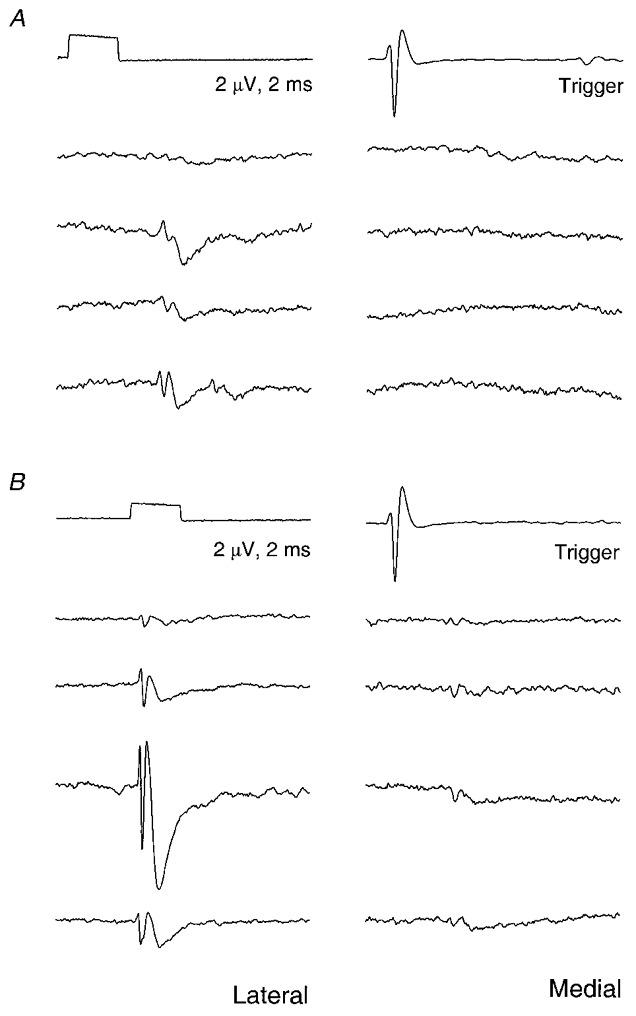
Spike-triggered averaged potentials from two recording grids, arranged according to the site positions: dorsal, up; lateral, left; spacing, 0.25 mm. A, a rostral grid in a 2 week animal; B, a caudal grid in a 16 week animal; 4096 sweeps averaged at each site.
Quantitative measures were also mostly similar to those from the normal animals, as follows. Segmental delays, which represent the conduction time in axon collaterals for a TP and this time plus synaptic delay for an FSP, were measured from the time of occurrence of the impulse in the stem axon, which was calculated as described above and corrected for rostral or caudal position in the segment. Delays were measured to the start of the first negative-going deflection for both the TPs (usually the baseline crossing positive to negative) and the FSPs (the foot of the potential). Delays for positive-going FSPs are not included.
The measured segmental delays (grouped according to rostral or caudal grids) are listed in Table 2 and the distributions of the measurements are shown in Fig. 5. The distributions were similar for all three groups of animals and for the different locations. They were somewhat skewed to the shorter values, with most < 0.5 ms for the TPs and < 1.0 ms for the FSPs, but with a few longer delays in each category. Values between adjacent sites on individual grids may not be independent, so summary measurements, the mean delay on each rostral or caudal grid (Table 2 and Fig. 5, right), were used for statistical comparisons. No significant differences (P > 0.05, Kruskal-Wallis test) were detected between the three groups for TPs or FSPs, rostral or caudal.
Table 2.
Segmental delays for TPs and FSPs and half-widths for FSPs
| Segmental delays | FSP half-widths | |||||
|---|---|---|---|---|---|---|
| Individual | Mean/grid | Individual | Mean/grid | |||
| TP | FSP | TP | FSP | |||
| Normal | ||||||
| Rostral | 0.32 ± 0.27 | 0.96 ± 0.32 | 0.44 ± 0.42 | 1.00 ± 0.15 | 1.00 ± 0.37 | 0.98 ± 0.30 |
| n | 43 | 23 | 11 | 8 | 23 | 8 |
| Caudal | 0.16 ± 0.15 | 0.72 ± 0.23 | 0.26 ± 0.19 | 0.80 ± 0.20 | 1.04 ± 0.40 | 0.93 ± 0.23 |
| n | 21 | 12 | 7 | 4 | 12 | 4 |
| 2 week | ||||||
| Rostral | 0.32 ± 0.17 | 1.00 ± 0.45 | 0.31 ± 0.18 | 1.01 ± 0.32 | 0.98 ± 0.37 | 0.89 ± 0.32 |
| n | 37 | 32 | 12 | 11 | 31 | 11 |
| Caudal | 0.39 ± 0.23 | 1.11 ± 0.15 | 0.37 ± 0.22 | 1.11 ± 0.17 | 0.80 ± 0.31 | 0.73 ± 0.20 |
| n | 14 | 8 | 6 | 5 | 8 | 5 |
| 16 week | ||||||
| Rostral | 0.19 ± 0.25 | 0.73 ± 0.31 | 0.28 ± 0.28 | 0.82 ± 0.35 | 1.24 ± 0.47 | 1.25 ± 0.36 |
| n | 56 | 33 | 20 | 13 | 33 | 13 |
| Caudal | 0.31 ± 0.31 | 0.92 ± 0.45 | 0.46 ± 0.41 | 0.93 ± 0.43 | 1.09 ± 0.46 | 1.04 ± 0.45 |
| n | 53 | 36 | 19 | 16 | 36 | 16 |
Figure 5. Distributions of segmental delays of TPs and FSPs.

Distributions of segmental delays (see text) are shown separately for rostral and caudal grids for each group of animals, on the left for all the individual potentials and on the right as mean values per grid. Delays were measured either from axonal times calculated via collision tests (□) or from axonal potentials (▪).
Half-widths of the FSPs are summarized in Fig. 6 and Table 2. Again, the means for each grid were used for statistical comparison. This time a significant difference was detected between the three groups (P < 0.05, Kruskal-Wallis test), but only if the means for all grids (rostral and caudal groups combined) were compared for the three groups (means ±s.d.: normal, 0.97 ± 0.28 ms, n = 12; 2 week, 0.84 ± 0.30 ms, n = 16; 16 week, 1.13 ± 0.42 ms, n = 29). A difference was identified only between the 2 week and 16 week groups, not between the other two pairings.
Figure 6. Distributions of half-widths of FSPs.

Distributions are shown separately for rostral and caudal grids for each group of animals, on the left for all the individual potentials and on the right as mean values per grid.
Thus, with this one minor exception the general physiological properties of these units and their axons, despite these having been severed in the lesions, were very similar to normal, for both the 2 week and the 16 week animals. The timing comparisons indicate that, as in the normal animals, the TPs and FSPs represent the direct synaptic effects of the recorded neurones at the sites concerned.
Occurrence and amplitudes of TPs and FSPs
Because of the threshold for detection used here, any general increase in amplitude of the potentials will also appear as an increase in occurrence, so these two are considered together. The results are displayed first as cumulative histograms of the FSP amplitudes (Fig. 7) and the TP amplitudes (Fig. 8) for all the individual sites for all the units, separated into the four different electrode tracks. These plots suggest the following results. First, all the plots are similar in shape and can be made to superimpose quite well by a shift along the amplitude axis, corresponding to the comment above relating to the equivalence of changes of amplitude and occurrence (note the log scale for amplitude). Second, in the normal animals the amplitudes/occurrences of both TPs and FSPs at caudal sites were less than at rostral sites by a factor equivalent to an amplitude ratio of about 1.7. This corresponds to the difference already reported by Kirkwood (1995), involving 10 of the same units. Third, at 2 weeks the distributions appeared very similar to normal; the only possible differences were a slight decrease in amplitude or occurrence of FSPs for the caudal lateral track or of TPs on the two medial tracks. Fourth, at 16 weeks, however, for the caudal lateral electrode track, there was an apparent increase of the amplitudes by a factor of about 2 for the FSPs or about 1.7 for the TPs, making the distributions similar to, or a little shifted to larger amplitudes than the rostral distributions in the normal animals.
Figure 7. Distributions of amplitudes of FSPs.
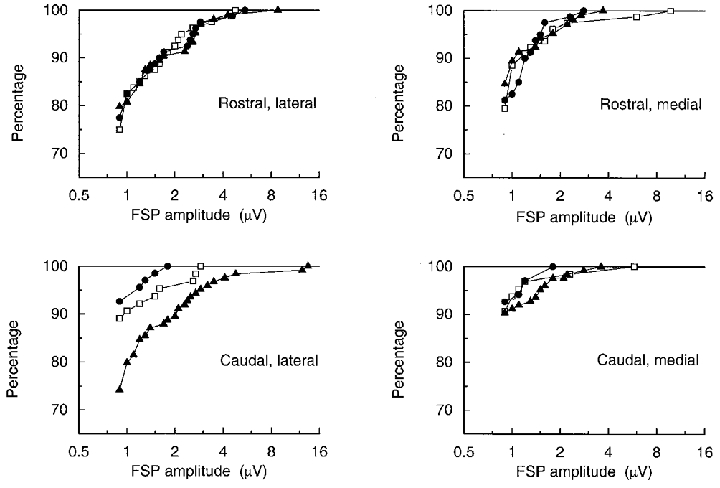
Cumulative histograms, showing the percentages of the FSPs with amplitudes up to the indicated values for all individual sites on each of the four electrode tracks. □, normal; •, 2 weeks; ▴, 16 weeks.
Figure 8. Distributions of amplitudes of TPs.
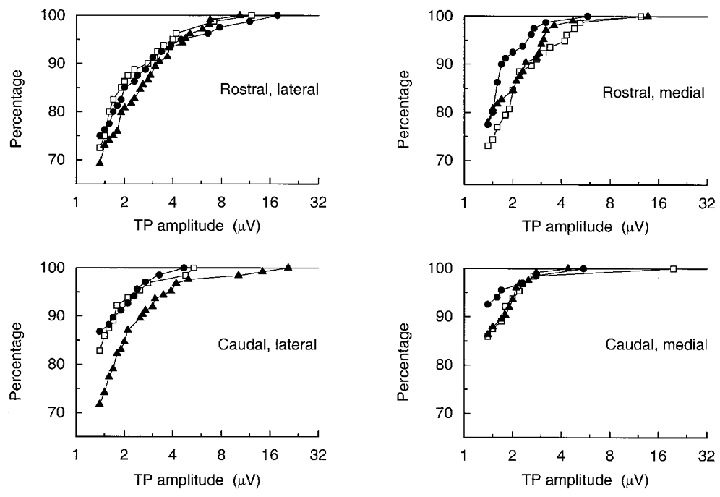
Cumulative histograms, showing the percentages of the TPs with amplitudes up to the indicated values for all individual sites on each of the four electrode tracks. □, normal; •, 2 weeks; ▴, 16 weeks.
These apparent differences in measured amplitudes were tested statistically (Conover, 1980) as follows. As for the timing measurements, summary measures were used, namely mean amplitudes per grid or mean amplitudes per track. Absence of a potential was taken as an amplitude of zero and FSP amplitudes were considered independent of sign.
First, the difference in amplitude between FSPs at rostral and caudal sites for normal animals was confirmed, either for paired comparisons rostral vs. caudal for individual units (sign test, n = 16, P = 0.038, 2-tailed) or by a Mann-Whitney test between the two populations (n1 = 20 rostral, n2 = 16 caudal, P = 0.043, 2-tailed). Second, in line with our starting hypothesis, the caudal grids were compared across the three groups: normal, 2 week and 16 week (Kruskal-Wallis test, n1 = 16, n2 = 17, n3 = 31). The null hypothesis was rejected at P < 0.05, differences being identified between normal and 16 week and between 2 week and 16 week but not between normal and 2 week groups.
Third, the distributions of algebraic differences between the mean rostral FSP and the mean caudal FSP for each unit were similarly compared for the same groups (Kruskal-Wallis test, n1 = 16, n2 = 17, n3 = 26) and the null hypothesis was again rejected (P < 0.05), with a difference again being identified between normal and 16 week and between 2 week and 16 week, but not between normal and 2 week groups.
Fourth, the pronounced difference between the FSP amplitudes for lateral and medial caudal tracks at 16 weeks was confirmed by a sign test on paired comparisons for the 31 individual units (P = 0.0026, 2-tailed) or by a Mann-Whitney test between the two populations (n1 = 31, n2 = 31, P = 0.003, 2-tailed). Finally, the variation of the algebraic difference between the mean FSP amplitudes on lateral and medial caudal tracks in the three groups was confirmed by a Kruskal-Wallis test (n1 = 16, n2 = 17, n3 = 26), the null hypothesis being rejected at P < 0.05. Again, differences between both normal and 16 week, and 2 week and 16 week groups were identified, but not between normal and 2 week groups. Figure 9 shows the distributions of the summary measures which were compared.
Figure 9. Distributions of mean amplitudes used for statistical comparisons.
A, distributions of the mean FSP amplitude per unit for all sites on the caudal grid for each group of animals. B, distributions of the algebraic difference for each unit between the mean FSP amplitude from the rostral grid and that from the caudal grid. C, distributions of the algebraic difference for each unit between the mean FSP amplitude from the caudal lateral track and that from the caudal medial track.
As is clear from comparing Figs 7 and 8, similar differences were apparent between the different populations of TPs, but none of them were significant at P < 0.05 in the same tests as above. The main reason for this was the presence of more units giving TPs (some quite large) at caudal sites in the normal and 2 week groups than was the case for the FSPs.
Possible influence of variation in lesions
As mentioned above, the 2 week and 16 week groups varied somewhat in the extents of their lesions, being more complete medially at 2 weeks, but more complete laterally at 16 weeks. To check for any influence of lesion variation on the comparisons between these groups, cumulative histograms of the amplitudes of the caudal FSPs were compared separately for animals with different extents of lesions (see Table 1 and Fig. 3). For lateral lesions, those classified as L4 were compared with those classified as L2 or L3. The most critical comparison, for the caudal lateral track, is illustrated in Fig. 10A. The differences between the two lesion groups were both small and were in opposite directions for the two time points. Equivalent plots for caudal medial sites (not illustrated) gave similar small differences and virtually no differences for the rostral tracks. For the medial extents of the lesions, those scoring M0 or M1 were compared with those scoring M2-M4. This time, those with the smaller lesions (M0, M1) were associated with rather larger FSPs at 16 weeks (Fig. 10B), but again the effect was small and those scoring M2-M4 at 16 weeks were still clearly separate from those at 2 weeks. A similar small difference was seen at caudal medial sites, but a difference in the opposite direction was seen for rostral sites. Overall, therefore, the small and inconsistent differences between groups with different lesions imply that the observed differences in FSP amplitude between the 16 week and 2 week animals were unlikely to result from variations in the lesions.
Figure 10. Comparisons of amplitudes of FSPs for different extents of lesions.
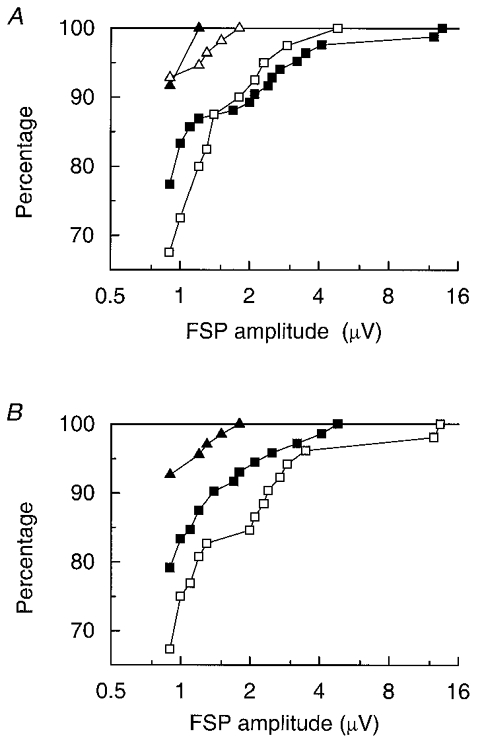
Cumulative histograms, showing the percentages of the FSPs with amplitudes up to the indicated values for all individual sites on the caudal lateral track. Separate plots for different lesion categories. A, comparisons for lateral extent of the lesions: ▪, 16 weeks, L4 (21 units); □, 16 weeks, L2, L3 (10 units); ▴, 2 weeks, L4 (3 units); ▵, 2 weeks, L2, L3 (14 units). B, comparisons for medial extent of the lesions: ▪, 16 weeks, M2-M4 (18 units); □, 16 weeks, M0, M1 (13 units); ▴, 2 weeks, M2-M4 (17 units).
Possible effects related to the sex of the animals
A further possible source of variability became apparent after the experimental work for this study was completed, and is related to the sex of the animals. Vanderhorst & Holstege (1997a,b) investigated the projections from nucleus retroambigualis to the lower lumbar cord and showed that for female cats the normally weak projections to semimembranosus motor nucleus increased in density by a factor of 9 during oestrus. For male cats the projections were intermediate in density and were biased to a somewhat different group of motor nuclei. Although data so far suggest that expiratory bulbospinal neurones of the most common type, with an incrementing expiratory firing pattern (as here) are unlikely to be involved in that projection (Ford & Kirkwood, 1999), the results were reviewed in case the bulbospinal neurones here were similarly affected by oestrogen or were similarly sexually dimorphic. Oestrous state of the animals was not recorded, but the sex was, as follows: normals, 7/10 male; 2 week, 2/8 male; 16 week, 9/9 male.
Cumulative histograms were compared for the two sexes, and again, the differences were not consistent. For caudal lateral sites in normal animals the males did give somewhat larger FSPs than the females (8 units each), but the reverse was true at 2 weeks (8 units vs. 9 units) as it was for rostral sites in the normal animals (11 units vs. 9 units) and caudal medial sites at 2 weeks (8 units vs. 9 units). For caudal medial sites in the normal animals or rostral sites at 2 weeks there were virtually no differences. The sex of the animals was therefore not considered to have an important influence on the results.
DISCUSSION
An important observation in this study is that large numbers of the expiratory bulbospinal neurones survived for at least 16 weeks following transection of their long descending axons. We cannot know from these experiments exactly what the percentage survival was, but the subjective impression from the density of the discharges and from the ease of obtaining recordings in the medullae of the operated animals was that most of the units had survived. The apparently minimal effect on the conduction velocities of the expiratory bulbospinal neurone axons is consistent with good maintenance of trophic support, presumably from the surviving terminals above the lesion (cf. Pinter et al. 1991). Because the firing patterns were similar to normal and because TPs and FSPs were generally indistinguishable from normal it appears that the axons also exhibited normal function in these animals. Our original reasons for choosing these axons were therefore justified.
The main finding of the study is that an increase in functional connections of the axons was seen at 16 weeks, as indicated by the increase in the mean amplitude of FSPs in the caudal part of the segment above the lesion. We interpret this as most likely to have arisen from short-range sprouting of the axons. Our original hypothesis was that this would be expected, but this interpretation is also favoured because other explanations are less likely, as follows.
First, it should be noted that the effect was observed at 16 weeks, but not at 2 weeks, and thus is not a ‘release’ effect but an effect that develops slowly, over a time scale commensurate with what could be expected by sprouting. Evidence from studies of thoracic motoneurones in the cat following lesions similar to those here (Pullen & Sears, 1983) was that the main wave of degeneration (removal of synapses from the motoneurone somata) was largely complete at 2 weeks and restoration of synapses occurred over the subsequent 86 days or more. A similar time scale was reported by Bernstein et al. (1974) in the rat, although with a clear second wave of degeneration at around 40 days post-lesion.
Second, it is of interest that the observed increase in the amplitudes of the potentials was much stronger at lateral sites than at medial ones. This makes it unlikely that the effect is a ‘non-specific’ one, due merely to proximity to the lesion, such as a change in extracellular resistivity.
Third, the possibility needs to be considered that the increase in FSP amplitude might be a postsynaptic effect, such as a general upregulation of excitatory receptors at existing synapses or a change in on-going inhibition in the postsynaptic neurones. If this were so, then it must have been restricted so as to affect a specific group of synapses in the lateral part of the ventral horn. Moreover, an increase in inward current (which is what the FSPs appear to represent; Kirkwood et al. 1991) taking place at existing synapses would almost certainly make existing connections in this region functionally stronger. The only evidence available suggests the reverse: in the same animals as reported here, connections to the expiratory motoneurones, which are located in the lateral half of the ventral horn, were assessed by cross-correlation (Ford & Kirkwood, 1995) and appeared to have become, if anything, weaker.
The favoured explanation, that the increase in FSPs came about via sprouting, implies a presynaptic effect. If so, then one might expect also to see an increase in the TPs, which are generated by presynaptic elements. In fact a corresponding increase in the mean amplitudes of the TPs was seen (Fig. 8), even if it did not reach statistical significance. Thus the observations are at least compatible with a presynaptic increase. Moreover, there are good reasons why the increase in TPs might not be as large as in the corresponding FSPs. Although it is not known exactly which presynaptic elements generate the TPs, the recordings of Kirkwood (1995, particularly Fig. 9) suggest that collateral branches at some distance from the terminations can generate TPs. Thus some of the TPs at caudal sites in normal animals (which were rather more frequent than the FSPs) could have been generated by action potentials in the proximal parts of collaterals which were relatively long, but which had relatively weak terminations. Subsequent short-range sprouting of such collaterals, for instance by branched boutons (Raisman & Field, 1973; Bernstein & Bernstein, 1973), could then occur with only minor increases in TPs.
Within the context of presynaptic effects, a possibility that must be considered is that the observed difference represents a change in presynaptic inhibition, including the relief of conduction block (Wall & McMahon, 1994). However, if this is the explanation, then it must be a slowly developing effect, as argued above. Possible causes could include delayed retrograde degeneration of presynaptic inhibitory axons, or the sprouting of inhibitory controls on them. If such phenomena occurred, they would also need to be restricted to terminals near the lateral recording sites and, just as for the postsynaptic effects mentioned above, existing connections might be expected to get stronger. Again, the cross-correlation measurements give no support for this (Ford & Kirkwood, 1995). Moreover, unlike the situation for primary afferent fibres, presynaptic inhibition via GABAergic axo-axonic synapses has not been demonstrated for the terminals of the long descending fibres to the spinal cord, although it is still considered possible that volume-transmitted substances could modulate release from these terminals (Rudomin & Schmid, 1999).
Thus, even if not proven, short-range sprouting of the bulbospinal axons remains the most plausible cause for the observed increase in synaptic actions of these axons 16 weeks after the lesions. It is thus worth comparing the results with previous observations of sprouting from severed axons. The short-range sprouting of severed axons in the spinal cord close to the site of transection is a common observation (Ramón y Cajal, 1928). This occurs without the addition of exogenous growth factors (Fishman & Kelly, 1984; Van den Pol & Collins, 1994; Li & Raisman, 1995), though it can be more extensive with their addition (Schnell et al. 1994). The sprouting postulated here, however, may be of a different type. The measurements were made well away from the lesion (typically 5–7 mm for the caudal recording sites) and in an area where normally there are some collaterals. The situation may thus be closer to that described by Bernstein & Bernstein (1973).
To our knowledge, physiological measurements of this type, on functionally identified neurones, have not been reported before for the spinal cord, though somewhat similar situations have been studied. In a classic example of denervation-induced sprouting in the red nucleus, the corticorubral input, which normally occupies dendritic sites on the red nucleus neurones, was shown to occupy more somatic sites following the removal of a normally strong somatic input by prior destruction of the interpositus nucleus (Tsukahara et al. 1974). In another situation, single-fibre EPSPs from medial gastrocnemius afferents were studied in triceps surae motoneurones following a chronic rostral spinal transection (Nelson & Mendell, 1979). Some increases in connectivity were seen among the same population of motoneurones as those normally contacted, but these were transient, being largely reversed after 3–4 months. It is possible that effects similar to these examples occurred here, i.e. short-range sprouting or enhancement of contacts on the same neurones as originally contacted, as was suggested by Vanderhorst & Holstege (1997a) for the sprouting of nucleus retroambigualis neurones in the lumbar cord. However, again the cross-correlation evidence to date does not support this (Ford & Kirkwood, 1995), suggesting instead new connections. Further, the enhanced connections here were measured at a time when they had largely disappeared in Nelson & Mendell's study (Nelson & Mendell, 1979).
We have described the presumed sprouting here as short-range because the presumed new projections were not totally beyond their normal area of termination. Moreover, if such projections consisted of completely new collaterals, then for some of the bulbospinal axons, which run near the grey matter, these need be only as long as 0.2 mm. For other axons, such new collaterals might need to be as long as 1.5 mm (some of the expiratory bulbospinal axons appear to be located close to the pial surface, Ford et al. 1997; Kirkwood et al. 1999). However, the presumed sprouting need not represent new collaterals, but could represent merely enlargement of existing weak projections, as we argued with respect to the TPs. We have made careful measurements of segmental delays of the TPs and FSPs and rise times of the FSPs (Figs 5 and 6, and Table 2), because we thought that such measurements might show effects resulting from finer or more branched collaterals than normal. We found little evidence of this sort. However, this is no argument against the existence of sprouting. Collaterals normally show considerable variation in length and degree of branching, corresponding to the normal variation of delays (Kirkwood, 1995; Kirkwood et al. 1999). New branches of up to 0.1 or 0.2 mm in length might give an undetectable increase in delay for impulses in the terminals (0.1 ms at 2 m s−1), quite apart from the statistical problem of detecting small changes in the presence of the existing variation.
The increase in FSP half-width at 16 weeks compared to 2 weeks is compatible with increased temporal dispersion in different terminals as a result of sprouting, as is a possible increase in the standard deviation in the segmental delays at 16 weeks compared to the other groups (not tested for statistical significance, but see Fig. 5). However, these differences are small and could have alternative explanations. The difference in half-width could be the result of postsynaptic influences. The possible increase in standard deviation could have resulted from further undetected errors in the conduction times from the collision tests, even though the delays measured in the ‘corrected’ cases, using axonal potentials for reference times (filled columns in Fig. 5), were not obviously longer than the remainder.
Finally, although changes were only detected in the caudal part of the segment, the question of whether changes had also occurred rostrally should be considered. The caudal part was hypothesized to be the most likely region within which changes would be observed, because of the normally weak connections there. In fact there is no reason to suppose that changes in connections had not taken place elsewhere, possibly with sprouting of some branches being accompanied by withdrawal of others. Whatever the total extent of the changes, however, the prima facie evidence for some changes in the connections of the bulbospinal neurones which this study has provided means that more detailed studies of the individual connections of these neurones in these circumstances are justified, so as to answer the question posed in the Introduction of how selective such new connections in the adult animal can be.
Acknowledgments
We thank Dr J. D. Road for his participation in some of the experiments, Ms K. Sunner for histological processing, the animal care staff of the Institute of Neurology for looking after the operated animals and Professor T. A. Sears for advice and discussion at the start of this work. The study was funded by the Wellcome Trust and the Jeanne Andersen Fund (Institute of Neurology). C.W.V. was supported by the Medical Foundation, University of Sydney.
References
- Bernstein JJ, Gelderd JB, Bernstein ME. Alteration of neuronal synaptic complement during regeneration and axonal sprouting of rat spinal cord. Experimental Neurology. 1974;44:470–482. doi: 10.1016/0014-4886(74)90210-6. [DOI] [PubMed] [Google Scholar]
- Bernstein ME, Bernstein JJ. Regeneration of axons and synaptic complex formation rostral to the site of hemisection in the spinal cord of the monkey. International Journal of Neuroscience. 1973;5:15–26. doi: 10.3109/00207457309149445. [DOI] [PubMed] [Google Scholar]
- Cheng H, Cao Y, Olson L. Spinal cord repair in adult paraplegic rats: partial restoration of hind limb function. Science. 1996;273:510–513. doi: 10.1126/science.273.5274.510. [DOI] [PubMed] [Google Scholar]
- Conover WJ. Practical Nonparametric Statistics. 2. New York: Wiley; 1980. [Google Scholar]
- Davies JGMcF, Kirkwood PA, Sears TA. The detection of monosynaptic connexions from inspiratory bulbospinal neurones to inspiratory motoneurones in the cat. The Journal of Physiology. 1985;368:33–62. doi: 10.1113/jphysiol.1985.sp015845. [DOI] [PMC free article] [PubMed] [Google Scholar]
- Fishman PS, Kelly JP. The fate of severed corticospinal axons. Neurology. 1984;34:1161–1167. doi: 10.1212/wnl.34.9.1161. [DOI] [PubMed] [Google Scholar]
- Ford TW, Kirkwood PA. Connections of expiratory bulbospinal neurones in the anaesthetized cat before and after axotomy. The Journal of Physiology. 1995;487.P:67–68. P. [Google Scholar]
- Ford TW, Kirkwood PA. Respiratory inputs to hindlimb motoneurones in oestrous and non-oestrous anaesthetised female cats. The Journal of Physiology. 1999;521.P:44. P. [Google Scholar]
- Ford TW, McWilliam PN, Shepheard SL. A multibarrelled platinum-coated micro-electrode. The Journal of Physiology. 1987;386:9. P. [Google Scholar]
- Ford TW, Matsuyama K, Mori S, Nakajima K. Projections from the nucleus retroambigualis (nRA) to the thoracic spinal cord of the cat studied with the anterograde axonal tracer Phaseolus vulgaris-leucoagglutinin (PHA-L) The Journal of Physiology. 1997;505:85. PP. [Google Scholar]
- Ford TW, Vaughan CW, Road JD, Kirkwood PA. Synaptic actions of expiratory bulbospinal neurones in the anaesthetized cat before and after axotomy. Japanese The Journal of Physiology. 1995;45(suppl. 2):S64. [Google Scholar]
- Holstege G. Anatomical study of the final common pathway for vocalization in the cat. Journal of Comparative Neurology. 1989;284:242–252. doi: 10.1002/cne.902840208. [DOI] [PubMed] [Google Scholar]
- Iscoe S. Control of abdominal muscles. Progress in Neurobiology. 1998;56:433–506. doi: 10.1016/s0301-0082(98)00046-x. [DOI] [PubMed] [Google Scholar]
- Kirkwood PA. Synaptic excitation in the thoracic spinal cord from expiratory bulbospinal neurones in the cat. The Journal of Physiology. 1995;484:201–225. doi: 10.1113/jphysiol.1995.sp020659. [DOI] [PMC free article] [PubMed] [Google Scholar]
- Kirkwood PA, Ford TW, Donga R, Saywell SA, Holstege G. Assessing the strengths of motoneuron inputs: Different anatomical and physiological approaches compared. In: Binder M, editor. Progress in Brain Research, Peripheral and Spinal Mechanisms in the Neural Control of Movement. Vol. 123. Amsterdam: Elsevier; 1999. pp. 67–82. [DOI] [PubMed] [Google Scholar]
- Kirkwood PA, Munson JB, Sears TA, Westgaard RH. Respiratory interneurones in the thoracic spinal cord of the cat. The Journal of Physiology. 1988;395:161–192. doi: 10.1113/jphysiol.1988.sp016913. [DOI] [PMC free article] [PubMed] [Google Scholar]
- Kirkwood PA, Schmid K, Otto M, Sears TA. Focal blockade of single unit transmission by iontophoresis of antagonists. NeuroReport. 1991;2:185–188. doi: 10.1097/00001756-199104000-00006. [DOI] [PubMed] [Google Scholar]
- Li Y, Field PM, Raisman G. Regeneration of adult rat corticospinal axons induced by transplanted olfactory bulb ensheathing cells. Journal of Neuroscience. 1998;18:10514–10524. doi: 10.1523/JNEUROSCI.18-24-10514.1998. [DOI] [PMC free article] [PubMed] [Google Scholar]
- Li Y, Raisman G. Sprouts from cut corticospinal axons persist in the presence of astrocytic scarring in long-term lesions of the adult rat spinal cord. Experimental Neurology. 1995;134:102–111. doi: 10.1006/exnr.1995.1041. [DOI] [PubMed] [Google Scholar]
- Liu Y, Kim DH, Himes BT, Chow SY, Schallert T, Murray M, Tessler A, Fischer I. Transplants of fibroblasts genetically modified to express BDNF promote regeneration of adult rat rubrospinal axons and recovery of forelimb function. Journal of Neuroscience. 1999;19:4370–4387. doi: 10.1523/JNEUROSCI.19-11-04370.1999. [DOI] [PMC free article] [PubMed] [Google Scholar]
- Merrill EG, Ainsworth A. Glass-coated, platinum-plated tungsten microelectrodes. Medical and Biological Engineering. 1972;10:662–672. doi: 10.1007/BF02476084. [DOI] [PubMed] [Google Scholar]
- Merrill EG, Lipski J. Inputs to intercostal motoneurons from ventrolateral medullary respiratory neurons in the cat. Journal of Neurophysiology. 1987;57:1837–1853. doi: 10.1152/jn.1987.57.6.1837. [DOI] [PubMed] [Google Scholar]
- Monteau R, Hilaire G. Spinal respiratory motoneurons. Progress in Neurobiology. 1991;37:83–144. doi: 10.1016/0301-0082(91)90024-u. [DOI] [PubMed] [Google Scholar]
- Munson JB, Sypert GW. Properties of single central Ia fibres projecting to motoneurones. The Journal of Physiology. 1979;296:315–327. doi: 10.1113/jphysiol.1979.sp013007. [DOI] [PMC free article] [PubMed] [Google Scholar]
- Nelson SG, Mendell LM. Enhancement in Ia motoneuron synaptic transmission caudal to chronic spinal cord transection. Journal of Neurophysiology. 1979;42:642–654. doi: 10.1152/jn.1979.42.3.642. [DOI] [PubMed] [Google Scholar]
- Pinter MJ, Vanden Noven S, Muccio D, Wallace N. Axotomy-like changes in motoneuron electrical properties elicited by botulinum toxin depend on the complete elimination of neuromuscular transmission. Journal of Neuroscience. 1991;11:657–666. doi: 10.1523/JNEUROSCI.11-03-00657.1991. [DOI] [PMC free article] [PubMed] [Google Scholar]
- Pullen AH, Sears TA. Trophism between C-type axon terminals and thoracic motoneurones in the cat. The Journal of Physiology. 1983;337:373–388. doi: 10.1113/jphysiol.1983.sp014629. [DOI] [PMC free article] [PubMed] [Google Scholar]
- Raisman G, Field PM. A quantitative investigation of the development of collateral reinnervation after partial deafferentation of the septal nuclei. Brain Research. 1973;50:241–264. doi: 10.1016/0006-8993(73)90729-4. [DOI] [PubMed] [Google Scholar]
- Ramón y Cajal S. In: Degeneration and Regeneration of the Nervous System. May RM, editor. London: Oxford University Press; 1928. [Google Scholar]
- Ramón-Cueto A, Plant GW, Avila J, Bunge MB. Long-distance axonal regeneration in the transected adult rat spinal cord is promoted by olfactory ensheathing glia transplants. Journal of Neuroscience. 1998;18:3803–3815. doi: 10.1523/JNEUROSCI.18-10-03803.1998. [DOI] [PMC free article] [PubMed] [Google Scholar]
- Rudomin P, Schmidt RF. Presynaptic inhibition in the vertebrate spinal cord revisited. Experimental Brain Research. 1999;129:1–37. doi: 10.1007/s002210050933. [DOI] [PubMed] [Google Scholar]
- Schnell L, Schneider R, Kolbeck R, Barde Y-A, Schwab ME. Neurotrophin-3 enhances sprouting of corticospinal tract during development and after adult spinal cord lesion. Nature. 1994;367:170–173. doi: 10.1038/367170a0. [DOI] [PubMed] [Google Scholar]
- Schwab ME, Bartholdi D. Degeneration and regeneration of axons in the lesioned spinal cord. Physiological Reviews. 1996;76:319–370. doi: 10.1152/physrev.1996.76.2.319. [DOI] [PubMed] [Google Scholar]
- Tsukahara N, Hultborn H, Murakami F. Sprouting of cortico-rubral synapses in red nucleus neurones after destruction of the nucleus interpositus of the cerebellum. Experientia. 1974;30:57–58. [Google Scholar]
- Van den Pol AN, Collins WF. Paraventriculospinal tract as a model for axonal injury: Spinal cord. Journal of Comparative Neurology. 1994;382:77–88. doi: 10.1002/cne.903490207. [DOI] [PubMed] [Google Scholar]
- Vanderhorst VGJM, Holstege G. Estrogen induces axonal outgrowth in the nucleus retroambiguus-lumbosacral motoneuronal pathway in the adult female cat. Journal of Neuroscience. 1997a;17:1122–1136. doi: 10.1523/JNEUROSCI.17-03-01122.1997. [DOI] [PMC free article] [PubMed] [Google Scholar]
- Vanderhorst VGJM, Holstege G. Nucleus retroambiguus projections to lumbosacral motoneuronal cell groups in the male cat. Journal of Comparative Neurology. 1997b;382:77–88. doi: 10.1002/(sici)1096-9861(19970526)382:1<77::aid-cne5>3.0.co;2-h. [DOI] [PubMed] [Google Scholar]
- Wall PD, McMahon SB. Long range afferents in rat spinal cord. 3. Failure of impulse transmission in axons and relief of the failure after rhizotomy of dorsal roots. Philosophical Transactions of the Royal Society. 1994;B 343:211–223. doi: 10.1098/rstb.1994.0022. [DOI] [PubMed] [Google Scholar]