

Abstract
Discrete events (quantum bumps) elicited by dim light were analysed in whole-cell voltage clamp of photoreceptors from dissociated Drosophila ommatidia. Bumps were automatically detected and analysed for amplitude, rise and decay times, and latency.
The bump interval and amplitude distributions, and the ‘frequency of seeing’ curve conformed to Poisson predictions for the absorption of single photons.
At resting potential (−70 mV), bumps averaged 10 pA in peak amplitude with a half-width of ca 20 ms, representing simultaneous activation of ca 15 channels.
The macroscopic response to flashes containing up to at least 750 photons were predicted by the linear summation of quantum bumps convolved with their latency dispersion.
Bump duration was unaffected by lowering the extracellular Ca2+ concentration ([Ca2+]o) from 1.5 to 0.5 mM, but increased >10-fold between 0.5 mM Ca2+ and 0 Ca2+. Bump amplitude was constant over the range 1.5–100 μM, but decreased ca 5- to 10-fold at lower Ca2+ concentrations. Bump latency increased by ca 50 % between 1.5 mM and 100 μM Cao2+ but returned to near control levels in Ca2+-free solutions.
At intermediate [Ca2+]o bumps were biphasic with a slow rising phase followed by rapid amplification and inactivation. This behaviour was mimicked in high [Ca2+]o by internal buffering with BAPTA, but not EGTA. This suggests that Ca2+ influx through the light-sensitive channels must first raise cytosolic Ca2+ to a threshold level before initiating a cycle of positive and negative feedback mediated by molecular targets within the same microvillus.
Quantum bumps in trp mutants lacking the major class of light-sensitive channel were reduced in size (mean 3.5 pA) representing simultaneous activation of only one or two channels; however, a second rarer (10 %) class of large bump had an amplitude similar to wild-type (WT) bumps. Bumps in trpl mutants lacking the second class of light-sensitive channel were very similar to WT bumps, but with slightly slower decay times.
In InaDP215 mutants, in which the association of the TRP channels with the INAD scaffolding molecule is disrupted, bumps showed a defect in quantum bump termination, but their amplitudes and latencies were near normal.
Drosophila photoreceptors utilize a phosphoinositide (PI) cascade whereby absorption of light by rhodopsin activates a heterotrimeric Gq protein and phospholipase C (PLC), resulting in the opening of light-sensitive channels by an as yet incompletely understood mechanism (for reviews see Hardie & Minke, 1995; Minke & Selinger, 1996; Zuker, 1996; Montell, 1999). Drosophila expresses at least two classes of light-sensitive channels: a highly Ca2+-permeable channel which is lacking in mutants of the transient receptor potential (trp) gene (Hardie & Minke, 1992) and a non-selective cation channel which is absent in mutants of the trp-like (trpl) gene (Phillips et al. 1992; Niemeyer et al. 1996; Reuss et al. 1997). These channels are referred to as TRP and TRPL channels respectively, although there is still some doubt as to whether the native channels are homo- or heteromultimers, and whether they contain additional as yet unidentified subunits (Reuss et al. 1997; Xu et al. 1997). The trp gene (Montell & Rubin, 1989) is the prototypical member of a growing family of TRP homologues, found throughout the animal kingdom, which are thought to be important in a range of receptor-mediated Ca2+ influx phenomena, including store-operated or capacitative Ca2+ entry (for reviews see Birnbaumer et al. 1996; Hardie, 1996b; Montell, 1997).
As in many photoreceptors, the phototransduction cascade in Drosophila is notable in that discrete electrical events, known as quantum bumps, are elicited in response to dim illumination (Wu & Pak, 1975). These elementary signalling events consist of the concerted opening (or, in vertebrates, closure) of many channels and are believed to result from the absorption of a single photon by one molecule of rhodopsin (Yeandle & Spiegler, 1973; Baylor et al. 1979). As such they allow a unique insight into the molecular events underlying excitation and define the amplification of the cascade. Invertebrate quantum bumps differ from those recorded in vertebrates in that they are characterized by a relatively long and variable latent period. In Limulus (Keiper et al. 1984; review: Dorlöchter & Stieve, 1997) and Locusta (Howard, 1983) bump latency and waveform are uncorrelated suggesting that they are generated by different molecular mechanisms. Genetic arguments in Drosophila suggest that latency is determined upstream, and amplitude downstream, of PLC (Pak et al. 1976; Scott & Zuker, 1998). Superficially at least, quantum bumps in invertebrates share many similarities with other elementary Ca2+ signalling events (reviewed by Berridge, 1997), but since they can be elicited by precisely delivered stimuli, can be measured with high fidelity using whole-cell voltage clamp and, in Drosophila, can be subjected to genetic dissection, they permit an unusually detailed level of analysis.
An early report of quantum bumps in Drosophila (Wu & Pak, 1975) established some of the criteria necessary for identification as single photon events, but was compromised by the inherent relatively poor signal-to-noise ratio of intracellular recording and an unusually high rate of spontaneous events (8 s−1). More recently, bumps have been recorded under whole-cell voltage clamp recording conditions in a dissociated photoreceptor preparation allowing much greater resolution, though potentially subject to limitations such as wash-out and limited recording time. Although quantum bumps were described when this preparation was first reported (Hardie, 1991), and the effects of various mutations have been described (Hardie et al. 1993; Scott et al. 1995; Hofstee et al. 1996; Niemeyer et al. 1996; Scott & Zuker, 1998), there has been no systematic study of their properties. In particular there has been no investigation of their regulation by Ca2+ which profoundly modulates macroscopic responses (Hardie, 1991; Ranganathan et al. 1991) and influences quantum bumps in Limulus (Stieve et al. 1991) and Calliphora (Hochstrate & Hamdorf, 1985). The present study provides a detailed description of quantum bumps recorded from this preparation, establishes that their properties are consistent with single photon events, provides evidence that the bump waveform is dynamically controlled by Ca2+ influx, and examines the effects of a number of mutations.
METHODS
Flies
The ‘wild-type’ (WT) strain was white-eyed (w), Oregon R Drosophila melanogaster, reared in the dark at 25°C. Experiments were also performed using mutants lacking one or other of the two light-sensitive channels, trp301 or trp343 (supplied by W. L. Pak) and trpl302 (supplied by C. Zuker); as well as InaDP215 (inactivation, no after-depolarization, supplied by W. L. Pak), a point mutation in the recently described PDZ domain scaffolding protein INAD, disrupting its interaction with the TRP channel protein (Shieh & Zhu, 1996).
Electrophysiology
Whole-cell recordings were performed on photoreceptors from dissociated Drosophila ommatidia prepared as previously described (Hardie, 1991, 1996a) in a small chamber, the bottom of which was formed by a glass coverslip on the stage of an inverted Nikon Diaphot microscope. Recordings were made at 19–21°C using an Axoclamp-1D amplifier and pCLAMP 6 software (Axon Instruments, Foster City, CA, USA) from photoreceptors of recently eclosed adults (< 4 h post eclosion) clamped at resting potential (−70 mV). Series resistances were typically in the range 15–25 MΩ; series compensation of 70–80 % was applied for macroscopic responses, but not for bump recordings. Unless otherwise stated, these conditions provided minimal series resistance errors (< 2 mV) for all data presented in this study.
Stimulation and calibration
For most experiments stimulation was from a DC 100 W halogen lamp. Light was filtered by a 560 nm cut-off filter and Wratten ND filters. Flashes were generated using a Uniblitz shutter (rise time 1.6 ms) and delivered via a fluid-filled light guide, the end of which replaced the microscope lamp. For some experiments a green light-emitting diode (LED) was used instead. Absolute calibration of the effective number of photons in the stimuli was achieved by counting quantum bumps in WT photoreceptors under control conditions with dim light. The relative intensities of different stimuli were then measured using a photodiode.
Solutions
Unless otherwise stated the electrode filling solution contained (mM): 140 potassium gluconate, 10 Tes, 2 MgSO4, 4 MgATP, 0.4 Na2GTP and 1 mM NAD. The bath solution contained (mM): 120 NaCl, 5 KCl, 10 Tes, 4 MgCl2, 25 proline, 5 alanine, and 1.5 mM (control) or 0.5 mM CaCl2. Lower Ca2+ concentrations (25–200 μM) were achieved using the low-affinity Ca2+ buffer nitrilotriacetic acid (NTA, 1.5 mM) loaded with varying amounts of CaCl2 to achieve the desired concentration (calculated using MaxC). Nominally 0 Ca2+ was achieved using no added Ca2+ and 1 mM EGTA. For some experiments using ‘0’ Ca2+, Mg2+ was reduced to 100 μM in order to increase the single-channel conductance of the light-sensitive channels (Hardie & Mojet, 1995). The pH of all solutions was adjusted to 7.15.
Bump analysis
Bumps were elicited either by continuous dim illumination or by repeated brief flashes (≤ 1 ms) containing, on average, less than one effective photon, sampled at 1 kHz, filtered at 100 or 200 Hz. Bumps were detected and analysed off-line using dedicated software (DETECT5) written in-house in Turbo PASCAL (Reuss, 1991). Bumps had to fulfil a number of criteria in order to be detected. Under control conditions these were set at: minimum peak amplitude (2 pA), minimum charge integral (20 pA ms), minimum duration (9 ms) and minimum total rise time (6 ms). Bump amplitude distributions (e.g. Fig. 4) suggest a few bumps should be < 2 pA in amplitude; however, there were also occasional ca 1–2 pA transient inward channel openings in the dark, and hence a criterion of 2 pA was chosen as a compromise to minimize false positives. Once detected each bump was analysed according to a number of parameters (see Fig. 1). Namely, tlat which defines the start of the bump and is the first point rising 2 standard deviations above the baseline noise, t1 the time from tlat to 50 % peak, t2 the time from 50 % to the peak, t3 the time to half-decay and Jmax the peak bump amplitude (average of 3 points around peak). The half-width (t½) of the bump is thus t2+t3. Average bumps (e.g. Fig. 1) were created by aligning bumps according to the mean time of the mid-points of the rising and falling phases.
Figure 4. Frequency distributions of the bump parameters.

 |
Figure 1. Quantum bump parameters.

A, average bump recorded under control conditions. Seventy-eight bumps from one WT photoreceptor were aligned by the means of the 50 % rise and 50 % decay times and averaged. Time zero is based on the mean latency, though each bump contributing to the mean had its own unique latency. The averaged bump has been fitted with a lognormal function. Also shown are the parameters extracted by DETECT5. B, stability of bump parameters over time. Sliding averages (n = 20) of t1 (50 % rise time) t3 (50 % decay time) and Jmax (peak amplitude) are plotted for 350 bumps recorded over a 10 min recording period. Only t3 (decay time) showed any systematic drift over this time period (representative of data from 5 cells).
DETECT5 also recognized when a bump began before the previous bump had finished; such multiple bumps were excluded from analysis of all parameters except their timing (tlat), but were used e.g. for calculation of bump intervals and latency distributions. However, bumps arriving within ca 15 ms of each other could no longer be reliably distinguished from large single bumps. In practice an acceptable level (< 5 %) of such double bumps is obtained when continuous trains of bumps are evoked at a mean rate of less than ca 3 s−1 or when bumps are elicited by brief flashes with a probability of less than 0.4 bumps per flash. Relatively long and stable recording periods are therefore required to collect the large number of bumps necessary for a detailed statistical analysis. To explore the stability of recording, continuous trains of bumps were sampled from single cells over a period of 10 min and the various bump waveform parameters monitored over the duration of the experiment (Fig. 1B). Bump rise time and amplitude showed no significant changes over 10 min; however, there was a slight tendency for the bump decay time (t3) to increase (from ca 15 to 20 ms) after 5 min of recording. Bump rate, a measure of quantum efficiency, remained very stable.
Although bump waveform and quantum efficiency were reasonably stable, bump latency, measured from flash bumps showed a significant tendency to increase over the recording period, typically remaining relatively stable up to ca 7 min after establishing the whole-cell configuration, but then increasing, e.g. from ca 35 to 50 ms after 10–15 min under control conditions. With longer whole-cell recordings (beyond ca 25 min) there was a progressive loss of sensitivity and reduction in bump amplitude until the response to light was essentially lost. To ensure reasonable reproducibility, all data were collected within 10–15 min of establishing the whole-cell configuration, except for latency distributions, which were typically measured using 200–300 flashes delivered at 1–2 Hz within 6–7 min of establishing the whole-cell configuration, after allowing ca 2 min for equilibration of the electrode filling solution with the cell.
Deconvolution
If the macroscopic response to a brief flash (impulse response) is the linear summation of individual bumps its waveform should be modelled by the convolution of the average bump waveform and the bump latency distribution (Wong et al. 1980). Similarly, it should be possible to derive the latency distribution by deconvolving the average bump waveform from the impulse response. For this analysis average bumps were generated as above and the impulse response directly determined from the average response to 5–10 brief flashes. Both normalized waveforms, I(t), were then fitted with lognormal functions (Payne & Howard, 1981):
 |
(1) |
where tpk is the time to peak amplitude. The fast Fourier transform (FFT) of the lognormal function describing the impulse response was then divided by that of the bump waveform (implemented in MATHCAD, Mathsoft Inc.). The inverse FFT of the result represents the prediction of the latency distribution. Equally it is possible to predict macroscopic flash response waveforms by convolving an average bump waveform with an arbitrary latency dispersion by multiplying their FFTs.
RESULTS
Drosophila quantum bumps conform to Poisson statistics
Figure 2 shows recordings made under control conditions (−70 mV, 1.5 mM Ca02+) from a WT photoreceptor. In the dark, baseline noise recorded with a 200 Hz low-pass filter typically had a standard deviation of ca 0.3 pA, although in some recordings occasional fluctuations of ca 2 pA were observed, possibly representing single-channel events. By contrast, as previously described (e.g. Hardie, 1991), continuous dim illumination elicited discrete events of variable amplitude (mean ca 10 pA) referred to as quantum bumps (Fig. 2A). Bumps of similar size occurred at a frequency of less than one per minute in the dark; whether these represented genuine spontaneous events (thermal isomerizations of rhodopsin), or responses to stray light was not determined.
Figure 2. Quantum bumps recorded from WT photoreceptors.

A, with 200 Hz filtering, bandwidth of noise in the dark (upper trace) is low, whilst continuous dim light (lower trace) elicits a train of discrete events of variable amplitude. B, repeated responses to 7 brief flashes (0.5 ms), calculated to contain ca 0.3 photons on average. Some flashes elicited no response (failures) whilst others elicited single quantum bumps.
The frequency of the light-induced quantum bumps was directly proportional to stimulus intensity, and as described further below their statistical properties strongly suggest they represent responses to single photon absorptions. On this assumption the intensity of the light source was calibrated in terms of effective photons. Repeated short flashes (< 1 ms) calculated to contain, on average, less than one effective photon per flash, elicited either no response (‘failures’) or events indistinguishable from those elicited by continuous dim illumination, with a variable latency of ca 20–100 ms (Fig. 2B).
In order to obtain an accurate representation of the quantum bump waveform, bumps were averaged after alignment by their rising and falling phases (Fig. 1, see Methods). Under control conditions bumps were, on average, ca 10 pA in peak amplitude (Jmax), with a half-width (t½ = t2+t3) of ca 20 ms. Despite the rapid rise time, bumps were characterized by a finite latent period following which the bump rises abruptly, decaying slightly more slowly. Figure 1 also shows that the bump waveform could be reasonably fitted with a lognormal function and defines the parameters (tlat, t1-t3 and Jmax) analysed for each bump by DETECT5 (see Methods).
If quantum bumps represent the responses to single photon absorptions their statistical behaviour should fulfil a number of criteria (e.g. Yeandle & Spiegler, 1973; Baylor et al. 1979). Firstly, in continuous recordings, as in Fig. 2A the intervals between bumps should be randomly (Poisson) distributed according to a first-order exponential. As shown in Fig. 3A, the interval distributions were indeed indistinguishable from the predicted distribution. Secondly, in principle each bump could represent the absorption of two or more photons, but in this case the probability of detecting a flash as a function of intensity would be much steeper than that predicted for a one photon/one bump model (Hecht et al. 1942). This so-called ‘frequency of seeing’ curve was closely fitted by the single-photon prediction, whilst the two-photon prediction was clearly too steep (Fig. 3B). Thirdly, since photons are emitted and absorbed randomly, the amplitude distribution of events elicited by repeated dim flashes of the same nominal intensity should reflect absorption of a variable number of photons (0, 1, 2, etc.), predicted by the Poisson distribution, such that
| (2) |
where Pn is the probability of absorbing n photons when there are, on average, m effective photons per flash. Since multiple bumps do not, in general, overlap temporally, for this analysis we took the time integral (charge) of the responses rather than peak amplitudes. m was calculated from the proportion of failures (n = 0):
| (3) |
and the mean single bump charge integral, μ, from
| (4) |
where A is the overall mean of all response integrals including failures. Whilst the relatively large standard deviation of bump amplitude meant that distinct peaks reflecting double, treble, etc. absorptions were not usually clearly discernible, the overall charge integral distribution at different intensities conformed closely to the Poisson prediction (Fig. 3C and D).
Figure 3. Statistics of quantum bumps conform to Poisson expectation of single photon absorptions.

The mean single bump charge integral (μ) of 245 fC (C) and 145 fC (D) was calculated from the raw data using eqn (4). The standard deviation of the failures (σ02) was measured directly, the only free parameter was the standard deviation of the bumps (σ2), which was varied by eye to provide the best fit. Results are representative of results from 12 cells. All data are based on recordings from WT photoreceptors under control conditions (−70 mV, 1.5 mM Cao2+).
Taken together these results strongly suggest that quantum bumps in this preparation represent the responses to single photon absorptions.
Statistical analysis of bump parameters
Bumps from WT photoreceptors were analysed with respect to rise time, decay time, latency and amplitude (see Methods and Fig. 1). None of the frequency distributions of these parameters showed any indication of bimodality which might be indicative of more than one class of bump (n = 7 cells, 100–500 bumps in each, e.g. Fig. 4). Scatter plots of each possible pair of parameters also failed to reveal any indication of more than one class of bump (not shown). Finally, to test whether there might be a smaller class of bump hidden within the recording noise, apparent failures to dim flashes were routinely signal averaged, but the results showed no vestige of stimulus-related response (not shown). Decay time and amplitude distributions were reasonably fitted by Gaussian distributions, and though the rise time distributions were skewed to longer values none of the distributions approximated exponential distributions as might be expected if determined by a simple first-order stochastic process. Another property of a memoryless first-order stochastic process is that the standard deviation should equal the mean. However, bump amplitudes were considerably less variable, with the ratio of s.d./mean ( = coefficient of variance, c.v.) typically around ca 0.4 within a single cell. Much less variability was observed between cells, with, for example, peak amplitudes averaging 9.5 ± 0.9 pA (n = 7). Table 1 summarizes the statistics of all waveform parameters from seven typical WT cells.
Table 1.
Bump waveform parameters determined from seven WT photoreceptors under control conditions
| t1 (ms) | t2 (ms) | t3 (ms) | Jmax (pA) | |
|---|---|---|---|---|
| Mean | 10.04 | 7.09 | 12.85 | −9.51 |
| s.d. | 5.76 | 2.59 | 4.91 | 3.79 |
| C.V. | 0.57 | 0.37 | 0.38 | 0.40 |
| s.d. across cells | 0.45 | 1.56 | 1.96 | 0.87 |
At least 170 bumps were analysed for each cell. Standard deviation (s.d.) refers to the mean of the s.d.s of the bumps analysed in individual cells and reflects the variability in bumps within a cell; this variability is also expressed as the coefficient of variance (c.v. = s.d./mean). The s.d.across cells is also given. Parameters t1–t3 and Jmax are defined in Fig. 1; note that bump half-width = t2+t3.
Adopting an approach previously used in Limulus and Locusta photoreceptors (Howard, 1983; Keiper et al. 1984), we also asked whether any of the bump parameters showed significant correlations with each other, as this may give an indication of the mechanism of bump generation. For example if amplification is determined by different molecular events from those responsible for latency, then latency would be expected to show no correlation with bump amplitude. For the most part the various parameters showed no correlation (Table 2), and latency in particular showed no significant or consistent correlation with any other parameter (tested in 4 cells for 75–100 bumps each, correlation coefficient r≤ 0.2 for any pairwise correlation, P > 0.05). The only consistently significant correlation observed was a relatively weak positive correlation (r = 0.33–0.44) observed in all cells tested between the bump amplitude (Jmax) and the decay time (t3); i.e. larger bumps tend to decay more slowly. Weaker apparent correlations (e.g. between Jmax and t1 in Table 2) reached significance (P < 0.05) in less than half of the cells tested.
Table 2.
Correlation coefficient, τ, determined between all possible pairs of bump parameters under control conditions from two representative WT cells
| A. | t1 | t2 | t3 | Jmax | |
|---|---|---|---|---|---|
| t2 | 0.05 | ||||
| t3 | 0.04 | 0.04 | |||
| Jmax | 0.21 | 0.05 | 0.42** | ||
| tlat | 0.21 | −0.02 | 0.19 | −0.08 |
Conditions were: −70 mV, 1.5 mm Ca2+. Values represent 106 bumps in A and 76 bumps in B. The only consistently significant correlation observed was between Jmax and decay half-time t3
P < 0.001. Weaker apparent correlations e.g. t1 and Jmax
P≈ 0.02 were not reproducible. Similar results were obtained in 7 cells (only 4 for tlat).
Linearity
To determine whether the macroscopic response to a brief flash of light (impulse response) could be explained by the linear summation of single photon responses we compared the summed response to flashes eliciting only single bumps with the response to a single flash containing many photons. After scaling for the relative difference in intensity the responses matched closely, indicating linearity (Fig. 5A). For technical reasons, the full extent of linearity could not be determined, but appeared to hold for flashes containing up to at least ca 750 photons generating peak responses of 1–2 nA (Fig. 5B; see also Hardie, 1991). Because of the large currents involved, beyond this voltage clamp control became increasingly compromised by series resistance errors.
Figure 5. Linearity of macroscopic flash response.

A, the average flash (impulse) response to 5 brief (1 ms) flashes containing ca 75 photons (continuous line) is compared to the average response to 64 flashes each containing, on average, 0.9 photons (dotted trace) and scaled according to the difference in intensity (×83). The close overlap confirms the linearity of the response over this intensity range. B, peak responses to brief (10 ms) flashes of increasing intensity. Data from 3 different cells were all well fitted by a linear relationship (2.9 pA per effective photon). A simple linear correction was applied for the calculated series resistance (Rs) errors (Rs× total current; maximum error ca 10 mV) assuming a reversal potential of +12 mV. C, the latency dispersion measured directly from flash bumps recorded in the same cell (histogram) is compared to the latency dispersion predicted by deconvolving the average bump waveform from the impulse response (continuous curve, see Methods). Normalized time courses of the average bump (dotted trace) and impulse response (continuous trace) are shown below. Data are from a single WT photoreceptor under control conditions; similar analysis was performed in 7 cells.
Whilst the impulse response is accurately predicted by the summation of single photon responses, it is considerably broader than the quantum bump. This is because bumps are generated with a variable latency, and it can be predicted that the waveform of the impulse response should reflect the average bump waveform convolved with the bump latency dispersion (Wong et al. 1980). If so, in principle the bump latency dispersion can be derived by deconvolving the bump waveform from the impulse response (see Methods). Figure 5C compares the latency dispersion derived by this method with that determined directly by measuring bump latencies to dim flashes in the same cell. The good match confirms that, as in Limulus (Wong et al. 1980), the impulse response can indeed be described as the convolution of bump shape and bump latency dispersion and demonstrates that the deconvolution is capable of providing a reliable measure of the latency dispersion.
Ca2+ dependence of bump waveform
The rapid kinetics of the macroscopic response of Drosophila photoreceptors has previously been argued to be dependent upon Ca2+ influx through the highly Ca2+-permeable light-sensitive channels (Hardie, 1991; Ranganathan et al. 1991). The Ca2+ influx appears to act by both positive feedback, accelerating the rising phase of the response, and by negative feedback, accelerating response inactivation. Although a number of molecular targets have been implicated in this behaviour, the mechanisms remain poorly understood. Given that macroscopic response kinetics represent the convolution of bump waveform and bump latency (Fig. 5), and that these are likely to be determined by separate molecular mechanisms, it is of interest to enquire how each of these parameters is modified by Ca2+.
As previously reported (Hardie, 1991; Ranganathan et al. 1991), lowering [Ca2+]o profoundly slowed both the rate of rise and decay of the macroscopic impulse response (Fig. 6). Individual quantum bumps recorded over the same range of [Ca2+]o also showed a pronounced dependence on [Ca2+]o suggesting that Ca2+-dependent feedback occurs at the level of a single quantum bump (Fig. 7). After alignment and averaging, it is clear that the bumps broadened in a similar manner to the impulse response as [Ca2+]o was lowered (Fig. 7B); however, the impulse responses were somewhat broader over the entire range indicating that latency dispersion also makes a significant contribution to the macroscopic response (see further below).
Figure 6. Impulse responses at different Ca2+ concentrations.

Normalized responses to a brief (10 ms) flash of light containing ca 75 effective photons over the range of bath Ca2+ concentrations used in this study (1.5 and 0.5 mM, 200, 100, 50 and 25 μM and ‘0’ Ca2+). Response kinetics became progressively slower as Ca2+ was lowered. Note that responses in 25 μM and ‘0’ Ca2+ were very similar.
Figure 7. Ca2+ dependence of quantum bumps.

A, trains of quantum bumps recorded at different bath Ca2+ concentrations. Bump amplitude was still large (ca 10 pA) at 200 μM (and 100 μM, not shown), but bumps were characterized by a slowly rising phase before the onset of rapid amplification and inactivation. Similar bumps were observed in normal (1.5 mM) Ca2+ when the recording electrode contained 10 mM BAPTA and 6 mM CaCl2 (4 mM free BAPTA, calculated to give a free cytosolic [Ca2+] of ca 250 nM). A slowly rising phase was also seen at 50 μM, but now bump amplitudes were significantly reduced. In 0 Cao2+ (and also 25 μM, not shown) bumps were monophasic, and long and variable in duration. Quantum bumps at 0.5 mM (not shown) were very similar to those recorded at 1.5 mM Cao2+. B, averaged quantum bumps recorded at Ca2+ bath concentrations of 1.5, 0.5 and 0.2 mM (left) and 100, 50 μM and ‘0’; Ca2+ (right). Apart from the overall increase in bump duration, notice the slow rising phases of average bumps at intermediate [Ca2+]o (200, 100 and 50 μM).
An unexpected feature was the appearance of a biphasic rising phase in the bump waveform at intermediate [Ca2+]o. An initial slowly rising phase was apparent in many quantum bumps at 200 μM, becoming more pronounced with 100 and 50 μM [Ca2+]o. After the initial slow phase the bumps then progressed with a time course more similar to that observed at higher Ca2+ concentrations (Fig. 7). An intuitive explanation of such waveforms is that cytosolic Ca2+ builds up locally due to influx during the slow phase, reaching a critical threshold level which then triggers a cycle of positive and negative feedback. However, in principle the biphasic behaviour could result from the lowering of the global resting cytosolic [Ca2+] which results when extracellular Ca2+ is lowered (Hardie, 1996a). To test this possibility we attempted to mimic the effect of reducing Ca2+ influx by buffering cytosolic Ca2+ with BAPTA or EGTA. Both were preloaded with Ca2+ to generate Ca2+ levels of ca 250 nM, which is somewhat higher than normal resting Ca2+ (160 nM) under these conditions (Hardie, 1996a). In recordings made with Ca-BAPTA, quantum bumps also showed a very pronounced biphasic rise, strongly supporting a role of reduced effective Ca2+ influx in their generation rather than a change in resting cytosolic [Ca2+] (Fig. 7). Interestingly recordings made with similar concentrations of Ca-EGTA showed no such effect. Since EGTA differs from BAPTA largely in its speed of chelation (millisecond vs. microsecond time scale) this suggests that the molecular targets for initiating the rapid positive feedback are within microsecond diffusional times from the site of influx, i.e. almost certainly within the same microvillus.
Over a wide range of Ca2+ concentrations bump amplitude remained relatively constant (ca 10 pA), but below 100 μM, bump amplitude decreased and bumps recorded at the two lowest Ca2+ concentrations (‘0’ and 25 μM) appeared similar in amplitude to the slow phase of bumps recorded at intermediate concentrations. This suggests that at 25 μM and below, there was no longer sufficient Ca2+ influx to trigger positive feedback. Unfortunately, despite lowering Mg2+ to increase the single-channel conductance, the signal-to-noise ratio at 0 and 25 μM Ca02+ was too poor for our software to reliably detect and analyse bumps, and consequently only a limited set of parameters (amplitude, latency and half-width, t½ = t2+t3) were derived by hand using cursor measurements. A noticeable feature of these low [Ca2+] bumps was their variability in waveform (Fig. 8), but closer examination suggested that they often conformed to a common pattern, rising rapidly after a short delay to reach a quasi steady state before decaying exponentially with a time constant of ca 100 ms. Most of the variability appeared to be in the timing of the onset of bump decay; as described below, latency dispersion made little contribution to the macroscopic response under these conditions.
Figure 8. Ca2+-free quantum bumps.

Bumps elicited by brief (1 ms) dim flashes and recorded under nominally Ca2+-free conditions (no added Ca2+, 1 mM EGTA and 100 μM Mg2+ to increase bump amplitude). Bump durations under these conditions varied greatly, reaching values in excess of 500 ms; however, bump latencies remain tightly grouped around values close to those measured in normal (1.5 mM) Ca2+. A single flash bump with typical latency of ca 45 ms under control conditions is shown below for comparison (note different vertical scale).
Ca2+ dependence of bump latency
Latency distributions were determined directly from ‘flash bumps’, i.e. bumps elicited by dim flashes containing, on average, less than 1 photon, across the whole range of Ca2+ concentrations. For the range 100 μM to 1.5 mM latencies were estimated using DETECT5; however, for the lowest Ca2+ concentrations, latencies were estimated by eye using cursor measurements (see above). Comparing measurements made by DETECT5 and by eye from the same data at 200 μM Ca2+ suggested this was unlikely to have introduced an error of more than 20 ms. The resulting latency distributions were subsequently fitted by lognormal functions (eqn (1)) to derive a time-to-peak (tpk) and half-width (Fig. 9). The Ca2+ dependence of both these parameters along with the arithmetic mean are summarized in Fig. 10.
Figure 9. Bump latency distributions.

Representative latency distributions determined from flash bumps with 1.5 mM, 0.5 mM, 200 μM, 100 μM, 50 μM and ‘0’; Ca2+. Latencies were measured by eye at ‘0’; and 50 μM Ca2+ and by DETECT5 software at other concentrations. Each distribution has been fitted by a lognormal function (eqn (1)).
Figure 10. Ca2+ dependence of bump latency.

A, time-to-peak, half-width (derived from lognormal fits: see Fig. 9) and arithmetic mean of the latency distributions plotted as a function of [Ca2+]o. Latency increased significantly between 1.5 mM and 100 μM Ca2+ but at lower values appeared to decrease again. Latencies in ‘0’ and 50 μM Ca2+ were determined by cursor measurements and at other concentrations by DETECT5. B, comparison of Ca2+ dependence of half-width of average bumps (t½ = t2+t3) and flash response as well as the half-width of the bump latency distribution. The comparison reveals that latency dispersion is a significant determinant of response kinetics at high Cao2+ whilst bump waveform is the major determinant at low Ca2+ concentrations. At intermediate concentrations the macroscopic response is noticeably broader than the bump half-width: this is because the measure of bump half-width does not include the contribution of the slow rising phase of the biphasic bumps measured under these conditions.
Compared to the effect on bump shape, latency was found to show only a modest Ca2+ dependence. Nevertheless, a significant increase in all parameters (tpk, t½ and mean latency) was already observed as Ca02+ was reduced from 1.5 to 0.5 mM, although bump shape was not significantly affected over this range. As Ca02+ was reduced further, there was a modest further increase in latency which, however, then appeared to decrease again at the lowest Ca2+ concentrations.
Comparison of the half-widths of the bump, flash response and latency dispersion over the range of Ca2+ concentrations (Fig. 10B) indicates that latency is an important determinant of the macroscopic response around physiological Ca2+ concentrations, but that the dramatic increase in macroscopic response half-width as [Ca2+] was lowered below 0.5 mM was largely accounted for by the change in bump shape. The conspicuous mismatch between bump and flash response half-width in the intermediate range (50–200 μM) is presumably due to the contribution of the slowly rising phases of the biphasic bumps which are not included in the measure of bump half-width.
Figure 11 compares and summarizes the Ca2+ dependencies of the various parameters measured, values below 100 μM having only been determined by eye from cursor measurements.
Figure 11. Ca2+ dependence of bump parameters.

Bump half-width (t½), latency, amplitude and coefficient of variance plotted against bath [Ca2+]. All amplitudes were measured with 4 mM Mg2+ in the bath. Values are means of between 3 and 7 cells. s.d. bars have been omitted for clarity.
Mutant analysis
At present, the only known components of the cascade downstream of PLC, and therefore likely to be involved in determining bump waveform, are the light-sensitive channels, TRP and TRPL, and the scaffolding molecule INAD which has been proposed as a key molecule underlying the amplification of the quantum bump (Scott & Zuker, 1998). We investigated the effects of mutations in all these three components on the properties of the quantum bumps.
trp and trpl
Drosophila photoreceptors express two classes of light-sensitive channel (TRP and TRPL, encoded at least in part by the trp and trpl genes, but under normal conditions (resting potential, 1.5 mM Ca02+) the light response in trpl mutants has been reported to be indistinguishable from WT (Niemeyer et al. 1996; Reuss et al. 1997). This suggests that the WT light response is carried almost exclusively by TRP channels under these conditions. Niemeyer et al. (1996) also reported that quantum bumps in trpl were indistinguishable from WT whilst bumps in trp were much reduced in size. Their experiments were, however, performed with reduced external Mg2+, which increases the single-channel conductance of the trp-dependent channels (Hardie & Mojet, 1995), whilst the bump properties were not examined with the same resolution of the present study. We therefore repeated these experiments under more physiological conditions. In general, we confirmed the findings of Niemeyer et al. (1996) in that bump amplitude in trpl was indistinguishable from WT; however, there was a slight but significant increase in bump width, which was attributable to a longer decay time, t3 (Fig. 12).
Figure 12. Quantum bumps in trpl photoreceptors.

A, average bump from a typical trpl photoreceptor (continuous trace) compared to that in wild-type. Although very similar, the trpl bump has a slightly slower decay phase. B, comparison of the various bump parameters (t1-t3 and Jmax) between WT (n = 7) and trpl (n = 9 photoreceptors). Each value is the mean and s.d. (across cells) of data measured in 7 WT photoreceptors or 9 trpl photoreceptors. Values in each cell are based on between 100 and 400 bumps. Only values for decay time t3 were significantly different (Student's t test, P < 0.05). All other values were statistically indistinguishable.
Also confirming Niemeyer et al. (1996), bumps in trp were found to be substantially smaller than in WT (Fig. 13), and consequently they could not be reliably detected and analysed by DETECT5. A more limited analysis of amplitude was therefore performed from the peak amplitudes of flash bumps. These were elicited with approximately the same quantum efficiency as WT bumps, but mean amplitude was now only ca 3.5 pA, which is close to the predicted single-channel currents mediated by TRPL channels (ca 2–3 pA under these conditions). Indeed close inspection of bumps from favourable recordings (e.g. Fig. 13B) suggests that individual channel openings of ca 2 pA may sometimes be resolved; however, since the mean open time of TRPL channels is < 1 ms (Hardie et al. 1997) most channel openings are not expected to be clearly resolved because of the recording bandwidth.
Figure 13. Quantum bumps in trp photoreceptors.
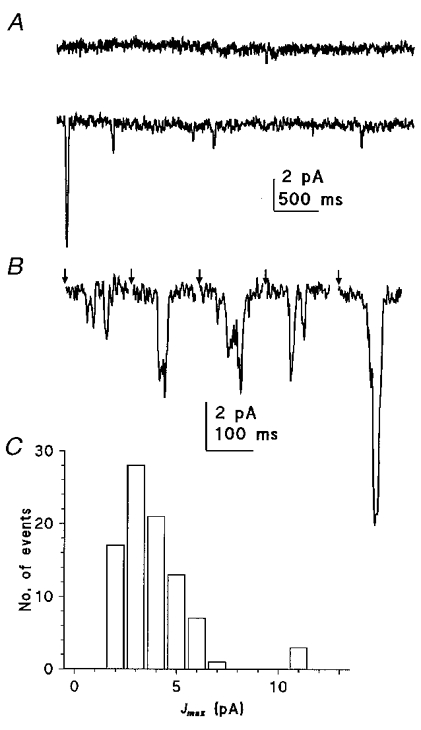
A, the membrane of a trp301 photoreceptor was quiet in the dark (upper trace) but during dim illumination (lower trace), small, ca 2–3 pA, bumps were clearly distinguishable. Occasionally a larger bump similar in size to those recorded in WT was observed (start of trace). B, flash bumps elicited in a trp343 photoreceptor by a short (0.5 ms) flash (at times indicated by arrows) shown on a faster time scale. Most flashes elicited bumps of 2–4 pA, often with indications of repeated single or double channel openings (assuming single-channel currents of ca 2 pA); again occasional bumps of ca 10 pA were observed. C, amplitude histogram of quantum bumps determined from ca 90 ‘flash’ bumps in a trp301 photoreceptor. There is a major peak at 3 pA, with a few (ca 5 %) outliers at around 10–11 pA, but with no indication of an intermediate peak. Amplitude was measured from the maximum current following the flash, and corrected for recording noise by subtracting the standard deviation of the current recorded in the dark immediately prior to the flash. Similar results were obtained in eight other cells in both trp301 and trp343.
Unexpectedly, there was also a second class of much larger bump (10–12 pA; Fig. 13). Since these were ca 3–4 times larger than the dominant class of bump and yet there was no intermediate peak in the amplitude distribution representing double bumps, these seem unlikely to have represented multiple photon absorptions. This class of bump was seen in all cells recorded from, accounting for between 3 and 14 % of total bumps in those cells analysed (mean 9.9 ± 4.1 %, n = 6). They were routinely observed not only in trp301, but also in trp343 which is reported to be a functionally null allele (Scott et al. 1997), and also in both WT and trp343 in the presence of 20 μM La3+ which would completely block any residual TRP channel activity (Niemeyer et al. 1996; Reuss et al. 1997).
InaD
The Drosophila InaD gene encodes a ‘scaffolding’ protein, with five PDZ domains, which is believed to form a supramolecular complex with a number of elements of the phototransduction cascade including PLC, protein kinase C (PKC, encoded by the inaC gene) and the TRP channel (Huber et al. 1996a; Shieh & Zhu, 1996). In InaD mutants these elements become delocalized from the rhabdomere resulting in distinct electrophysiological phenotypes (e.g. Tsunoda et al. 1997). For example InaDP215 has a point mutation in the 3rd PDZ domain which specifically disrupts the interaction with the TRP protein (Shieh & Niemeyer, 1995) with the result that TRP is no longer strictly localized to the microvillar membrane (Chevesich et al. 1997; Tsunoda et al. 1997). The macroscopic phenotype of InaDP215 flies has been reported as delayed inactivation with flash responses failing to terminate rapidly (Shieh & Niemeyer, 1995). According to Tsunoda et al. (1997) this is a consequence of a change in the bump latency distribution, whilst the bump waveform was reported to be unaffected. However, when we investigated InaDP215 photoreceptors under control conditions it was apparent that the quantum bumps themselves showed a defect in inactivation, most bumps having a slowly terminating noisy tail (Fig. 14). This phenotype was somewhat variable, in some recordings the noisy tail being only barely discernible above the recording noise, in others consisting of up to 1–2 s of pronounced noisy fluctuations. In some recordings it was also noticeable that the rising phases were not as abrupt as in WT bumps, showing indications of a slowly rising phase reminiscent of biphasic bumps recorded under low Ca02+. Bump amplitudes were similar to, though possibly slightly smaller than in WT (Jmax = 8.0 ± 0.7 pA, n = 7 cells) and with a similar degree of variability in amplitude (c.v. = 0.39).
Figure 14. Quantum bumps in InaDP215 photoreceptors.

A, in many recordings from InaDP215, bumps had very obvious defects in termination as well as a tendency to show an initial slow phase in the bump rise. Quantum bumps recorded in inaC always showed very slowly terminating bumps, but with abrupt rising phases. B, average bumps determined from two extreme recordings in InaDP215 including one from the cell shown in A (note difference in time scales). The waveform of an average WT bump (dotted line) is shown for comparison. C, the result (dashed line) of convolving an average InaDP215 bump with a typical WT latency dispersion function accurately predicts the time course of the macroscopic InaDP215 response in the same cell (continuous trace, responses normalized).
To assess whether the defect in bump termination was a sufficient explanation for the macroscopic responses we convolved an average InaD bump with a WT latency dispersion and compared the result to the macroscopic flash response from the same cell (Fig. 14C). The close overlap suggests that the bump defect is indeed the major determinant of the macroscopic defect and not the latency dispersion as previously reported (Tsunoda et al. 1997). The latency dispersion was also measured directly in two cells, and found to be indistinguishable from WT (not shown).
TheINAD protein has been reported to be a possible substrate for phosphorylation by PKC (Huber et al. 1996b). It is therefore interesting to note that the quantum bump defect in InaD is similar to that previously reported in the PKC mutant inaC (Hardie et al. 1993). However, there are a number of differences: bumps in inaC did not show the same variability found in InaD, always showing a noisy tail which was usually more pronounced than in InaD, and also never showing the slowly rising phases apparent in many InaD recordings (Fig. 14).
DISCUSSION
A number of studies have reported Drosophila quantum bumps utilizing the whole-cell patch clamp preparation. However, none has rigorously tested the assumption that these events represent single photon events, none have attempted a detailed analysis of bump waveform, and although Ca2+ has previously been shown to play a profound role in shaping macroscopic response kinetics, none have explored their regulation by Ca2+. The present study demonstrates that, as in vertebrates, locusts and the extensively studied Limulus ventral photoreceptor, the discrete events observed with dim light conform to the Poisson expectations necessary for identification as single photon events. In addition we demonstrate novel features of their regulation by Ca2+ and examine the effects of a number of mutations.
Amplification
Bumps determined under ‘physiological’ conditions (−70 mV, 4 mM Mg2+ and 1.5 mM Ca2+) average ca 10 pA in amplitude. This is similar to previous data from our laboratory (reviewed by Hardie & Minke, 1995), but significantly smaller than other values in the literature (e.g. Scott et al. 1995; Niemeyer et al. 1996; Scott & Zuker, 1998). This discrepancy is due to the low levels of Mg2+ in the extracellular solutions used by the latter authors. As previously reported, Mg2+ reduces the single-channel conductance of the light-sensitive channels, particularly those encoded by the trp gene, so that removing extracellular Mg2+ increases the size of the bump, and also accelerates response kinetics (Hardie & Mojet, 1995). The lack of effect of the trpl mutation on bump amplitude (Fig. 12; Niemeyer et al. 1996) suggests that the WT bump is almost entirely mediated by TRP channels. These have been estimated by noise analysis to have a single-channel conductance of ca 4 pS (Reuss et al. 1997), but more recent data suggest a value as high as 8 pS under control ionic conditions (R. C. Hardie, unpublished data), thus generating a single-channel current of 0.65 pA at resting potential (−70 mV), assuming a reversal potential of +12 mV (Reuss et al. 1997). An average bump of 10 pA therefore corresponds to ca 15 simultaneously open channels at the peak of the bump. Quantitative Western analysis suggests there may be ca 100 TRP proteins per microvillus (Hermann et al. 1997), or 25 channels if these form tetrameric channels. It seems at least plausible therefore, that a single bump may represent excitation of only one microvillus, and at most only a few. This contrasts with the situation in Limulus where a bump is believed to represent activation of >1000 channels distributed over numerous microvilli (review: Dorlöchter & Stieve, 1997).
In trp mutants, the mean bump amplitude (3.5 pA) is actually close to the predicted amplitude of a TRPL channel (single-channel current of 2.5 pA, based on single-channel conductance of 35 pS and reversal potential of −2 mV; Reuss et al. 1997) indicating only one or two channels are open at the peak of most bumps. However, we also detected a second class of bump similar in amplitude and time course to those in WT photoreceptors, but nevertheless apparently still mediated by TRPL channels as they were found in the functionally null allele trp343 and were unaffected by La3+ which completely blocks TRP channels. The origin of this second class of bump is unclear, but possibly reflects variations in the number and/or physical separation of neighbouring TRPL channels in individual microvilli. TRPL channels are subject to marked Ca2+-dependent inactivation (Scott et al. 1997; Reuss et al. 1997), thus Ca2+ influx via the first channel to be activated may inhibit close neighbours, but not more distant ones. Similar occasional large bumps were also detected in WT flies in the presence of La3+ but whether they contribute to the WT bumps under normal conditions seems uncertain, as it seems possible that the greater Ca2+ influx via TRP channels in WT photoreceptors may ensure that TRPL channels are predominantly inactivated in WT under physiological conditions.
Interestingly, bumps recorded using intracellular recording techniques in trpCM (Minke et al. 1975) or the equivalent ‘no-steady-state’nss mutant in the larger fly Lucilia (Barash et al. 1988) were previously reported to be similar to WT, but evoked with a lower quantum efficiency. Although it is not clear whether these alleles are null, it seems possible that these bumps represented the large bump class seen in our recordings whilst smaller bumps went undetected due to the inferior signal-to-noise ratio of recording.
Reproducibility
Variability in quantum bump amplitude or waveform limits signal fidelity by introducing undesirable ‘transducer’ noise into the photoreceptor signal (Lillywhite & Laughlin, 1979). Variability of bump amplitude, as quantified by the coefficient of variance (c.v. = s.d./mean), was typically ca 0.4 which is considerably less than predicted by a memoryless first-order stochastic process (c.v. = 1), though inferior to the performance of vertebrate rods where c.v. = ca 0.2 (Baylor et al. 1979; Rieke & Baylor, 1998). Recently, however, it was found that consecutive bumps elicited by the activation of a single rhodopsin molecule in Drosophila were significantly more uniform (c.v. ca 0.25 calculated from data in Scott & Zuker, 1998). This implies that much of the variability is due to spatial variation over the photoreceptor as a whole. It remains to be determined whether this is a random variation or reflects, for example, a gradient in bump amplitude along the length of the rhabdomere. It has previously been suggested that improvement with respect to a stochastic process could be explained by a multi-step inactivation mechanism or feedback (Goldring & Lisman, 1994; Rieke & Baylor, 1998; Whitlock & Lamb, 1999). Apparently Ca2+-dependent feedback is not required for the reproducibility as c.v. values of ca 0.4 were still measured in a ‘0’ Ca2+ bath (Fig. 11). Another possibility would be saturation, e.g. activation of all channels in one microvillus, which might also explain the long plateau phase of bumps often observed under low Ca02+ conditions, giving rise to almost square-shaped bumps (Fig. 8). A specific version of this suggestion is that the bump represents the activation of all the channels in a supramolecular complex (‘transducisome’) co-ordinated by the INAD scaffolding molecule. Indeed, bump defects in severe InaD alleles have been used in support of this idea (Scott & Zuker, 1998). However, since these mutations, which disrupt interactions between INAD, TRP, PLC and PKC, also result in delocalization of the respective proteins from the microvilli (Tsunoda et al. 1997), it seems unclear whether INAD is required simply for maintaining these proteins in the microvillus or whether the protein-protein interactions are paramount (see also Wes et al. 1999). The observation that the InaDP215 mutation, which prevents binding of TRP to the complex, results in bumps with near normal Jmax and c.v., with a significant defect only in deactivation, suggests that this specific molecular interaction is not required for amplification or reproducibility, although it may be required for efficient termination of response. It is perhaps surprising to find that bumps in InaDP215 were near normal in size since examination of published electron micrographs of anti-TRP immuno-gold labelling suggests that the level of TRP protein in the microvilli of newly eclosed InaDP215 flies is reduced by at least 50 %. With the caveat that the immuno-gold studies were not quantified, this would suggest that the size of the bump is not directly determined by the level of TRP protein in the microvilli.
Independence of latency and bump waveform
Statistical independence of bump latency and waveform has previously been reported in Locusta and Limulus ventral photoreceptors and taken to imply that early events during the latent period influence latency but not amplitude (Howard, 1983; Keiper et al. 1984). Nevertheless, in a more recent study Goldring & Lisman (1994) suggested that rhodopsin lifetime is indeed a determinant of bump amplitude in Limulus. In Drosophila it has been suggested that all amplification is determined downstream of PLC. This is because bump amplitude is reported to be unaffected by hypomorphic mutations in PLC or Gq (Pak et al. 1976; Scott et al. 1995; Scott & Zuker, 1998), although latency may be greatly increased and absolute sensitivity reduced up to 1000-fold. The finding that bump latency and amplitude are uncorrelated reinforces the independence of the mechanisms responsible. Further indications come from the quantitatively different dependence of latency and waveform on Ca02+ (Fig. 11) and from the separate effects of ‘wash-out’ on latency, which increased gradually over 10–20 min of whole-cell recording, and bump amplitude and waveform which remain very stable over long recording periods. The single exception – a tendency for bump decay time (t3) to increase with recording time – would be consistent with a distinct molecular mechanism being responsible for bump decay.
The late-stage amplification in Drosophila also has the consequence that if activated metarhodopsin lifetime is prolonged, as in arrestin mutants or hypomorphic calmodulinmutants, rather than affecting bump shape – as is the case in mutants affecting vertebrate rhodopsin inactivation (e.g. Chen et al. 1995) – single photon absorptions result in multiple trains of bumps (Scott et al. 1997).
Ca2+ dependence
It has previously been demonstrated that Ca2+ influx via the light-sensitive channels is required for the rapid kinetics of the macroscopic response, mediating a sequential process of positive and negative feedback (Hardie, 1991, 1995). The present study demonstrates that much of this feedback occurs at the level of the single bump waveform and is therefore likely to be mediated through targets downstream of PLC. A graphic and intuitive indication of positive feedback is given by the appearance of bumps with biphasic rising phases at intermediate Ca2+ concentrations. Given that the light-sensitive channels are permeable to Ca2+, an obvious interpretation is that Ca2+ influx during the slow rising phase results in a gradual increase in cytosolic [Ca2+] until a threshold is reached (e.g. saturation of endogenous Ca2+ buffering capacity), triggering amplification through Ca2+-dependent facilitation. Such amplification is regenerative since the facilitation results in yet more Ca2+ influx generating positive feedback; however, after a short delay, negative feedback terminates the bump much more rapidly than is the case in low [Ca2+]o. The critical external Ca2+ concentration for this regenerative feedback cycle lies between 25 and 50 μM as both bumps and macroscopic responses recorded at 25 μM already appear very similar to those recorded under Ca2+-free conditions. Bumps also appear to be ‘all-or-none’, in that bump amplitude is essentially invariant over the range 100 μM to 1.5 mM Ca2+. This suggests that the Ca2+ dependence of the mechanisms underlying the amplification is rapidly saturated as might be expected if the threshold represents saturation of endogenous Ca2+ buffers. At physiological Ca2+ concentrations, this threshold is presumably reached almost as soon as the first channel has opened. At the lowest Ca2+ concentrations the bump does not enter this regenerative phase, and the bump waveforms observed at 25 μM and ‘0’μM Ca2+ can be most simply interpreted as the slow phase of the biphasic bump continuing until bump completion.
Comparison of the Ca2+ dependence of macroscopic response kinetics, bump latency and bump waveform (e.g. Fig. 10) indicates that the dominant factor responsible for Ca2+ dependent rapid response macroscopic kinetics is the bump waveform. Nevertheless, it is notable that around physiologically relevant Ca2+ concentrations (1.5 mM), bump waveform is rather invariant whilst bump latency shows a significant Ca02+ dependence (Fig. 11). Latency is presumably modulated as a result of global changes in resting cytosolic [Ca2+], which track changes in [Ca2+]o, probably largely due to the Na+-Ca2+ exchange equilibrium (Hardie, 1996a). The sensitivity of bump latency to Ca02+ in this physiologically relevant range suggests that, as in Limulus (Martinez & Srebro, 1976), a shortening of bump latency is likely to play an important role in determining the response acceleration that is observed following light adaptation, even though dynamic modulation of bump waveform by Ca2+ influx appears to be the major factor responsible for the rapid kinetics of the light response overall.
The molecular targets of Ca2+-dependent feedback are incompletely known. Downstream targets involved in modulating quantum bump waveform probably include PKC (Smith et al. 1991; Hardie et al. 1993), and the TRP and TRPL channels, both of which have previously been shown to be susceptible to Ca2+-dependent inactivation (Hardie & Minke, 1994; Reuss et al. 1997; Scott et al. 1997). Possibly this is mediated via calmodulin since both TRP and TRPL channels contain calmodulin (CaM) binding sites in their C-termini (Warr & Kelly, 1996; Chevesich et al. 1997), and targeted mutagenesis of the CaM binding sites on the TRPL channel are reported to reduce or abolish its Ca2+-dependent inactivation (Scott et al. 1997). It has been suggested that calmodulin – and hence presumably Ca2+– is also required for inactivating rhodopsin, since in cam hypomorphs, single photon absorptions generate multiple bumps (Scott et al. 1997). This has been attributed to the effect of CaM deficiency on the Ca2+-CaM-dependent phosphorylation of arrestin. However, a recent study indicates that arrestin phosphorylation in Drosophila is not required for binding arrestin to rhodopsin, but rather for its subsequent dissociation (Alloway & Dolph, 1999). According to these results, the effect of the cam mutation is indirect and results from most available arrestin becoming sequestered to rhodopsin, so that there is insufficient arrestin to bind to and inactivate the remaining rhodopsin molecules. Finally we note that all the targets for Ca2+ feedback thus far proposed represent potential mediators of negative feedback and adaptation, whilst the equally dramatic facilitatory action responsible for quantum bump amplification has no known molecular correlate. Given that amplification appears to occur downstream of PLC, possibilities include the channels themselves or as yet unidentified intermediate enzymes required for their activation.
Acknowledgments
This work was funded by the BBSRC and the Wellcome Trust. S.R.H. was in receipt of a BBSRC earmarked studentship. The authors wish to thank Professor Simon Laughlin for discussion and advice during the experimental phase of this work and Professor Doekele Stavenga for helpful discussions and comments on the manuscript.
References
- Alloway PG, Dolph PJ. A role for the light-dependent phosphorylation of visual arrestin. Proceedings of the National Academy of Sciences of the USA. 1999;96:6072–6077. doi: 10.1073/pnas.96.11.6072. [DOI] [PMC free article] [PubMed] [Google Scholar]
- Barash S, Suss E, Stavenga DG, Rubinstein CT, Selinger Z, Minke B. Light reduces the excitation efficiency in the nss mutant of the sheep blowfly Lucilia. Journal of General Physiology. 1988;92:307–330. doi: 10.1085/jgp.92.3.307. [DOI] [PMC free article] [PubMed] [Google Scholar]
- Baylor DA, Lamb TD, Yau K-W. Responses of retinal rods to single photons. The Journal of Physiology. 1979;288:613–634. [PMC free article] [PubMed] [Google Scholar]
- Berridge MJ. Elementary and global aspects of calcium signalling. The Journal of Physiology. 1997;499:291–306. doi: 10.1113/jphysiol.1997.sp021927. [DOI] [PMC free article] [PubMed] [Google Scholar]
- Birnbaumer L, Zhu X, Jiang MS, Boulay G, Peyton M, Vannier B, Brown D, Platano D, Sadeghi H, Stefani E, Birnbaumer M. On the molecular basis and regulation of cellular capacitative calcium entry: Roles for Trp proteins. Proceedings of the National Academy of Sciences of the USA. 1996;93:15195–15202. doi: 10.1073/pnas.93.26.15195. [DOI] [PMC free article] [PubMed] [Google Scholar]
- Chen J, Makino CL, Peachey NS, Baylor DA, Simon MI. Mechanisms of rhodopsin inactivation in vivo as revealed by a COOH-terminal truncation mutant. Science. 1995;267:374–377. doi: 10.1126/science.7824934. [DOI] [PubMed] [Google Scholar]
- Chevesich J, Kreuz AJ, Montell C. Requirement for the PDZ domain protein, INAD, for localization of the TRP store-operated channel to a signaling complex. Neuron. 1997;18:95–105. doi: 10.1016/s0896-6273(01)80049-0. [DOI] [PubMed] [Google Scholar]
- Dorlöchter M, Stieve H. The Limulus ventral photoreceptor: Light response and the role of calcium in a classic preparation. Progress in Neurobiology. 1997;53:451–515. doi: 10.1016/s0301-0082(97)00046-4. [DOI] [PubMed] [Google Scholar]
- Goldring MA, Lisman JE. Multi-step rhodopsin inactivation schemes can account for the size variability of single photon responses in Limulus ventral photoreceptors. Journal of General Physiology. 1994;103:691–727. doi: 10.1085/jgp.103.4.691. [DOI] [PMC free article] [PubMed] [Google Scholar]
- Hardie RC. Whole-cell recordings of the light-induced current in Drosophila photoreceptors: evidence for feedback by calcium permeating the light sensitive channels. Proceedings of the Royal Society. 1991;B 245:203–210. [Google Scholar]
- Hardie RC. Photolysis of caged Ca2+ facilitates and inactivates but does not directly excite light-sensitive channels in Drosophila photoreceptors. Journal of Neuroscience. 1995;15:889–902. doi: 10.1523/JNEUROSCI.15-01-00889.1995. [DOI] [PMC free article] [PubMed] [Google Scholar]
- Hardie RC. INDO-1 measurements of absolute resting and light-induced Ca2+ concentration in Drosophila photoreceptors. Journal of Neuroscience. 1996a;16:2924–2933. doi: 10.1523/JNEUROSCI.16-09-02924.1996. [DOI] [PMC free article] [PubMed] [Google Scholar]
- Hardie RC. Setting store by calcium. Current Biology. 1996b;6:1371–1373. doi: 10.1016/s0960-9822(96)00733-6. [DOI] [PubMed] [Google Scholar]
- Hardie RC, Minke B. The trp gene is essential for a light-activated Ca2+ channel in Drosophila photoreceptors. Neuron. 1992;8:643–651. doi: 10.1016/0896-6273(92)90086-s. [DOI] [PubMed] [Google Scholar]
- Hardie RC, Minke B. Calcium-dependent inactivation of light-sensitive channels in Drosophila photoreceptors. Journal of General Physiology. 1994;103:409–427. doi: 10.1085/jgp.103.3.409. [DOI] [PMC free article] [PubMed] [Google Scholar]
- Hardie RC, Minke B. Phosphoinositide-mediated phototransduction in Drosophila photoreceptors: The role of Ca2+ and trp. Cell Calcium. 1995;18:256–274. doi: 10.1016/0143-4160(95)90023-3. [DOI] [PubMed] [Google Scholar]
- Hardie RC, Mojet MH. Magnesium-dependent block of the light-activated and trp-dependent conductance in Drosophila photoreceptors. Journal of Neurophysiology. 1995;74:2590–2599. doi: 10.1152/jn.1995.74.6.2590. [DOI] [PubMed] [Google Scholar]
- Hardie RC, Peretz A, SussToby E, RomGlas A, Bishop SA, Selinger Z, Minke B. Protein kinase C is required for light adaptation in Drosophila photoreceptors. Nature. 1993;363:634–637. doi: 10.1038/363634a0. [DOI] [PubMed] [Google Scholar]
- Hardie RC, Reuss H, Lansdell SJ, Millar NS. Functional equivalence of native light-sensitive channels in the Drosophila trp(301) mutant and TRPL cation channels expressed in a stably transfected Drosophila cell line. Cell Calcium. 1997;21:431–440. doi: 10.1016/s0143-4160(97)90054-3. [DOI] [PubMed] [Google Scholar]
- Hecht S, Shlaer S, Pirenne M. Energy quanta and vision. Journal of General Physiology. 1942;25:819–840. doi: 10.1085/jgp.25.6.819. [DOI] [PMC free article] [PubMed] [Google Scholar]
- Hermann R, Huber A, Paulsen R. Phosphoinositide-mediated signaling pathways: Stoichiometric relationship of the signal transducing proteins in a visual cascade. European Journal of Cell Biology. 1997;72:225. [Google Scholar]
- Hochstrate P, Hamdorf K. The influence of extracellular calcium on the response of fly photoreceptors. Journal of Comparative Physiology. 1985;A 156:53–64. [Google Scholar]
- Hofstee CA, Henderson S, Hardie RC, Stavenga DG. Differential effects of ninaC proteins (p132 and p174) on light-activated currents and pupil mechanism in Drosophila photoreceptors. Visual Neuroscience. 1996;13:897–906. doi: 10.1017/s0952523800009147. [DOI] [PubMed] [Google Scholar]
- Howard J. Variations in the voltage response to single quanta of light in the photoreceptor of Locusta migratoria. Biophysics of Structure and Mechanism. 1983;9:341–348. [Google Scholar]
- Huber A, Sander P, Gobert A, Bahner M, Hermann R, Paulsen R. The transient receptor potential protein (Trp), a putative store-operated Ca2+ channel essential for phosphoinositide-mediated photoreception, forms a signaling complex with NorpA, InaC and InaD. EMBO Journal. 1996a;15:7036–7045. [PMC free article] [PubMed] [Google Scholar]
- Huber A, Sander P, Paulsen R. Phosphorylation of the InaD gene product, a photoreceptor membrane protein required for recovery of visual excitation. Journal of Biological Chemistry. 1996b;271:11710–11717. doi: 10.1074/jbc.271.20.11710. [DOI] [PubMed] [Google Scholar]
- Keiper W, Schnakenberg J, Stieve H. Statistical-analysis of quantum bump parameters in Limulus ventral photoreceptors. Zeitschrift fur Naturforschung. 1984;C 39:781–790. [Google Scholar]
- Lillywhite PG, Laughlin SB. Transducer noise in a photoreceptor. Nature. 1979;277:569–572. doi: 10.1038/277569a0. [DOI] [PubMed] [Google Scholar]
- Martinez JM, Srebro R. Calcium and control of discrete wave latency in the ventral photoreceptor of Limulus. The Journal of Physiology. 1976;261:535–562. doi: 10.1113/jphysiol.1976.sp011573. [DOI] [PMC free article] [PubMed] [Google Scholar]
- Minke B, Selinger Z. The roles of trp and calcium in regulating photoreceptor function in Drosophila. Current Opinion in Neurobiology. 1996;6:459–466. doi: 10.1016/s0959-4388(96)80050-x. [DOI] [PubMed] [Google Scholar]
- Minke B, Wu C-F, Pak WL. Induction of photoreceptor noise in the dark in a Drosophila mutant. Nature. 1975;258:84–87. doi: 10.1038/258084a0. [DOI] [PubMed] [Google Scholar]
- Montell C. New light on TRP and TRPL. Molecular Pharmacology. 1997;52:755–763. doi: 10.1124/mol.52.5.755. [DOI] [PubMed] [Google Scholar]
- Montell C. Visual transduction in Drosophila. Annual Review of Cell and Developmental Biology. 1999;15:231–268. doi: 10.1146/annurev.cellbio.15.1.231. [DOI] [PubMed] [Google Scholar]
- Montell C, Rubin GM. Molecular characterization of Drosophila trp locus, a putative integral membrane protein required for phototransduction. Neuron. 1989;2:1313–1323. doi: 10.1016/0896-6273(89)90069-x. [DOI] [PubMed] [Google Scholar]
- Niemeyer BA, Suzuki E, Scott K, Jalink K, Zuker CS. The Drosophila light-activated conductance is composed of the two channels TRP and TRPL. Cell. 1996;85:651–659. doi: 10.1016/s0092-8674(00)81232-5. [DOI] [PubMed] [Google Scholar]
- Pak WL, Ostroy SE, Deland MC, Wu C-F. Photoreceptor mutant of Drosophila: Is protein involved in intermediate steps of phototransduction? Science. 1976;194:956–959. doi: 10.1126/science.824732. [DOI] [PubMed] [Google Scholar]
- Payne R, Howard J. Response of an insect photoreceptor: a simple log-normal model. Nature. 1981;290:415–416. [Google Scholar]
- Phillips AM, Bull A, Kelly LE. Identification of a Drosophila gene encoding a calmodulin-binding protein with homology to the trp phototransduction gene. Neuron. 1992;8:631–642. doi: 10.1016/0896-6273(92)90085-r. [DOI] [PubMed] [Google Scholar]
- Ranganathan R, Harris GL, Stevens CF, Zuker CS. A Drosophila mutant defective in extracellular calcium-dependent photoreceptor deactivation and rapid desensitization. Nature. 1991;354:230–232. doi: 10.1038/354230a0. [DOI] [PubMed] [Google Scholar]
- Reuss H. 1991. Bumps, die elementaren Reizantworten der Photorezeptorzelle des Limulus polyphemus. PhD Thesis, RWTH Aachen. [Google Scholar]
- Reuss H, Mojet MH, Chyb S, Hardie RC. In vivo analysis of the Drosophila light-sensitive channels, TRP and TRPL. Neuron. 1997;19:1249–1259. doi: 10.1016/s0896-6273(00)80416-x. [DOI] [PubMed] [Google Scholar]
- Rieke F, Baylor DA. Origin of reproducibility in the responses of retinal rods to single photons. Biophysical Journal. 1998;75:1836–1857. doi: 10.1016/S0006-3495(98)77625-8. [DOI] [PMC free article] [PubMed] [Google Scholar]
- Scott K, Becker A, Sun Y, Hardy R, Zuker C. Gqα protein function in vivo: Genetic dissection of its role in photoreceptor cell physiology. Neuron. 1995;15:919–927. doi: 10.1016/0896-6273(95)90182-5. [DOI] [PubMed] [Google Scholar]
- Scott K, Sun YM, Beckingham K, Zuker CS. Calmodulin regulation of Drosophila light-activated channels and receptor function mediates termination of the light response in vivo. Cell. 1997;91:375–383. doi: 10.1016/s0092-8674(00)80421-3. [DOI] [PubMed] [Google Scholar]
- Scott K, Zuker CS. Assembly of the Drosophila phototransduction cascade into a signalling complex shapes elementary responses. Nature. 1998;395:805–808. doi: 10.1038/27448. [DOI] [PubMed] [Google Scholar]
- Shieh BH, Niemeyer B. A novel protein encoded by the Inad gene regulates recovery of visual transduction in Drosophila. Neuron. 1995;14:201–210. doi: 10.1016/0896-6273(95)90255-4. [DOI] [PubMed] [Google Scholar]
- Shieh BH, Zhu MY. Regulation of the TRP Ca2+ channel by INAD in Drosophila photoreceptors. Neuron. 1996;16:991–998. doi: 10.1016/s0896-6273(00)80122-1. [DOI] [PubMed] [Google Scholar]
- Smith DP, Ranganathan R, Hardy RW, Marx J, Tsuchida T, Zuker CS. Photoreceptor deactivation and retinal degeneration mediated by a photoreceptor-specific protein-kinase-C. Science. 1991;254:1478–1484. doi: 10.1126/science.1962207. [DOI] [PubMed] [Google Scholar]
- Stieve H, Reuss H, Hennig HT, Klomfass J. Single photon-evoked events of the ventral nerve photoreceptor cell of Limulus– facilitation, adaptation and dependence of lowered external calcium. Zeitschrift fur Naturforschung. 1991;C 46:461–486. [Google Scholar]
- Tsunoda S, Sierralta J, Sun YM, Bodner R, Suzuki E, Becker A, Socolich M, Zuker CS. A multivalent PDZ-domain protein assembles signalling complexes in a G-protein-coupled cascade. Nature. 1997;388:243–249. doi: 10.1038/40805. [DOI] [PubMed] [Google Scholar]
- Warr CG, Kelly LE. Identification and characterization of two distinct calmodulin-binding sites in the Trpl ion-channel protein of Drosophila melanogaster. Biochemical Journal. 1996;314:497–503. doi: 10.1042/bj3140497. [DOI] [PMC free article] [PubMed] [Google Scholar]
- Wes PD, Xu X-ZS, Li H-S, Chien F, Doberstein K, Montell C. Termination of phototransduction requires binding of the NINAC myosin III and the PDZ protein INAD. Nature Neuroscience. 1999;2:447–453. doi: 10.1038/8116. [DOI] [PubMed] [Google Scholar]
- Whitlock GG, Lamb TD. Variability in the time course of single photon responses from toad rods: termination of rhodopsin's activity. Neuron. 1999;23:337–351. doi: 10.1016/s0896-6273(00)80784-9. [DOI] [PubMed] [Google Scholar]
- Wong F, Knight BW, Dodge FA. Dispersion of latencies in photoreceptors of Limulus and the adapting-bump model. Journal of General Physiology. 1980;76:517–537. doi: 10.1085/jgp.76.5.517. [DOI] [PMC free article] [PubMed] [Google Scholar]
- Wu CF, Pak WL. Quantal basis of photoreceptor spectral sensitivity. Journal of General Physiology. 1975;66:149–168. doi: 10.1085/jgp.66.2.149. [DOI] [PMC free article] [PubMed] [Google Scholar]
- Xu XZ S, Li HS, Guggino WB, Montell C. Coassembly of TRP and TRPL produces a distinct store-operated conductance. Cell. 1997;89:1155–1164. doi: 10.1016/s0092-8674(00)80302-5. [DOI] [PubMed] [Google Scholar]
- Yeandle S, Spiegler JB. Light-evoked and spontaneous discrete waves in the ventral nerve photoreceptor of Limulus. Journal of General Physiology. 1973;61:552–571. doi: 10.1085/jgp.61.5.552. [DOI] [PMC free article] [PubMed] [Google Scholar]
- Zuker CS. The biology of vision in Drosophila. Proceedings of the National Academy of Sciences of the USA. 1996;93:571–576. doi: 10.1073/pnas.93.2.571. [DOI] [PMC free article] [PubMed] [Google Scholar]