

Abstract
Intracellular recordings made in single bundle strips of a visceral smooth muscle revealed rhythmic spontaneous membrane depolarizations termed slow waves (SWs). These exhibited ‘pacemaker’ and ‘regenerative’ components composed of summations of more elementary events termed spontaneous transient depolarizations (STDs).
STDs and SWs persisted in the presence of tetrodotoxin, nifedipine and ryanodine, and upon brief exposure to Ca2+-free Cd2+-containing solutions; they were enhanced by ACh and blocked by BAPTA AM, cyclopiazonic acid and caffeine. SWs were also inhibited in heparin-loaded strips.
SWs were observed over a wide range of membrane potentials (e.g. −80 to −45 mV) with increased frequencies at more depolarized potentials.
Regular spontaneous SW activity in this preparation began after 1–3 h superfusion of the tissue with physiological saline following the dissection procedure. Membrane depolarization applied before the onset of this activity induced bursts of STD-like events (termed the ‘initial’ response) which, when larger than threshold levels initiated regenerative responses. The combined initial-regenerative waveform was termed the SW-like action potential.
Voltage-induced responses exhibited large variable latencies (typical range 0.3–4 s), refractory periods of ≈11 s and a pharmacology that was indistinguishable from those of STDs and spontaneous SWs.
The data indicate that SWs arise through more elementary inositol 1,4,5-trisphosphate (IP3) receptor-induced Ca2+ release events which rhythmically synchronize to trigger regenerative Ca2+ release and induce inward current across the plasmalemma. The finding that action potentials, which were indistinguishable from SWs, could be evoked by depolarization suggests that membrane potential modulates IP3 production. Voltage feedback on intracellular IP3-sensitive Ca2+ release is likely to have a major influence on the generation and propagation of SWs.
Electrical pacemaker/rhythmic activity has been observed and extensively studied in the brain and other body organs, yet with the exception of the heart, the underlying mechanisms responsible for this rhythmicity remain largely unresolved. Electrical pacemaking in smooth muscle syncytia has been interpreted by at least two different classes of models: one based on voltage-dependent mechanisms (see Tomita, 1981; Publicover & Sanders, 1989; Publicover, 1995) and the other on chemically based intracellular mechanisms (see Tomita, 1981; Daniel et al. 1994). More recent findings provide support for the latter type of mechanism, one which involves Ca2+ release from intracellular Ca2+ stores (Van Helden, 1993; Liu et al. 1995; Hashitani et al. 1996; Van Helden et al. 1996; Komori et al. 1993).
Evidence for a Ca2+ store-based electrical pacemaker was first derived from studies of lymphatic smooth muscle (Van Helden, 1993), a tissue that exhibits strong vasomotion, and from rhythmically active single isolated smooth muscle cells (Komori et al. 1993). Studies on a syncytial smooth muscle (lymphatic vessels) provided evidence that the action potentials that led to the rhythmic constrictions were initiated by underlying pacemaker activity. This activity was found to arise through a summation of more elementary events referred to as spontaneous transient depolarizations (STDs). STDs also occurred in denervated tissues and had a pharmacology indicating that they arose through Ca2+ release from stores, which generated a transient inward current across the cell membrane. Consistent with this, voltage clamp studies have shown that the spontaneous transient inward currents (STICs; Van Helden, 1991; Wang et al. 1992) underlying STDs were similar (except for their polarity) to spontaneous transient outward currents (STOCs; Benham & Bolton, 1986), events which have been shown to arise from Ca2+ release very near to the cell plasmalemma (Nelson et al. 1995). Pharmacological studies on larger syncytial smooth muscle tissues (Liu et al. 1995; Hashitani et al. 1996) provide further support for the Ca2+ store-based electrical pacemaker mechanism.
However, there are two key issues that must be addressed before general acceptance of this pacemaker mechanism. The first is that the mechanism needs to establish rhythmicity. Intuitively, this could be envisaged as arising through the release-refill cycle of Ca2+ stores which can be rhythmical (see Berridge, 1993). The second relates to the issue of synchronicity. The pacemaker mechanism would be unlikely to function in large tissue syncytia unless there was substantial within- and across-cell synchronization of Ca2+ release. Specifically, the size of the pacemaker stimulus needs to be matched to the tissue in which it triggers action potentials and so the amount of pacemaker Ca2+ release/inward current needs to be appropriately matched to the cellular syncytium. Present understanding of Ca2+ release provides mechanisms that could subserve in this role, these being Ca2+-induced Ca2+ release (CICR) and resultant Ca2+ waves (see Fabiato, 1983; Iino, 1990; Rooney et al. 1990; Lechleiter et al. 1991; Berridge, 1993; Parker et al. 1996; Bootman et al. 1997). Ca2+ waves are often rhythmically generated, arising from an active pacemaker region in single cells or cell syncytia at a frequency that may relate to the release-refill cycle of Ca2+ stores. However, while the Ca2+ wave mechanism goes some way towards providing a means for rhythmically synchronizing Ca2+ release, it is unlikely to be a sufficient mechanism in large tissue syncytia as Ca2+ waves are reported to propagate very slowly (typically < 0.1 mm s−1). The consequence is that Ca2+ waves are likely to only synchronously activate Ca2+ release in relatively small sub-regions of large syncytia and hence would be expected to be rather ineffective in pacing the tissue.
One factor that may play a role in improving this synchronization is membrane potential. This possibility follows from findings indicating that Ca2+ release may be modulated by membrane voltage. This certainly appears to be the case for ryanodine receptor-mediated Ca2+ release (see Melzer et al. 1995; Ferrier & Howlett, 1995). IP3 receptor-mediated Ca2+ release has also been suggested to be modulated by membrane voltage in skeletal muscle (Vergara, 1985; Donaldson et al. 1988), in rat megakaryocytes (Mahaut-Smith et al. 1999) and in vascular smooth muscle where it has been shown that membrane hyperpolarization inhibited the formation of IP3 (Itoh et al. 1992) while membrane depolarization increased IP3-mediated Ca2+ release (Ganitkevich & Isenberg, 1993). Recent studies on smooth muscle strip preparations of the gastric antrum also indicate voltage-activated Ca2+ release from intracellular stores (Edwards et al. 1999; Suzuki & Hirst, 1999).
The present study investigated the origin of rhythmic electrical pacemaker activity referred to as slow waves (SWs) in single bundle strips of visceral smooth muscle. The findings indicate these SWs result from rhythmic IP3 receptor-mediated Ca2+ release, which, above threshold levels, can become regenerative, generating a SW by activating inward membrane currents. Membrane potential was also found to have a major role, in that depolarization induced SW-like action potentials which, except for their mode of generation, were found to be identical to SWs, indicating depolarization caused IP3 receptor-mediated Ca2+ release presumably by increasing synthesis of IP3. This mechanism provides a link between chemically mediated voltage-insensitive and voltage-sensitive pacemaker models, a link which may be fundamental to the evolution and propagation of SWs. Some of these findings have been communicated in abstract form (Van Helden et al. 1999).
METHODS
Experiments were carried out in vitro on strips of circular smooth muscle dissected from the gastric pylorus of young guinea-pigs killed by over-exposure to the inhalation anaesthetic halothane (5–10 % in air) followed by exsanguination. All experiments were performed in accordance with the guidelines of the Animal Care and Ethics Committee of the University of Newcastle. Strips (length < 4 mm; width < 0.1 mm; thickness < 0.1 mm) usually comprised a single muscle bundle (except where noted otherwise) and were dissected nearer the antral region where the pylorus had thinned to several bundles. Strips were superfused at 1–5 ml min−1 in a chamber of volume 0.2–1 ml with gas-bubbled (95 % O2, 5 % CO2), physiological saline of composition (mM): NaCl 120, KCl 5, CaCl2 2.5, MgCl2 2, NaHCO3 25, NaH2PO4 1, and glucose 10, maintained at a pH of 7.3 and temperature of 35°C. In experiments involving rapid solution changeover, > 95 % equilibration was achieved in 20 s (assayed by the depolarizing response to a high external KCl-containing solution). CaCl2 was omitted from some solutions and, where stated, CdCl2 and/or EGTA were added. Some experiments were made with complete isosmolar substitution of Tris-Cl, N-methyl-D-glutamate chloride (NMDG-Cl) or sodium isethionate for NaCl.
Intracellular microelectrode recordings were made using sharp glass electrodes filled with 1 M KCl with tip resistances of 80–140 MΩ. Resting membrane potential (Vm) was taken as the most negative potential between SWs. Strip input resistance (Rin) was measured by injecting hyperpolarizing current pulses (amplitude 0.5–2 nA; duration 1–4 s) to induce steady-state voltage responses between 4 and 10 mV. The frequency of STDs was measured using a detection threshold of 1–2 mV.
Special chemicals used were acetylcholine (ACh), caffeine, cyclopiazonic acid (CPA), EGTA, heparin, nifedipine, ryanodine and tetrodotoxin (TTX) from Sigma and BAPTA AM from Molecular Probes. Some experiments with BAPTA AM were made with extracellular [Ca2+] reduced to 1 mM, a protocol that did not abolish SW activity. Some tissues were loaded with heparin using a reversible permeabilization loading procedure where tissues were exposed to a series of high K+, low Ca2+, EGTA-containing solutions (Kobayashi et al. 1988). In these experiments, adjacent muscle strips of similar size were dissected from a tissue sheet and exposed to the loading procedure with (test strips) or without (control strips) 6 mM heparin (MW ∼5000). The success of permeabilization was monitored by addition of the Ca2+ indicator fluo-3 (Molecular Probes) to the loading solution. Fluo-3 was found to readily enter the cellular syncytium using both heparin-containing and heparin-free loading solutions, verifying that reversible permeabilization had occurred.
Data are expressed as the mean ±s.e.m. with statistical comparisons made using Student's two-tailed paired t test. Differences were considered significant when P values were less than 0.05. n indicates the number of tissues used, unless otherwise stated.
RESULTS
Muscle strips were observed to begin spontaneous contractions 1–3 h after dissection and commencement of superfusion. Microelectrode recordings, made in the presence of 1 μM nifedipine to prevent contraction, indicated considerable interstrip variability in membrane potential with values ranging from -45 to −75 mV (mean −59 ± 1 mV; n = 70). Strips tended to show little activity shortly after preparation but exhibited increasing levels of STDs over time with about 80 % of these strips developing rhythmic depolarizations termed SWs within 1–3 h after commencement of superfusion. STDs and SWs were not due to the activation of L-type Ca2+ channels as they persisted in nifedipine (1 μM; n = 45). Brief depolarization-induced regenerative spikes were occasionally observed superimposed on large STDs and SWs or upon depolarization by current injection. These spikes were blocked by nifedipine (1 μM), indicating that they were probably L-type Ca2+ channel-based action potentials. SWs generally caused strips to phasically contract, an action that was primarily due to the opening of L-type Ca2+ channels as contraction was markedly inhibited under normal physiological conditions by nifedipine (1 μM; n = 10). Except where noted, all subsequent experiments were made in the presence of 1 μM nifedipine.
STDs
The properties of STDs were investigated using voltage recordings from strips that showed either no SW activity or SWs at low frequency (< 1 min−1). Fluctuations of the baseline membrane potential were primarily the consequence of STDs. Spontaneous transient hyperpolarizations were also observed, but this activity was infrequent and/or of small amplitude and has not been further considered. STDs varied markedly in amplitude, within or between strips, with large events of the order of 10 mV occasionally observed. However, by far the majority of STDs were small and below the threshold detection level which was set at 1–2 mV. The STDs detected had a mean amplitude of 3 ± 1 mV, 20–80 % rise time of 80 ± 20 ms and half-width of 190 ± 70 ms (means determined from 10 strips using means of 16–190 STDs in each strip).
Single bundle strips of length 1–2 mm exhibited input resistances of about 5 MΩ and were approximately isopotential in response to injection of steady-state currents (e.g. ∼5–15 % decrement in voltage amplitude for current injected near the middle of the strip; n = 4). As for all ‘leaky’ core conductors, the spatial decrement was shorter for injection of brief current pulses which induced transient but not steady-state voltage responses (see Jack et al. 1975). On this basis, STDs would be expected to show spatial decrement if they were produced by relatively brief STICs at local regions within the syncytium of cells that constitute the strip. Recordings of STDs made with two electrodes placed at opposite ends of the strips confirmed that this was the case, as simultaneously recorded STDs were generally larger at one electrode than the other, though the ratio of the amplitudes was not fixed and could favour either electrode (Fig. 1A). This indicates that each STIC was locally generated in a sub-region of the cellular syncytium with the site of generation varying for each STIC.
Figure 1. STDs.
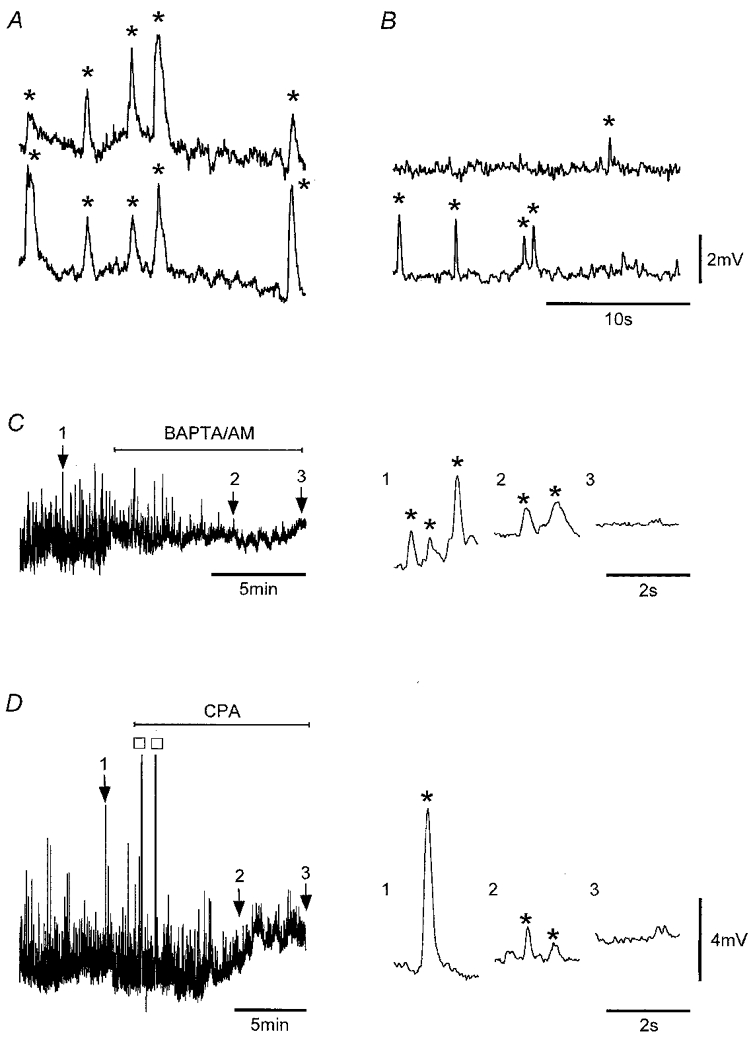
Simultaneous recordings showing STDs (*) in a strip (A) and in a tissue sheet of circular smooth muscle (B) at separations of 1.7 mm near opposite ends of the 2 mm strip and 1.5 mm in the sheet (circumferential orientation). Application of 20 μM BAPTA AM (C) and 16 μM CPA (D) to strips suppressed STD activity. Numbered arrows point to record segments shown in an expanded form on the right and exemplify the suppression of STDs. The two large responses in D (□) are truncated SWs, which appeared shortly after application of CPA. Nifedipine (1 μM) was present throughout. Vm (mV): A, −62; B, −64; C, −55; D, −58. Voltage scale bar in B also applies to A, and that in D also applies to C.
STDs were also recorded in large pyloric sheets where the circular smooth muscle layer had been carefully dissected free of the longitudinal muscle, mucosa and excessive connective tissue. STDs were often observed to occur between SWs. They were generally considerably smaller than for strips and were often difficult to discern from the baseline noise, presumably because pyloric sheets exhibited much lower input resistances. Where measurable, STDs were of similar appearance to those recorded in single bundle strips, again showing considerable variation in amplitude. They also tended to be of shorter duration, presumably because of the altered electrical properties of tissue sheets, and were obviously locally generated as they were not recorded at electrically distant sites (Fig. 1B).
STDs were unlikely to be of neural origin as they persisted in the presence of TTX (1 μM; n = 4) and atropine (1 μM; n = 4), and upon brief (1–2 min) exposure to Ca2+-free, 0.3 mM Cd2+-containing solutions (n = 5). However, they were inhibited by BAPTA AM (20 μM), a chelator of intracellular Ca2+ (n = 5; Fig. 1C), and by CPA (10–20 μM), an inhibitor of the Ca2+ store ATPase (n = 4; Fig. 1D). The inhibition was not an artifact of a large decrease in membrane resistance, which, if present, would considerably reduce the effectiveness of STICs in inducing measurable STDs. This was confirmed by measuring strip input resistance before and during application of the inhibitors. Input resistance increased to 115 ± 5 % of control (n = 5) in 20 μM BAPTA AM and decreased to 67 ± 3 % of control (n = 5) in 10–20 μM CPA, changes which while statistically significant, would not explain the near-complete inhibition of STD activity induced by these compounds. Caffeine (1 mM) also markedly decreased STD activity to 7 ± 3 % of control (n = 5), with higher concentrations (≥ 2 mM) completely inhibiting STD activity (n = 3; data not shown). By contrast, ryanodine (10–20 μM) had no effect on basal STD activity as STD frequency and amplitude were not significantly altered in these strips (n = 4). Together, these findings indicate that STDs arose through local IP3-sensitive Ca2+ release, an interpretation consistent with observations of STDs recorded in other smooth muscle preparations (Van Helden, 1991, 1993; Hashitani et al. 1996).
SWs and underlying pacemaker potentials
The onset of SWs occurred slowly in these strips. Importantly, SWs were found to consist of pacemaker and regenerative components with the pacemaker component appearing to arise through a synchronization of STDs. The sequence of activation generally observed in strips was the onset of non-synchronized STD activity followed by the formation of rhythmical pacemaker potentials which, when of sufficient magnitude, generated full SWs (Fig. 2A). The expanded records in Fig. 2A–C compare sub-threshold pacemaker potentials to SWs and exemplify the SW pacemaker and regenerative components.
Figure 2. The onset of SWs reveals pacemaker and regenerative SW components.
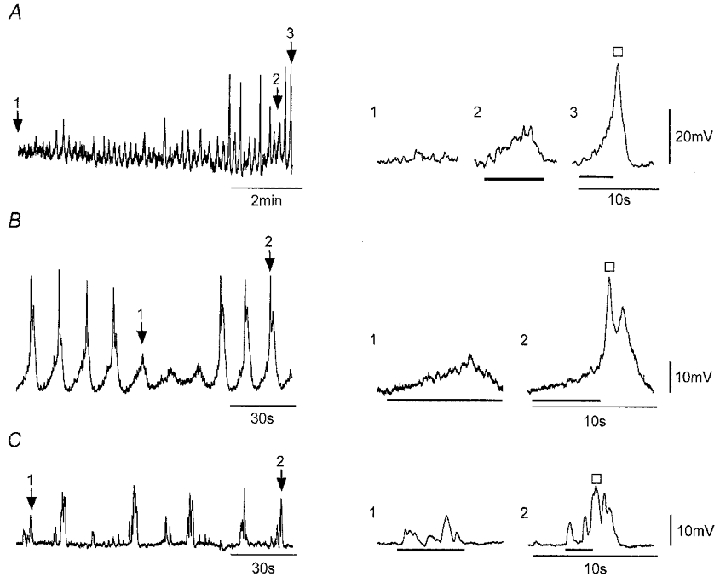
A–C, recordings of membrane potential from strips during the early onset of SW activity. Expanded records on the right correspond to record segments marked by numbered arrows and show baseline STD activity (A only), sub-threshold pacemaker potentials (bars), and SWs each composed of the rising phase of a pacemaker potential (bar) and a larger regenerative response (□). Nifedipine (1 μM) was present throughout. Vm (mV): A, −59; B, −63; C, −62.
The properties of sub-threshold pacemaker potentials were measured and compared to those of SWs recorded in the same 27 strips. Sub-threshold pacemaker potentials had a mean frequency of 0.6 ± 0.2 min−1, 20–80 % rise time of 2.5 ± 0.2 s, amplitude of 4 ± 1 mV and half-width of 4.7 ± 0.3 s, while SWs had a mean frequency of 2.5 ± 0.3 min−1, 20–80 % rise time of 0.4 ± 0.1 s, amplitude of 26 ± 1 mV and half-width of 2.2 ± 0.2 ms. The mean resting potential of these strips was −56 ± 1 mV. The maximum rate of rise of the SWs was 110 ± 10 mV s−1 and the mean membrane potential at the peak of the SWs was −31 ± 2 mV (n = 27). The regenerative component was activated 2–7 s after commencement of the pacemaker component at depolarizations in the range 5–17 mV above the resting potential.
SW ionic mechanism(s)
The inward current(s) underlying SWs was unlikely to be carried by extracellular Ca2+ entry as SWs persisted following rapid changeover to a nominally Ca2+-free solution containing 0.3 mM Cd2+. Whilst there was a tendency for SW activity to run down with time in this solution (Fig. 3Aa), the magnitude of this rundown was quite variable between tissues, and SWs in some cases showed little decrement for considerable periods (e.g. > 2 min; Fig. 3Ab). Rundown times were much greater than that required to functionally change the external solution (∼20 s; Methods). Application of Ca2+-free solution containing both Cd2+ (0.3 mM) and EGTA (0.1 mM) depolarized the strips, but SWs could persist for the entire duration of exposure to the substitute solution (i.e. 2 min; Fig. 3Ac). These data indicate that pacemaker potentials and full SWs do not arise through Ca2+ entry.
Figure 3. SWs persist upon brief exposure to Ca2+-free solutions but are inhibited by BAPTA AM and CPA.
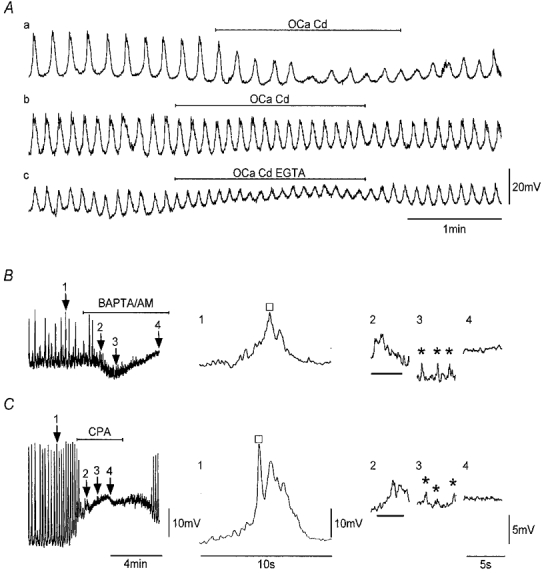
Aa and b, recordings of SWs from two strips before, during and after exposure to a nominally Ca2+-free, 0.3 mM Cd2+-containing solution. Ac, recording made in the same strip as Ab in which the Ca2+-free, 0.3 mM Cd2+ solution also contained 0.1 mM EGTA. Application of BAPTA AM (20 μM; B) and CPA (16 μM; C) as indicated inhibited SWs. The expanded records on the right correspond to record segments marked by numbered arrows. BAPTA AM and CPA sequentially suppressed the regenerative component of SWs (□), then sub-threshold pacemaker potentials (bars) followed by STDs (*). Nifedipine (1 μM) was present throughout. Vm (mV): Aa, −56; Ab and c, −54; B, −51; C, −64. Scale bars in Ac apply to all records in A. Scale bars in C apply to all respective records in B.
Another possible ionic mechanism underlying SW current(s) could be a decrease in K+ conductance, which would cause an increase in strip input resistance. However, measurement of strip input resistance during the ‘plateau’ phase of SWs indicated the opposite as the input resistance was decreased to 46 ± 7 % of control (n = 4).
The ionic basis of SWs was further investigated by replacement of either external Na+ or external Cl−. However, these experiments have so far proved inconclusive. An involvement of Cl− channels was also investigated pharmacologically, by examining the effects of both niflumic acid (NFA) and DIDS, two inhibitors of Ca2+-activated Cl− channels (Large & Wang, 1996). Application of 10, 30 and 100 μM NFA to four strips caused SW amplitude to be reduced to 81 ± 7, 75 ± 5 and 62 ± 4 % of control, respectively. Application of 100 μM NFA to three other strips completely inhibited SWs, but at this concentration NFA can have other effects (Large & Wang, 1996), including direct effects on Ca2+ release channels (Oba et al. 1996). DIDS also reduced SW amplitude with 10, 30 and 100 μM DIDS causing SW amplitudes to be reduced to 89 ± 4, 88 ± 5 and 63 ± 9 % (n = 3) of control, respectively. These pharmacological data suggest a partial involvement of Ca2+-activated Cl− channels, but whether these channels are on the plasmalemma as opposed to the sarcoplasmic reticulum (see Kourie et al. 1996) remains to be confirmed.
SW pharmacology – role of Ca2+ stores
SWs were likely to involve store Ca2+ release as the underlying pacemaker potentials were abolished by BAPTA AM (20 μM;n = 5; Fig. 3B) and by CPA (16 μM; n = 6; Fig. 3C). As shown above, this inhibition was not due to changes in membrane conductance induced by these agents. Inhibition of SWs by BAPTA or CPA was unlikely to be due to membrane depolarizations which, while they occurred, did not normally depolarize tissues to potentials positive to −45 mV, potentials at which SWs could be readily recorded under control conditions (n = 4). BAPTA AM and CPA acted by suppressing first the regenerative SW component then the underlying pacemaker component and last by blocking residual STD activity (Fig. 3B and C). The action of CPA differed from that of BAPTA AM in that the tissue was generally more depolarized by application of CPA and the inhibition was readily reversible. Recovery of SW activity upon washout of CPA followed the reverse sequence with the re-appearance of STD activity, followed by the onset of rhythmical pacemaker potentials and the triggering of regenerative responses resulting in the re-establishment of full SWs (n = 6; Fig. 3C).
Caffeine (0.3–1 mM) abolished SWs (n = 5). This action was not due to changes in the membrane properties as caffeine applied at these concentrations did not cause significant changes in either membrane potential (ΔVm < 2 mV; n = 5) or strip input resistance (ΔRin < 10 %; n = 5). A major role for ryanodine-sensitive receptor-mediated activity in the generation of SWs was unlikely, as SWs persisted in the presence of ryanodine (10–20 μM; 20–30 min exposure; n = 4). Application of caffeine (1 mM) for 2–5 min during exposure to the ryanodine-containing solution transiently inhibited SW activity (n = 2), with the SWs re-appearing after caffeine removal.
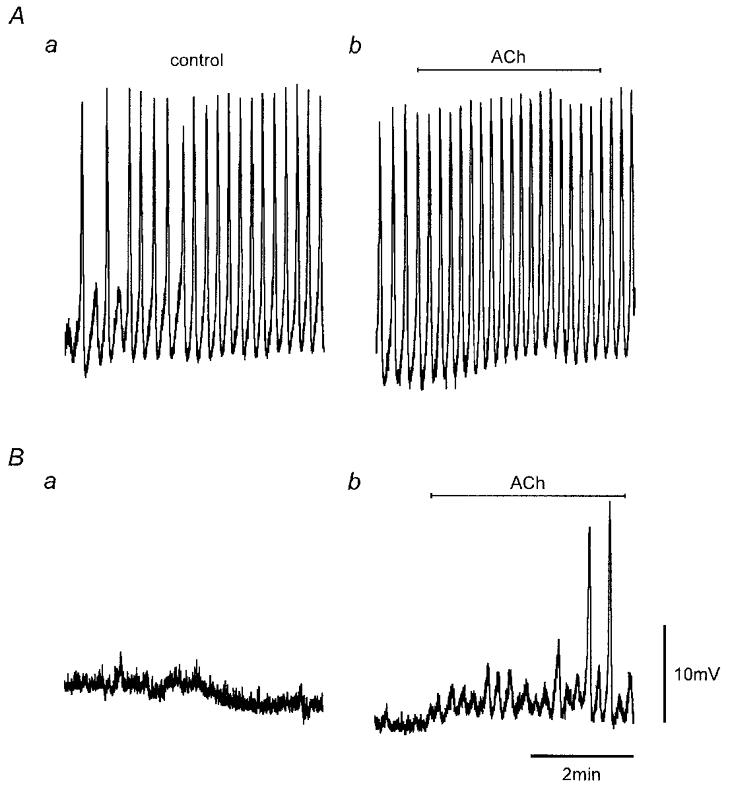
ACh caused the initiation and/or enhancement of SW activity with the extent of potentiation dependent on the initial SW frequency. Figure 4 shows recordings from two strips which had no initial SW activity but in which SW activity was induced by application of 0.1 μM ACh. Application of similar concentrations of ACh had relatively less effect on tissues where the SW frequency was already high (e.g. Fig. 5Ab; 0.1 μM ACh increased the frequency from 4.5 to 5 min−1). This enhancement was by stimulation of muscarinic receptors, as the effects of ACh were inhibited by 1 μM atropine (n = 3). Application of ACh to tissues exhibiting no SW activity initially caused an increase in STD activity, with ACh (0.05–0.1 μM) increasing the frequency of STDs (e.g. pacemaker potentials) to 240 ± 30 % of control (n = 6; Fig. 4A and B). This increase in STD frequency was not an artifact due to changes in strip conductance as these relatively low concentrations of ACh did not significantly alter the strip input resistance (ΔRin < 10 %; n = 6). Pacemaker potentials, composed of summations of STD-like events, then evolved with larger pacemaker potentials associated with the generation of full SWs (n = 10; Fig. 4A and B). This sequence of events parallels observations associated with the onset of SWs and the recovery from either CPA (Fig. 3C) or caffeine (not shown).
Figure 4. ACh induces SWs.
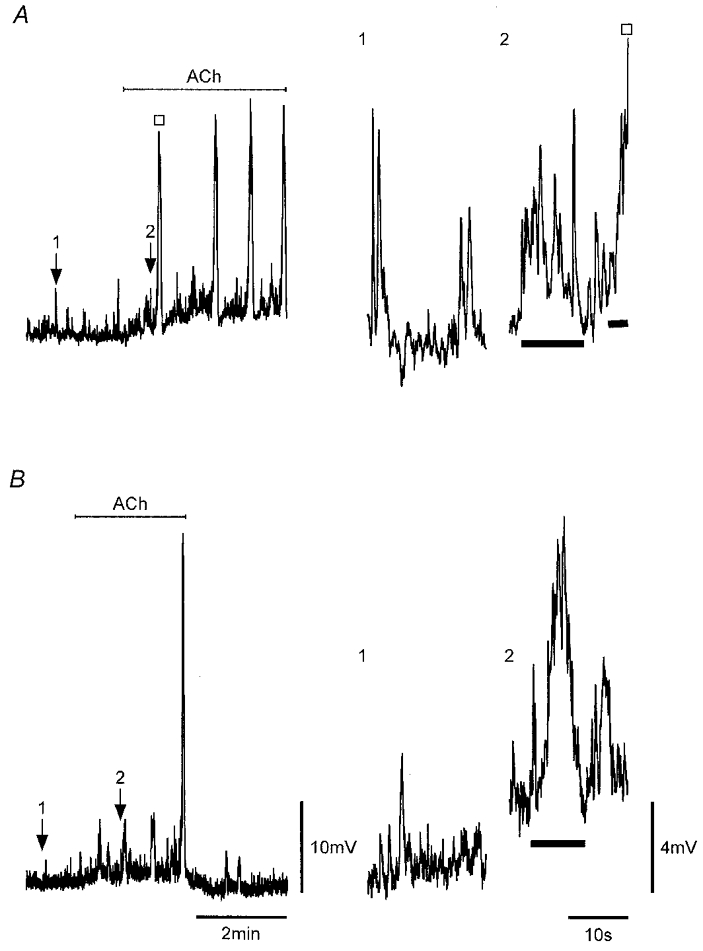
A and B, application of 0.1 μM ACh, as indicated, to strips that showed only STD activity sequentially caused an increase in STD activity, the formation of pacemaker potentials and full SWs (□). Numbered arrows indicate expanded regions on the right showing STD activity before ACh and STD/pacemaker potential activity (bars) shortly after application of ACh in each strip. Nifedipine (1 μM) was present throughout. Vm (mV): A, −59; B, −72. Scale bars in B apply to all respective records.
Figure 5. Inhibition of SWs by heparin.
Electrical activity recorded from heparin-loaded and control strips (Methods). Recordings were obtained simultaneously from the two strips in the same perfusion chamber. SW activity was present in physiological saline in the control strip (Aa) but not in the heparin-loaded strip (Ba) 85 min after commencement of recordings. Addition of 0.1 μM ACh, as indicated, 3 h after commencement of recordings caused a small increase in SW frequency in the control strip (Ab) and induced the onset of SW activity in the heparin-loaded strip (Bb). Nifedipine (1 μM) was present throughout. Vm (mV): A, −59; B, −51. Scale bars in B apply to all records.
Muscarinic receptor activation has been shown to be coupled to the synthesis of IP3 (see Berridge, 1993), and hence one possible explanation for the action of ACh on spontaneous electrical activity is an increase in intracellular IP3-sensitive Ca2+ release. This was tested by loading the cellular syncytium of strips with heparin, a known inhibitor of IP3 receptors (Somlyo et al. 1985; Ehrlich & Watras, 1988), using a reversible permeabilization procedure (Methods). Heparin loading completely prevented (n = 3; Fig. 5Aa and Ba) or markedly delayed (n = 1) the onset of SW activity compared to size- and protocol-matched controls (duration of experiments 2–4 h; Vm −56 ± 2 mV in control strips, −57 ± 1 mV in test strips; n = 4). Figure 5 compares representative recordings made simultaneously using two electrodes, one recording from a heparin-loaded strip (Fig. 5B) and the other from a protocol-matched (no heparin) control strip (Fig. 5A) in the same bath. Pacemaker potentials and full SWs were observed in the control strip with pacemaker potentials first observed 65 min and full SWs (Fig. 5Aa) 85 min after the commencement of recording. Pacemaker potentials and SWs did not occur in the heparin-loaded strip over the recording session under control conditions (duration 3 h; Fig. 5B a). However, application of ACh (0.1 μM), at the end of this session, induced pacemaker activity and the generation of SWs in the heparin-loaded strip (Fig. 5B b). This suggests that ACh-induced IP3 synthesis could competitively overcome the heparin-associated inhibition, an inhibition which has been shown to be dose dependent (Hamada et al. 1993).
SW voltage dependence
SWs persisted over a wide range of membrane potentials (e.g. −47 to −83 mV; Fig. 6A and B). Changing the membrane potential to more negative potentials increased SW amplitude but had little effect on the maximum SW depolarization, indicating that absolute SW amplitude is likely to be set by currents with a fixed reversal or null potential, which for the SWs shown in Fig. 6 was about −30 mV. Another observed characteristic of SWs was the threshold potential for the generation of regenerative responses. This shifted depending on absolute membrane potential without a compensatory change in the size of the pacemaker potential. Analysis of the data of Fig. 6B indicates the thresholds for activation of the regenerative responses at −69 and −83 mV were −63 ± 1 mV (n = 10) and −77 ± 1 mV (n = 4), respectively, with corresponding pacemaker potentials of 6 ± 1 mV in both cases.
Figure 6. Effect of membrane holding potential on SWs and reversal of the hyperpolarization-induced inhibition by ACh.
Spontaneous electrical activity (upper traces) recorded in a strip sequentially polarized to membrane potentials near −63, −69 and −58 mV (A) and in the same strip at sequential potentials near −69, −83, −69 and −47 mV (B). C, electrical activity recorded in a strip held at −77 mV before, during and after application of 0.1 μM ACh. Numbered arrows point to regions shown in an expanded form on the right which show sub-threshold pacemaker potentials (bars) and SWs, each composed of the rising phase of a pacemaker potential (bar) and a larger regenerative response (□). Nifedipine (1 μM) was present throughout. Vm (mV): A and B, −69 mV; C, −56 mV.
Absolute membrane potential also markedly influenced the frequency of SW activity with SW frequencies of 7, 5 and 1 min−1 in a strip at membrane potentials of −47, −69 and −83 mV, respectively (Fig. 6B). The marked reduction of SW frequency at more negative potentials was associated with pacemaker activity becoming increasingly irregular and more variable in amplitude such that the threshold for regenerative activity was reached less frequently. Examination of pacemaker potentials suggested that these arose through a synchronization of STD-like activity, which weakened at more negative potentials. Similar effects of membrane voltage were observed in three other strips. Weakening of pacemaking with hyperpolarization could be counteracted by addition of ACh. Figure 6C demonstrates this for a strip hyperpolarized to −77 mV and shows that the relative success of pacemaker potentials in generating full SWs was enhanced upon addition of 0.1 μM ACh. The expanded records in Fig. 6C compare a sub-threshold pacemaker potential in control and during washout of ACh and SWs before and during application of ACh. Inspection of these records suggests that pacemaker potentials are composed of summations of STDs with ACh enhancing this activity by recruiting more, increasing the size and/or improving the synchronization of these elementary events. Therefore application of ACh appears to reverse the inhibitory effects of hyperpolarization.
Voltage-induced ‘action potentials’
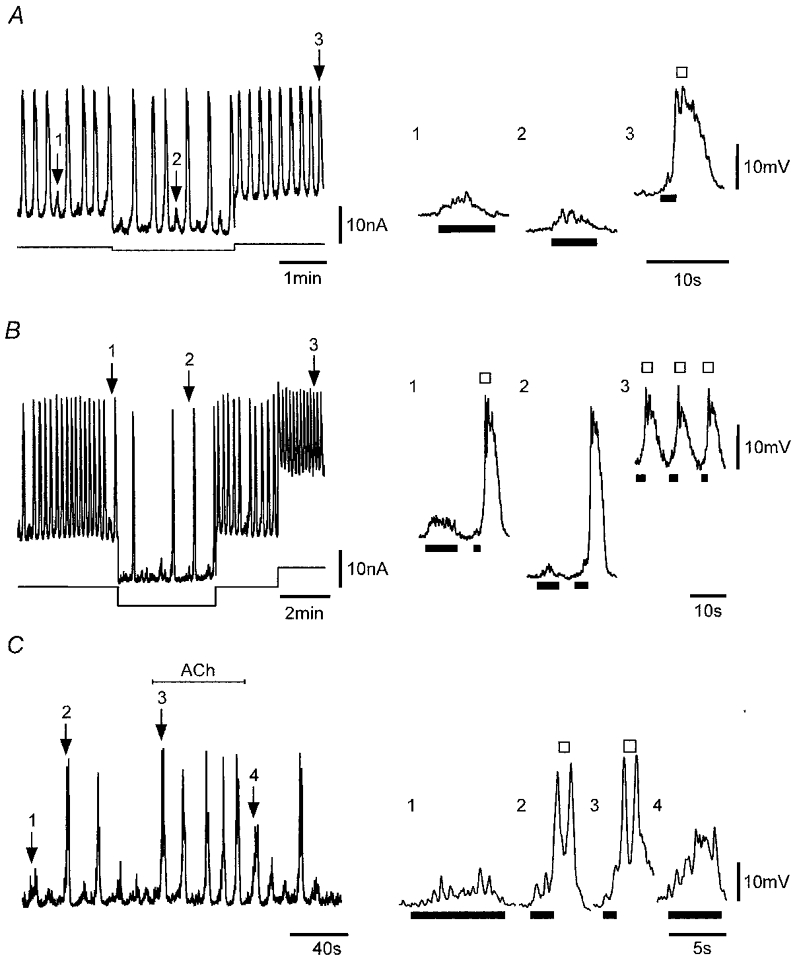
The regenerative nature of SWs was further investigated by injection of current pulses into muscle strips. Currents of small amplitude induced passive depolarizations. However, the passive depolarizations associated with larger current injections induced three forms of voltage response (Fig. 7A). The first type, referred to as the ‘initial’ response, was activated by 5–10 mV depolarizations and often appeared as a summation of STDs superimposed on the passive depolarization. The second type, referred to as the ‘regenerative’ response, was activated during larger passive depolarizations (e.g. > 10 mV). These responses occurred both in the absence and in the presence of the L-type Ca2+ channel antagonist nifedipine (1 μM). By contrast, the third response, brief voltage spike(s) that appeared superimposed on the regenerative response, was only observed in nifedipine-free solutions (Fig. 7A). These spikes were indistinguishable from those occasionally observed superimposed on STDs or SWs in nifedipine-free solutions (see above).
Figure 7. Voltage-induced responses.
A, voltage responses to passive depolarization, induced by injection of current pulses of variable amplitude, before (a) and during application of 1 μM nifedipine (b). Sub-threshold initial responses (bars) appear to be composed of closely grouped STDs (*). The slow regenerative response (□) and the spike (+) occurred in response to the larger depolarization with only the slow regenerative response recorded during application of 1 μM nifedipine. All traces are from the same continuous recording. B–D, responses induced by application of depolarizing current pulses or consequent to brief pre-hyperpolarizing pulses in nifedipine (1 μM). Arrows indicate sequential responses shown in an expanded form on the right and exemplify the initial depolarizations (bars) and regenerative responses (□). The ‘plateau’ phase of the regenerative response was complex showing large voltage fluctuations. Lower traces indicate current protocols. Traces in B and C are from the same continuous recording. Vm (mV): Aa, −61; Ab, −59; B and C, −62; D, −58. Scale bars in D apply to all respective records in B and C.
The initial and regenerative responses could be induced by positive changes in membrane potential applied by current injection either at the resting potential or from hyperpolarized potentials consequent to a brief hyperpolarizing pulse (Fig. 7). The ability of positive voltage changes to initiate responses was dependent on the magnitude of the potential change, for both depolarizations initiated at the resting potential (Fig. 7A and B) and depolarizations initiated from more negative membrane potentials (Fig. 7C and D). However, initiation of responses by the pulse protocol shown in Fig. 7C required that the preceding conditioning hyperpolarization be of sufficient duration (Fig. 7D). Initial responses always exhibited considerable fluctuations in membrane potential. Super-threshold responses usually exhibited both initial and regenerative responses with the initial response preceding the regenerative response, though in some cases the two activities merged.
Effects of holding potential on voltage-induced responses
Initial and regenerative responses were not triggered at a set voltage threshold, as they could be evoked over a wide range of membrane potentials. Responses shown in the expanded traces of Fig. 8 had initial responses evoked at membrane potentials of −82, −68 and −61 mV with corresponding regenerative responses activated consequent to depolarizations of 7, 6 and 1 mV, respectively. While responses could be evoked over a wide range of potentials the probability of initiating a regenerative response was usually decreased at more hyperpolarized potentials, as is evident in Fig. 8A where the first pulse applied at −82 mV failed to initiate a regenerative response.
Figure 8. Effect of membrane holding potential on voltage-induced responses.
A, responses elicited at membrane potentials of −82, −68 and −61 mV. Lower trace shows the current protocol used. B, expanded record segments corresponding to regions of A marked by numbered arrows with traces aligned according to absolute membrane potential and symbols denoting the initial (bar) and regenerative responses (□). Nifedipine (1 μM) was present throughout. Vm, −68 mV.
Voltage-induced responses of strips showed considerable latency between the onset of the stimulus (i.e. depolarization) and the commencement of the response. The latency for the initial response typically ranged between 0.3 and 4 s (n = 38) whereas the latency of the regenerative response, being triggered during the initial response, was generally longer (typical range 0.5–7 s). The latencies showed a marked voltage dependence, being shorter when pulsing to more depolarized potentials (Figs 7A and B, and 8B). The mean latency of the initial response for six strips pulsed from about −60 to −50 mV was 1.4 ± 0.1 s compared to 3.1 ± 0.3 s when pulsing from about −70 to −60 mV. The latency of the regenerative response was also voltage dependent, with depolarization decreasing the latency such that in some cases the onset of the initial and regenerative responses were co-incident (Figs 7A and B, and 8B).
Characteristics of the initial and regenerative voltage-induced responses
A sequence of voltage-induced responses with stimulus conditions set near the threshold for activation of regenerative responses is shown in Fig. 9A. The initial response again appeared to be composed of summations of STDs (Fig. 9Ab and Ac). Recordings obtained in 10 strips including that of Fig. 9 were analysed. Larger sub-threshold initial responses evoked at the resting potential (mean −60 ± 2 mV) exhibited a mean latency of 1.2 ± 0.2 s, 20–80 % rise time of 2.7 ± 0.4 s, amplitude of 10 ± 1 mV and half-width of 3.7 ± 0.4 s. Super-threshold initial responses were activated with a mean latency of 1.2 ± 0.1 s and reached threshold at 11 ± 1 mV, which, based on the mean 20–80 % rise time taken to reach this potential of 1.5 ± 0.2 s, predicts a maximum amplitude of ∼20 mV. Resultant regenerative responses had a mean latency of 3.4 ± 0.3 s, maximum rate of rise of 92 ± 11 mV s−1, amplitude of 31 ± 2 mV and half-width of 2.6 ± 0.4 s.
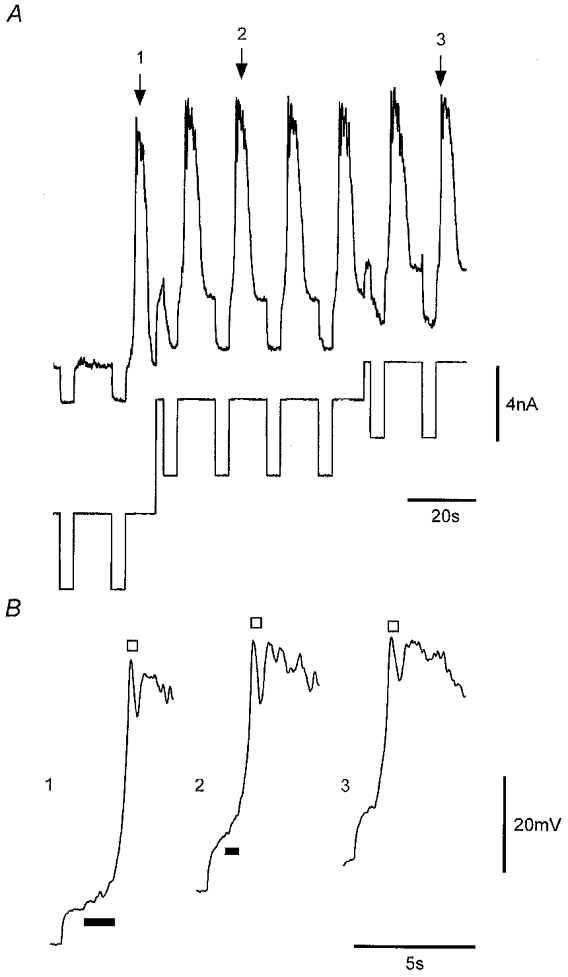
Figure 9. Effect of repetitive stimulation near threshold or at supramaximal levels at different interpulse intervals.
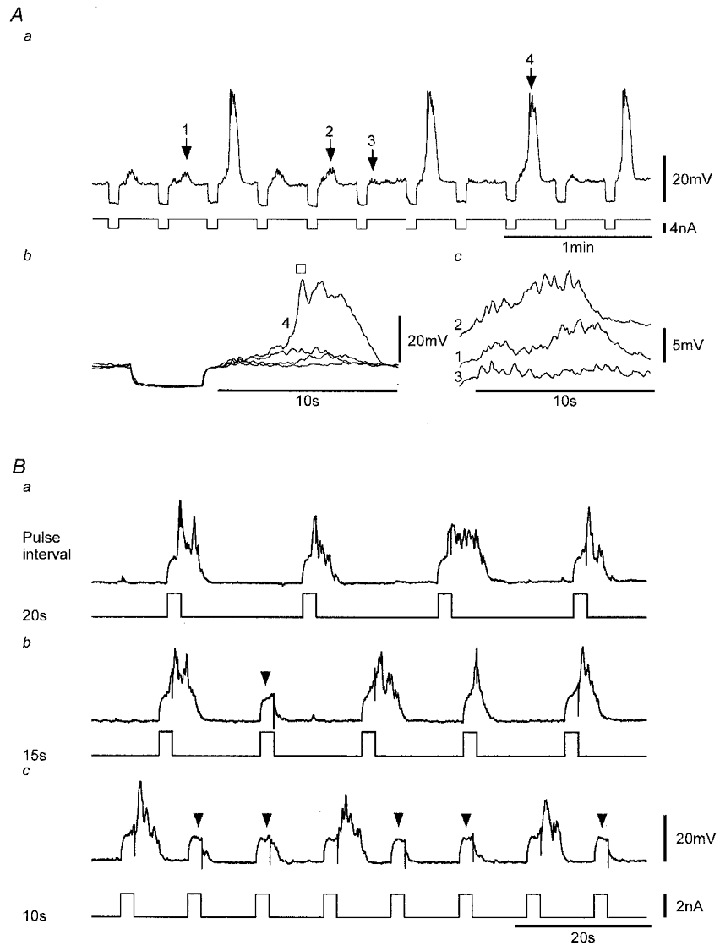
Aa, voltage responses (upper trace) elicited upon cessation of conditioning hyperpolarizations induced by repetitive application of brief current pulses (lower trace). Ab, expanded voltage record segments corresponding to regions of the record in Aa marked by numbered arrows with traces 1–3 exemplifying sub-threshold initial responses and trace 4 a larger initial response and a ‘triggered’ regenerative response (□). Ac, expanded records of the three sub-threshold responses shown in Ab with traces offset for clarity. B, repetitive activation of regenerative responses (upper traces) induced by brief current pulses (lower traces) applied at interpulse intervals of 20, 15 and 10 s (same continuous recording). Arrowheads mark passive depolarizations where there were no regenerative responses and a minimal initial response. Nifedipine (1 μM) was present throughout. Vm (mV): A, −69; B, −59 mV.
Effects of interpulse interval on voltage-induced responses
The initial and regenerative responses exhibited considerable variability both within and between strips, even for the same current/voltage stimulus. Part of the variability was due to responses exhibiting a long refractory period. This period of inactivation was readily demonstrated by inducing responses using large super-threshold pulses applied at short interpulse intervals. As shown in Fig. 9B, regenerative responses were reliably produced at an interpulse interval of 20 s, but a relative refractory period became evident at 15 s with current pulses inducing passive depolarizations which occasionally failed to evoke regenerative responses. Further shortening of the interpulse interval to 10 s exposed an absolute refractory period, with both the initial and regenerative responses now regularly absent. This type of inactivation was always observed, irrespective of the membrane potential at which the responses were evoked. The effect was quantified in six strips using a similar protocol to that in Fig. 9B but including higher frequency stimulation. The absolute refractory period, measured as the mean interval at which pulse failures were first observed was 11 ± 2 s (n = 6).
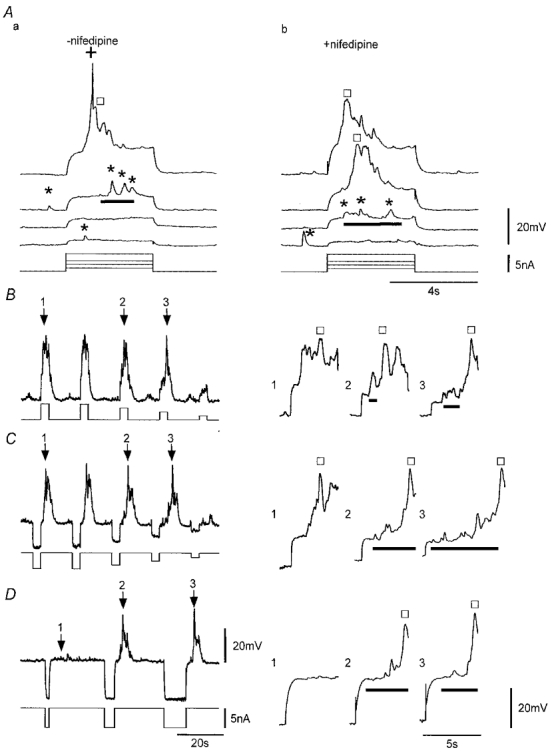
Pharmacology of voltage-induced responses – role of Ca2+ stores
The initial and regenerative voltage-induced responses showed a pharmacology that was indistinguishable from that of SWs. The voltage-induced responses did not result from a Ca2+ current as they could be evoked in nominally Ca2+-free Cd2+-containing solution (n = 4). The records in Fig. 10A show voltage-induced responses before and after 0.1 and 2 min exposure to Ca2+-free Cd2+-containing solution. As with SWs, there was a rundown of the responses in this solution; however, responses in some strips lasted at least 10 times longer than the time for functional ionic replacement (Methods).
Figure 10. The effects of Ca2+-free Cd2+-, BAPTA AM- and CPA-containing solutions on voltage-induced responses.
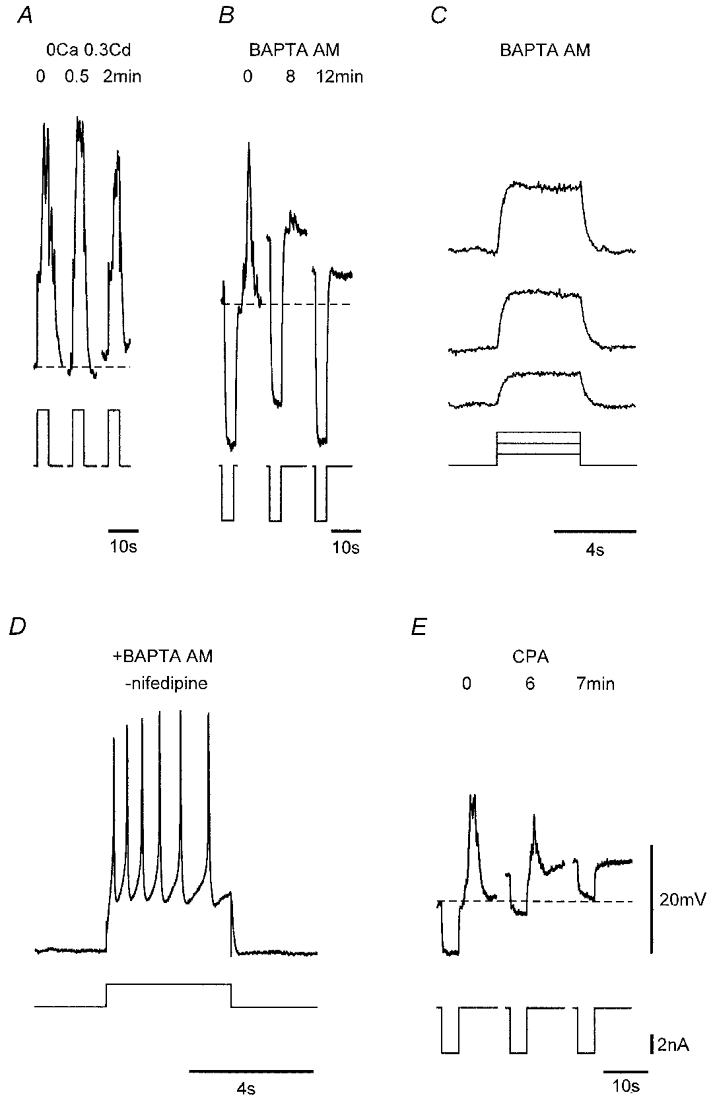
A, voltage responses (upper traces) to current injection (lower traces) before and during brief exposure to nominally Ca2+-free physiological saline containing 0.3 mM CdCl2. Responses of a strip prior to and during application of 20 μM BAPTA AM (B) and after 13 min exposure to BAPTA (C), and in another strip after 25 min exposure to this same solution but in the absence of nifedipine (D), depolarization now inducing repetitive L-type Ca2+ channel-mediated spikes. E, responses of a strip prior to and during application of 16 μM CPA. Dashed lines in a, b and E denote control Vm for each strip. Nifedipine (1 μM) was used throughout except for D. Vm (mV): A, −61; B, −53; C, −50; D, −61; E, −50. Voltage and current scale bars in E apply to all respective records.
Evidence for an involvement of intracellular Ca2+ stores in these responses was the finding that responses were blocked by addition of BAPTA AM (20 μM) to the nifedipine-containing physiological saline (n = 5; Fig. 10B). BAPTA AM blocked both the initial and regenerative responses, irrespective of the magnitude of the voltage stimulus (Fig. 10B and C). By contrast, BAPTA had no effect on fast L-type Ca2+ channel-mediated spikes, which were readily initiated in BAPTA-loaded strips in the absence of nifedipine (Fig. 10D). A further indication that Ca2+ stores underlie both the initial and regenerative responses was provided by the finding that application of the endoplasmic reticulum/sarcoplasmic reticulum Ca2+-ATPase inhibitor CPA (10–20 μM) abolished voltage-induced responses (n = 5; Fig. 10E).
The nature of the intracellular Ca2+ stores involved in voltage-induced responses was further investigated. Caffeine (1 mM) inhibited the initial and regenerative voltage-induced responses (n = 5; Fig. 11A and B) without a significant change in membrane potential or strip input resistance (see above). By comparison, voltage-induced responses persisted in the presence of ryanodine (10–20 μM) even after 15–30 min exposure during which the tissues were repetitively stimulated every 15–30 s (n = 4; Fig. 11A and B). The initial response to depolarization was not obviously altered by ryanodine with the latency of the initial response not significantly changed (n = 3). By comparison, the latency for onset of the regenerative component was reduced to 60 ± 10 % of control (n = 3), an effect presumably due to increased excitability in the presence of ryanodine which, in some cases, led to the responses being more active such that the initial and regenerative responses merged (Fig. 11A). However, in these cases, reduction in the amplitude of the stimulus and/or hyperpolarization always revealed the initial response (not shown).
Figure 11. Effects of caffeine, ryanodine, ACh and heparin on voltage-induced responses.
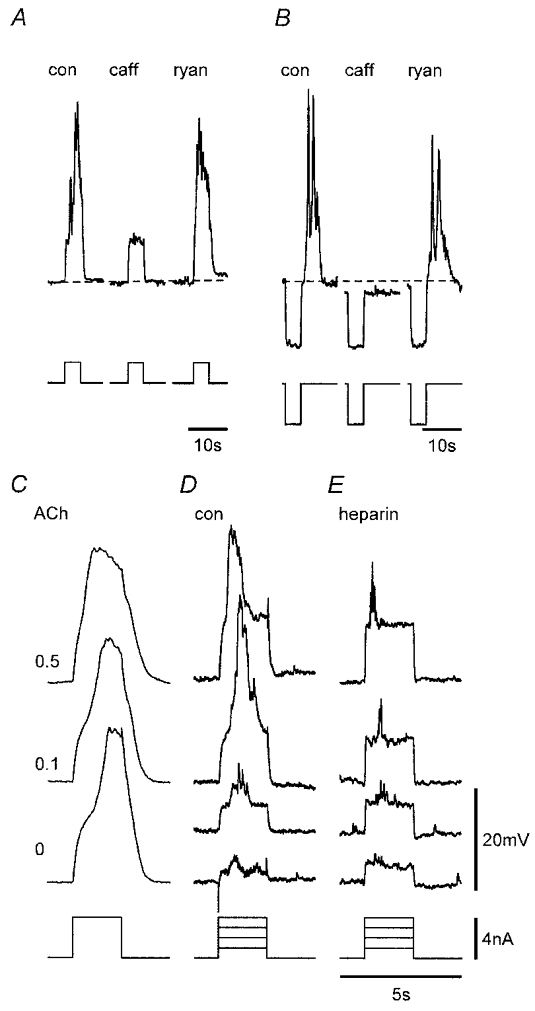
A and B, caffeine (caff, 1 mM) applied to two strips reversibly and rapidly (both records < 1 min in caffeine) inhibited the initial and regenerative responses, whereas responses persisted after 20 and 25 min exposure to 16 and 20 μM ryanodine (ryan), respectively. Dashed lines denote Vm in control (con) for each strip. C, responses in control, 0.1 and 0.5 μM ACh (records are the mean of 6–9 responses from a continuous recording in the same strip). D and E, voltage-induced responses in paired control (D) and heparin-loaded (E) strips. Nifedipine (1 μM) was present throughout. Vm (mV): A, −60, B, −63, C, −62, D, −59, E, −51. Voltage (upper records) and current (lower records) scale bars in E apply to all respective records. Time bar in E also applies to C and D.
ACh was found to enhance the excitability of the tissues so that responses were more readily induced by voltage stimulation. Evidence for this is presented in Fig. 11C which shows the mean of seven to eight responses to repetitive depolarizing pulses applied every 20 s in the presence of increasing concentrations of ACh. Regenerative responses obtained in the presence of ACh had longer durations dependent on ACh concentration. ACh (0.05–0.1 μM) also reduced the latency of both the initial and regenerative responses to 70 ± 5 and 75 ± 9 % of control, respectively (n = 5), with the effect more pronounced at higher concentrations. These actions of ACh were inhibited by application of 1 μM atropine (n = 3; not shown). The role of IP3 receptor-operated Ca2+ stores was further investigated using heparin to block these receptors. Voltage-induced responses in heparin-loaded strips were found to be markedly inhibited compared to those in protocol-matched control strips with reduction of the initial response and abolition of the regenerative response (n = 3; Fig. 11D and E). The finding that a weak initial response could still be generated in heparin-loaded tissues is consistent with the heparin loading being marginal as indicated for SWs (Fig. 5). Thus, if membrane depolarization acts by increasing functional levels of IP3, then this could compete with non-saturated levels of heparin to cause some activation of IP3 receptors.
Together, these data are consistent with the hypothesis that the voltage-induced action potentials arise through Ca2+ release from IP3-sensitive stores and indicate that membrane depolarization acts by increasing the concentration of intracellular IP3 possibly by directly enhancing phospholipase C (PLC) (Fig. 12).
Figure 12. Components proposed to underlie the generation of the SW action potential.
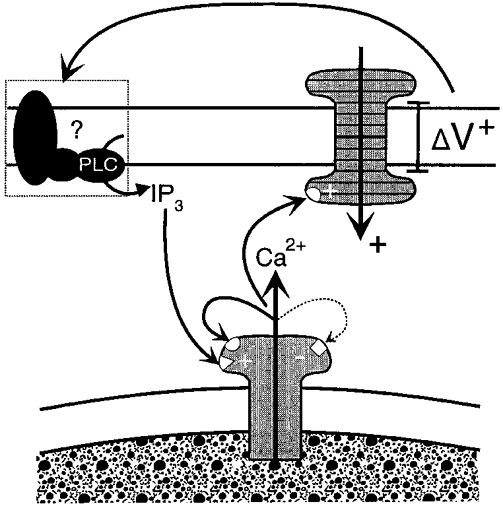
The schema presented here shows a positive voltage change (ΔV+) across the cell membrane acting at an unknown functional site(s) such as agonist receptors, G proteins or PLC to activate PLC and initiate synthesis of IP3. IP3 activates IP3 receptor-operated Ca2+ release channels in the sarcoplasmic reticulum, with the Ca2+ activating a Ca2+-activated inward current across the plasmalemma, causing further depolarization. Both IP3 and Ca2+ release can activate adjacent Ca2+ release channels which above threshold levels can initiate regenerative Ca2+ release and a resultant action potential. This process is likely to be terminated by high Ca2+ concentrations acting on the low affinity inhibitory site (-) of the IP3 receptor.
Comparison of SWs with voltage-induced action potentials
The data obtained so far indicate that SWs and voltage-induced action potentials are the same events differing only in the manner in which they are activated. Further proof for this is provided in Fig. 13. Here, a comparison is made between SWs and voltage-induced action potentials as recorded in a strip in which SWs occurred at low frequency (1 μM nifedipine present throughout). The voltage-induced initial and regenerative responses exhibited waveforms that were indistinguishable from the respective pacemaker and regenerative components of the SW (Fig. 13A and B). Sub-threshold spontaneous pacemaker potentials were also indistinguishable from sub-threshold voltage-induced initial responses (Fig. 13C and D). The finding that SWs and voltage-induced action potentials were indistinguishable, both exhibiting ‘priming’ components which appear to be necessary for induction of the regenerative component, links the two events beyond simply sharing the same regenerative mechanism. The data indicate that SWs and voltage-induced SW-like action potentials are the same events, the latter produced by membrane depolarization presumably through enhanced production of IP3, an action that can also increase the frequency of SWs.
Figure 13. Comparison of spontaneous and voltage-evoked activities.
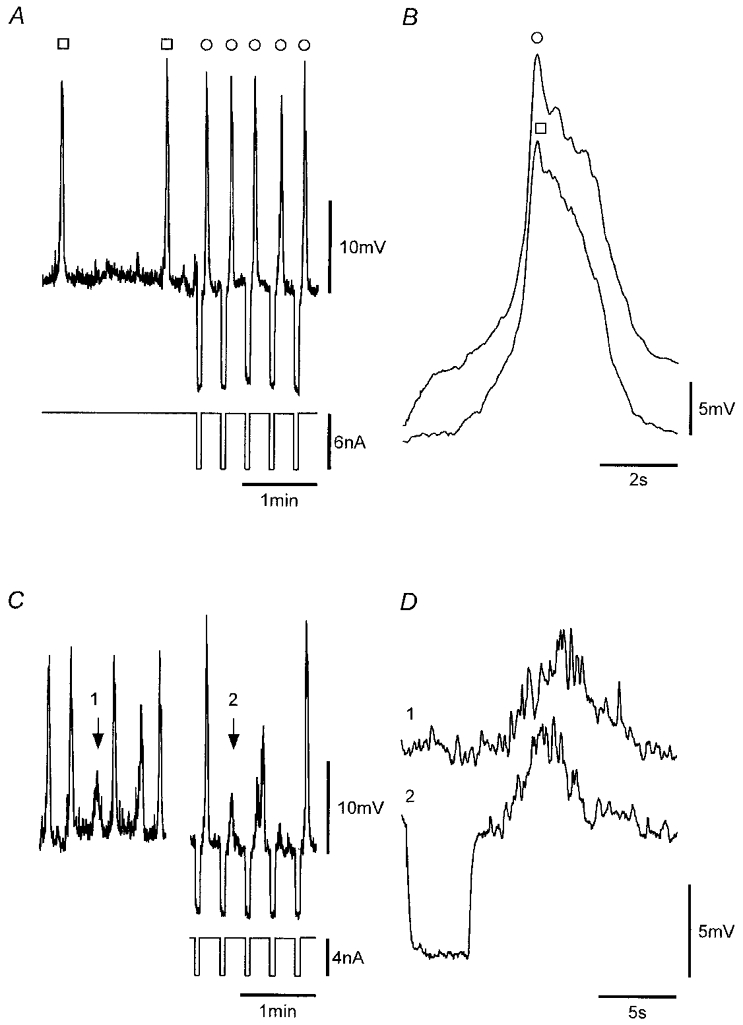
A, recordings from a strip that exhibited SWs (□) at low frequency in which nifedipine-insensitive action potentials (○) were induced by application of hyperpolarizing pulses. B, mean of seven voltage-induced action potentials (○) and eight SWs (□). C, comparison of a sub-threshold pacemaker potential (arrow 1) and a sub-threshold voltage-induced initial response (arrow 2). D, numbered records of C presented in an expanded form. All records were obtained from the same continuous recording. Nifedipine (1 μM) was present throughout. Vm, −53 mV.
DISCUSSION
This study has examined spontaneous and voltage-induced electrical activity in small muscle strips from the guinea-pig gastric pylorus. The events of particular interest to this study were STDs, SWs and voltage-induced SW-like action potentials, activities that were found to be inter-related.
STDs
STDs were apparently random events generated at various local sites. They probably arose through Ca2+ release from intracellular Ca2+ stores as they persisted in TTX and nifedipine, and upon brief exposure to Ca2+-free Cd2+-containing solution, and were blocked by BAPTA AM and CPA. This interpretation is in agreement with reports of STDs/STICs in other smooth muscles (Introduction). An insensitivity to ryanodine and inhibition by caffeine suggest that the STDs arose through activation of IP3-sensitive Ca2+ release channels. Caffeine has been shown to directly inhibit IP3 receptors (Ehrlich & Watras, 1988) and to increase cAMP (Beavo & Reifsnyder, 1990). STD activity was also enhanced by stimulation of muscarinic receptors, which is known to increase synthesis of IP3 (see Berridge, 1993).
STDs exhibited marked variability in amplitude ranging from immeasurable amplitudes (i.e. < 1 mV) to amplitudes of about 10 mV. The magnitude of STICs, estimated from the mean size of measurable STDs and the input resistance of muscle strips, was about 1 nA. This estimate of mean STIC amplitude is similar to that found in other syncytial smooth muscles (Van Helden, 1991, 1993) and is much larger than reported for STICs in isolated smooth muscle cells, where the amplitudes are typically less than 0.1 nA (Wang et al. 1992). Therefore, syncytial STICs may be activated by Ca2+ release from many stores, as could result if Ca2+ release occurred across an entire cell or small group of cells (see Gordienko et al. 1998).
SWs in small muscle strips
Small strips obtained from single bundles of the circular smooth muscle layer of the gastric pylorus often exhibited SWs. These were composed of two components, termed the pacemaker and regenerative components, a finding consistent with observations of SWs in other visceral smooth muscles (see Tomita, 1981). The pacemaker component established rhythmicity with larger pacemaker potentials associated with activation of the regenerative component. SWs persisted in the presence of nifedipine, which was used throughout the study to avoid activation of L-type Ca2+ channels – channels which if left unblocked could produce brief spikes and generally caused contraction during SWs.
A characteristic feature of SWs in the gastric pylorus strips was the time required for them to appear following dissection. The onset of SWs could also be induced in ‘quiescent’ strips by application of agonists such as ACh which are known to enhance synthesis of IP3. The onset of SW activity first involved an enhancement of the frequency and/or size of STDs. The next step was the formation of pacemaker potentials. Our observations from numerous experiments indicate that the SW pacemaker component arose by a rhythmical synchronization of STD activity, as also suggested in other smooth muscles (Van Helden, 1993; Hashitani et al. 1996; Van Helden et al. 1996; Hashitani & Edwards, 1999). Threshold levels of such activity led to the triggering of the regenerative component of the SW, an activity likely to result through CICR, as SWs exhibited a similar pharmacology to STDs, indicating a primary role for Ca2+ release from IP3-sensitive stores. Physiological experiments were also consistent with SWs arising through Ca2+ release from stores and not through voltage-dependent channels as both pacemaker and regenerative components of SWs occurred over a wide range of potentials, there being no set voltage threshold for triggering of the regenerative component.
Voltage-induced SW-like action potentials
The possibility that the SW regenerative component involved activation of voltage-dependent channels was directly investigated by membrane polarization experiments. Voltage pulses applied in the presence (or absence) of a blocker of L type Ca2+ channels generated SW-like action potentials (SWAPs). These were indistinguishable in pharmacology, dependence on membrane holding potential and waveshape from SWs. Importantly, SWAPs, like SWs, were composed of two components termed the ‘initial’ and ‘regenerative’ responses and showed a pharmacology that was indistinguishable from that of SWs.
The waveform of the SWAP initial response, as for the SW pacemaker component, showed considerable variability in amplitude, appearing to arise through summation of STDs, and was estimated to exhibit a maximum amplitude of about 20 mV. However, such peak amplitudes were never achieved as regenerative responses were activated during initial responses when the latter reached depolarizations that, where measurable, ranged between about 5 and 15 mV. The SWAP initial and SW pacemaker components had 20–80 % rise times of about 3 s and half-widths of about 4 s at a membrane potential of about −60 mV. The SWAP and SW regenerative responses were also indistinguishable, both often exhibiting complex ‘plateau’ phases with two or more peaks, reaching peak depolarizations at absolute membrane potentials of about −30 mV and exhibiting maximum rise rates and half-widths of approximately 100 mV s−1 and 2.5 s, respectively.
The physiological data, like the pharmacological data, indicate that SWAPs arise from Ca2+ release from the sarcoplasmic reticulum, which induces inward plasmalemmal current. Our evidence for this is as follows. First, SWAPs were composed of initial and regenerative components whereas a mechanism based solely on voltage-dependent channels would be expected to only exhibit the regenerative component. Second, SWAPs showed very long latencies particularly for marginal levels of stimulation or at more negative potentials (e.g. 3 s at ∼−60 mV), an observation that is consistent with second messenger-generated responses but is inconsistent with a mechanism based on voltage-dependent channels. Third, SWAPs could be generated over a wide range of strip holding potentials without the requirement for a set voltage threshold for triggering of the regenerative component. Fourth, SWAPs exhibited a very long refractory period of about 10 s, a value that is consistent with the time for refilling Ca2+ stores (Berridge, 1993) but not with the refractory periods for voltage-dependent channels, which are much shorter. For example, the refractory period of L-type Ca2+ channels in the strips was at least an order of magnitude shorter (Fig. 10D).
These findings indicate that membrane depolarization recruits STDs to generate an initial depolarization, which can trigger a regenerative response, mediated by release of Ca2+ from intracellular stores. The properties of this latter response have also recently been investigated in the guinea-pig gastric antrum (Edwards et al. 1999; Suzuki & Hirst, 1999), with the findings supporting the hypothesis that membrane depolarization can cause regenerative recruitment of more elementary STD-like events which were referred to as ‘unitary potentials’. These probably arose from release of Ca2+ from intracellular stores and dominated the voltage noise of the resting membrane potential. It was shown that the spectral density of the voltage-activated regenerative response and the regenerative component of the SW exhibited the same spectral characteristics as those of the resting membrane potential. These observations suggested that the voltage-activated regenerative potential, or the second component of the SW, was made up of a cluster of discrete depolarizations rather than from activation of voltage-dependent ion channels. Our data indicate this same conclusion and also present evidence that the voltage-induced initial component and the pacemaker component of SWs derive from a recruitment of such STD-like events.
The two-component nature of the response shown by our studies together with the physiological and pharmacological properties, indicate that membrane depolarization increases IP3 receptor-mediated Ca2+ release presumably by increasing synthesis of IP3. This process is independent of extracellular Ca2+ in the short term, but is dependent on extracellular Ca2+ in the longer term, possibly reflecting a need to refill Ca2+ stores. The observations are consistent with the hypothesis that SWAPs are likely to be the same as SWs, both arising by Ca2+ release from intracellular IP3 receptor-operated stores and differing only in their pathway of activation, one generated by membrane depolarization-induced recruitment of more elementary Ca2+-release events and the other generated spontaneously by rhythmic synchronization of this same activity.
The SW pacemaker mechanism
One of the outstanding questions about spontaneous synchronicity is how the SW pacemaker component evolves to have characteristics that closely parallel those of the initial component of the SWAP. While near-synchronized recruitment of Ca2+ release could readily occur upon strip depolarization, mechanisms underlying the rhythmical synchronization of spontaneous Ca2+ release need further consideration.
One possibility is that SWs derive from rhythmic Ca2+ waves with the additional step of Ca2+ release generating inward current. The finding that pacemaker potentials probably arise through a summation of more elementary local Ca2+ release events recorded as STDs is analogous with reports of ‘pacemaker’ Ca2+ release from imaging studies on single cells (Bootman et al. 1997), although the spatial localization of STD-associated Ca2+ release in the pyloric strips is likely to involve one or more cells. However, whether this scheme allows full interpretation of the generation of SWs in the multicellular tissue strips of this study or for larger tissues is unclear as the mechanism is likely to require a greater degree of across-tissue synchronization of Ca2+ release than could be provided by conventional Ca2+ waves, which have low conduction velocities (e.g. < 0.1 mm s−1; see Berridge, 1993). A Ca2+ wave travelling at 0.1 mm s−1 would, assuming a specific pacemaker site and a uniform wavefront across the strip, activate about 5 % of a 2 mm tissue strip per second. While such a mechanism might function in the small strips of this study, pacemaker potentials being of long duration (e.g. ∼6 s), this mechanism would become increasingly compromised in larger tissues. However, one way in which this might be circumvented would be if the velocity of Ca2+ waves were markedly enhanced. A factor that would facilitate this is the associated change in membrane depolarization which would enhance the probability of Ca2+ release over much larger distances than by linear diffusion of Ca2+ and/or IP3 and hence could markedly enhance the conduction velocity of the Ca2+ wave.
Another possibility is that synchronization of Ca2+ release results through stores acting as coupled relaxation oscillators, as has been used to describe many synchronous behaviours (see Strogatz & Stewart, 1993). Coupled relaxation oscillator-based models have also been used to interpret SWs, although the elementary oscillator was not elucidated (see Daniel et al. 1994). Store Ca2+ release could subserve as the fundamental oscillator, each store influencing oscillatory Ca2+ release from neighbouring stores, leading to entrainment of the activity over time. Such entrainment would require a critical level of Ca2+ release events as determined by the IP3 concentration, with higher IP3 concentrations further enhancing recruitment of Ca2+ release events, so increasing the amplitude of resultant pacemaker activity. The possibility that Ca2+ stores interact in this way has been tested in the simulation of Ca2+ waves in astrocytes (Roth et al. 1995). However, Ca2+ waves in astrocytes travel slowly (i.e. < 0.1 mm s−1) and therefore the parameters defining the coupling interaction between stores would need to be very much enhanced if Ca2+ waves were to underlie the pacemaker component of SWs. Enhanced coupling would require either a markedly different arrangement of the intracellular Ca2+ stores in the gastric tissue compared to astrocytes and/or a major role of pacemaker depolarization-associated Ca2+ release in strengthening store coupling.
The SW current
SWs were unlikely to be generated by activation of plasmalemmal voltage-dependent Ca2+ channels as they were activated over a wide range of potentials, including at markedly hyperpolarized potentials. In addition, they persisted in Ca2+-free Cd2+-containing solutions for periods much longer than required for solution changeover. The SW depolarization was also not caused by a decrease in K+ conductance as SWs were associated with a marked increase in membrane conductance. Therefore, Na+ and/or Cl− are the primary candidates for charge carriers, as both these conductances are known to generate inward currents at normal resting potentials. However, experiments, based on exposing strips to solutions where relatively impermeable cations or anions were substituted for Na+ or Cl− in the external medium have not provided a clear resolution to this question. Pharmacological studies indicated a possible involvement of Ca2+-activated Cl− channels as both 10–100 μM NFA and DIDS produced a significant reduction in SW amplitude. NFA and DIDS have been shown to specifically inhibit these channels at concentrations of 10 μM (see Large & Wang, 1996). However, DIDS has also been shown to block skeletal muscle sarcoplasmic reticulum Cl− channels which may have a role in store Ca2+ release (Kourie et al. 1996). Thus it is not yet possible to be certain whether the channels targeted by NFA and DIDS are functional on the plasmalemma or on the sarcoplasmic reticulum. Should these channels prove to be plasmalemmal then their role in generating SWs remains partial and at the most will only contribute to approximately half the current. As there is evidence from studies on isolated single smooth muscle cells for Ca2+-induced potentiation of muscarinic receptor-operated cation channels (Inoue & Isenberg, 1990; Komori et al. 1993), these cation channels remain a candidate charge-carrying mechanism for the pyloric SW current.
Pacemaker cells
There have been many reports indicating that gastrointestinal pacemaking is effected by specific cells referred to as interstitial cells of Cajal (ICCs) (Thunenberg, 1982; Ward et al. 1994; Huizinga et al. 1995). These cells form plexuses in areas such as the myenteric plexus region between the longitudinal and circular smooth muscle and form gap junction contacts with other ICCs and with smooth muscle. Evidence that these extramuscular ICCs are likely to act as pacemaker cells is provided by the finding that mutation of the proto-oncogene c-kit blocks development of interstitial cells and electrical rhythmicity in the murine intestine ICC network (Ward et al. 1994; Huizinga et al. 1995). There is also evidence that single isolated ICCs are spontaneously active (Langton et al. 1989; Thomsen et al. 1998), though single isolated intestinal smooth muscle cells also show spontaneous rhythmicity (Komori et al. 1993).
While these extramuscular networks of ICC are integral to pacemaking, less is known about the role of the subclass of ICCs referred to as intramuscular ICCs. These are generally present within visceral muscle bundles including muscle bundles of the guinea-pig pylorus and are likely to subserve a role in inhibitory neurotransmission (Burns et al. 1997). We too have observed these cells in our strip preparations by using either a Ca2+-sensing fluophore or an antibody to c-kit (authors' unpublished observations). It is not yet possible to generally equate the presence of this subclass of ICC with pacemaking as intramuscular ICCs are also present in muscle bundles of the gastric fundus, a tissue which does not exhibit electrical pacemaking (Burns et al. 1997). However, irrespective of whether pacemaking in pyloric strips is driven by intramuscular ICCs, smooth muscle or both cell types working in unison, the underlying mechanism by which they operate is likely to be through Ca2+ release from IP3-sensitive intracellular stores.
Conclusions
In summary, our data indicate that SWs in the strip preparations used in this study arise through Ca2+ release from IP3 receptor-operated Ca2+ stores, which in turn generates inward currents across the plasmalemma. Rhythmicity is likely to occur by a synchronization of local Ca2+ release events measured as STDs with pacemaker frequency determined by properties such as the release-refill cycle of Ca2+ stores. Sufficient Ca2+ release generates CICR, which is regenerative resulting in full SWs. Importantly, membrane depolarization can also markedly increase IP3 receptor-mediated Ca2+ release from the sarcoplasmic reticulum probably by increasing the synthesis of IP3. Indeed, depolarization can itself generate SW action potentials, which arise through regenerative events at the level of the sarcoplasmic reticulum and hence differ from classical Hodgkin-Huxley-type action potentials resulting from regenerative activation of voltage-dependent channels in the cell plasmalemma. Voltage feedback will subserve at least two primary roles in the generation of SWs. Firstly, it will enhance the likelihood of the SW pacemaker component achieving the threshold for initiating CICR and generation of the regenerative component of the SW. Secondly, it will facilitate long range spatial synchronization of Ca2+ release and resulting SWs.
Acknowledgments
We wish to express our sincere gratitude to Professor T. Itoh for initial help with the experimental tissue and Drs S. A. McFadden and C. P. Katnik for critical appraisal of the manuscript. The National Health and Medical Research Council of Australia (grant no. 970798) supported this work.
References
- Beavo JA, Reifsnyder DH. Primary sequence of cyclic nucleotide phosphodiesterase isozymes and the design of selective inhibitors. Trends in Pharmacological Sciences. 1990;11:150–155. doi: 10.1016/0165-6147(90)90066-H. [DOI] [PubMed] [Google Scholar]
- Benham CD, Bolton TB. Spontaneous transient outward currents in single visceral and vascular smooth muscle cells of the rabbit. The Journal of Physiology. 1986;381:385–406. doi: 10.1113/jphysiol.1986.sp016333. [DOI] [PMC free article] [PubMed] [Google Scholar]
- Berridge MJ. Inositol trisphosphate and calcium signalling. Nature. 1993;361:315–325. doi: 10.1038/361315a0. [DOI] [PubMed] [Google Scholar]
- Bootman MD, Berridge MJ, Lipp P. Cooking with calcium: the recipes for composing global signals from elementary events. Cell. 1997;91:367–373. doi: 10.1016/s0092-8674(00)80420-1. [DOI] [PubMed] [Google Scholar]
- Burns AJ, Herbert TM, Ward SM, Sanders KM. Interstitial cells of Cajal in the guinea-pig gastrointestinal tract as revealed by c-Kit immunohistochemistry. Cell and Tissue Research. 1997;290:11–20. doi: 10.1007/s004410050902. [DOI] [PubMed] [Google Scholar]
- Daniel EE, Bardakjian BL, Huizinga JD, Diamant NE. Relaxation oscillator and core conductor models are needed for understanding of GI electrical activities. American Journal of Physiology. 1994;266:G339–349. doi: 10.1152/ajpgi.1994.266.3.G339. [DOI] [PubMed] [Google Scholar]
- Donaldson SK, Goldberg ND, Walseth TF, Huetteman DA. Voltage dependence of inositol 1,4,5-trisphosphate-induced Ca2+ release in peeled skeletal muscle fibers. Proceedings of the National Academy of Sciences of the USA. 1988;85:5749–5753. doi: 10.1073/pnas.85.15.5749. [DOI] [PMC free article] [PubMed] [Google Scholar]
- Edwards FR, Hirst GD, Suzuki H. Unitary nature of regenerative potentials recorded from circular smooth muscle of guinea-pig antrum. The Journal of Physiology. 1999;519:235–250. doi: 10.1111/j.1469-7793.1999.0235o.x. [DOI] [PMC free article] [PubMed] [Google Scholar]
- Ehrlich BE, Watras J. Inositol 1,4,5-trisphosphate activates a channel from smooth muscle sarcoplasmic reticulum. Nature. 1988;336:583–586. doi: 10.1038/336583a0. [DOI] [PubMed] [Google Scholar]
- Fabiato A. Calcium-induced release of calcium from the cardiac sarcoplasmic reticulum. American Journal of Physiology. 1983;245:C1–14. doi: 10.1152/ajpcell.1983.245.1.C1. [DOI] [PubMed] [Google Scholar]
- Ferrier GR, Howlett SE. Contractions in guinea-pig ventricular myocytes triggered by a calcium-release mechanism separate from Na+ and L-currents. The Journal of Physiology. 1995;484:107–122. doi: 10.1113/jphysiol.1995.sp020651. [DOI] [PMC free article] [PubMed] [Google Scholar]
- Ganitkevich VY, Isenberg G. Membrane potential modulates inositol 1,4,5-trisphosphate-mediated Ca2+ transients in guinea-pig coronary myocytes. The Journal of Physiology. 1993;470:35–44. doi: 10.1113/jphysiol.1993.sp019845. [DOI] [PMC free article] [PubMed] [Google Scholar]
- Gordienko DV, Bolton TB, Cannell MB. Variability in spontaneous subcellular calcium release in guinea-pig ileum smooth muscle cells. The Journal of Physiology. 1998;507:707–720. doi: 10.1111/j.1469-7793.1998.707bs.x. [DOI] [PMC free article] [PubMed] [Google Scholar]
- Hamada E, Nakajima T, Ota S, Terano A, Omata M, Nakade S, Mikoshiba K, Kurachi Y. Activation of Ca(2+)-dependent K+ current by acetylcholine and histamine in a human gastric epithelial cell line. Journal of General Physiology. 1993;102:667–692. doi: 10.1085/jgp.102.4.667. [DOI] [PMC free article] [PubMed] [Google Scholar]
- Hashitani H, Edwards FR. Spontaneous and neurally activated depolarizations in smooth muscle cells of the guinea-pig urethra. The Journal of Physiology. 1999;514:459–470. doi: 10.1111/j.1469-7793.1999.459ae.x. [DOI] [PMC free article] [PubMed] [Google Scholar]
- Hashitani H, Van Helden DF, Suzuki H. Properties of spontaneous depolarizations in circular smooth muscle cells of rabbit urethra. British Journal of Pharmacology. 1996;118:1627–1632. doi: 10.1111/j.1476-5381.1996.tb15584.x. [DOI] [PMC free article] [PubMed] [Google Scholar]
- Huizinga JD, Thuneberg L, Kluppel M, Malysz J, Mikkelsen HB, Bernstein A. W/kit gene required for interstitial cells of Cajal and for intestinal pacemaker activity. Nature. 1995;373:347–349. doi: 10.1038/373347a0. [DOI] [PubMed] [Google Scholar]
- Iino M. Biphasic Ca2+ dependence of inositol 1,4,5-trisphosphate-induced Ca release in smooth muscle cells of the guinea pig taenia caeci. Journal of General Physiology. 1990;95:1103–1122. doi: 10.1085/jgp.95.6.1103. [DOI] [PMC free article] [PubMed] [Google Scholar]
- Inoue R, Isenberg G. Intracellular calcium ions modulate acetylcholine-induced inward current in guinea-pig ileum. The Journal of Physiology. 1990;424:73–92. doi: 10.1113/jphysiol.1990.sp018056. [DOI] [PMC free article] [PubMed] [Google Scholar]
- Itoh T, Seki N, Suzuki S, Ito S, Kajikuri J, Kuriyama H. Membrane hyperpolarization inhibits agonist-induced synthesis of inositol 1,4,5-trisphosphate in rabbit mesenteric artery. The Journal of Physiology. 1992;451:307–328. doi: 10.1113/jphysiol.1992.sp019166. [DOI] [PMC free article] [PubMed] [Google Scholar]
- Jack JJ, Noble D, Tsien RW. Electric Current Flow in Excitable Cells. Oxford: Oxford University Press; 1975. [Google Scholar]
- Kobayashi S, Somlyo AV, Somlyo AP. Heparin inhibits the inositol 1,4,5-trisphosphate-dependent, but not the independent, calcium release induced by guanine nucleotide in vascular smooth muscle. Biochemical and Biophysical Research Communications. 1988;153:625–631. doi: 10.1016/s0006-291x(88)81141-0. [DOI] [PubMed] [Google Scholar]
- Komori S, Kawai M, Pacaud P, Ohashi H, Bolton TB. Oscillations of receptor-operated cationic current and internal calcium in single guinea-pig ileal smooth muscle cells. Pflügers Archiv. 1993;424:431–438. doi: 10.1007/BF00374905. [DOI] [PubMed] [Google Scholar]
- Kourie JI, Laver DR, Junankar PR, Gage PW, Dulhunty AF. Characteristics of two types of chloride channel in sarcoplasmic reticulum vesicles from rabbit skeletal muscle. Biophysical Journal. 1996;70:202–221. doi: 10.1016/S0006-3495(96)79564-4. [DOI] [PMC free article] [PubMed] [Google Scholar]
- Langton P, Ward SM, Carl A, Norell MA, Sanders KM. Spontaneous electrical activity of interstitial cells of Cajal isolated from canine proximal colon. Proceedings of the National Academy of Sciences of the USA. 1989;86:7280–7284. doi: 10.1073/pnas.86.18.7280. [DOI] [PMC free article] [PubMed] [Google Scholar]
- Large WA, Wang Q. Characteristics and physiological role of the Ca(2+)-activated Cl− conductance in smooth muscle. American Journal of Physiology. 1996;271:C435–454. doi: 10.1152/ajpcell.1996.271.2.C435. [DOI] [PubMed] [Google Scholar]
- Lechleiter J, Girard S, Peralta E, Clapham D. Spiral calcium wave propagation and annihilation in Xenopus laevis oocytes. Science. 1991;252:123–126. doi: 10.1126/science.2011747. [DOI] [PubMed] [Google Scholar]
- Liu LW, Thuneberg L, Huizinga JD. Cyclopiazonic acid, inhibiting the endoplasmic reticulum calcium pump, reduces the canine colonic pacemaker frequency. Journal of Pharmacology and Experimental Therapeutics. 1995;275:1058–1068. [PubMed] [Google Scholar]
- Mahaut-Smith MP, Hussain JF, Mason MJ. Depolarization-evoked Ca2+ release in a non-excitable cell, the rat megakaryocyte. The Journal of Physiology. 1999;515:385–390. doi: 10.1111/j.1469-7793.1999.385ac.x. [DOI] [PMC free article] [PubMed] [Google Scholar]
- Melzer W, Herrmann-Frank A, Luttgau HC. The role of Ca2+ ions in excitation-contraction coupling of skeletal muscle fibres. Biochimica et Biophysica Acta. 1995;1241:59–116. doi: 10.1016/0304-4157(94)00014-5. [DOI] [PubMed] [Google Scholar]
- Nelson MT, Cheng H, Rubart M, Santana LF, Bonev AD, Knot HJ, Lederer WJ. Relaxation of arterial smooth muscle by calcium sparks. Science. 1995;270:633–637. doi: 10.1126/science.270.5236.633. [DOI] [PubMed] [Google Scholar]
- Oba T, Koshita M, Van Helden DF. Modulation of frog skeletal muscle Ca2+ release channel gating by anion channel blockers. American Journal of Physiology. 1996;271:C819–824. doi: 10.1152/ajpcell.1996.271.3.C819. [DOI] [PubMed] [Google Scholar]
- Parker I, Choi J, Yao Y. Elementary events of InsP3-induced Ca2+ liberation in Xenopus oocytes: hot spots, puffs and blips. Cell Calcium. 1996;20:105–121. doi: 10.1016/s0143-4160(96)90100-1. [DOI] [PubMed] [Google Scholar]
- Publicover NG. Generation and propagation of rhythmicity in gastrointestinal smooth muscle. In: Huizinga JD, editor. Pacemaker Activity and Intercellular Communication. Ann Arbor: CRC Press; 1995. pp. 175–190. [Google Scholar]
- Publicover NG, Sanders KM. Are relaxation oscillators an appropriate model of gastrointestinal electrical activity? American Journal of Physiology. 1989;256:G265–274. doi: 10.1152/ajpgi.1989.256.2.G265. [DOI] [PubMed] [Google Scholar]
- Rooney TA, Sass EJ, Thomas AP. Agonist-induced cytosolic calcium oscillations originate from a specific locus in single hepatocytes. Journal of Biological Chemistry. 1990;265:10792–10796. [PubMed] [Google Scholar]
- Roth BJ, Yagodin SV, Holtzclaw L, Russell JT. A mathematical model of agonist-induced propagation of calcium waves in astrocytes. Cell Calcium. 1995;17:53–64. doi: 10.1016/0143-4160(95)90102-7. [DOI] [PubMed] [Google Scholar]
- Somlyo AV, Bond M, Somlyo AP, Scarpa A. Inositol trisphosphate-induced calcium release and contraction in vascular smooth muscle. Proceedings of the National Academy of Sciences of the USA. 1985;82:5231–5235. doi: 10.1073/pnas.82.15.5231. [DOI] [PMC free article] [PubMed] [Google Scholar]
- Strogatz SH, Stewart I. Coupled oscillators and biological synchronization. Scientific American. 1993;269:102–109. doi: 10.1038/scientificamerican1293-102. [DOI] [PubMed] [Google Scholar]
- Suzuki H, Hirst GD. Regenerative potentials evoked in circular smooth muscle of the antral region of guinea-pig stomach. The Journal of Physiology. 1999;517:563–573. doi: 10.1111/j.1469-7793.1999.0563t.x. [DOI] [PMC free article] [PubMed] [Google Scholar]
- Thomsen L, Robinson TL, Lee JC, Farraway LA, Hughes MJ, Andrews DW, Huizinga JD. Interstitial cells of Cajal generate a rhythmic pacemaker current. Nature Medicine. 1998;4:848–851. doi: 10.1038/nm0798-848. [DOI] [PubMed] [Google Scholar]
- Thunenberg L. Interstitial cells of Cajal: Intestinal pacemakers? Advances in Anatomy, Embryology and Cell Biology. 1982;71:1–30. [PubMed] [Google Scholar]
- Tomita T. Electrical activity (spikes and slow waves) in gastrointestinal smooth muscles. In: Bulbring E, Brading AF, Jones AW, Tomita T, editors. Smooth Muscle: An Assessment of Current Knowledge. Austin, TX, USA: University of Texas Press; 1981. pp. 127–156. [Google Scholar]
- Van Helden DF. Spontaneous and noradrenaline-induced transient depolarizations in the smooth muscle of guinea-pig mesenteric vein. The Journal of Physiology. 1991;437:511–541. doi: 10.1113/jphysiol.1991.sp018609. [DOI] [PMC free article] [PubMed] [Google Scholar]
- Van Helden DF. Pacemaker potentials in lymphatic smooth muscle of the guinea-pig mesentery. The Journal of Physiology. 1993;471:465–479. doi: 10.1113/jphysiol.1993.sp019910. [DOI] [PMC free article] [PubMed] [Google Scholar]
- Van Helden DF, Imtiaz MS, Nurgaliyeva K, von der Weid P-Y, Dosen PJ. Evidence that slow waves in the guinea-pig gastric pylorus are mediated by inositol 1,4,5-trisphosphate-sensitive Ca2+ release. Proceedings of the Australian Physiological and Pharmacological Society. 1999;30:72. P. [Google Scholar]
- Van Helden DF, von der Weid P-Y, Crowe MJ. Intracellular Ca2+ release: a basis for electrical pacemaking in lymphatic smooth muscle. In: Bolton TB, Tomita T, editors. Smooth Muscle Excitation. London: Academic Press Limited; 1996. pp. 355–373. [Google Scholar]
- Vergara J, Tsien RY, Delay M. Inositol 1,4,5-trisphosphate: A possible chemical link in excitation-contraction coupling in muscle. Proceedings of the National Academy of Sciences of the USA. 1985;82:6352–6356. doi: 10.1073/pnas.82.18.6352. [DOI] [PMC free article] [PubMed] [Google Scholar]
- Wang Q, Hogg RC, Large WA. Properties of spontaneous inward currents recorded in smooth muscle cells isolated from the rabbit portal vein. The Journal of Physiology. 1992;451:525–537. doi: 10.1113/jphysiol.1992.sp019177. [DOI] [PMC free article] [PubMed] [Google Scholar]
- Ward SM, Burns AJ, Torihashi S, Sanders KM. Mutation of the proto-oncogene c-kit blocks development of interstitial cells and electrical rhythmicity in murine intestine. The Journal of Physiology. 1994;480:91–97. doi: 10.1113/jphysiol.1994.sp020343. [DOI] [PMC free article] [PubMed] [Google Scholar]