

Abstract
Circulation around tendons may act as a shunt for muscle during exercise. The perfusion and oxygenation of Achilles' peritendinous tissue was measured in parallel with that of calf muscle during exercise to determine (1) whether blood flow is restricted in peritendinous tissue during exercise, and (2) whether blood flow is coupled to oxidative metabolism.
Seven individuals performed dynamic plantar flexion from 1 to 9 W. Radial artery and popliteal venous blood were sampled for O2, peritendinous blood flow was determined by 133Xe-washout, calf blood flow by plethysmography, cardiac output by dye dilution, arterial pressure by an arterial catheter-transducer, and muscle and peritendinous O2 saturation by spatially resolved spectroscopy (SRS).
Calf blood flow rose 20-fold with exercise, reaching 44 ± 7 ml (100 g)−1 min−1 (mean ± s.e.m.) at 9 W, while Achilles' peritendinous flow increased (7-fold) to 14 ± 4 ml (100 g)−1 min−1, which was 18 % of the maximal flow established during reactive hyperaemia. SRS-O2 saturation fell both in muscle (from 66 ± 2 % at rest to 57 ± 3 %, P < 0.05) and in peritendinous regions (58 ± 4 to 52 ± 4 %, P < 0.05) during exercise along with a rise in leg vascular conductance and microvascular haemoglobin volume, despite elevated systemic vascular resistance.
The parallel rise in calf muscle and peritendinous blood flow and fall in O2 saturation during exercise indicate that blood flow is coupled to oxidative metabolism in both tissue regions. Increased leg vascular conductance accompanied by elevated microvascular haemoglobin volume reflect vasodilatation in both muscle and peritendinous regions. However, peak exercise peritendinous blood flow reaches only ≈20 % of its maximal blood flow capacity.
Oxidative metabolism and blood flow in skeletal muscle increase with intensity of muscular contractions, and there is a close coupling between metabolic demand and O2 delivery (Saltin et al. 1998). Recently, Langberg et al. (1998) reported that connective tissue blood flow in the peritendinous region of the human Achilles' tendon also increased during heel-raise exercise. Yet, as the oxidative metabolic rate of tendon is very low (in the order of 0.1 μl O2 g−1 h−1; Peacock, 1959), flow increases to tendon suggest an uncoupling between O2 supply and demand. In animal skeletal muscle, regions with high perfusion rates but little nutritive exchange have been described as functional shunts (Friedman, 1966). Barlow et al. (1961) characterized two separate circulatory systems in skeletal muscle referred to as nutritive and non-nutritive.
It has been suggested that perfusion of vessels supplying connective tissue such as tendons may represent a functional shunt serving as a flow reserve for contracting muscle (Grant & Payling-Wright, 1970; Clark et al. 1998). Nutritive flow to muscle tissue may be increased during exercise by vasoconstriction of arterioles distal to the muscle, but proximal to the tendon, whereby blood flow in the feed artery is shunted preferentially towards the muscle (Clark et al. 1998).
Therefore, the purpose of this study was to investigate (1) whether blood flow in the Achilles' peritendinous region is restricted during exercise, thereby reflecting that this circulation acts as a functional shunt for skeletal muscle during exercise, and (2) whether flow around the tendon is coupled to O2 demand during exercise as reflected by the O2 saturation determined by spatially resolved spectroscopy (SRS-O2). Calf muscle and peritendinous tissues were studied simultaneously invivo using a graded dynamic exercise protocol with simultaneous determinations of blood flow and tissue oxygenation.
METHODS
Seven young, healthy individuals participated in the study after giving written informed consent as approved by the Ethical Committee of Copenhagen (KF 01–392/98). Experiments were performed according to the Declaration of Helsinki. A catheter was inserted in a radial artery, and another placed in the popliteal vein of the working leg using the Seldinger technique, and guided by ultrasound B-mode imaging of the vessel. Blood was sampled anaerobically from the artery and vein simultaneously for measurement of O2 saturation and content (Oxylite, Radiometer, Copenhagen, Denmark).
Cardiac output was measured by indocyanine green (ICG, Akorn Inc., IL, USA) dye dilution (Dow, 1956). Five milligrams of dye was injected rapidly into the popliteal vein followed by a 10 ml flush of isotonic saline. Blood from the radial artery was withdrawn by a pump at 20 ml min−1 through a linear photodensitometer (Waters Instruments Inc., Rochester, MN, USA) for measurement of the arterial dye concentration. The dye curves were displayed on a chart recorder (Gould 8000) and extrapolated with a logarithmic scale based on the exponential decay (downslope) observed from 75 to 50 % of the peak dye concentration to correct for recirculation. Cardiac output was then computed as the ratio of dye injected to the mean arterial ICG concentration over the time interval of the curve and expressed per minute. Following each experiment an ICG calibration curve was derived from measurements of the deflection from three separate 25 ml blood samples with varying concentrations of ICG.
Mean arterial pressure (MAP) was taken as the mean of systolic and diastolic pressures determined by a catheter placed in the artery connected to a transducer and a chart recorder, while total peripheral resistance (TPR) was derived from the ratio of MAP to cardiac output. Non-leg blood flow was calculated as cardiac output minus the absolute calf blood flow, and non-leg vascular resistance was the ratio of MAP to non-leg blood flow.
Calf blood flow and oxygen uptake
A single strand mercury-in-Silastic strain gauge plethysmograph (SP 2, Medimatic, Copenhagen, Denmark) was used with the venous occlusion technique to determine calf blood flow. Prior to flow measurements, the strain gauge was calibrated with a micrometer and then placed around the largest circumference of the calf muscle. A cuff was placed above the knee and venous occlusion was induced by a pneumatic device at a pressure of 50 mmHg (Patterson & Whelan, 1955). Blood flow was expressed in millilitres per 100 g muscle per minute (ml (100 g)−1 min−1) based on a muscle density of 1.05 g ml−1. Leg vascular conductance (LVC) was calculated as the ratio of calf blood flow to MAP. To determine oxygen uptake across the lower leg, calf blood flow was also expressed in litres per minute (l min−1) based on anthropometric estimates of calf volume (Hiatt et al. 1989). O2 uptake (VO2) across the lower leg was calculated based on the product of the arterio-venous differences and calf blood flow.
Achilles' peritendinous blood flow
Blood flow in the peritendinous region was measured by the 133Xe-washout technique. 133Xe was dissolved in sterile isotonic saline at a concentration of ∼10 MBq ml−1, and 0.1 ml of this solution was injected at a depth of 1–2 cm, directly into the tissue ventral to the Achilles' tendon, 5 cm proximal to the upper medial portion of the calcaneal insertion. Portable scintillation detectors were secured to the peritendinous region over the 133Xe depots (Fig. 1), and connected to a multichannel analyser system (Oakfield Instruments, Oxford, UK). Blood flow (in ml (100 g tissue)−1 min−1) was calculated as:
where λ is the partition coefficient of tissue:blood (μCi (g tissue)−1/μCi (ml blood)−1), which was 7, and K is the elimination rate constant for the monoexponential washout of 133Xe (Lassen et al. 1964). In a previous study it was demonstrated that lymph drainage does not influence peritendinous tissue blood flow during exercise (Langberg et al. 1998).
Figure 1.

Schematic diagram of the experimental setup for plantar flexion exercise
Spatially resolved spectroscopy
A NIRO 300 (Hamamatsu Photonics) with dual-channel near-infrared laser diodes was utilized for measurement of absolute muscle and peritendinous haemoglobin O2 saturation, as well as oxyhaemoglobin (HbO2), deoxyhaemoglobin (Hb), and total haemoglobin volume (THb). For the muscle, one set of emitting and receiving optodes was placed over the gastrocnemius at the position of maximum circumference, with an optode separation distance of 4 cm. For the peritendinous region, the probes were placed on the medial aspect of the ankle between the Achilles' tendon and the medial maleolus, and the separation distance was also 4 cm. This positioning was directly over the 133Xe depot site (Fig. 6). Changes in HbO2 and Hb were determined by measuring light attenuation at 775, 813, 850 and 913 nm wavelengths, analysed with an algorithm encorporating the modified Beer-Lambert law: A = αcdB+G, where A is the measured light attenation, α is the specific extinction coefficient of the absorbing compound (measured in mol cm−1), c is the concentration of the absorbing compound (measured in mol), d is the distance between the optodes over the tissue surface, B is a differential pathlength factor of 4.94 (Duncan et al. 1995), and G is a constant reflecting the scattering of light of the tissue. From these measurements, total haemoglobin (THb = HbO2+ Hb, in μmol) was also derived.
Figure 6. Schematic diagram of Achilles' peritendinous region.
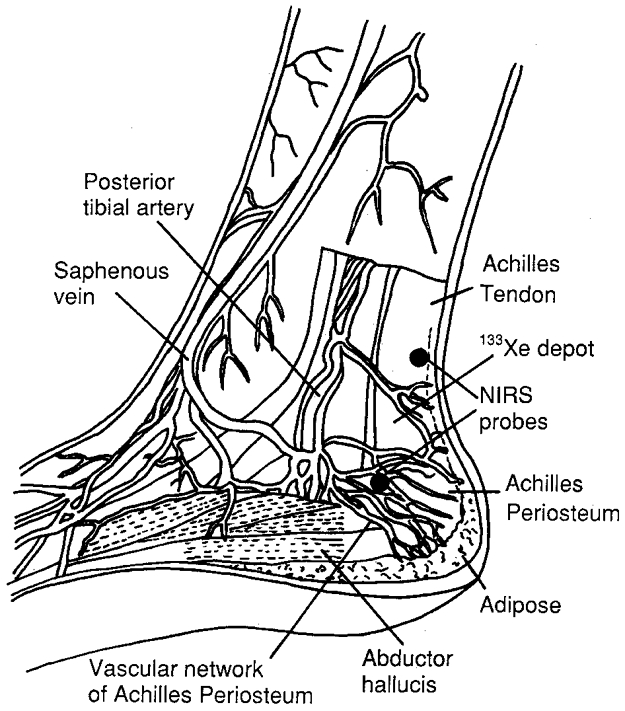
Anatomical schematic diagram of the Achilles' peritendinous region displaying the vascular network and tendon structures, and the location of the near-infrared spectroscopy probes (NIRS) and 133Xe depot.
The NIRO 300 is a spatially resolved spectrophotometer which provides a quantitative measure of absolute O2 saturation (percentage O2 saturation = 100HbO2/(HbO2+ Hb)). This parameter is based on an accurate determination of the relative proportions of Hb and HbO2 in tissue, derived from the relative absorption coefficients obtained from the slope of light attenuation at four wavelengths over a distance measured at three focal points from the light emission. The relative absorption coefficients are converted to relative concentrations of the chromophores, and thus, the absolute ratio of HbO2 to Hb can be determined. Oxygen saturation was calculated by performing multilinear regression on the scattering coefficient estimates obtained at each wavelength using reference spectra of pure Hb and HbO2.
The SRS device and methodology has been validated invitro using phantom human whole blood, intralipid and water (0.96 %, Dulbecco's phantoms) (Matcher et al. 1993; Suzuki et al. 1999). Invivo comparisons of SRS-O2 saturation with blood samples measured for O2 saturation using a blood gas analyser yielded a correlation coefficient of 97 %, and the inter-subject variability led to a standard deviation in absolute saturation of 1.5 % (Matcher et al. 1993). Thus, the SRS-O2 saturation provides essentially the same measurement as a blood gas analyser.
The SRS-O2 value represents the mean saturation of all the haemoglobin volume present in the tissue region, and accounts for changes in the proportions of the Hb and HbO2 volumes. Arterio-venous O2 saturations determined by a blood gas analyser provide essentially the same measurement as the SRS-O2. The difference between these parameters is that the arterial and venous O2 saturations reflect only their respective vascular compartments, while the SRS-O2 saturation reflects predominantly the mean of arteriolar, capillary and venular O2 saturations and some contribution from myoglobin. In addition, arterio-venous O2 saturations indicate differences across the whole leg, while the SRS value measures a discrete region of tissue.
Protocol
After a resting period of 10 min in the seated position (Fig. 1), baseline measurements were collected over a 5 min period for peritendinous flow and SRS-O2, followed by blood sampling for O2 saturation and content, glucose, lactate and free fatty acids. Calf blood flow was then measured three times at rest, each measurement separated by a 5 min interval and averaged, followed by measurement of cardiac output. Subsequently, subjects began rhythmic dynamic plantar flexion exercise at 1 W (45 contractions min−1; metronome paced) on an ergometer for a period of 5 min. Spectroscopy measurements were made continously at a 0.2 Hz sampling frequency averaged over the last 20 s of each exercise bout. Arterial and venous blood samples were taken 10 s before the end of the bout. Calf blood flow was determined at the third minute during a brief pause in the exercise bout (∼5–10 s) and again immediately post-exercise, and averaged. Peritendinous blood flow was determined by 133Xe washout over the last 3 min of exercise, and cardiac output during the last 2 min. Subjects then rested for 10 min and the same procedure was repeated for the 3, 5 and 7 W loads. In pilot studies, it was found that not all subjects could complete the 5 min duration at 9 W. Therefore, the final exercise bout consisted of a ramped bout starting at 5 W for 1 min, followed by 7 W for 2 min, and finally 9 W for 2 min. In this bout, blood was sampled in the last 15 s of exercise, SRS responses were averaged over the last 20 s, cardiac output was measured in the last minute, and calf blood flow was determined immediately post-exercise. Peritendinous blood flow was calculated based on the washout rate in the last 3 min.
To assess the maximum range of changes in the optical signals around the tendon and in calf muscle, three subjects were engaged in a separate protocol involving cuff ischaemia followed by reperfusion. The magnitude of Achilles' peritendinous blood flow during reperfusion was also measured by 133Xe washout. This experiment consisted of 10 min of rest, followed by 15 min of cuff ischaemia at rest and 5 min of recovery.
Data analysis
Values are presented as means and s.e.m. Changes in each of the variables with increasing workload were evaluated with the Friedman test, and if found significant, such differences were further analysed by the Wilcoxon paired sign-rank test. Differences were considered significant if P < 0.05.
RESULTS
Calf blood flow increased from 2.6 ± 0.3 ml (100 g)−1 min−1 at rest to 44 ± 7 ml (100 g)−1 min−1 (1.2 ± 0.2 l min−1) at 9 W (Fig. 2), which together with an increase in O2 extraction (from 55 ± 5 % at rest to 84 ± 3 % at 9 W), contributed to an increase in calf VO2 from 0.23 ± 0.07 to 6.6 ± 1 ml (100 g)−1 min−1 (P < 0.05). The increase in O2 extraction was most pronounced at the light loads (1–5 W), while at the heavy loads (7–9 W), the rise in calf VO2 resulted from an elevation of calf blood flow at a similar extraction rate. In the Achilles' peritendinous region, blood flow increased from 2.1 ± 0.4 ml (100 g)−1 min−1 at rest to 14.1 ± 4 ml (100 g)−1 min−1 at 9 W (Fig. 2) (P < 0.05). Cardiac output increased with exercise load from 5.8 ± 0.1 l min−1 at rest to 9.3 ± 0.6 l min−1 at the 9 W load. Non-leg blood flow was 5.7 ± 0.1 l min−1 at rest, and it also increased during exercise to 7.8 ± 0.6 l min−1 at 9 W (Fig. 3). MAP rose from 84 ± 0.9 to 115 ± 3 mmHg, TPR fell from 14.6 ± 0.05 to 12.3 ± 0.5 mmHg l−1 min−1, while LVC rose from 0.5 ± 0.05 to 9 ± 0.5 ml mmHg−1 min−1 (Fig. 3). Non-leg vascular resistance dropped from the resting level (14.6 ± 0.6 mmHg l−1 min−1) at 1–3 W (to 13.2 ± 0.6 mmHg l−1 min−1), but returned to the resting level from 5 to 9 W (14.4 ± 1 mmHg l−1 min−1).
Figure 2. Blood flow and oxygen uptake during exercise.
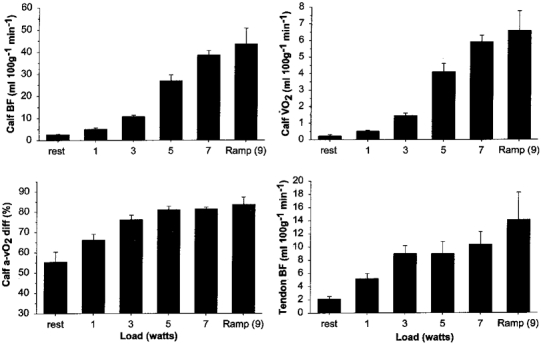
Blood flow (BF), arterio-venous oxygen difference (a-vO2 diff), and oxygen uptake (VO2) in the lower leg, and peritendinous blood flow, at rest and during graded plantar flexion exercise. Values are means and s.e.m. Note that peritendinous blood flow increases along with calf blood flow during exercise.
Figure 3. Systemic and regional haemodynamics during exercise.

Cardiac output (CO, ▪) and non-leg blood flow (NLBF, ), TPR (▪) and non-leg vascular resistance (NLVR,), MAP, and LVC at rest and during plantar flexion exercise. Asterisks for NLVR indicate difference from the resting level (P < 0.05).
The SRS-O2, reflecting the absolute O2 saturation in tissue, and the balance between O2 delivery and uptake, remained unchanged from the rest level in both muscle (66 ± 2 %) and peritendinous regions (58 ± 4 %) up to 5 W (Fig. 4), but fell significantly at the higher loads, reaching 57 ± 3 % in muscle and 52 ± 4 % in the peritendinous region at 9 W (P < 0.05).
Figure 4. Near-infrared spectroscopy parameters during exercise.

Spectroscopically determined oxygenation of calf muscle and Achilles' peritendinous tissue at rest and during exercise. Upper left panel, SRS-O2 saturation; upper right panel, Hb; lower left panel, HbO2; lower right panel, THb. ▪, muscle;and , Achilles' peritendinous region. Values are means and s.e.m. Asterisks indicate difference from the resting level (P < 0.05).
THb volume fell with contraction at the light loads in both muscle and peritendinous regions to 9 ± 2 μmol below the resting baseline level in muscle and 14 ± 2 μmol below baseline in peritendinous tissue (P < 0.05). THb volume then gradually returned to baseline levels in both muscle (1.2 ± 3 μmol) and peritendinous tissues (0.1 ± 4 μmol) at 9 W (Fig. 4).
HbO2 fell progressively from the resting level (Fig. 4) with incremental loads, reaching 9 ± 2 μmol below the resting level in muscle and 8.5 ± 2 μmol below in peritendinous tissue with the 9 W load (P < 0.05). Hb paralleled the THb response (Fig. 4) with a fall below the resting level in both muscle (to 3 ± 1 μmol below) and peritendinous regions (to 9 ± 4 μmol below) at 1–3 W (P < 0.05), followed by a progressive increase with the higher loads reaching 10 ± 2 μmol above the resting level (P < 0.05) in muscle and 6 ± 4 μmol above baseline in the peritendinous region (P < 0.05) at 9 W.
The results of the ischaemia-reperfusion experiment for three subjects are presented in Fig. 5. The resting O2 saturations for Achilles' (59 %) and calf muscle (65 %) tissues were similar to those obtained at rest in the main exercise study, i.e. lower in the peritendinous region. During ischaemia, the calf muscle O2 desaturation rate was (∼7-fold) greater than that in the peritendinous tissue and there was also a much larger absolute range of desaturation in the calf (65–16 %) compared to the peritendinous region (59–35 %). During reperfusion, the rate of resaturation was again faster in calf muscle accompanied by a higher peak value (74 %) compared to the peritendinous tissue (67 %). During reperfusion, THb volume rose to 23 μmol above the resting level in calf muscle and similarly to 17 μmol above the resting level in the peritendinous region. Peak reactive hyperaemia in the peritendinous region measured by 133Xe washout reached 80 ml (100 ml)−1 min−1 (mean of 3 individuals). Thus, peak peritendinous blood flow during exercise represented ∼18 % of maximal flow capacity.
Figure 5. Near-infrared response during ischaemia and reperfusion.

Near-infrared spectroscopy optical responses at rest, during resting ischaemia, and during reperfusion (n = 3). The top panel shows the O2 saturation in calf muscle (continuous lines) and peritendinous tissue (dashed lines) determined by SRS. The bottom panel shows the corresponding THb volume.
DISCUSSION
The significant findings in the present study were that (1) blood flow in the Achilles' peritendinous region increased in parallel with muscle perfusion during incremental exercise, and (2) vasodilatation was observed in both muscle and peritendinous tissues, along with a drop in tissue O2 saturation. These results indicate that blood flow around the the tendon increases in relation to regional metabolic activity during dynamic leg exercise.
The focus of this study was to investigate the haemodynamic and oxidative metabolic responses of the muscle- tendon complex of the lower leg during graded exercise. This study expands on the previous finding by Langberg et al. (1998) of a 2- to 3-fold increase in blood flow in the peritendinous region during moderate single load heel-raising exercise, and demonstrates that peritendinous blood flow can reach a level 7-fold above the resting value during incremental dynamic plantar flexion. With the 133Xe-washout technique, flow around the tendon can be accurately determined because there is no significant increase in lymph drainage in this region during exercise (Langberg et al. 1998). The resting values in this study are similar to those of Langberg et al. (1998), who found peritendinous blood flows of 1.6 and 2.4 ml (100 ml)−1 min−1 in different regions around the tendon at rest with 133Xe washout. Using the same method, Fossgren (1969) found tendon blood flow to be 0.93 ml (100 ml)−1 min−1 at rest; however, in that study the 133Xe was injected directly into the tendon where the flow is thought to be lower compared to that in the superficial vessels as determined in the present study. In one study in dogs using microspheres, Bülow & Tøndevold (1982) found Achilles' tendon blood flow to be 0.5 ml (100 ml−1) min−1. Again, these lower values may be due to the fact that the microsphere technique reflects blood flow directly within the tendon.
Peritendinous blood flow and oxygenation during exercise
It has been proposed that connective tissue such as tendon may serve as a functional shunt for muscle during exercise (Grant & Payling-Wright, 1970; Newman et al. 1997; Clark et al. 1998), whereby sympathetic vasoconstriction in tendon would redistribute flow to the contracting muscle. This premise is based on the finding that microvascular flow in the tendon is reduced during noradrenaline (norepinephrine) infusion at rest in the constant-flow perfused rat hindlimb (Newman et al. 1997). The 7-fold increase in peritendinous flow during plantar flexion in this study represented less than 20 % of the maximal flow of this tissue determined during reactive hyperaemia. Thus, some tonic restraint on peak flow was probably present during exercise.
When a small leg muscle group is contracting, modest increases in sympathetic nerve activity to the active limb are present at intense loads as indicated by noradrenaline spillover from the exercising leg (Savard et al. 1989; Magnusson et al. 1993). In this study, the increase in non-leg vascular resistance during the moderate to heavy loads reflects some degree of enhanced sympathetic activity to the systemic vasculature (Fig. 3). However, in the active leg, LVC increased progressively, which may reflect some degree of local sympatholysis (Hansen et al. 1996). The peak exercise (absolute) blood flow to the leg was 1.2 l min−1, and as peak cardiac output was ∼9 l min−1, blood flow to the remainder of the body was in excess of 7 l min−1, which represents about a 2 l min−1 increase from the level at rest. Based on magnetic resonance imaging estimates of Achilles' tendon volume (R. Boushel, unpublished findings), the total tendon blood flow would be only ∼10 ml min−1. Therefore, a vasoconstrictive shunt operating to increase perfusion of muscle would be more efficient if directed to the systemic circulation which apparently had a sufficient flow reserve. In this regard, the present data suggest that during exercise, blood flow is elevated as a whole to the muscle-tendon complex of the active limb. Further work is necessary to determine how varying levels of regional sympathetic activity affect blood flow around the tendon in relation to muscle.
If blood flow around the tendon is associated with increased metabolic demand during exercise, it will be reflected in the O2 saturation measured by SRS as observed for muscle and its corresponding arterio-venous response. Conversely, increases in blood flow and O2 delivery to a tissue with a constant metabolic rate would result in no change in the tissue O2 consumption, and an increase in O2 saturation. The SRS-O2 saturation represents the quantitative sum of venous and arterialized blood O2 saturations in the specific tissue region based on an accurate determination of the proportions of these respective volumes (Matcher et al. 1993; Suzuki et al. 1999). Thus, the O2 saturation represents the net saturation of haemoglobin and indicates the balance between O2 delivery and O2 uptake. In both muscle and peritendinous regions, the O2 saturation at the light exercise loads (1–5 W) remained unchanged from the rest level, which indicates that increases in tissue O2 extraction were matched by elevated blood flow, and therefore by an equivalent increase in the volume of arterialized blood. In other words, increased O2 uptake was matched by an equivalent O2 delivery.
In addition, there were shifts in the blood volume for both muscle and peritendinous regions with exercise (Fig. 4). The drop in THb at the light loads (1–5 W) was due to mechanical extrusion of blood from the tissues induced by contraction (the muscle pump), and this pattern has been observed previously with both near-infrared spectroscopy (Boushel et al. 1998) and plethysmography (Athanasiu & Carvallo, 1898). The Hb and HbO2 volumes were extruded equally, leaving the SRS-O2 saturation in both tissue regions unchanged. The increase in THb towards baseline levels in both muscle and tendon regions at the high intensity loads (7–9 W) indicates a larger capillary volume probably due to local metabolic vasodilatation (Athanasiu & Carvallo, 1898; Hansen et al. 1996), as reflected by the rise in leg vascular conductance (Fig. 3) and increase in muscle and peritendinous blood flow.
At the highest work rates (7–9 W), the SRS-O2 saturation fell in both muscle and peritendinous regions indicating a lower local O2 saturation. This finding is in agreement with the concept that tissue oxygenation is an important factor regulating microvessel relaxation in contracting muscle (Granger et al. 1976; Saltin et al. 1998). The increase in blood volume was accounted for by a larger increase in deoxygenated blood (Hb) compared to the change in arterialized blood (HbO2), and as the SRS-O2 saturation accounts for the proportions of each volume in the region, this response indicates greater O2 extraction relative to increased blood flow. Furthermore, the progressive fall in HbO2 with increasing exercise loads provides evidence for greater extraction of O2 by both tissues, considering the concomitant increments in arterialized inflow. Accordingly, in the absence of greater O2 extraction, elevations in blood flow would increase HbO2.
Methodological considerations
An important methodological consideration in this study is the extent to which the SRS-O2 saturation measured around the tendon truly reflects oxidative metabolic activity of tendinous tissue. The SRS optodes were positioned directly over the tendinous tissue, in a region where there is no contribution from muscle (Fig. 6). The penetration depth and lateral spread of light are approximately equal to half the separation distance between the emitting and receiving optodes. At a spacing of 4 cm, the light penetration depth is approximately 2–3 cm, with only a small contribution (∼5 %) from superficial tissues such as skin and the thin adipose tissue layer in this region (Wyatt et al. 1990; Villringer et al. 1993). Thus, the majority of the light attenuation is presumed to arise from the vascular network around the Achilles' tendon, with some contributions from the tendon sheaths of the tibialis posterior, flexor hallicus longus, flexor digitorum longus and flexor retinaculum. Small veins draining the calcaneal region traverse the spectroscopied region, but these vessels comprise the vascular network of the Achilles' periosteum.
We presumed some activation of the muscles of the foot for stabilization of the ankle during dynamic plantar flexion. However, with the rotational axis directly at the ankle joint, it is unlikely that they were active to a significant extent. Furthermore, venous blood draining from the muscles of the foot feeds into the saphenous vein from branches distal to the Achilles' tendon region, and this large vein traverses the ankle anterior to the maleolus, far from the light probes.
Mechanisms for peritendinous O2 desaturation
It is not readily apparent from the results of this study what exactly accounts for a decrease in O2 saturation in the peritendinous region during exercise. While metabolic activity around the tendon region appears to be increased during exercise (Langberg et al. 1999b), a large increase in O2 utilization by tendons would not be expected as this tissue is non-contractile. The oxidative metabolic rate of tendon is in the order of 0.1 μl g−1 h−1 (Peacock, 1959). In the ischaemia experiments, the O2 desaturation rate was ∼7-fold lower around the tendon compared to calf muscle, reflecting a significantly lower resting metabolic rate. Therefore, with a flow increase to 14 ml (100 g)−1 min−1, it seems likely that the O2 utilization in the peritendinous region during exercise is related to a more metabolically active tissue. It is unlikely that the fall in SRS-O2 saturation is accounted for by the thin layer of adipose tissue in this region of the ankle as adipose O2 uptake is in the order of 1 μmol (100 g)−1 min−1 (Simonsen et al. 1994), with no appreciable increases found during exercise (J. Bülow, personal communication). Alternatively, the possibility cannot be excluded that the peritendinous blood was influenced by metabolic activity of muscle.
There are two possible explanations for the fall in O2 saturation around the tendon. Ley et al. (1988) reported that some tendon vessels are anatomically contiguous with nutritive capillaries of muscle. In the rabbit tenuissimus muscle, connective tissue vessels are supplied by transverse arterioles which first cross the muscle before branching into terminal arterioles leading to capillaries. Myrhage & Eriksson (1980) reported that this architecture is representative of muscle in general. It has been demonstrated that oxygen diffuses from arterioles to adjacent capillaries and also directly to the surrounding tissues. Swain & Pittman (1989) showed that PO2 and O2 saturation (SO2) fall in parallel along the arteriolar tree progressing from the largest (60 μm) arterioles, and approximately two-thirds of the fall in SO2 throughout the network occurs in the arteriolar network (Pittman, 1995). Thus, if arteriolar blood feeding the tendon first passes muscle tissue, it is plausible that significant unloading of O2 could occur before it arrives at the tendon.
Additionally, larger venules are often paired in close proximity with arterioles for at least two branching orders in skeletal muscle (Harris, 1986). It has been shown that diffusion of O2 and vasoactive substances such as nitric oxide occurs from venules to arterioles (Falcone & Bohlen, 1990; Saito et al. 1993, 1994). In many vascular networks, arterioles are accompanied by venules lying close enough for diffusion of O2 (Baez, 1977; Lash, 1987). Direct measurements of oxygenation in the venous network have also demonstrated that O2 is taken up progressively by venular blood from the end-capillary level to the systemic veins. This has been attributed to diffusive shunting between paired arterioles and venules and in some cases by venular uptake of O2 directly from the tissue. Thus, a venule draining the calf muscles could be in proximity with an arteriole feeding the tendon.
Taken together these two processes of O2 exchange could provide the basis for a decrease in SO2 around the tendon during exercise. The physiological purpose of this phenomenon may be to conserve oxygen and prevent the PO2 of tendinous tissue from rising to levels that might favour the generation of damaging oxygen free radicals (Pittman, 1995).
Regulation of peritendinous blood flow
What factors regulate blood flow around the tendon during exercise is not known. It has been suggested that tendon injury induced by loading activity may be associated with the release and accumulation of inflammatory metabolic substances (Langberg et al. 1999b). Thus, one physiological basis for such a large increase in blood flow around the tendon during exercise could be for the clearance of metabolites rather than substrate delivery. From a vasoactive regulatory standpoint, local metabolites such as PGE2 released from the tendon could serve to increase local blood flow (Langberg et al. 1999b). Alternatively, the blood flow and blood volume increase could result from a purely mechanical phenomenon, such as increased perfusion pressure. This explanation is supported by a previous study which showed the development of a pronounced negative interstitial fluid pressure in the Achilles' peritendinous region during exercise that was associated with an increased blood flow (Langberg et al. 1998, 1999a). Thus, blood could be pulled through the peritendinous region in a similar manner to the effect of the muscle pump during exercise (Sherriff et al. 1993).
In conclusion, the present findings indicate that blood flow increases and tissue oxygenation in the Achilles' peritendinous region parallel those in calf muscle during exercise. However, peak exercise blood flow in the peritendinous region is well below the maximal reactive hyperaemia flow. The fall in O2 saturation in both muscle and peritendinous tissues during intense work loads provides evidence for a coupling between regional O2 delivery and metabolic demand. Furthermore, the drop in muscle and peritendinous O2 saturations was associated with local vasodilatation. These parallel circulatory and oxidative responses to exercise in muscle and peritendinous regions provoke further questions about microcirculatory control and O2 transfer in the muscle-tendon complex during exercise.
Acknowledgments
This study was supported by the Danish National Research Foundation (504–14) and the Danish Medical Research Council (9802636). We would like to thank Ludwig Schleinkofer and Hamamatsu, Inc. for technical support.
References
- Athanasiu J, Carvallo J. Le travail musculaire et le rhythme due coeur. In: Bouchard Chaveau, Marey, editors. Archives de Physiologie, Normal et Pathologique. Paris: Masson et Cie Editeurs, Libraires de L'Académie de Medicine; 1898. pp. 348–362. [Google Scholar]
- Baez S. Skeletal muscle and gastrointestinal microvascular morphology. In: Kaley G, Altura BM, editors. Microcirculation. Baltimore, MD, USA: University Park Press; 1977. pp. 69–94. [Google Scholar]
- Barlow TE, Haigh AL, Walder DN. Evidence for two vascular pathways in skeletal muscle. Clinical Science. 1961;20:367–385. [PubMed] [Google Scholar]
- Boushel R, Pott F, Madsen P, Rådegran G, Nowak M, Quistorff B, Secher NH. Muscle metabolism from near infrared spectroscopy during rhythmic handgrip in humans. European Journal of Applied Physiology. 1998;79:41–48. doi: 10.1007/s004210050471. [DOI] [PubMed] [Google Scholar]
- Bülow J, Tøndevold E. Blood flow in different adipose tissue depots during prolonged exercise in dogs. Pflügers Archiv. 1982;392:235–238. doi: 10.1007/BF00584302. [DOI] [PubMed] [Google Scholar]
- Clark MG, Rattigan S, Dora KA, Newman JMB, Vincent MA. Interaction between blood flow, metabolism and exercise. In: Hargreaves M, Thompson M, editors. Biochemistry of Exercise. Champaign, IL, USA: Human Kinetics; 1998. pp. 35–46. [Google Scholar]
- Dow P. Estimations of cardiac output and central blood volume by dye dilution. Physiological Reviews. 1956;36:77–102. doi: 10.1152/physrev.1956.36.1.77. [DOI] [PubMed] [Google Scholar]
- Duncan A, Meek JH, Clemence M, Elwell CE, Tyszczuk L, Cope M, Delpy DT. Optical pathlength measurements on adult head, calf and forearm and the head of the newborn infant using phase resolved optical spectroscopy. Physics and Medicine in Biology. 1995;40:295–304. doi: 10.1088/0031-9155/40/2/007. [DOI] [PubMed] [Google Scholar]
- Falcone JC, Bohlen HG. EDRF from rat intestine and skeletal muscle venules causes dilation in arterioles. American Journal of Physiology. 1990;258:H1515–1523. doi: 10.1152/ajpheart.1990.258.5.H1515. [DOI] [PubMed] [Google Scholar]
- Folkow B, Haglund U, Jodal M, Lundgren O. Blood flow in the calf muscle of man during heavy rhythmic exercise. Acta Physiologica Scandinavica. 1971;81:157–163. doi: 10.1111/j.1748-1716.1971.tb04887.x. [DOI] [PubMed] [Google Scholar]
- Fossgren J. Die blutzirkulation in der achillessehne des menschen gemessen mit xenon-133. Acta Rheumatologica Scandinavica. 1969;15:67–71. [PubMed] [Google Scholar]
- Friedman JJ. Total, non-nutritional, and nutritional blood volume in isolated dog hindlimb. American Journal of Physiology. 1966;210:151–156. doi: 10.1152/ajplegacy.1966.210.1.151. [DOI] [PubMed] [Google Scholar]
- Granger HJ, Goodman AH, Granger DH. Role of resistance and exchange vessels in local microvascular control of skeletal muscle oxygenation in the dog. Circulation Research. 1976;38:379–385. doi: 10.1161/01.res.38.5.379. [DOI] [PubMed] [Google Scholar]
- Grant RT, Payling-Wright H. Anatomical basis for non-nutritive circulation in skeletal muscle exemplified by blood vessels of rat biceps femoris tendon. Journal of Anatomy. 1970;106:125–133. [PMC free article] [PubMed] [Google Scholar]
- Hansen J, Thomas GD, Harris SA, Parsons WJ, Victor RG. Differential sympathetic neural control of oxygenation in resting and exercising human skeletal muscle. Journal of Clinical Investigation. 1996;98:584–596. doi: 10.1172/JCI118826. [DOI] [PMC free article] [PubMed] [Google Scholar]
- Harris PD. Movement of oxygen in skeletal muscle. News in Physiological Science s. 1986;1:147–149. [Google Scholar]
- Hiatt WR, Huang SY, Regensteiner JG, Micco AJ, Ishimoto G, Manco-Johnson M, Drose J, Reeves JT. Venous occlusion plethysmography reduces arterial diameter and flow velocity. Journal of Applied Physiology. 1989;66:2239–2244. doi: 10.1152/jappl.1989.66.5.2239. [DOI] [PubMed] [Google Scholar]
- Langberg H, Bülow J, Kjær M. Blood flow in the peritendinous space of the human Achilles tendon during exercise. Acta Physiologica Scandinavica. 1998;163:149–153. doi: 10.1046/j.1365-201X.1998.00361.x. [DOI] [PubMed] [Google Scholar]
- Langberg H, Skovgaard D, Bülow J, Kjær M. Negative interstitial pressure in the peritendinous region during exercise. Journal of Applied Physiology. 1999a;87:999–1002. doi: 10.1152/jappl.1999.87.3.999. [DOI] [PubMed] [Google Scholar]
- Langberg H, Skovgaard D, Karamouzis M, Bülow J, Kjær M. Metabolism and inflammatory mediators in the peritendinous space measured by microdialysis during intermittent isometric exercise in humans. The Journal of Physiology. 1999b;515:919–927. doi: 10.1111/j.1469-7793.1999.919ab.x. [DOI] [PMC free article] [PubMed] [Google Scholar]
- Lash JM, Bohlen HG. Perivascular and tissue PO2 in contracting spinotrapezius muscle. American Journal of Physiology. 1987;252:H1192–1202. doi: 10.1152/ajpheart.1987.252.6.H1192. [DOI] [PubMed] [Google Scholar]
- Lassen NA, Lindberg JD, Munk O. Measurement of blood flow through skeletal muscle by intramuscular injection of Xenon-133. Lancet. 1964;1:686–689. doi: 10.1016/s0140-6736(64)91518-1. [DOI] [PubMed] [Google Scholar]
- Ley K, Linbom L, Arfors KE. Haematocrit distribution in rabbit tenuissimus muscle. Acta Physiologica Scandinavica. 1988;132:373–383. doi: 10.1111/j.1748-1716.1988.tb08341.x. [DOI] [PubMed] [Google Scholar]
- Magnusson G, Kaijser L, Isberg B, Saltin B. Cardiovascular responses during one- and two-legged exercise in middle aged men. Acta Physiologica Scandinavica. 1994;150:353–362. doi: 10.1111/j.1748-1716.1994.tb09699.x. [DOI] [PubMed] [Google Scholar]
- Matcher SJ, Kirkpatrick P, Nahid K, Cope M, Delpy DT. Absolute quantification methods in tissue near infrared spectroscopy. Journal of Biomedical Optics: Proceedings SPIE. 1993;2389:142–149. [Google Scholar]
- Myrhage R, Eriksson E. Vascular arrangements in hindlimb muscles of the cat. Journal of Anatomy. 1980;131:1–17. [PMC free article] [PubMed] [Google Scholar]
- Newman JMB, Steen JT, Clark MG. Vessels supplying septa and tendons as functional shunts in perfused rat hindlimb. Microvascular Research. 1997;54:49–57. doi: 10.1006/mvre.1997.2021. [DOI] [PubMed] [Google Scholar]
- Patterson GC, Whelan RF. Reactive hyperemia in the human forearm. Clinical Science. 1955;14:197–211. [PubMed] [Google Scholar]
- Peacock EE., Jr A study of the circulation in normal tendons and healing grafts. Annals of Surgery. 1959;149:415–428. doi: 10.1097/00000658-195903000-00011. [DOI] [PMC free article] [PubMed] [Google Scholar]
- Pittman RN. Influence of microvascular architecture on oxygen exchange in skeletal muscle. Microcirculation. 1995;2:1–18. doi: 10.3109/10739689509146755. [DOI] [PubMed] [Google Scholar]
- Saito Y, Eraslan A, Hester RL. Importance of venular flow in control of arteriolar diameter in hamster cremaster muscle. American Journal of Physiology. 1993;265:H1294–1300. doi: 10.1152/ajpheart.1993.265.4.H1294. [DOI] [PubMed] [Google Scholar]
- Saito Y, Eraslan A, Lackard V, Hester RL. Role of venular endothelium in control of arteriolar diameter during functional hyperemia. American Journal of Physiology. 1994;267:H1227–1231. doi: 10.1152/ajpheart.1994.267.3.H1227. [DOI] [PubMed] [Google Scholar]
- Saltin B, Rådegran G, Koskolou MD, Roach R. Skeletal muscle blood flow in humans and its regulation during exercise. Acta Physiologica Scandinavica. 1998;162:421–436. doi: 10.1046/j.1365-201X.1998.0293e.x. [DOI] [PubMed] [Google Scholar]
- Savard GK, Richter EA, Strange S, Kiens B, Christensen NJ, Saltin B. Norepinephrine spillover from skeletal muscle during dynamic exercise in man: role of muscle mass. American Journal of Physiology. 1989;257:H1812–1818. doi: 10.1152/ajpheart.1989.257.6.H1812. [DOI] [PubMed] [Google Scholar]
- Sheriff DD, Rowell LB, Scher AM. Is the rapid rise in vascular conductance at onset of dynamic exercise due to the muscle pump? American Journal of Physiology. 1993;265:H1227–1234. doi: 10.1152/ajpheart.1993.265.4.H1227. [DOI] [PubMed] [Google Scholar]
- Simonsen L, Bülow J, Madsen J. Adipose tissue metabolism in humans determined by vein catheterization and microdialysis techniques. American Journal of Physiology. 1994;266:E357–365. doi: 10.1152/ajpendo.1994.266.3.E357. [DOI] [PubMed] [Google Scholar]
- Suzuki S, Takasaki S, Ozaki T, Kobayashi Y. A tissue oxygenation monitor using NIR spatially resolved spectroscopy. Journal of Biomedical Optics: Proceedings SPIE. 1999;2395:124–129. [Google Scholar]
- Swain PD, Pittman RN. Oxygen exchange in the microcirculation of hamster retractor muscle. American Journal of Physiology. 1989;256:H247–255. doi: 10.1152/ajpheart.1989.256.1.H247. [DOI] [PubMed] [Google Scholar]
- Villringer A, Planck J, Hock C, Schleinkofer L, Dirnagle U. Near infrared spectroscopy (NIRS): a new tool to study hemodynamic changes during activation of brain function in humans. Neuroscience Letters. 1993;154:101–104. doi: 10.1016/0304-3940(93)90181-j. [DOI] [PubMed] [Google Scholar]
- Wyatt JS, Cope M, Delpy DT, Richardson CE, Edwards AD, Wray S, Reynolds EOR. Quantitation of cerebral blood volume in human infants by near-infrared spectroscopy. Journal of Applied Physiology. 1990;68:1086–1091. doi: 10.1152/jappl.1990.68.3.1086. [DOI] [PubMed] [Google Scholar]