Abstract
Differences in Mycoplasma hyopneumoniae colonization were evaluated in experimentally inoculated pigs sired by 3 different boars of the same genetic line. Forty-six pigs were used, including a treatment group and positive and negative control groups. The pigs were intratracheally inoculated with an M. hyopneumoniae suspension or with Friis media as a placebo. To evaluate differences in the magnitude of colonization during a 35-day period, nasal and tracheal swabs were collected weekly and tested by nested polymerase chain reaction (N-PCR). Temperature, weight and circulating antibodies were measured for 35 days. At 11 and 35 d postinoculation the pigs were necropsied and macroscopic and microscopic lesions were determined. A section of bronchus was tested by the indirect immunofluorescence test (IFAT), scanning electron microscopy (SEM) and N-PCR. The N-PCR results from the nasal and tracheal swabs showed that the pigs sired by one boar (B3) had a distinctive colonization pattern, different from that of the pigs from the other 2 boars and from the positive controls. SEM studies demonstrated that at 35 d postinoculation a higher proportion of B3 pigs had lower numbers of mycoplasmas attached to the cilia compared with B1 and B2 offspring. No significant differences were observed in temperature and weight gain among groups by ANOVA; however, with use of a 2 × 2 table, temperature differences were observed between pigs sired by boars B1 and B2 at 4 d postinoculation. No pigs seroconverted, showed gross or microscopic lesions, or had positive IFAT results. These results provide evidence of differences in patterns of colonization between pigs sired by different boars, suggesting a possible genetic effect.
Introduction
Mycoplasma hyopneumoniae is a primary agent associated with enzootic pneumonia and the porcine respiratory disease complex, which is considered one of the most important respiratory diseases in modern swine production (1). Both diseases are distributed worldwide and have an important economic impact on the industry.
The pathologic, histologic, and ultrastructural changes caused by this microorganism are well described (2,3,4,5); however, little is known of the dynamics in colonization of the upper respiratory tract and the role of host genetics in colonization.
Mycoplasma hyopneumoniae colonizes and adheres to the epithelium of the respiratory tract, and this attachment prevents removal by the combined action of the ciliated epithelium and mucus of the respiratory tract (6). Electron microscopic examinations of experimentally infected pigs have demonstrated that attached mycoplasmas are located predominantly between cilia and microvilli of the tracheal and bronchial epithelial cells. This attachment causes epithelial cell alterations, seen as progressive cellular damage at different postinoculation times (6). There are no published reports suggesting that susceptibility to M. hyopneumoniae colonization is influenced by a pig's genetic makeup. A better understanding of the process of M. hyopneumoniae colonization would be a first step leading to alternative tools for prevention and treatment of mycoplasmosis.
The purpose of this study was to create a model to study respiratory colonization and to determine if there are differences in the colonization of pigs sired by different boars of the same genetic line following experimental inoculation with M. hyopneumoniae. A low-challenge dose of M. hyopneumoniae was used, and the pigs were studied over a 35-day period.
Materials and methods
Animals
Three boars of the same genetic line (B1, B2, and B3) were each mated to 3 different sows. Forty-two pigs produced by these matings (14 from each boar) were selected for this study from a farm clinically and serologically negative for Mycoplasma and porcine reproductive and respiratory syndrome virus (PRRSV). The pigs were weaned at 2 wk of age and transported to the University of Minnesota isolation facility, where they were randomly allocated to 2 experimental groups. The Institutional Animal Care and Use Committee approved the protocol.
Experimental design
The experiment was performed as a double-blind design, so that the boar of origin for each individual pig was unknown, samples being identified by a random number. The experimental groups were distributed as follows: group 1 (treatment) included 36 pigs, 12 from each boar; group 2 (negative controls) included 6 pigs, 2 from each boar; and group 3 (positive controls) included 4 specific pathogen-free (SPF) pigs of a different genetic origin. This last group was included because we had previously successfully colonized pigs of this origin. Half of the pigs were necropsied at 11 d postinoculation and the other half at 35 d postinoculation. Differences in M. hyopneumoniae colonization were contrasted between the boars.
After arrival at the isolation units, the pigs were settled for 1 wk, during which the animals were not treated. To confirm their M. hyopneumoniae status, the pigs were bled and the serum was separated from each sample and tested by enzyme-linked immunosorbent assay (ELISA) for antibodies. In addition, nasal swabs were obtained to be evaluated with a nested polymerase chain reaction (N-PCR) test.
At 3 wk of age the pigs were challenged with 1 mL of a culture containing 1 × 10⁶ color change units (ccu) of M. hyopneumoniae cells. This low dose was selected because the aim of the study was colonization and not induction of lesions. Preliminary studies have indicated that higher doses produce about 5% macroscopic pneumonic lesions (results not shown).
The challenge was performed via the intratracheal route under light anesthesia induced by 0.2 mL per pig of a combination of 2 mL of xylazine (Rompun, 100 mg/mL; Bayer, Shawnee Mission, Kansas, USA) mixed in a 10-mL bottle of ketamine hydrochloride (Ketaset, 100 mg/mL; Fort Dodge Animal Health, Overland Park, Kansas, USA) injected intramuscularly. An intratracheal catheter was introduced with the aid of an endoscope and the challenge dose deposited directly on the tracheal mucosa (7). The same procedure was used in the negative control pigs but with 1 mL of sterile Friis medium.
Challenge strain
The challenge strain used was second-pass M. hyopneumoniae 232 (obtained from Dr. Alicia Trigo). This strain has been previously reported to colonize challenged pigs. The strain was cultured in Friis medium at 37°C for 1 wk, then put in aliquots and frozen at −70°C. On the day of challenge, one vial was thawed and the culture concentration measured using the ccu method (serial dilution in 5 replicate tubes).
Assessment of colonization
As it was not expected that lesions or clinical signs would be a major feature of this challenge model, monitoring of colonization was focused on detecting the challenge organism. Nested PCR, rectal temperature, weight gain, clinical signs, electron microscopy, immunofluorescence, and serology were used to monitor disease progress.
Colonization was assessed using an N-PCR technique developed and validated in our laboratory (8). Briefly, DNA was extracted after resuspension of the swabs in 300 μL of phosphate-buffered saline (PBS) and then ultracentrifuged at 18 300 × g for 10 min at room temperature (IEC Micromax; IEC International Equipment Company, Needham Heights, Massachusetts, USA). The supernatant was discarded and 200 μL of PrepMan (PE Biosystems, AB Applied Biosystems, Foster City, California, USA) reagent added. The sample was boiled for 10 min, then centrifuged at 15 800 × g for 5 min at room temperature, after which 50 μL of the supernatant was diluted with 50 μL of sterile double-distilled water.
Two sets of primers from the 16S ribosomal gene were used. The outer primer set consisted of a forward and a reverse primer as described by Mattsson and colleagues (9). The inner set consisted of a forward primer (5′-ACT AGA TAG GAA ATG CTC TAG T-3′; nucleotide positions 463 to 484) and a reverse primer (5′-GTC GAC TAC CAG GGTT ATC T-3′; nucleotide positions 797 to 815). As PCR templates 5 μL of the DNA preparation was used in the first reaction and 0.5 μL of the product in the second reaction. The amplification was performed in a 25-μL reaction mixture containing 0.2 μM concentration of each primer, 0.2 nM of each nucleotide, 1X PCR buffer, 5% glycerol, 3 nM MgCl2 and 1 U of Taq DNA polymerase. The 2 reactions were performed in the same thermocycler (GeneAmp PCR System 2400; ISC Bioexpress, Kaysville, Utah, USA) and under the same conditions: 30 cycles, denaturation at 94°C for 30 s, annealing at 60°C for 60 s, and extension at 72°C for 60 s. The final product was resolved with an agarose gel, photographed with an Eagle Eye system (Stratagene, La Jolla, California, USA), and processed with Adobe PhotoShop (Adobe, San Jose, California, USA).
Nasal and tracheal swabs were obtained at weekly intervals for 5 and 4 wk, respectively. In addition to these parameters, rectal temperature was recorded twice a week and individual weight gain was measured once a week. Clinical signs (respiratory distress and coughing) were monitored twice a week over 10-min observation periods.
At postmortem examination, full necropsies and macroscopic examination were performed. Lung sections from the apical and cardiac lobes were collected for microscopic examination. The tissues were fixed in buffered formalin and routinely processed with hematoxylin and eosin stain.
Quantitative evaluation
During the postmortem evaluation, a 1-cm section of bronchus was collected from the right lung, approximately 3 cm from the trachea. This segment was divided into 2 sections; one section was used for the indirect immunofluorescence test (IFAT) and the other half for scanning electron microscopy (SEM).
The IFAT samples were frozen in Tissue Tek II OCT (Scientific Products, Elkhart, Indiana, USA) and stored at −70°C. Samples were cut with a cryostat set at 4 μm at −20°C, fixed with chilled methanol for 10 min, and resolved with a conjugated monoclonal antibody to M. hyopneumoniae.
The SEM samples were processed as described by Blanchard and colleagues (5). Briefly, 0.5 cm2 of bronchus section was fixed in 2.5% glutaraldehyde in 0.1 M phosphate buffer, pH 7.2, for 48 h at 4°C. All tissues were washed 3 times (for 15 min) in phosphate buffer, dehydrated in graduated alcohol-water solutions at 10-minute intervals and in 100% ethanol solution for 15 min, then placed in acetone and dried at critical point in a Critical Point Dryer, model 814 (Tousimas, Rockville, Maryland, USA) (40°C, 80 bar). The samples were attached to brass stubs with silver-print conductive paint and subsequently coated with gold in a vacuum evaporator. The number of microorganisms that adhered to the epithelial cells was determined by averaging 10 observation fields per pig at 10 000X. Microorganisms were identified as M. hyopneumoniae on the basis of their size and shape, as well as adherence to the villi tips as described by other authors (5). Additional confirmation was obtained through N-PCR, which differentiates M. hyopneumoniae from all other pig Mycoplasma species (8).
A swab sample was taken from the bronchus in the same region of the left lung and used for N-PCR. To achieve a measure of quantification using PCR, the 2 N-PCR reactions were visualized independently in an agarose gel, and variations in band intensity were compared. The difference in sensitivity between the 2 reactions is equivalent to 2 logarithms in Mycoplasma CCU. Nested PCR is able to detect 102 M. hyopneumoniae.
Serology
Blood samples were taken before inoculation, at 4 wk postinoculation, and at the time of the necropsies. Seroconversion to Mycoplasma was evaluated by Tween-ELISA at the University of Minnesota Diagnostic Laboratory (10).
Statistics
Differences in colonization detected by SEM and N-PCR, temperature, and body weight among pigs of different boars, and among pigs of different boars and positive and negative control pigs, were analyzed by analysis of variance (ANOVA) or by Kruskal-Wallis one-way nonparametric ANOVA, depending on whether or not the test results had a normal distribution. Bonferroni's test was used to compare means between groups.
The N-PCR results from the nasal and tracheal swabs were analyzed by the 2 × 2 table method, using positive or negative as a cut-off point. Temperatures were analyzed in the same way, using 40°C or higher as a cut-off point. SEM and bronchial N-PCR results were also analyzed by the 2 × 2 table method, using an average of 20 or more Mycoplasma cells per field and positive or negative results as the cut-off point, respectively.
The correlation between the SEM and N-PCR results with the bronchial tissues was assessed by Spearman's correlation.
Results
None of the pigs had antibodies against M. hyopneumoniae (as detected by ELISA) before challenge. Nasal swabs were also negative for M. hyopneumoniae (by N-PCR) in all pigs before challenge. Three pigs (2 sired by boar B2 and 1 by boar B3) died of unrelated causes, with lesions suggestive of Glasser's disease.
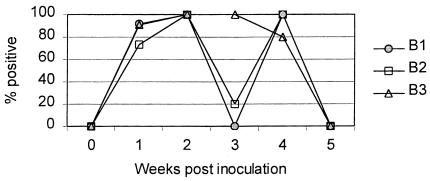
Using N-PCR it was possible to detect M. hyopneumoniae in nasal and tracheal swabs following challenge, as summarized in Figures 1 and 2. The results of the N-PCR in nasal swabs indicated 2 patterns, one in the pigs sired by boars B1 and B2 as well as the positive controls and a different one in the pigs sired by boar B3 (Figure 1). The offspring of boars B1 and B2 were negative 3 wk postchallenge, with the exception of a pig sired by boar B2. Another 2 pigs sired by boar B2 were negative at 1 wk postinoculation and became positive by 2 wk postinoculation. One pig sired by boar B3 became negative a week earlier than the rest of its group. These pigs were tested by N-PCR of tracheal swabs.
Figure 1. Percent of challenged pigs positive by nested polymerase chain reaction (N-PCR) in nasal swabs. B1: pigs sired by boar 1; B2: pigs sired by boar 2; B3: pigs sired by boar 3.
Analysis of the proportion of positive responders in the N-PCR of nasal samples showed a significant difference between the pigs 3 wk postchallenge with a 2 × 2 table and positive or negative results as the cut-off point (P value: B1 × B2 = 0.45, B1 × B3 = 0.002, B2 × B3 = 0.047).
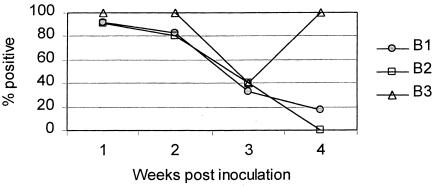
Similarly, the N-PCR results from the tracheal swabs showed 2 patterns, one in the pigs sired by boars B1 and B2 and another in those sired by boar B3 (Figure 2). Two of the 5 pigs sired by boar B3 were positive 3 wk postinoculation. One pig sired by boar B1 showed the same pattern as that seen in most of the pigs sired by boar B3. The rest of the pigs sired by boar B1, together with the pigs sired by boar B2, became negative at different periods, until all were negative 4 wk postinoculation.
Figure 2. Percent of challenged pigs positive by N-PCR in tracheal swabs. B1: pigs sired by boar 1; B2: pigs sired by boar 2; B3: pigs sired by boar 3.
Analysis of the frequency of tracheal responders in the N-PCR with a 2 × 2 table and positive or negative results as a cut-off point showed a significant difference only at 4 wk postchallenge (P value: B1 × B2 = 1.00, B1 × B3 = 0.015, B2 × B3 = 0.008).
The challenged pigs showed an increase in temperature 4 d and 2 wk postinoculation, but the difference between the challenged and control groups was not significant by ANOVA (data not shown). Using a 2 × 2 table and 40°C or higher as a cutoff point for fever, the only significant difference between the pigs was at 4 d postchallenge (P value: B1 × B2 = 0.04, B1 × B3 = 0.19, B2 × B3 = 0.41).
No significant weight differences were found among the groups of pigs or between these groups and their respective control groups by ANOVA (P value = 0.05; data not shown). No clinical signs or specific gross or microscopic lesions were observed in any of the pigs at necropsy, and the IFAT results were negative for all the pigs.
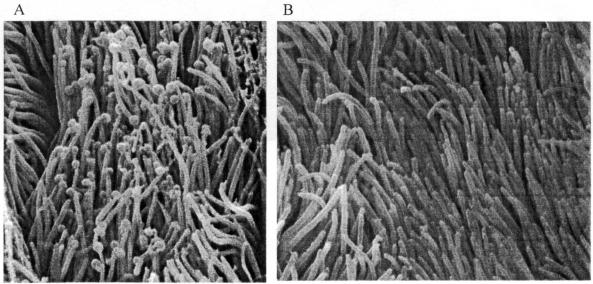
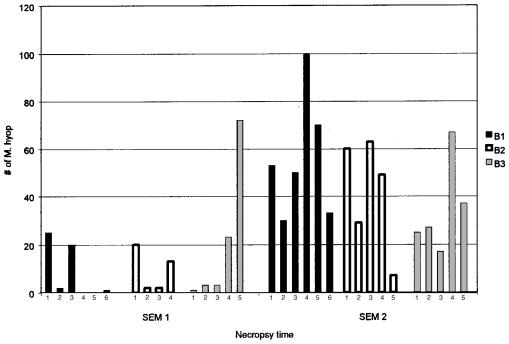
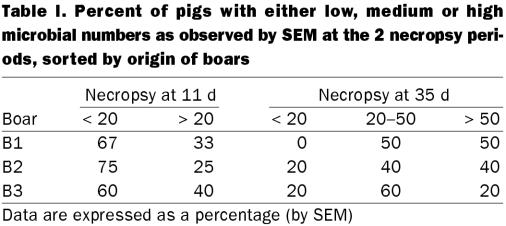
On the basis of location, size and morphology, SEM of the bronchial tissues showed that all the challenged pigs were colonized by M. hyopneumoniae (Figure 3A), with the exception of 2 pigs sired by boar B1 (Figure 4, Table I). Two samples could not be analyzed by SEM; one sample from a descendant of boar B3 was incorrectly processed, and one from a pig sired by boar B2 had an excess of mucus, which interfered with the microbial counts.
Figure 3. Ciliated bronchial epithelium at a magnitude of 10 000X, A) from a colonized pig at 35 d postinoculation, B) from a negative control (non-colonized) pig at 11 d postinoculation.
Figure 4. Results of bronchial scanning electron microscopy for the challenged pigs at the 2 necropsy times. B1: pigs sired by boar 1; B2: pigs sired by boar 2; B3: pigs sired by boar 3.
Table I.
The average numbers of mycoplasmal cells observed at the 2 necropsy periods are summarized in Table II. At 11 d postinoculation, significant differences were not found among the pigs when the numbers were analyzed by boar (P = 0.48). Similar results were obtained using a 2 × 2 table and an average of 20 mycoplasmas or more per field as the cut-off point.
Table II.
Bronchial tissues obtained 35 d postinoculation showed no significant differences by SEM in the 3 boars' offspring (P = 0.28). Similar results were obtained using a 2 × 2 table; however, the statistical analysis suggested that one of the pigs sired by boar B3 could be an outlier. A new analysis, excluding this pig, showed a clearer trend to fewer mycoplasmas attached in the B3 pigs' bronchi, though the difference was not significant (P = 0.08).
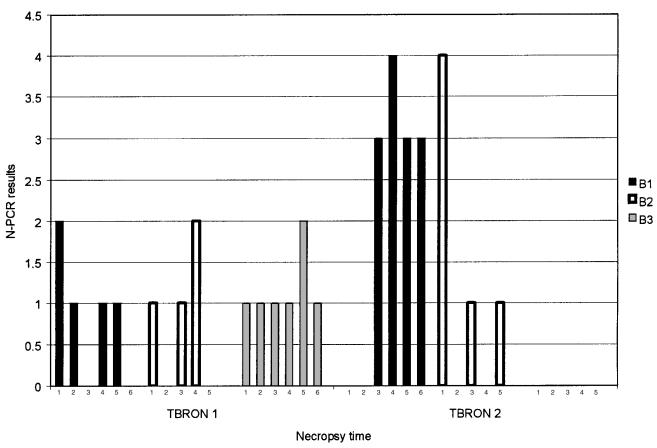
The N-PCR results for the bronchial swabs collected 11 and 35 d postinoculation are summarized in Figure 5. The results for those collected 11 d postinoculation were evaluated by ANOVA and a 2 × 2 table. Significant differences were not found among the groups of pigs sired by different boars (P = 0.61). The results with the swabs collected 35 d postinoculation showed a non-normal distribution and were, therefore, analyzed using a Kruskal-Wallis one-way nonparametric ANOVA. Significant differences were not found among the groups of pigs sired by different boars (P = 0.065); however, the statistical analysis suggested that the results for one of the pigs sired by boar B2 could be an outlier. When this pig's results were taken away, the results for the pigs sired by boar B3 were statistically different from those for the pigs sired by boar B1 (P = 0.045) but not from those sired by boar B2. On the other hand, this difference was not found when the data were analyzed by a 2 × 2 table (P value: B1 × B2 = 0.5; B1 × B3 = 0.06; B2 × B3 = 0.17). Additionally, a positive correlation was found between the SEM and N-PCR results with bronchial tissues (r = 0.36, P = 0.015).
Figure 5. Bronchial N-PCR results for the challenged pigs at the 2 necropsy times. B1: pigs sired by boar 1; B2: pigs sired by boar 2; B3: pigs sired by boar 3. Scores: 0 = negative to N-PCR; 1 = positive only to the second reaction of the N-PCR; 2 = strongly positive only to the second reaction of the N-PCR; 3 = positive to the first reaction of the N-PCR; 4 = strongly positive to the first reaction of the N-PCR.
The negative control pigs that were euthanized 11 d postinoculation were negative by N-PCR and SEM at necropsy (Figure 3B). At 35 d postinoculation, all control pigs had become positive in nasal swabs, deep pulmonary swabs and SEM. The results for the positive control pigs showed patterns similar to those for the pigs sired by boars B1 and B2 in the nasal, tracheal, and bronchial swabs, as well as in SEM (results not shown). None of the pigs seroconverted during the experiment.
Discussion
The objective of this study was to develop a model to quantitatively evaluate M. hyopneumoniae colonization and to use it in a pilot study to assess if differences exist in the colonization in pigs sired by different boars. The model allowed a quantitative and qualitative assessment of Mycoplasma colonization by use of N-PCR and SEM with nasal and tracheal swabs.
The N-PCR results from the nasal swabs clearly showed 2 patterns of M. hyopneumoniae detection in the pigs sired by the different boars. Pigs sired by boar B3 were positive for M. hyopneumoniae throughout the experiment but became negative at the end. On the other hand, pigs sired by the other 2 boars showed a temporary negative period 3 wk postinoculation and became positive again and then negative again at the end of the experiment. This difference in patterns was statistically significant.
The N-PCR results from the tracheal swabs also showed 2 patterns for the same groups of pigs. The pigs became negative over time, with the exception of those sired by boar B3, which were positive at the end of the experiment. This difference in patterns was also significant and, together with the different patterns for the nasal swabs, could represent a difference in colonization attributable to the source of the boar. The fact that each boar was mated with 3 different sows raises the question of the effect of the female in these different patterns. However, a sow effect should result in individual differences between pigs sired by the same boar, which were largely absent. This suggests that most of the differences observed can be attributed to a boar effect.
More research is needed to understand why some pigs had negative tracheal swabs but positive nasal swabs (or vice versa) at the same time. Assuming that the pigs were infected at all times, a possible explanation is that different pigs have different patterns of shedding or that shedding is a nonlinear process, in which the amount of bacteria shed depends on the host's ability to eliminate the microorganism combined with the microorganism's ability to adhere to the cilia. An alternative explanation could be that some pigs became negative and were afterwards reinfected by a penmate. It is possible that the pigs with strong nasal swab PCR reactions (positive in the first N-PCR test), compared with other pigs at the same times, were either clearing the attached mycoplasmas or were actively shedding following colonization.
Rectal temperatures showed, on average, only slight differences between negative controls and challenged pigs; however, these differences were statistically non-significant. The challenged pigs had an increase in temperature at both 4 and 14 d postinoculation. This can probably be attributed to the infection, since the negative controls did not show the same temperature pattern. This temperature variation is in agreement with the findings of Kobisch and colleagues (11). The slight increase in temperature of 2 of the negative control pigs at 14 d postinoculation might be attributable to accidental colonization. At the end of the experiment, all groups again showed a trend of increased temperature, with the exception of the control pigs sired by boar B2. On the other hand, there were no clear differences in rectal temperatures among the groups of pigs sired by the 3 boars. The only significant differences observed with 2 × 2 analysis were at 4 d postinoculation, when pigs sired by boar B3 had a significantly higher temperature than those sired by boar B1. This difference is in agreement with other parameters measured between these 2 boars.
During the experiment no significant weight differences, on average, were observed between the groups of pigs sired by the different boars. At 3 wk postinoculation the pigs sired by boar B3 had a slightly higher weight than the pigs sired by boar B1, but at the end of the experiment the weights were similar. The pigs sired by boar B2 had a slightly lower weight than the pigs in the other 2 groups. The control pigs had a better performance overall than the treated pigs. None of these small weight differences proved to be statistically significant, suggesting that the Mycoplasma challenge was very low, as had been intended. Also, the number of pigs studied was small, so that slight differences did not prove statistically significant. The low challenge could also explain the absence of coughing and the lack of seroconversion described by other researchers (11).
Neither the challenge nor the control pigs seroconverted during the experiment. This is in agreement with findings from other authors using experimental challenges (Thacker, personal communication) and with the delayed seroconversion described for this microorganism (12). Additionally, the results of the gross and microscopic studies and the IFAT concur with the ELISA results and probably reflect the low sensitivity described for both the IFAT and histopathology (13). These results also reflect the fact that a low challenge dose was used. This may have resulted in microbial colonization below the threshold of sensitivity for the IFAT. Under experimental conditions, microscopic lesions have been described after 4 or 5 wk postinoculation (14). Most of these trials, however, used lung homogenates, which have been shown to produce about 5% of lung lesions and are probably more effective than pure cultures in inducing lesions.
Analysis of the challenged groups indicated that at 11 d postinoculation the number of Mycoplasma cells observed by SEM was on average less than 26 cells/field, with the exception of one pig sired by boar B3 that had an average of 72. There were no obvious trends associated with the sire in these pigs at this time. By contrasting the N-PCR results for the 2 necropsy periods with the SEM results, it can be seen that the N-PCR was able to more efficiently detect the lower amount of microorganisms found at 11 d postinoculation. A possible explanation is that at this time the M. hyopneumoniae were not well attached to the cilia and were being shed in the mucus. This would allow their detection by N-PCR (which samples mucus and dead cells primarily) but not by SEM, as the mucus was eliminated through the washing process.
At 35 d postinoculation, higher numbers of M. hyopneumoniae were observed by SEM, suggesting active infection. On average, the pigs sired by boar B3 had fewer microorganisms per field (34). This average, however, was slanted because one pig from this group had more than 60 microorganisms per field, which increased the average from 26 to 34 microorganisms per field. The pigs sired by boar B1 had 56 microorganisms per field on average; the pigs sired by boar B2 had more than 41, but there was an outlier that had only 7 microorganisms per field. This increase in the number of M. hyopneumoniae detected by SEM from pigs sired by boars B1 and B2 could be associated with the decrease in positive tracheal swab N-PCR results for these pigs over time, probably as a result of the Mycoplasma adhering to the cilia and fewer being present in the mucus. In contrast, more tracheal samples from the pigs sired by boar B3 were positive by N-PCR (mucus) but had fewer adhered microorganisms, suggesting that these pigs were clearing the infection more effectively.
These findings together allow for a better understanding of the N-PCR, especially for nasal swabs. Mycoplasma hyopneumoniae does not normally colonize the nose in pigs, so its detection in that site has been difficult to explain. The present results suggest that the nasal swab results tend to be positive at the beginning of the infection process, then are negative, and finally revert to positive. The SEM results suggest that the early positive signals are seen at a time when few Mycoplasma cells are attached to the cilia, suggesting that these signals come from presumably dead cells being cleared by the mucus escalator. Following this, Mycoplasma cells become firmly attached, there is little mucus clearing, and the nasal swab N-PCR becomes negative. Although not seen in this experiment, there is evidence of a later sudden proliferation of Mycoplasma, with the formation of microcolonies, which presumably results in the late positive N-PCR results seen in the field.
The pigs sired by boar B3 had fewer microorganisms at the time of necropsy and a very different pattern of N-PCR results after challenge, but before death, than the pigs sired by the other 2 boars. Temperature and weight gains were higher and lower, respectively during colonization of the pigs sired by boar B3; however, the differences were not statistically significant.
The smaller numbers of Mycoplasma cells observed in the offspring of boar B3 could be the result of increased resistance to colonization or increased ability to clear the microorganisms from the cilia, once established.
The samples used for SEM allowed visualization of only a small segment of the bronchus, so individual sample variations could be expected. This may explain the 2 pigs that were negative by SEM at the first necropsy period. However, each sample was read at 5 different fields, in an attempt to minimize errors caused by assessing areas with abnormally high or low numbers of organisms.
A challenge model that relies on colonization using a low dose probably represents more accurately the natural infection conditions on the farm.
The negative control pigs probably got infected or contaminated in the isolation units, since these are older facilities and the staff was in transition at the time. Airborne transmission is another possibility (1,15), although the air is HEPA-filtered between the rooms. However, it is surprising that in these pigs superficial swabs were positive but deep pulmonary swabs and SEM observations were not at the first necropsy period. This suggests that these pigs may have been experiencing the beginning of the infection process or that these early N-PCR-positive samples may have resulted from sample contamination. At the end of the experiment, at 35 d postinoculation, all the control pigs had become positive according to the nasal swabs, as well as the deep pulmonary swabs and SEM. However, the number of microorganisms observed per field was quite low, suggesting that the challenge load was small. Such a low challenge could result from mechanical transfer through contaminated hands or from coveralls worn from one unit into another.
Although this study reveals distinctive patterns of colonization, the number of pigs used was too small to determine statistically significant differences between groups of pigs from different boars or between treatment and control groups; thus, it is possible only to show trends. This small number as well as the possible sow effect could influence the trends observed in this experiment. Additional experiments will be needed to confirm if the trends are true.
Footnotes
Address correspondence and reprint requests to Dr. C. Pijoan, tel: 612-625-1233, fax: 612-625-1210, e-mail: pijoa001@tc.umn.edu
Received August 13, 2001. Accepted December 11, 2001.
References
- 1.Ross RF. Mycoplasmal diseases. In: Straw B, D'Allaire S, Mengeling W, Taylor D, eds. Diseases of Swine. Ames, Iowa: Iowa State Univ Pr, 1999:495–510.
- 2.Ross RF. Pathogenicity of swine Mycoplasma. Ann N Y Acad Sci 1973;25:347–368.
- 3.Whittlestone P. Enzootic pneumonia in pigs. Adv Vet Sci Comp Med 1973;17:1–55. [PubMed]
- 4.Messier S, Ross RF, Paul PS. Humoral and cellular immune response of pigs inoculated with Mycoplasma hyopneumoniae. Am J Vet Res 1990;1:52–58. [PubMed]
- 5.Blanchard B, Vena MM, Cavalier A, Le Lannic J, Gouranton J, Kobisch M. Electron microscopic observation of the respiratory tract of SPF pigs inoculated with Mycoplasma hyopneumoniae. Vet Mic 1992;30:329–341. [DOI] [PubMed]
- 6.Razin S. The mycoplasmas. Microbiol Rev 1978;42:414–470. [DOI] [PMC free article] [PubMed]
- 7.Solano G, Pijoan C. A simple technique for tracheal culture to detect respiratory pathogens in live pigs. Swine Health Prod 1997;5:30–31.
- 8.Calsamiglia M, Pijoan C, Trigo A. Application of a nested polymerase chain reaction assay to detect Mycoplasma hyopneumoniae from nasal swabs. J Vet Diag Invest 1999;11:246–251. [DOI] [PubMed]
- 9.Mattsson JG, Bergstrom K, Wallgreen P, Johansson K. Detection of Mycoplasma hyopneumoniae in nose swabs from pigs by in vitro amplification of the 16S rRNA gene. J Clin Microbiol 1995;33: 893–897. [DOI] [PMC free article] [PubMed]
- 10.Nicolet J, Paroz P, Bruggmann S. Tween 20 soluble proteins of Mycoplasma hyopneumoniae as antigen for an enzyme-linked immunosorbent assay. Res Vet Sci 1980;29:305–309. [PubMed]
- 11.Kobisch M, Blanchard B, Le Potier MF. Mycoplasma hyopneumoniae infection in pigs: duration of the disease and resistance to reinfection. Vet Res 1993;24:67–77. [PubMed]
- 12.Strasser M, Abiven P, Kobisch M, Nicolet J. Immunological and pathological reactions in piglets experimentally infected with Mycoplasma hyopneumoniae and/or Mycoplasma flocculare. Vet Immunol Immunopathol 1992;31:141–153. [DOI] [PubMed]
- 13.Feenstra AA, Sorensen V, Friis NF, Jensen NE, Bille-Hansen V. Experimental Mycoplasma hyopneumoniae infection in pigs. Proc 13th Cong Int Pig Vet Soc 1994:187.
- 14.Hannan P, Banks R, Bhogal B, Blanchflower S, Donald A. Reproducible pneumonia in gnotobiotic piglets induced with broth cultures of Mycoplasma hyopneumoniae and the effect of animal passage on virulence. Res Vet Sci 1994;36:153–163. [PubMed]
- 15.Stark KDC. The role of infectious aerosols in disease transmission in pigs. Vet J 1999;158:164–181. [DOI] [PubMed]


