

Abstract
In vivo microinjections of 55FeCl3 were made to assess renal iron (Fe2+/3+) transport in the anaesthetized rat.
Following microinjection into proximal convoluted tubules (PCTs), 18·5 ± 2·9 % (mean ± s.e.m., n = 11) of the 55Fe was recovered in the urine. This recovery was not dependent on the injection site indicating that iron is not reabsorbed across the surface convolutions of the proximal tubule.
Following microinjection into distal convoluted tubules (DCTs) 46·1 ± 6·1 % (n = 8) of the injected 55Fe was recovered. Taken together the recovery data from the PCT and DCT microinjection studies indicate that the transport of iron occurs in the loop of Henle (LH) and collecting duct system.
In vivo luminal microperfusion was used to examine iron transport by the LH in more detail. In tubules perfused with 7 μmol l−155FeCl3, 52·7 ± 8·3 % (n = 8) of the perfused 55Fe was recovered in the collected fluid, indicating significant iron reabsorption in the LH. Addition of copper (Cu2+ as 7 μmol l−1 CuSO4), manganese (Mn2+ as 7 μmol l−1 MnSO4) or zinc (Zn2+ as 7 μmol l−1 ZnSO4) to the perfusate did not affect reabsorption of water, Na+ or K+, but increased recovery of 55Fe to 83·5 ± 6·8 % (n = 8, P < 0·04), 75·8 ± 5·9 (n = 6, not significant, n.s.) and 67·9 ± 3·8; (n = 9, n.s.), respectively.
Thus, iron transport in the LH can be reduced by the addition of copper or manganese to the luminal perfusate suggesting that these ions may compete with iron for a common transport pathway. However, this pathway may not be shared by zinc.
Iron (Fe2+/3+) is an integral part of a diverse array of biologically active molecules, which form key components of homeostatic processes that are central to life. As part of the porphyrin group of haem it is a fundamental constituent of haemoglobin and the cytochromes (Alfrey, 1992; Didonato & Sarkar, 1997; Ponka, 1999). It is also a component of the non-haem prosthetic groups in enzymes of the electron transport chain, e.g. NADH-coenzyme Q reductase. However, the reactive properties that make iron desirable from a biochemical standpoint are precisely those that make it potentially hazardous. Because of this it is critical that the total amount of iron in the body is tightly regulated and the concentration of free, ionized Fe2+ or Fe3+ is minimal. Thus, most of the iron circulating in the blood is bound to the plasma protein transferrin (Tf) and within cells iron is tightly bound to ferritin. In this way the amount of free iron is tightly controlled and is thought to be very low.
It is widely held that control of iron in the body is mainly dependent on tight regulation of gastrointestinal (GI) uptake from the diet to balance iron loss via GI and biliary routes. Although renal excretion is central to the control of the divalent cations calcium (Ca2+) and magnesium (Mg2+), it is thought to play little, if any, role in regulating iron levels. However, this assumption must be questioned because it is clear from the paucity of literature relating to renal iron handling that little is actually known about how the kidney handles iron. The current dogma is that loss is unaltered in response to altered dietary iron content or during disease states. An exception is proteinuria when iron bound to protein is lost in the urine (Alfrey & Hammond, 1990; Alfrey, 1992). Under normal circumstances iron is lost via the kidneys, but whether the kidneys exert control over the amount of iron excreted is unclear. There is evidence to suggest that renal tubular cells do transport iron although whether this process is regulated is unknown (for example see Blumenthal et al. 1994). Recent, molecular biology experiments have shown that large amounts of mRNA encoding the divalent metal transporter DMT1 are present in the kidney. As well as iron, this protein transports several other divalent metals, but does not transport calcium or magnesium. Interestingly, DMT1 mRNA has been shown to increase in response to a decrease in dietary iron, suggesting that the kidney may adapt to altered iron availability (Gunshin et al. 1997).
Given the lack of data concerning renal iron handling and the discovery of DMT1, the aims of the current study were to determine and characterize the nephron sites of iron reabsorption in the rat by in vivo micropuncture.
METHODS
Experimental animals
Micropuncture experiments were performed on male Sprague-Dawley rats (312 ± 26 g). Anaesthesia was induced with Inactin (5-ethyl-5(11-methyl-propyl)-2-thiobarbiturate; RBI) at a dose of 100–110 mg kg−1i.p. Once a satisfactory level of anaesthesia was achieved (assessed by the absence of pinch and corneal reflexes) the animal was placed on a thermostatically controlled table set to maintain body temperature at 37°C. Additional anaesthetic (diluted 1:10 with 0.9% NaCl) was administered i.v. as appropriate to maintain a satisfactory level of anaesthesia. The animal was prepared for micropuncture as described by Green and co-workers (1974). Upon completion of surgery animals with a proximal tubule transit time in excess of 12 s or a mean arterial pressure below 100 mmHg were rejected.
Renal microinjections
Site(s) of iron transport were identified by microinjection of 55FeCl3 into individual proximal convoluted tubules (PCTs) or distal convoluted tubules (DCTs) using a previously described methodology (Velazquez & Wright, 1992). Briefly, for microinjections into PCTs, calibrated micropipettes (5-30 nl) were introduced into randomly selected PCTs and solution injected into the flowing stream of tubular fluid. Immediately upon completion of a microinjection, timed, sequential urine collections were made directly into vials containing 4 ml of scintillant (Optiphase HiSafe II, LKB). For DCTs, a micropipette containing injection solution (minus isotopic label) was introduced into a randomly selected PCT. The solution was injected and the movement of dye was monitored to identify DCTs with convolutions on the surface of the kidney. Injections were then made as described for PCTs above. The solution injected into PCTs contained: 145 mmol l−1 NaCl, 10 mmol l−1 Bis-Tris (pH 6.9), 0.05 % erioglaucine dye, 12.5 μCi ml−114C, 650 μCi ml−155FeCl3. For DCT injections the solution contained: 65 mmol l−1 NaCl; 10 mmol l−1 Bis-Tris (pH 6.0), 0.05 % erioglaucine dye, 12.5 μCi ml−114C; 650 μCi ml−155FeCl3.
At the end of an experiment, arterial blood (5-10 ml) was withdrawn via the descending aorta and the animals were subsequently given an overdose of anaesthetic. The microinjected tubules were filled with a silicone rubber solution (Microfil; Flow Tek, Boulder, CO, USA) and the filled kidney removed and stored overnight in deionized water at 4°C. The distance of the puncture site from the glomerulus (PCTs) or the macula densa (DCTs) was determined from dissection of the silicone rubber casts as previously described by Green et al. (1974). The amounts of [14C]inulin and 55FeCl3 present in urine were measured by liquid scintillation counting and data for 55Fe transport was calculated as a percentage of the collected/perfused disintegrations per minute (d.p.m.).
Microperfusion of loops of Henle
Loops of Henle (LH) with surface convolutions were perfused using continuous microperfusion methodology (Velazquez & Wright, 1992). Briefly, loops of Henle were perfused at 20 nl min−1 with one of the following perfusates: a physiological control solution containing 128 mmol l−1 NaCl, 12 mmol l−1 NaHCO3, 3.6 mmol l−1 KCl, 1 mmol l−1 MgCl2, 0.38 mmol l−1 NaH2PO4, 1.62 mmol l−1 Na2HPO4, 0.05 % erioglaucine dye, 12.5 Ci ml−1[14C]inulin and 7 μmol l−1 55FeCl3 at 50 μCi ml−1 and adjusted to pH 6.9 with 95 % O2-5 % CO2. To further characterize iron transport, 7 μmol l−1 of CuSO4, ZnSO4 or MnSO4 was added to this solution. Surface PCTs, with corresponding surface DCTs, were identified by injection of a solution containing erioglaucine dye into randomly selected tubules. The perfusion pipette was placed in the last accessible convolution of the PCT and timed collections were made from the first accessible portion of the DCT, the LH being isolated from the rest of the tubule by the injection of mineral oil blocks into the tubule lumen.
Measurement of urine and blood variables
The collected tubular fluid was dispensed under oil and the volume measured from the diameter of the droplet using a calibrated eyepiece micrometer. [14C]inulin and 55FeCl3 were measured by liquid scintillation counting. 55Fe transport was calculated as the percentage remaining of the collected/perfused d.p.m. The concentrations of sodium and potassium in the perfusate and collected fluid were measured by electrothermal atomic absorption spectrophotometry (ETASS; Perkin Elmer Zeeman 3030) using a previously described protocol (Shalmi et al. 1994). The concentrations of iron and copper in serum and iron in urine were measured by flame atomic absorption spectrophotometry (FAAS; Perkin Elmer 3100) using previously described protocols (Olson & Hamlin, 1969; Fernandez & Kahn, 1971). Additional experiments were performed to assess the total serum and ultrafiltrable fraction of iron. Briefly, 0.75 ml plasma was mixed with an equal volume of 20 % trichloroacetic acid (TCA) and heated to 90°C for 15 min. The sample was cooled and centrifuged at 14000 r.p.m. for 8 min at room temperature. The supernatant was aspirated into a clean tube and analysed by FAAS. Standards were prepared in 10 % TCA solution with 10 % TCA as a blank. Following dilution with deionized H2O, urinary iron concentration was measured using FAAS. For measurement of serum copper, samples were diluted 1:1 with deionized H2O and measured by FAAS using glycerol-based standards. To measure ultrafiltrable ion concentrations, plasma was spun at 3000 g relative centrifugal force for 20 min through a 30 kDa filter (Centrifree micropartition system; Amicon). This method yields an ultrafiltrate analogous to that produced by the glomerulus (Kibble et al. 1993). Filtrate was assayed using FAAS. Fluid reabsorptive rate (JV, in nl min−1) and net ion fluxes (JX, in pmol min−1) were calculated using standard equations (Wilson et al. 1997).
Statistical significance was assessed using single factor ANOVA with Scheffé's post hoc test (Zar, 1984). Values for ion and fluid fluxes and isotope recoveries are presented as means ±s.e.m. throughout the text, where n is the number of tubules unless otherwise stated.
RESULTS
Serum and ultrafiltrate measurements
Mean values for the serum iron (by TCA precipitation of plasma proteins, Olson & Hamlin, 1969; Fernandez & Kahn, 1971) and ultrafiltrate iron (plasma spun through 30 kDa Amicon Centrifree micropartition system), urine iron and serum copper concentrations are shown in Table 1. There were no significant differences between any of the experimental groups. The mean serum iron concentration was 7.5 times greater than the mean concentration of iron measured in the ultrafilterable fraction of serum.
Table 1. Serum, ultrafiltrate (UF) and urine iron and serum copper concentrations from renal microinjection study.
| Serum [Fe2+/3+] | UF[Fe2+/3+] | Urine [Fe2+/3+] | Serum [Cu2+] | |
|---|---|---|---|---|
| Control | 2.3 ± 0.3 (6) | 0.3 ± 0.1 (6) | 0.7 ± 0.2 (6) | 0.3 ± 0.0 (6) |
| CuSO4 | 2.0 ± 0.1 (4) | 0.2 ± 0.0 (4) | 0.9 ± 0.1 (4) | 0.3 ± 0.1 (4) |
| ZnSO4 | 2.5 ± 0.2 (3) | 0.2 ± 0.0 (3) | 0.3 ± 0.1 (2) | 0.2 ± 0.0 (3) |
| MnSO4 | 2.5 (1) | 0.2 ± 0.0 (2) | 0.8 ± 0.3 (2) | 0.2 (1) |
Values are means ±s.e.m. (in mg l−1) with number of animals given in parentheses. [X], concentration of ion X.
Renal microinjections
Mean values for percentage recovery of [14C]inulin, mean arterial blood pressure at time of injection and distance of injection site from the glomerulus (PCTs) or macula densa (DCTs) are shown in Table 2. The mean [14C]inulin recovery was not significantly different between experimental groups. Neither was [14C]inulin recovery significantly different from 100 %, indicting that all injections were delivered intact into the tubular lumen.
Table 2. Data from tubular microinjection and LH microperfusion studies.
| n | MABP (mmHg) | [14C]inulin recovery (%) | Injection site (mm) | |
|---|---|---|---|---|
| PCT | 11 | 108.6 ± 1.8 | 97.1 ± 2.0 n.s. | 3.0 ± 0.3 |
| DCT | 8 | 108.1 ± 1.6 | 97.6 ± 2.4 n.s. | 1.3 ± 0.2 |
| Control | 9 | 107.2 ± 3.3 | 98.3 ± 2.5 n.s. | — |
| CuSO4 | 9 | 107.2 ± 2.1 | 97.3 ± 2.1 n.s. | — |
| ZnSO4 | 7 | 100.7 ± 0.7 | 96.8 ± 2.2 n.s.. | — |
| MnSO4 | 6 | 101.7 ± 1.7 | 97.2 ± 2.7 n.s. | — |
Values are means ± S.E.M.; n, number of tubules; MABP, mean arterial blood pressure measured via carotid artery catheter at time of tubular injection; Injection site, distance of injection site from glomerulus and macula densa for PCTs and DCTs, respectively
not significantly different from 100%.
Figure 1A and B shows plots for urinary recovery of 55Fe following injection into individual PCTs and DCTs, respectively, against distance of the injection site from the glomerulus and macula densa, respectively. There was no significant relationship between the distance of the injection site from the glomerulus and the percentage recovery of 55Fe in PCTs. This was also true for injections made into the DCT in that no correlation was found between the percentage of iron recovered and the distance of the injection site from the macula densa. Mean data for both groups is presented in Fig. 1C. Recovery of 55Fe expressed as a percentage of 55Fe microinjected was 18.5 ± 2.9 (n = 11) for PCT microinjections and 46.1 ± 6.1 (n = 8) for DCT microinjections.
Figure 1.
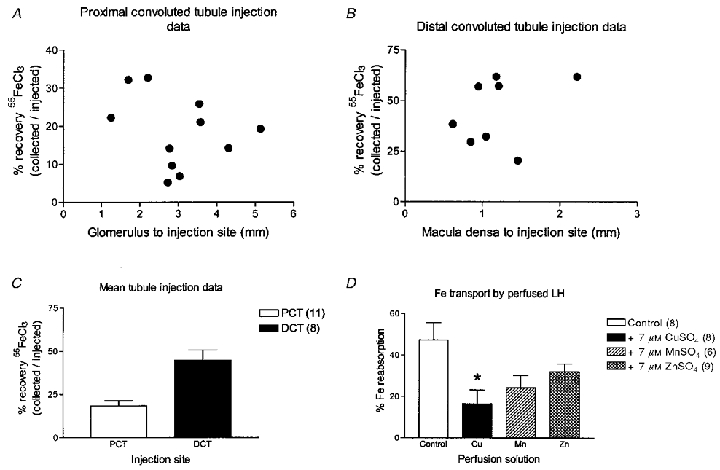
A-C, urinary recovery of 55FeCl3 following microinjection into renal tubules. A, percentage recovery of 55FeCl3 microinjected into the proximal convoluted tubule plotted against the distance of the microinjection site from the gomerulus. B, percentage recovery of 55FeCl3 microinjected into the distal convoluted tubule plotted against the distance of the microinjection site from the macula densa. C, mean data from microinjections shown in A and B. Number of tubules is given in parentheses. D, effect of copper, zinc and manganese on loop iron transport. Data are percentage 55FeCl3 reabsorption. All data are means ±s.e.m. with the number of tubules given in parentheses. *P < 0.05 (ANOVA and Scheffé's post hoc test).
Microperfusion of loops of Henle
Mean measures of blood and urine variables are shown in Table 2. Recovery of perfused [14C]inulin was not significantly different between experimental groups or from 100 %. The latter indicating that all perfusate was recollected. Figure 1D shows recovery of 55Fe following perfusion of LH either with control, CuSO4, MnSO4 or ZnSO4 solutions. Perfusion with solution containing iron alone (control) resulted in recovery of 52.7 ± 8.3 % (n = 8) of perfused iron from DCT. Therefore, half of the iron presented to the LH had been transported out of the tubule. Addition of 7 μmol l−1 CuSO4 significantly increased 55Fe recovery to 83.5 ± 6.8 % (n = 8; P < 0.05) suggesting that copper was competing with iron for a common transport pathway. In contrast, addition of 7 μmol l−1 MnSO4 or 7 μmol l−1 ZnSO4 caused modest increases in 55Fe recovery to 75.8 ± 5.9 % (n = 6; n.s.) and 67.9 ± 3.8 % (n = 9; n.s.), respectively. These increases were not significantly different from that with iron alone.
Fluid and ion fluxes are detailed in Table 3. Addition of CuSO4, MnSO4 or ZnSO4 to the perfusion solution did not significantly alter fluid or major ion fluxes.
Table 3. Tubule fluid and ion flux data from LH microperfusion study.
| JV (nl min−1) | JNa (pmol min−1) | JK (pmol min−1) | |
|---|---|---|---|
| Control | 10.6 ± 0.4 (7) | 2086 ± 186 (9) | 47.4 ± 3.6 (9) |
| CuSO4 | 11.2 ± 1.0 (9) n.s. | 2141 ± 104 (8) n.s. | 50.7 ± 4.2 (8) n.s. |
| ZnSO4 | 9.3 ± 0.6 (9) n.s. | 1978 ± 59 (9) n.s. | 48.0 ± 2.4 (9) n.s. |
| MnSO4 | 9.0 ± 0.8 (6) n.s. | 1916 ± 262 (6) n.s. | 41.7 ± 12.2 (6) n.s. |
Values are means ±s.e.m. with number of tubules given in parentheses; JV, fluid reabsorptive rate; JNa, net sodium flux; JK, net potassium flux
not significant.
DISCUSSION
In this study we set out to determine the amount of iron available for ultrafiltration by the glomerulus. We measured the serum concentration of iron using the standard TCA precipitation method and obtained values similar to those published elsewhere (for example see Morgan & Redgrave, 1998). Using a method we have previously shown to mimic glomerular ultrafiltration (Kibble et al. 1993), we found UF iron to be 7.5-fold less than that measured using the TCA method. Even so, this implies that a considerable amount of iron is indeed filtered at the glomerulus and if not reabsorbed this would be voided in the urine. To estimate the amount of iron reabsorbed we calculated the amount of iron filtered and the amount in the final urine. Taking our value for the UF iron concentration (0.2-0.3 mg l−1) and assuming a mean value for glomerular filtration rate of 1.25 ml min−1 (Robinson, 1988), which we have measured previously in our rats, the amount of iron filtered per day is 0.36-0.54 mg. Under standard conditions the urinary flow rate of a rat is 10 ml day−1 (Garland et al. 1999). Taking this value and our measure of the final urinary iron concentration (0.3-0.8 mg l−1) then the urinary iron excretion rate is in the range of 3 and 8 μg day−1. By comparing the two estimates it is clear that only between 0.8 and 1.5 % of the filtered iron is actually excreted in the urine and thus there must be a very effective pathway for reabsorption of iron along the renal tubules.
Another implication of our data is that iron is filtered in a form < 30kDa. Given its reactive properties it is unlikely that the iron is filtered in its free ion form although until we identify the molecule binding the iron this cannot be ruled out. There is evidence that a small fraction of Tf (molecular mass ∼80 kDa) is filtered and that this fraction can be greatly increased in nephrotic syndrome where there is damage to the glomeruli (Alfrey & Hammond, 1990; Alfrey, 1992). However, the amount of iron that appears in the urine daily cannot be accounted for by filtration of a small proportion of the Tf present in plasma (Man & Wadsworth, 1969). Indeed a molecular mass of ∼80 kDa suggests that Tf is not responsible for the iron detectable in the ultrafilterable fraction. Regardless of the form in which iron is filtered the amount passing into the renal tubule is significant in terms of total body iron balance and the majority of the filtered iron is reabsorbed.
To identify the sites of renal iron reabsorbtion we used microinjection of 55Fe as a marker of iron transport. We were unable to detect any significant relationship between the site of microinjections made into the proximal tubule and urinary 55Fe recovery. This suggests that the PCT does not play a significant role in the reabsorption of iron. We found that approximately 20 % of 55Fe injected into the proximal tubule was present in the urine. This is indicative of a significant reabsorption of iron in segments beyond the PCT. At the next site accessible to micropuncture, the DCT, approximately 50 % of the 55Fe injected, was recovered in the urine. Thus, there is significant reabsorption of iron by nephron segments distal to the DCT. No correlation was found between the injection site along the DCT and the recovery of injected iron, indicating that the DCT per se probably contributes little, if at all, to iron re-uptake. By interpolation of the data from PCT and DCT injections it is clear that there is a substantial amount of iron transport occurring in the LH. These segments, which from a microinjection standpoint equate to the latter part of the S2 PCT, the whole of the S3 PCT, the descending limb of LH, the thin and thick ascending limbs of LH and the early DCT, contribute approximately 40 % to the total measured iron transport. Together these data show that the loop of Henle and collecting ducts are major sites of iron reabsorption in renal tubules.
Our functional mapping of the nephron sites of iron reabsorption agrees with the distribution of the divalent cation transporter DMT1 (Nramp2/DCT1) (Fleming et al. 1997; Gunshin et al. 1997). This protein when expressed in Xenopus oocytes was shown to invoke pH-dependent, electrogenic transport of iron as well as a range of other metal ions including copper, manganese, zinc, cobalt (Co2+) and cadmium (Cd2+). In situ hybridization using a DMT1 probe produces strong signals in the kidney cortex and medulla (Gunshin et al. 1997). Although it is difficult to discern the exact nephron segments in which these signals are localized, the pattern of distribution suggests DMT1 mRNA is present in the loop of Henle and collecting ducts.
To characterize the transport mechanism responsible for the reabsorption of iron by the LH, the LH was microperfused with a physiological salt solution containing 55FeCl3. Only half the iron presented to the LH was recovered in the DCT. Therefore, one or more of the perfused segments, which as outlined above include the LH, the latter portions of the end of the PCT, the whole of the pars recta, and the early DCT, can effect significant iron transport. To specifically test whether the transport had functional characteristics in common with DMT1 competition studies, with copper, manganese or zinc were undertaken. Equimolar concentrations of copper, manganese or zinc reduced iron reabsorption suggesting that a common transport process may be involved. To ensure that these results were not due to toxic effects (for example submicromolar free concentrations of copper have strong inhibitory effects on Na+,K+-ATPase and Na+-glucose cotransport; Blumenthal et al. 1994; Li et al. 1996), we measured reabsorption of Na+, K+ and water. None of these variables were affected by treatment with copper, manganese or zinc. Thus the decrease in iron reabsorption observed when copper, manganese or zinc were included in the perfusate was clearly not due to toxic side effects and is likely to be due to competition for a common transport pathway.
Why was zinc least effective in reducing iron reabsorption? Although zinc caused a modest decrease in iron reabsorption the mean value was not significantly different from the value for iron alone. This is of interest because it suggests that either the iron transporter has a low affinity for zinc or that another transport system mediates zinc transport out of LH segments. Gunshin et al. (1997) showed that currents in Xenopus oocytes expressing rat DCT1 (DMT1) induced by 50 μmol l−1 zinc were higher than those induced by an equimolar concentration of iron. This suggests that DMT1 transported zinc equally, if not more effectively, than iron. However, in CaCo 2 TC7 cells, which express human DMT1 the apical membrane iron uptake is only mildly inhibited by 100-fold excess of zinc (Tandy et al. 2000). In addition, zinc uptake by these cells is not dependent on pH or membrane potential and zinc transport is not affected by a decrease in DMT1 expression. These data suggest that DMT1 does not effectively transport zinc although we cannot yet rule out species differences as an explanation for the reported differences between the findings of Gunshin et al. (1997) and those of Tandy et al. (2000). However, our data derived from studies performed in rat agree with those of Tandy et al. (2000) and indicate that DMT1 does not transport zinc or transports it with a very low efficacy. Our findings also indicate that in the LH of the rat iron is transported by a different transporter from that which transports zinc.
In conclusion, we have shown that a significant proportion of iron in serum is available for ultrafiltration by the glomerulus and that the majority of iron filtered at the glomerulus is reabsorbed. Transport pathways for iron reabsorption are present in the loop of Henle and collecting ducts. We suggest that DMT1 is likely to play a major role in renal iron reabsorption.
Acknowledgments
We gratefully acknowledge the financial support of the Wellcome Trust.
References
- Alfrey AC. Essential trace elements. In: Seldin DW, Giebisch G, editors. The Kidney: Physiology and Pathophysiology. 2. New York, NY, USA: Raven Press, Ltd; 1992. pp. 2993–3003. chapter 87. [Google Scholar]
- Alfrey AC, Hammond WS. Renal iron handling in nephrotic syndrome. Kidney International. 1990;37:1409–1413. doi: 10.1038/ki.1990.130. [DOI] [PubMed] [Google Scholar]
- Blumenthal S, Lewand D, Sochanik A, Krezoski S, Petering DH. Inhibition of Na+-glucose cotransport in kidney cortical cells by cadmium and copper: Protection by zinc. Toxicology and Applied Pharmacology. 1994;129:177–187. doi: 10.1006/taap.1994.1242. [DOI] [PubMed] [Google Scholar]
- Didonato M, Sarkar B. Copper transport and its alterations in Menkes and Wilson diseases. Biochimica et Biophysica Acta. 1997;1360:3–16. doi: 10.1016/s0925-4439(96)00064-6. [DOI] [PubMed] [Google Scholar]
- Fernandez FJ, Kahn HL. Clinical methods for atomic absorption spectroscopy. Clinical Chemistry Newsletter. 1971;3:24. [Google Scholar]
- Fleming MD, Trenor CC, III, Su MA, Foernzler D, Beier DR, Dietrich WF, Andrews NC. Microcytic anaemic mice have a mutation in Nramp2, a candidate iron transporter gene. Nature Genetics. 1997;16:383–386. doi: 10.1038/ng0897-383. [DOI] [PubMed] [Google Scholar]
- Garland HO, Hamilton K, Freeman S, Burns C, Cusak M, Balment RJ. Renal function in chronically catheterized conscious diabetic rats using constant and servo-controlled infusion. Clinical and Experimental Pharmacology and Physiology. 1999;26:803–808. doi: 10.1046/j.1440-1681.1999.03121.x. [DOI] [PubMed] [Google Scholar]
- Green R, Windhager EE, Giebisch G. Protein oncotic pressure effects on proximal tubular fluid movement in the rat. American Journal of Physiology. 1974;226:265–276. doi: 10.1152/ajplegacy.1974.226.2.265. [DOI] [PubMed] [Google Scholar]
- Gunshin H, Mackenzie B, Berger UV, Gunshin Y, Romero MF, Boron WF, Nussberger S, Gollan JL, Hediger MA. Cloning and characterization of a mammalian proton-coupled metal-ion transporter. Nature. 1997;388:482–488. doi: 10.1038/41343. [DOI] [PubMed] [Google Scholar]
- Kibble JD, Wilson RW, Green R. A diffusion gradient favouring potassium reabsorption across the proximal tubule of the anaesthetized rat. The Journal of Physiology. 1993;473:216P. [Google Scholar]
- Li J, Lock RAC, Klaren PHM, Swarts HGP, Schuurmans Stekhoven FMAH, Wendelaar Bonga SE, Flik G. Kinetics of Cu2+ inhibition of Na+/K+-ATPase. Toxicology Letters. 1996;87:31–38. doi: 10.1016/0378-4274(96)03696-x. [DOI] [PubMed] [Google Scholar]
- Man YK, Wadsworth GR. Urinary loss of iron and the influence on it of dietary levels of iron. Clinical Science. 1969;36:479–488. [PubMed] [Google Scholar]
- Morgan EH, Redgrave TG. Effects of dietary supplementation with aluminum and citrate on iron metabolism in the rat. Biological Trace Element Research. 1988;65:117–131. doi: 10.1007/BF02784264. [DOI] [PubMed] [Google Scholar]
- Olson AD, Hamlin WB. A new method for serum iron and total iron-binding capacity by atomic absorption spectrophotometry. Clinical Chemistry. 1969;15:438–444. [PubMed] [Google Scholar]
- Ponka P. Cellular iron metabolism. Kidney International. 1999;55(Suppl. 69):S2–11. doi: 10.1046/j.1523-1755.1999.055suppl.69002.x. [DOI] [PubMed] [Google Scholar]
- Robinson JR. Reflections on Renal Function. 2. Oxford, UK: Blackwell Scientific Publications; 1988. [Google Scholar]
- Shalmi M, Kibble JD, Day JP, Christensen P, Atherton JC. Improved analysis of picomole quantities of lithium, sodium and potassium in biological fluids. American Journal of Physiology. 1994;266:F674–686. doi: 10.1152/ajprenal.1994.267.4.F695. [DOI] [PubMed] [Google Scholar]
- Tandy S, Williams M, Leggett A, Lopez-Jimenez M, Dedes M, Ramesh B, Srai SK, Sharp P. Nramp2 expression is associated with pH-dependent iron uptake across the apical membrane of human intestinal Caco-2 cells. Journal of Biological Chemistry. 2000;275:1023–1029. doi: 10.1074/jbc.275.2.1023. [DOI] [PubMed] [Google Scholar]
- Velazquez H, Wright FS. Renal micropuncture techniques. In: Windhager EE, editor. Handbook of Physiology, section 8, Renal Physiology. Oxford, UK: Oxford University Press; 1992. pp. 249–270. chapter 6. [Google Scholar]
- Wilson RW, Wareing M, Green R. The role of active transport in potassium reabsorption in the proximal convoluted tubule of the anaesthetized rat. The Journal of Physiology. 1997;500:155–164. doi: 10.1113/jphysiol.1997.sp022006. [DOI] [PMC free article] [PubMed] [Google Scholar]
- Zar JH. Biostatistical Analysis. 2. Englewood Cliffs, NJ, USA: Prentice-Hall; 1984. [Google Scholar]