

Abstract
One purpose of the present experiments was to examine whether the relative workload or the absolute work performed is the major determinant of the lipid mobilization from adipose tissue during exercise. A second purpose was to determine the co-ordination of skeletal muscle and adipose tissue lipid metabolism during a 3 h post-exercise period.
Six subjects were studied twice. In one experiment, they exercised for 90 min at 40 % of maximal O2 consumption (V̇O2, max) and in the other experiment they exercised at 60% V̇O2, max for 60 min. For both experiments, catheters were inserted in an artery, a subcutaneous abdominal vein and a femoral vein. Adipose tissue metabolism and skeletal muscle (leg) metabolism were measured using Fick's principle.
The results show that the lipolytic rate in adipose tissue during exercise was the same in each experiment. Post-exercise, there was a very fast decrease in lipolysis, but it began to increase about 1 h post-exercise and remained elevated for the following 2 h. The increase in post-exercise non-esterified fatty acid (NEFA) mobilization was greater after 60 % exercise than after 40 % exercise.
It is concluded that the lipolytic rate in abdominal subcutaneous adipose tissue during exercise is the same whether the relative workload is 40 % or 60 % of maximum. Post-exercise, there is a substantial lipid mobilization from adipose tissue and only a small fraction of this is taken up in the lower extremities. This leaves a substantial amount of NEFAs for either NEFA/TAG (triacylglycerol) recirculation post-exercise or immediate oxidation.
Adipose tissue lipid mobilization increases during exercise (Jeukendrup et al. 1998b). Similarly, muscle lipid utilization increases but the lipid oxidation rate is dependent on the relative workload, with a maximum at about 65 % of maximal O2 consumption V̇o2,max. At higher workloads the muscle metabolism is primarily dependent on carbohydrate breakdown (Jeukendrup et al. 1998b). The mechanisms regulating the substrate choice of the exercising muscles are not well understood. Several possibilities have been proposed. The hormonal milieu seems to play a role; in particular the concentrations of adrenaline and insulin appear to be important (Jeukendrup et al. 1998a). A classical concept has been the glucose-fatty acid cycle, originally proposed by Randle et al. (1963). According to this concept, the availability of non-esterified fatty acids (NEFAs) for oxidation in the exercising muscle should be the key regulator of the substrate of choice. There are conflicting results in the literature concerning the role of this cycle during exercise (Rennie et al. 1976; Hickson et al. 1977; Rennie & Holloszy, 1977; Ferrannini et al. 1983; Ravussin et al. 1986; Dyck et al. 1993). However, increased availability of NEFAs during exercise increases the lipid oxidation, as found in studies in which Intralipid and heparin were given to increase the circulating level of NEFAs (Vukovich et al. 1993). Thus, the mobilization of NEFAs from adipose tissue may be a limiting factor for lipid oxidation during exercise. It has been suggested, based on animal studies, that the absolute lipid metabolism cannot be increased when the relative workload exceeds 40 % (Hoppeler & Weibel, 1998). On the other hand, it is well documented that during endurance exercise the contribution of lipid to the total oxidative metabolism increases with time (Paul, 1975). Similarly, it has been proposed that NEFA/TAG (triacylglycerol) recycling between adipose tissue and liver plays a significant role in excess post-exercise oxygen consumption (EPOC) (Bahr, 1992), suggesting that NEFA mobilization from adipose tissue may be substantial in this situation. Similarly, it has been proposed that NEFA/TAG recycling may play a role in the regulation of lipid metabolism during and post-exercise (Wolfe et al. 1990). However, lipolysis and NEFA mobilization have never been measured directly for prolonged periods post-exercise in man.
Thus, one aim of the present experiments was to examine whether the relative workload or the absolute amount of work is the major determinant of lipid mobilization from subcutaneous, abdominal adipose tissue in man. A second aim was to describe the possible co-ordination between adipose tissue and skeletal muscle lipid metabolism during a 3 h post-exercise rest period.
METHODS
Subjects
Six young, healthy male volunteers participated in the study (age, 23·5 ± 0·7 years; height, 186·3 ± 1·4 cm; weight, 78·5 ± 2·2 kg; means ± s.e.m).
The subjects were given a written and oral description of the study according to the Declaration of Helsinki, and their informed consent was obtained. The study was approved by The Ethical Committee for Medical Research of Copenhagen (project no. KF 01–201/98).
Experimental protocols
Each subject participated in two experiments with about 2 weeks between experiments. Prior to these experiments the maximum oxygen uptake rate of the subjects was determined. The subjects exercised in a semirecumbent position on an electrically braked cycle ergometer (ergometrics er900L, ergoline, Bitz, Germany), initially at 50 W, and then at a 50 W increase in load every 2 min, until exhaustion. Oxygen uptake and carbon dioxide output were measured continuously during the test by means of an Oxycon Champion system (Jaeger, Wuerzburg, Germany), using face-mask and breath-by-breath techniques. On the same day, body composition was determined by DEXA-scanning (Lunar DPX-IQ, software version 4.6c, Lunar Corporation, Madison, WI, USA), using the medium scan mode and extended research analysis.
Main experiments
In general, the main experiments consisted of a pre-exercise rest period, an exercise period and a 3 h post-exercise rest period. The pre-exercise rest period was of 30–45 min duration, and it was initiated when the subjects seemed to be in a steady state with respect to whole-body oxygen consumption and other parameters such as adipose tissue blood flow and leg blood flow. This period was followed by an exercise period during which the subjects either exercised for 90 min at 40 % of their V̇O2, max or for 60 min at 60 % of V̇O2, max. The absolute work performed during each experiment was therefore the same. The exercise was performed in a semirecumbent position. After the exercise period, the subjects were studied for another 3 h during rest. Both the pre- and post-exercise periods were performed in a recumbent position. The order of experiments was randomized.
The subjects arrived at the laboratory at 08.00 h after an overnight fast. In the days prior to the experiments, they ate their habitual diet and they performed their habitual physical activities. However, from 24 h before the experiments they refrained from vigorous physical activity.
Catheterization
In all subjects, catheters were inserted in a subcutaneous vein on the anterior abdominal wall, in a femoral vein in retrograde direction and in a radial artery.
Catheterization of the subcutaneous, abdominal vein was performed as described previously (Simonsen et al. 1994) during ultrasound/colour-Doppler imaging of the vein, since this procedure enables visualization of veins situated deep in the subcutaneous adipose tissue. A 22G 10 cm polyurethane catheter (Ohmeda, Swindon, UK) was inserted using the Seldinger technique. After insertion, the catheter was kept patent throughout the study by continuous infusion of isotonic sodium chloride at a rate of 40 ml h−1.
Catheterization of the femoral vein was performed retrogradely under local anaesthesia (5–10 ml 1 % lidocaine) during ultrasound imaging of the vein, because this enables the correct positioning of the catheter tip distal to the point at which the great saphenal vein merges with the common femoral vein. Blood sampled from this position is mainly from skeletal muscle compartments. The catheter was kept patent during the experiment by regular flushing with isotonic sodium chloride.
Catheterization of the radial artery was performed percutaneously, after injection of 0·5 ml 1 % lidocaine, with an Artflon (Ohmeda). The catheter was kept patent during the experiment by regular flushing with isotonic sodium chloride.
Blood flow measurements
Adipose tissue blood flow was measured using the 133Xe-washout technique, as described previously (Bülow, 1983). About 1 MBq of 133Xe dissolved in 0·1 ml isotonic sodium chloride was injected into the subcutaneous, abdominal adipose tissue at the contralateral side of the catheter position. Washout of 133Xe was registered by a Mediscint system (Oakfield Instruments, Oxford, UK). The calculation of adipose tissue blood flow was performed as described previously using an average tissue/blood partition coefficient value of 8 for the subjects (Bülow et al. 1987).
Leg blood flow was measured by the ultrasound/Doppler technique in the common femoral artery in the same leg in which the vein catheter was inserted, using a Siemens Elegra system (Siemens, Erlangen, Germany) with a 5 MHz linear probe. Due to the limitations of the technique, these measurements could only be performed during resting conditions. The diameter of the artery was determined from a cross-sectional scan. It was assumed to be constant throughout the study since the femoral artery diameter has previously been shown to be unaltered during exercise within a leg blood flow range of up to 6 l min−1 (Rådegran, 1997). The Doppler spectra were obtained in longitudinal scan with appropriate angle correction. During each experimental period the blood flow was calculated as an average of four to five flow determinations performed in 10 s periods. Each flow value was calculated as the product of the cross-sectional area of the artery calculated from the measured diameter and the mean blood velocity calculated from the Doppler spectra collected in a sample volume covering the full width of the vessel.
Blood sampling
Blood samples were preferentially drawn simultaneously from the three catheters. However, sometimes the blood flow level in the adipose tissue limited the rate at which blood could be drawn from the subcutaneous catheter, and in such situations a time delay developed between the sample drawn from this site and the samples drawn from the artery and the femoral vein. Immediately post-exercise, the adipose tissue blood flow in some of the subjects was so low that collection of blood was not possible. Generally, three sample sets were drawn during the pre-exercise rest period. During the exercise period samples were drawn every 30 min, i.e. in the 40 % experiment three sets were drawn, and in the 60 % experiment two sets were drawn. It was sometimes necessary to stop the exercise briefly because it was impossible to draw blood from the subcutaneous catheter when the legs were moving. During the post-exercise period blood was collected every 10 min for the first 30 min and then every 30 min until 3 h after exercise. Blood was collected for measurements of glycerol, NEFA, TAG, glucose and lactate. In addition blood was collected anaerobically for measurement of oxygen concentration. The blood was collected in vials at 4°C, and whole blood was immediately deproteinized or the plasma was separated by centrifugation at 4°C. The samples were stored at -20°C until analysis.
Blood analyses
Glycerol, glucose and lactate concentrations were measured in duplicate in neutralized, deproteinized extracts of whole blood and NEFA and TAG concentrations were measured in plasma, as described previously (Coppack et al. 1989; Frayn et al. 1989). Oxygen concentration was determined spectrophotometrically using an OSM 3 (Radiometer, Copenhagen, Denmark).
Whole-body measurements
Whole-body oxygen consumption and respiratory exchange ratio (RER) were determined by face-mask and breath-to-breath measurements over 10 min periods during the pre-exercise and exercise periods and continuously during the post-exercise period, with the same system as that used for determination of maximum oxygen uptake. Heart rate and intra-arterial blood pressure were monitored continuously during the experiment via an Athena (S&W, Copenhagen, Denmark) interfaced to the Oxycon Champion.
Calculations
Net fluxes of the different metabolites across the subcutaneous adipose tissue and the lower extremity were calculated by multiplication of the arterial-venous (a-v) concentration difference of the metabolite by the appropriate flow value (whole-blood flow for calculation of glycerol, glucose and lactate fluxes, and plasma flow for calculation of NEFA and TAG fluxes). The NEFA/glycerol output ratio was calculated from the net NEFA and glycerol outputs corrected for the contribution from intravascular lipolysis of TAG. Whole-body lipid and carbohydrate oxidation rates were calculated from the whole-body oxygen uptake and RER using the equations given by Frayn (1983). The nitrogen excretion rate was set to 135 μg kg−1 min−1 (Carraro et al. 1990).
Statistics
The effects of workload and time were analysed by a two-way ANOVA using Minitab release 10 (Minitab Inc., PA, USA). Post hoc testing for specific differences was performed using Tukey's method. All data are given as means ±s.e.m.P < 0·05 was considered significant. In order to compare overall effects between the three experimental periods within the experiments or differences between the two experiments, mean integrated values were calculated. Significant differences between these values were tested by Student's paired t test using SPSS release 7.5 (SPSS Inc., Chicago, IL, USA).
RESULTS
Whole body
The mean maximum oxygen consumption was 3956 ± 274 ml min−1. The lean body mass was 66·7 ± 1·0 kg and the adipose tissue mass was 11·5 ± 1·0 kg.
The mean oxygen uptake values, RERs and calculated lipid oxidation rates during the pre-exercise, exercise and 3 h post-exercise periods are given in Table 1.
Table 1. Whole-body oxygen uptake, RER and lipid oxidation rates.
| V̇O2, max | Pre-exercise | Exercise | Post-exercise | |
|---|---|---|---|---|
| Oxygen uptake (ml min−1) | 40% | 244 ± 15 | 1681 ± 90* | 265 ± 5 |
| 60% | 252 ± 6 | 2337 ± 213*† | 287 ± 11 | |
| RER | 40% | 0·81 ± 0·01 | 0·79 ± 0·02 | 0·79 ± 0·01* |
| 60% | 0·81 ± 0·03 | 0·82 ± 0·04 | 0·79 ± 0·01 | |
| Lipid oxidation rate (g min−1) | 40% | 0·05 ± 0·01 | 0·58 ± 0·05* | 0·07 ± 0·01 |
| 60% | 0·06 ± 0·01 | 0·67 ± 0·17* | 0·08 ± 0·01 |
Significantly different from pre-exercise value (P < 0·05)
significant difference between the two experiments (P < 0·05).
Arterial metabolite and oxygen concentrations
The mean arterial concentrations of glycerol, NEFA, TAG, glucose, lactate and oxygen during the pre-exercise, exercise and post-exercise periods in each of the two experiments are given in Table 2.
Table 2. Arterial concentrations of various metabolites and oxygen.
| V̇O2,max | Pre-exercise | Exercise | Post-exercise | |
|---|---|---|---|---|
| [Glycerol] (μmol l−1) | 40% | 36 ± 5 | 155 ± 8* | 63 ± 4 |
| 60% | 50 ± 9 | 228 ± 29* | 74 ± 9 | |
| [NEFA] (μmol l−1) | 40% | 361 ± 81 | 536 ± 55* | 691 ± 41* |
| 60% | 443 ± 100 | 646 ± 83* | 805 ± 61* | |
| [TAG] (μmol l−1) | 40% | 877 ± 105 | 892 ± 94 | 773 ± 78 |
| 60% | 1022 ± 156 | 1040 ± 160 | 876 ± 144* | |
| [Glucose] (mmol l−1) | 40% | 5·1 ± 0·1 | 4·7 ± 0·2* | 4·7 ± 0·1* |
| 60% | 5·2 ± 0·2 | 4·8 ± 0·1* | 4·8 ± 0·2* | |
| [Lactate] (mmol l−1) | 40% | 0·5 ± 0·1 | 0·5 ± 0·0 | 0·4 ± 0·0 |
| 60% | 0·6 ± 0·1 | 1·7 ± 0·4† | 0·5 ± 0·0 | |
| [Oxygen] (mmol l−1) | 40% | 8·3 ± 0·1 | 8·6 ± 0·1* | 8·3 ± 0·1 |
| 60% | 8·3 ± 0·1 | 8·8 ± 0·1* | 8·3 ± 0·1 |
Significantly different from pre-exercise value (P < 0·05)
significant difference between the two experiments (P < 0·05).
Figure 1 and Figure 2 show the time course of the changes in glycerol and NEFA concentrations during the two experiments. NEFA and glycerol concentrations both increased as expected during exercise; however, while the glycerol concentration increased severalfold the NEFA concentration only increased about 1·5-fold compared with the pre-exercise level. At 10 min post-exercise, the glycerol concentration was reduced compared with the exercise level while the NEFA concentration was significantly increased. Thirty minutes post-exercise the NEFA and glycerol concentrations had reached the pre-exercise level and remained there for the rest of the experiment.
Figure 1. Arterial glycerol concentrations.

Figure 2. Arterial NEFA concentrations. *Significant difference (P < 0·05) between the two experiments.

Adipose tissue metabolism
Figure 3 shows the subcutaneous, abdominal blood flow during the two experiments. In both experiments the mean blood flow increased slightly, but not significantly, during the pre-exercise rest period. During exercise the blood flow increased significantly by about 2-fold in each experiment. Immediately after exercise the blood flow decreased to the pre-exercise level. Then, in each experiment, the blood flow began to increase again about 60 min post-exercise, reaching the same level as that observed during exercise at 180 min post-exercise. There were no significant differences between the flow levels and the blood flow responses in the two experiments. Compared with the pre-exercise level, the integrated (30–180 min) post-exercise increase in blood flow was 232.4 ± 94 ml (100 g)−1 after the 40 % workload and 186.1 ± 93 ml (100 g)−1 after the 60 % workload.
Figure 3. Adipose tissue blood flow.

Table 3 shows the mean net fluxes of glycerol, NEFA, TAG, glucose, lactate and oxygen during the three experimental periods in the two experiments. In addition, the time courses of the glycerol and NEFA outputs from adipose tissue during the experiments are shown in Fig. 4 and Fig. 5, respectively. In both experiments the glycerol output increased slightly during the pre-exercise period and was significantly higher in the 60 % compared with the 40 % experiment (P = 0·021).During exercise glycerol output increased significantly by 2-3 fold. The integrated mean glycerol output during exercise was 1.32 ± 0.36 μmol (100 g)−1 min−1 in the 40 % and 1.32 ± 0.25 μmol (100 g)−1 min−1 in the 60 % experiment. These values are not significantly different. The output decreased significantly early after exercise and reached pre-exercise levels after about 20 min. Sixty minutes post-exercise glycerol output began to increase again. There was a significantly higher glycerol output 150 and 180 min post-exercise in the 60 % experiment compared with the 40 % experiment (P < 0·05).ost-exercise (from 60–180 min) the integrated response was 115 ± 29 μmol (100 g)−1 in the 40 % experiment and 180 ± 14 μmol (100 g)−1 in the 60 % experiment (P = 0·112). As for the glycerol output, NEFA output increased slightly but not significantly during the pre-exercise rest period. There was a significantly higher output in the 60 % experiment than in the 40 % experiment during this period (P = 0·015). During exercise the output increased about 3-4 fold. The level reached in the two experiments could not be demonstrated to be significantly different (Table 3). Post-exercise, there was a decrease in the NEFA output, which was close to the pre-exercise rest level 20 min after exercise. About 60 min post-exercise the output began to increase again in both experiments. However, the increase was more pronounced in the 60 % experiment, and it was significantly higher than that found in the 40 % experiment 180 min post-exercise (P < 0·05).The integrated NEFA output during exercise was 343 ± 102 and 285 ± 40 μmol (100 g)−1 in the 40 and 60 % experiments, respectively (P < 0·05). Post-exercise the integrated outputs (from 60–180 min) were 255 ± 64 μmol (100 g)−1 in the 40 % experiment and higher in the 60 % experiment, 401 ± 28 μmol (100 g)−1 (P = 0·078). The NEFA/glycerol output ratio is given in Fig. 6. Pre-exercise it was about 2.5 and not significantly different between the experiments. During exercise the ratio increased to about 2.9 and 3.3 in the 40 and 60 % experiments, respectively. Early post-exercise the ratio increased significantly in both experiments to a maximum of 4.5 and 5.8, respectively, 30 min post-exercise. This increase could be partly explained by the glycerol output decreasing more rapidly than the NEFA output. Thirty minutes post-exercise the glycerol output was reduced to about 30 % of the exercise level while the NEFA output was reduced to about 40 % of the exercise level in both experiments (Fig. 4 and Fig. 5). In both experiments the ratio then decreased again to reach values that were not significantly different from the pre-exercise values. With respect to TAG it was not possible to demonstrate a net uptake that was significantly different from zero during any of the experimental periods.
Table 3. Adipose tissue (A) and leg (B) integrated net fluxes of various metabolites and oxygen.
| V̇O2,max | Pre-exercise | Exercise | Post-exercise | |
|---|---|---|---|---|
| A. Adipose tissue | ||||
| Glycerol output rate (μmol (100 g)−1 min−1) | 40% | 0·4 ± 0·1 | 1·3 ± 0·4* | 0·8 ± 0·2 |
| 60% | 0·6 ± 0·1† | 1·3 ± 0·3* | 1·2 ± 0·1* | |
| NEFA output rate (μmol (100 g)−1 min−1) | 40% | 1·0 ± 0·3 | 3·8 ± 1·1* | 1·7 ± 0·4* |
| 60% | 1·9 ± 0·4† | 4·8 ± 0·7* | 2·7 ± 0·1* | |
| TAG uptake rate (μmol (100 g)−1 min−1) | 40% | 0·1 ± 0·1 | −0·2 ± 0·2 | 0·0 ± 0·1 |
| 60% | 0·1 ± 0·1 | −0·2 ± 0·2 | 0·1 ± 0·1 | |
| Glucose uptake rate (μmol (100 g)−1 min−1) | 40% | 0·9 ± 0·3 | 0·1 ± 0·5 | 0·6 ± 0·5 |
| 60% | 0·6 ± 0·2 | −0·2 ± 0·6 | 0·8 ± 0·2 | |
| Lactate output rate (μmol (100 g)−1 min−1) | 40% | 0·2 ± 0·1 | 0·6 ± 0·1* | 0·4 ± 0·1 |
| 60% | 0·1 ± 0·2 | −0·6 ± 0·5 | 0·4 ± 0·1 | |
| Oxygen uptake rate (μmol (100 g)−1 min−1) | 40% | 2·1 ± 0·4 | 1·7 ± 0·5 | 2·2 ± 0·4 |
| 60% | 2·7 ± 0·5 | 1·4 ± 0·4 | 2·1 ± 0·4 | |
| B. Single leg | ||||
| Blood flow (ml min−1) | 40% | 342 ± 39 | — | 435 ± 40 |
| 60% | 330 ± 43 | — | 569 ± 65* | |
| Glycerol output rate (μmol min−1) | 40% | 3·2 ± 2·0 | — | 2·1 ± 2·9 |
| 60% | 2·4 ± 1·0 | — | 8·1 ± 2·7 | |
| NEFA output rate (μmol min−1) | 40% | 0·8 ± 6·1 | — | −21·2 ± 7·1 |
| 60% | 5·9 ± 3·3 | — | 19·7 ± 12·1 | |
| TAG uptake rate (μmol min−1) | 40% | 5·1 ± 2·3 | — | −1·4 ± 3·1 |
| 60% | 1·3 ± 6·8 | — | 4·2 ± 4·8 | |
| Glucose uptake rate (μmol min−1) | 40% | 32 ± 21 | — | 83 ± 27 |
| 60% | 38 ± 10 | — | 116 ± 32* | |
| Lactate output rate (μmol min−1) | 40% | 10 ± 7 | — | 22 ± 6 |
| 60% | 10 ± 9 | — | 24 ± 9 | |
| Oxygen uptake rate (μmol min−1) | 40% | 982 ± 163 | — | 1044 ± 163 |
| 60% | 907 ± 146 | — | 1292 ± 228 | |
Significant different from pre-exercise value (P < 0·05)
significant difference between the two experiments (P < 0·05).
Figure 4. Adipose tissue glycerol net output. *Significant difference (P < 0·05) between the two experiments.

Figure 5. Adipose tissue NEFA net output. *Significant difference (P < 0·05) between the two experiments.
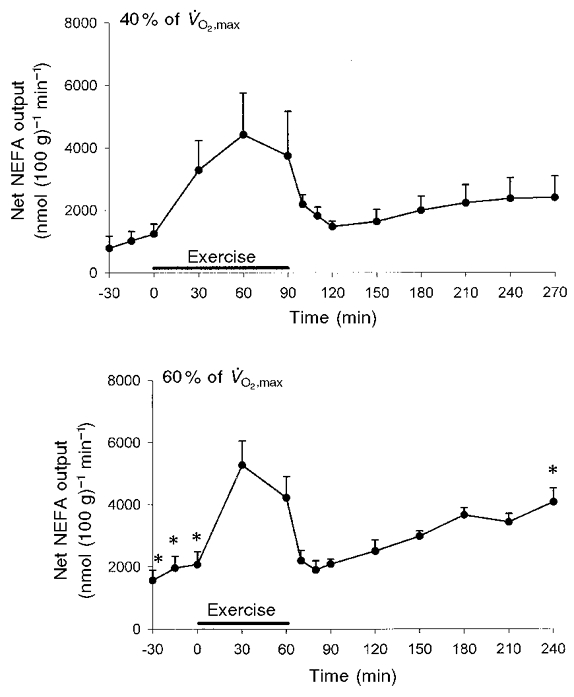
Figure 6. Adipose tissue NEFA/glycerol output ratios.

Glucose and oxygen uptake did not change significantly during both experiments (Table 3). In contrast, the lactate output increased significantly by 2-fold during exercise in the 40 % experiment while in the 60 % experiment four of the six subjects showed net lactate uptake during exercise. The four subjects with net lactate uptake also had increased arterial lactate concentrations, while the lactate concentration in the remaining two subjects did not increase during exercise.
Leg metabolism
Single leg blood flow mean net fluxes of glycerol, NEFA, TAG, glucose, lactate and oxygen during the pre- and 3 h post-exercise periods in the two experiments are given in Table 3.
Table 4 gives the arterial and femoral venous concentrations of glycerol, NEFA and TAG during the pre-exercise and exercise periods. On average, the glycerol and TAG a-v differences were not significantly different from zero during exercise, while there was a significant positive NEFA a-v difference of about 100 μmol l−1 in both experiments.
Table 4.
Arterial and femoral venous concentrations of glycerol, NEFA and TAG pre-exercise and during exercise
| Exercise | |||||
|---|---|---|---|---|---|
| V̇o2,max | Pre-exercise | 30 min | 60 min | 90 min | |
| Arterial [glycerol] (μmol l−1) 40% | 40% | 36 ± 5 | 129 ± 13 | 149 ± 12 | 189 ± 6 |
| 60% | 50 ± 9 | 212 ± 31 | 243 ± 27 | — | |
| Femoral venous [glycerol] (μmol l−1) | 40% | 48 ± 10 | 122 ± 18 | 152 ± 17 | 200 ± 9 |
| 60% | 57 ± 9 | 202 ± 42 | 230 ± 38 | — | |
| Arterial [NEFA] (μmol l−1) | 40% | 361 ± 81 | 463 ± 86 | 472 ± 65 | 673 ± 59 |
| 60% | 443 ± 100 | 649 ± 111 | 644 ± 79 | — | |
| Femoral venous [NEFA] (μmol l−1) | 40% | 364 ± 100 | 369 ± 83 | 368 ± 48 | 553 ± 54 |
| 60% | 405 ± 93 | 518 ± 100 | 511 ± 79 | — | |
| Arterial [TAG] (μmol l−1) | 40% | 877 ± 105 | 908 ± 94 | 896 ± 93 | 872 ± 96 |
| 60% | 1022 ± 156 | 1058 ± 158 | 1021 ± 162 | — | |
| Femoral venous [TAG] (μmol l−1) | 40% | 860 ± 108 | 920 ± 97 | 903 ± 96 | 889 ± 86 |
| 60% | 1021 ± 174 | 805 ± 191 | 1097 ± 152 | — | |
DISCUSSION
The major findings in the present study are that the lipolytic rate (glycerol mobilization rate) and NEFA mobilization rate from the subcutaneous, abdominal adipose tissue during exercise are the same whether the exercise intensity is 40 % or 60 % of the maximal oxygen consumption, and that there is pronounced lipolysis and NEFA mobilization from adipose tissue during post-exercise rest conditions. Due to the complexity of the experimental set-up involving participation of the subjects in two experiments each requiring successful catheterization in the subcutaneous, abdominal adipose tissue, only a limited number of subjects were studied. Therefore, it should be noted that the number of subjects studied may be too low to reveal small differences between the two experiments.
It is well documented that the relative contribution of lipid and carbohydrate to the total oxidative metabolism during exercise is dependent on the relative workload. With tracer methodology it has been found that lipid metabolism reaches a maximum at a power output of about 65 % of V̇O2, max (Romijn et al. 1993). In that study it was also demonstrated that peripheral lipolysis was stimulated maximally at a power output of 25 % of V̇O2, max. In the present experiments the lipid oxidation rate during exercise calculated from whole-body oxygen consumption and RER was the same in the two types of experiment. Thus, the extra energy expenditure during the 60 % workload was mainly covered by combustion of carbohydrate. There are two possible mechanisms which may limit the lipid oxidation in skeletal muscle during exercise. One is a limitation on the rate at which NEFAs are delivered into the circulation, and the other is a limitation on the rate at which NEFAs are taken up and oxidized in the exercising skeletal muscle. With respect to the former, it seems that lipolysis and NEFA mobilization are rather well co-ordinated since the ratio NEFA/glycerol mobilization is close to 3, implying that virtually all NEFAs formed by lipolysis are also mobilized from the tissue. Intracellular re-esterification, which has previously been proposed to play a role in the regulation of NEFA mobilization during exercise (Bülow, 1982), does not seem to be of importance in subcutaneous adipose tissue in man during exercise. On the contrary, since the ratio de facto increased from about 2.5 during rest to more than 3 during exercise in the 60 % experiment, this may be due to the release of some fatty acids that had been trapped intracellularly during rest or, perhaps more likely, early after the onset of exercise. An alternative explanation for a NEFA/glycerol ratio of above 3 is incomplete lipolysis giving rise to NEFA release without glycerol release. In vitro it has been demonstrated that the diacylglycerol lipase may be the rate limiting step during stimulated lipolysis (Arner et al. 1976). With respect to the extraction and oxidation of NEFAs in the exercising muscle, this seems to be a limiting factor. During the first hour in the 40 % experiment, the femoral venous NEFA concentration was the same in the pre-exercise rest period and during exercise, i.e. all the extra NEFAs delivered to the exercising leg were taken up. After 90 min exercise in these experiments and in the 60 % experiments, the femoral venous NEFA concentration increased compared with the pre-exercise rest concentration, i.e. not all extra NEFAs delivered during exercise were extracted. Thus, in this situation the extraction of NEFA, or an intracellular step beyond extraction, could be a major limiting factor for the lipid oxidation in the exercising muscles. The increasing femoral venous concentration could not be explained by increased lipolysis of circulating TAG, since it was not possible to demonstrate any extraction of TAG in the lower extremity in either experiment (Table 3). Another explanation for the increased femoral venous NEFA concentration could be increased lipolysis in the adipose tissue depots in the leg. However, this is hardly likely, since the glycerol a-v difference was not significantly different from zero in the two experiments.
The fractional extraction (uptake/delivery) of NEFA in the leg was about 20 % in both experiments. This is not in accordance with previously published results (Kiens et al. 1993; Odland et al. 1998; Bergman et al. 1999). In those studies a fractional extraction of about 5 % was obtained. One difference between the present experiments and most of the previously published work is that in the present experiments the femoral vein catheterization was performed in the retrograde direction, while in most other studies it was performed in the antegrade direction. The different catheter positions imply that the blood collected is derived from different sources. When the catheter is positioned with the tip in the deep femoral vein, the blood drawn will be mainly derived from skeletal muscles while the blood drawn from a catheter with the tip placed in the common femoral or even the common iliac vein will be a mixture of blood derived from skeletal muscles, subcutaneous adipose tissue and skin on the lower extremity, and possibly also from subcutaneous tissue on the anterior abdominal wall. Such an admixture will make the interpretation of a-v balance studies difficult, especially with respect to lipid metabolites. An additional advantage of the retrograde catheterization is that blood is collected from the tissue doing most of the exercise.
It has previously been suggested that the increase in adipose tissue blood flow during exercise was insufficient to ensure mobilization of all NEFA released by lipolysis (Hodgetts et al. 1991). This suggestion was based on the changes taking place in the circulating concentrations of NEFA and the NEFA/glycerol ratio immediately after exercise. Both these variables increase significantly when exercise is stopped, and this has been interpreted as being elicited by a mobilization of NEFA trapped intracellularly during exercise. The present experiments show that the peak NEFA concentration takes place earlier than the maximal NEFA/glycerol ratio. Therefore a likely explanation for the increase in NEFA concentration early post-exercise could be a continuing high mobilization from adipose tissue, which is not balanced by an equally high extraction in the resting muscles post-exercise.
The present experiments confirm that there is a strong correlation between the changes in adipose tissue lipid metabolism and adipose tissue blood flow, and that the blood flow has a noteworthy ability to change rapidly. The very rapid onset of vasoconstriction when exercise was stopped, which was demonstrated in the present experiments, is somewhat in contrast to our previous findings (Bülow & Madsen, 1978). However, a difference between the previous and the present experiments is the degree of change in the body position post-exercise. In the previous studies, the subjects changed from an upright position during exercise to a horizontal position during the post-exercise rest period, while they only changed from a semirecumbent to a horizontal position in the present experiments. It is well described that the body position plays a role in the vascular tone of abdominal, subcutaneous adipose tissue. The change from a vertical to a horizontal position leads to about 50 % vasodilatation (Hildebrandt et al. 1985). Thus, in our previous studies, it is very likely that the decrease in sympathetic tone from exercise to rest was relatively higher than in the present study, giving rise to a less pronounced flow reduction immediately post-exercise.
A significant fraction of the excess post-exercise oxygen consumption (EPOC) has been proposed to arise from TAG/NEFA recycling between adipose tissue and liver (Bahr et al. 1990; Bahr, 1992). The present experiments clearly demonstrate that there is a very high lipolytic activity in the subcutaneous adipose tissue, beginning about 1 h after the exercise period and continuing for more than the 3 h time limit in these experiments. Assuming that the subcutaneous, abdominal adipose tissue behaves as ‘the average adipose tissue’, it can be calculated that the integrated whole-body NEFA mobilization from 60 min post-exercise to the end of the experiments was about 30 mmol after the 40 % exercise bout and about 45 mmol after the 60 % exercise bout. Whole-body NEFA oxidation in this period was calculated to be about 30–40 mmol. These figures suggest that lipid mobilization and lipid oxidation are rather tightly co-ordinated up to 3 h post-exercise in these healthy subjects. Only about 5 mmol of NEFAs was taken up in the lower extremities during the same period. The above calculations are of course only approximate. The lipolytic rate in the intra-abdominal adipose tissue depots is probably much higher than the rate in the subcutaneous, abdominal adipose tissue (van Harmelen et al. 1997). Thus, the delivery of NEFAs to the liver may be much higher than that estimated simply from arterial concentrations. It is well documented that this delivery is an important factor in the control of lipoprotein metabolism of the liver (Lewis et al. 1995). In the present study, the arterial TAG concentration decreased throughout the experiments with a dissociation between TAG removal and TAG secretion with more TAG being taken up in various tissues than that being secreted from the liver. TAG could not be demonstrated to be taken up in the lower extremities after exercise, and also the subcutaneous adipose tissue was not a major site of TAG removal in the fasting post-exercise state, indicating that NEFA/TAG recycling does not take place to a significant extent up to 3 h post-exercise. However, further studies are needed to elucidate the co-ordination of adipose tissue and liver TAG metabolism under similar conditions to those used in the present experiments, and the situation may be quite different in the fed, post-absorptive state.
In adipose tissue it was not possible to demonstrate significant changes in glucose uptake during the experiments, and likewise the oxygen consumption in the tissue could not be demonstrated to change both during exercise and post-exercise. It should be emphasized that these findings may be due to small a-v differences for both glucose and oxygen especially during exercise when the blood flow is high. However, if it is assumed that the adipose tissue oxygen consumption is used solely for combustion of glucose, this implies that, on average, maximally about 2/3 of the glucose taken up is immediately oxidized throughout the experiment. Another 1/5 can be accounted for by glycolysis, calculated from the lactate output. An original finding in the present experiments is that the lactate output increased during exercise in the 40 % experiment in spite of the increasing oxygen supply to the tissue. In the 60 % experiment it was not possible to show a similar increase. On the contrary, in some of the subjects lactate output changed to uptake in this situation. This was found in subjects with increasing arterial lactate concentration during exercise.
In conclusion, the present experiments have shown that (1) the lipolytic rate during exercise in subcutaneous adipose tissue is the same whether the relative load is 40 or 60 % of the maximal exercise capacity; and (2) there is a substantial post-exercise lipolysis and lipid mobilization from adipose tissue, beginning about 1 h post-exercise and continuing for more than 3 h.
Acknowledgments
We thank Inge Rasmussen for excellent technical assistance. This work was funded by grants from The Danish Medical Research Council (9802729 and 12-1610-1), The Danish Heart Foundation (97-1-3-48-22465), The Novo Nordisk Foundation and The John and Birthe Meyer Foundation. Nariman AL Mulla holds a PhD study grant from the United Arab Emirates.
References
- Arner P, Liljeqvist L, Ostman J. Metabolism of mono-and diacylglycerols in subcutaneous adipose tissue of obese and normal-weight subjects. Acta Medica Scandinavica. 1976;200:187–194. doi: 10.1111/j.0954-6820.1976.tb08218.x. [DOI] [PubMed] [Google Scholar]
- Bahr R. Excess postexercise oxygen consumption – magnitude, mechanisms and practical implications. Acta Physiologica Scandinavica Supplementum. 1992;605:1–70. [PubMed] [Google Scholar]
- Bahr R, Hansson P, Sejersted OM. Triglyceride/fatty acid cycling is increased after exercise. Metabolism. 1990;39:993–999. doi: 10.1016/0026-0495(90)90313-2. [DOI] [PubMed] [Google Scholar]
- Bergman BC, Butterfield GE, Wolfel EE, Casazza GA, Lopaschuk GD, Brooks GA. Evaluation of exercise and training on muscle lipid metabolism. American Journal of Physiology. 1999;276:E106–117. doi: 10.1152/ajpendo.1999.276.1.E106. [DOI] [PubMed] [Google Scholar]
- Bülow J. Subcutaneous adipose tissue blood flow and triacylglycerol-mobilization during prolonged exercise in dogs. Pflügers Archiv. 1982;392:230–234. doi: 10.1007/BF00584301. [DOI] [PubMed] [Google Scholar]
- Bülow J. Adipose tissue blood flow during exercise. Danish Mededical Bulletin. 1983;30:85–100. [PubMed] [Google Scholar]
- Bülow J, Jelnes R, Astrup A, Madsen J, Vilmann P. Tissue/blood partition coefficients for xenon in various adipose tissue depots in man. Scandinavian Journal of Clinical and Laboratory Investigation. 1987;47:1–3. doi: 10.1080/00365518709168861. [DOI] [PubMed] [Google Scholar]
- Bülow J, Madsen J. Human adipose tissue blood flow during prolonged exercise II. Pflügers Archiv. 1978;376:41–45. doi: 10.1007/BF00585246. [DOI] [PubMed] [Google Scholar]
- Carraro F, Stuart CA, Hartl WH, Rosenblatt J, Wolfe RR. Effect of exercise and recovery on muscle protein synthesis in human subjects. American Journal of Physiology. 1990;259:E470–476. doi: 10.1152/ajpendo.1990.259.4.E470. [DOI] [PubMed] [Google Scholar]
- Coppack SW, Frayn KN, Humphreys SM, Dhar H, Hockaday TD. Effects of insulin on human adipose tissue metabolism in vivo. Clinical Science. 1989;77:663–670. doi: 10.1042/cs0770663. [DOI] [PubMed] [Google Scholar]
- Dyck DJ, Putman CT, Heigenhauser GJ, Hultman E, Spriet LL. Regulation of fat-carbohydrate interaction in skeletal muscle during intense aerobic cycling. American Journal of Physiology. 1993;265:E852–859. doi: 10.1152/ajpendo.1993.265.6.E852. [DOI] [PubMed] [Google Scholar]
- Ferrannini E, Barrett EJ, Bevilacqua S, Defronzo RA. Effect of fatty acids on glucose production and utilization in man. Journal of Clinical Investigation. 1983;72:1737–1747. doi: 10.1172/JCI111133. [DOI] [PMC free article] [PubMed] [Google Scholar]
- Frayn KN. Calculation of substrate oxidation rates in vivo from gaseous exchange. Journal of Applied Physiology. 1983;55:628–634. doi: 10.1152/jappl.1983.55.2.628. [DOI] [PubMed] [Google Scholar]
- Frayn KN, Coppack SW, Humphreys SM, Whyte PL. Metabolic characteristics of human adipose tissue in vivo. Clinical Science. 1989;76:509–516. doi: 10.1042/cs0760509. [DOI] [PubMed] [Google Scholar]
- Hickson RC, Rennie MJ, Conlee RK, Winder WW, Holloszy JO. Effects of increased plasma fatty acids on glycogen utilization and endurance. Journal of Applied Physiology. 1977;43:829–833. doi: 10.1152/jappl.1977.43.5.829. [DOI] [PubMed] [Google Scholar]
- Hildebrandt P, Birch K, Sestoft L, Nielsen SL. Orthostatic changes in subcutaneous blood flow and insulin absorption. Diabetes Research. 1985;2:187–190. [PubMed] [Google Scholar]
- Hodgetts V, Coppack SW, Frayn KN, Hockaday TD. Factors controlling fat mobilization from human subcutaneous adipose tissue during exercise. Journal of Applied Physiology. 1991;71:445–451. doi: 10.1152/jappl.1991.71.2.445. [DOI] [PubMed] [Google Scholar]
- Hoppeler H, Weibel ER. Limits for oxygen and substrate transport in mammals. Journal of Experimental Biology. 1998;201:1051–1064. doi: 10.1242/jeb.201.8.1051. [DOI] [PubMed] [Google Scholar]
- Jeukendrup AE, Saris WH, Wagenmakers AJ. Fat metabolism during exercise: a review. Part I: fatty acid mobilization and muscle metabolism. International Journal of Sports Medicine. 1998a;19:231–244. doi: 10.1055/s-2007-971911. [DOI] [PubMed] [Google Scholar]
- Jeukendrup AE, Saris WH, Wagenmakers AJ. Fat metabolism during exercise: a review – part II: regulation of metabolism and the effects of training. International Journal of Sports Medicine. 1998b;19:293–302. doi: 10.1055/s-2007-971921. [DOI] [PubMed] [Google Scholar]
- Kiens B, Essen GB, Christensen NJ, Saltin B. Skeletal muscle substrate utilization during submaximal exercise in man: effect of endurance training. The Journal of Physiology. 1993;469:459–478. doi: 10.1113/jphysiol.1993.sp019823. [DOI] [PMC free article] [PubMed] [Google Scholar]
- Lewis GF, Uffelman KD, Szeto LW, Weller B, Steiner G. Interaction between free fatty acids and insulin in the acute control of very low density lipoprotein production in humans. Journal of Clinical Investigation. 1995;95:158–166. doi: 10.1172/JCI117633. [DOI] [PMC free article] [PubMed] [Google Scholar]
- Odland LM, Heigenhauser GJ, Wong D, Hollidge-Horvat MG, Spriet LL. Effects of increased fat availability on fat-carbohydrate interaction during prolonged exercise in men. American Journal of Physiology. 1998;274:R894–902. doi: 10.1152/ajpregu.1998.274.4.R894. [DOI] [PubMed] [Google Scholar]
- Paul P. Effects of long lasting physical exercise and training on lipid metabolism. In: Howald H, Poortmans JR, editors. Metabolic Adaptation to Prolonged Exercise. Basel: Birkhäuser Verlag; 1975. pp. 156–193. [Google Scholar]
- Rådegran G. Ultrasound Doppler estimates of femoral artery blood flow during dynamic knee extensor exercise in humans. Journal of Applied Physiology. 1997;83:1383–1388. doi: 10.1152/jappl.1997.83.4.1383. [DOI] [PubMed] [Google Scholar]
- Randle PJ, Hales CN, Garland PB, Newsholme EA. The glucose-fatty acid cycle: its role in insulin sensitivity and the metabolic disturbances in diabetes mellitus. Lancet. 1963;1:785–789. doi: 10.1016/s0140-6736(63)91500-9. [DOI] [PubMed] [Google Scholar]
- Ravussin E, Bogardus C, Scheidegger K, Lagrange B, Horton ED, Horton ES. Effect of elevated FFA on carbohydrate and lipid oxidation during prolonged exercise in humans. Journal of Applied Physiology. 1986;60:893–900. doi: 10.1152/jappl.1986.60.3.893. [DOI] [PubMed] [Google Scholar]
- Rennie MJ, Holloszy JO. Inhibition of glucose uptake and glycogenolysis by availability of oleate in well-oxygenated perfused skeletal muscle. Biochemical Journal. 1977;168:161–170. doi: 10.1042/bj1680161. [DOI] [PMC free article] [PubMed] [Google Scholar]
- Rennie MJ, Winder WW, Holloszy JO. A sparing effect of increased plasma fatty acids on muscle and liver glycogen content in the exercising rat. Biochemical Journal. 1976;156:647–655. doi: 10.1042/bj1560647. [DOI] [PMC free article] [PubMed] [Google Scholar]
- Romijn JA, Coyle EF, Sidossis LS, Gastaldelli A, Horowitz JF, Endert E, Wolfe RR. Regulation of endogenous fat and carbohydrate metabolism in relation to exercise intensity and duration. American Journal of Physiology. 1993;265:E380–391. doi: 10.1152/ajpendo.1993.265.3.E380. [DOI] [PubMed] [Google Scholar]
- Simonsen L, Bülow J, Madsen J. Adipose tissue metabolism in humans determined by vein catheterization and microdialysis techniques. American Journal of Physiology. 1994;266:E357–365. doi: 10.1152/ajpendo.1994.266.3.E357. [DOI] [PubMed] [Google Scholar]
- van Harmelen V, Lönnqvist F, Thörne A, Wennlund A, Large V, Reynisdottir S, Arner P. Noradrenaline-induced lipolysis in isolated mesenteric, omental and subcutaneous adipocytes from obese subjects. International Journal of Obesity and Related Metabolic Disorders. 1997;21:972–979. doi: 10.1038/sj.ijo.0800504. [DOI] [PubMed] [Google Scholar]
- Vukovich MD, Costill DL, Hickey MS, Trappe SW, Cole KJ, Fink WJ. Effect of fat emulsion infusion and fat feeding on muscle glycogen utilization during cycle exercise. Journal of Applied Physiology. 1993;75:1513–1518. doi: 10.1152/jappl.1993.75.4.1513. [DOI] [PubMed] [Google Scholar]
- Wolfe RR, Klein S, Carraro F, Weber JM. Role of triglyceride-fatty acid cycle in controlling fat metabolism in humans during and after exercise. American Journal of Physiology. 1990;258:E382–389. doi: 10.1152/ajpendo.1990.258.2.E382. [DOI] [PubMed] [Google Scholar]