

Abstract
This study tested predictions from a network model of ventrolateral medullary respiratory neurone interactions for the generation of the cough motor pattern observed in inspiratory and expiratory pump muscles.
Data were from 34 mid-collicularly decerebrated, paralysed, artificially ventilated cats. Cough-like patterns (fictive cough) in efferent phrenic and lumbar nerve activities were elicited by mechanical stimulation of the intrathoracic trachea. Neurones in the ventral respiratory group, including the Bötzinger and pre-Bötzinger complexes, were monitored simultaneously with microelectrode arrays. Spike trains were analysed for evidence of functional connectivity and responses during fictive cough with cycle-triggered histograms, autocorrelograms, cross-correlograms, and spike-triggered averages of phrenic and recurrent laryngeal nerve activities.
Significant cross-correlogram features were detected in 151 of 1988 pairs of respiratory modulated neurones. There were 59 central peaks, 5 central troughs, 11 offset peaks and 2 offset troughs among inspiratory neurone pairs. Among expiratory neurones there were 23 central peaks, 8 offset peaks and 4 offset troughs. Correlations between inspiratory and expiratory neurones included 20 central peaks, 10 central troughs and 9 offset troughs. Spike-triggered averages of phrenic motoneurone activity had 51 offset peaks and 5 offset troughs.
The concurrent responses and multiple short time scale correlations support parallel and serial network interactions proposed in our model for the generation of the cough motor pattern in the respiratory pump muscles. Inferred associations included the following. (a) Excitation of augmenting inspiratory (I-Aug) neurones and phrenic motoneurones by I-Aug neurones. (b) Inhibition of augmenting expiratory (E-Aug) neurones by decrementing inspiratory (I-Dec) neurones. (c) Inhibition of I-Aug, I-Dec and E-Aug neurones by E-Dec neurones. (d) Inhibition of I-Aug and I-Dec neurones and phrenic motoneurones by E-Aug neurones. The data also confirm previous results and support hypotheses in current network models for the generation of the eupnoeic pattern.
Cough is elicited by stimulation of receptors in the central airways and promotes the removal of mucus and foreign substances through forced expiration. There is extensive information on the responses of the respiratory muscles during cough (Korpas & Tomori, 1979; Widdicombe, 1986). However, the mechanisms by which the brain mediates the reflex are not well understood.
We have proposed a model for the participation of the ventrolateral medullary respiratory neuronal network in the generation of the cough motor pattern (Shannon et al. 1998). Our in vivo results from simultaneous recordings of many single neurones supported two major hypotheses on which the model was based. (1) The Bötzinger-rostral ventral respiratory group network implicated in generating and shaping the eupnoeic pattern of breathing is also involved in producing the cough motor pattern observed in the inspiratory and expiratory pump muscles. (2) The cough pattern is relayed to spinal motoneurones by the same bulbospinal neurones that transmit eupnoeic drive. Collectively, results from other investigators are consistent with these hypotheses (Engelhorn & Weller, 1965; Jakus et al. 1987; Dawid-Milner et al. 1993; Oku et al. 1994; Gestreau et al. 1996; Bongianni et al. 1998).
The cough model included functional connections among medullary neurones that were inferred from the cross-correlation of extracellular spike trains and spike-triggered averaging of intracellular potentials (for references see Ezure, 1990; Bianchi et al. 1995; Duffin et al. 1995; Shannon et al. 1998), and, in separate experiments, neurone responses during cough (Shannon et al. 1998). The objective of this study was to test the model by defining functional connectivity among physiologically characterized simultaneously recorded medullary respiratory neurones and determining their concurrent responses during fictive cough. Multi-site recordings and cross-correlational methods permitted the detection and evaluation of interactions among several neurones during the sequence of motor events in a cough.
Preliminary accounts of some of the results have been reported (Baekey et al. 1997, 1998a,b).
METHODS
General methods
Experiments were performed under protocols approved by the University of South Florida's Animal Care and Use Committee. Data were obtained from 34 adult cats (2.5-4.1 kg) of either sex. Animals were initially anaesthetized with intravenous sodium thiopental (22.0 mg kg−1) and later decerebrated using the technique of Kirsten & St John (1978). External carotid arteries were ligated caudal to the lingual arteries bilaterally. A craniotomy was performed in the parietal bones. The brainstem was transected at the midcollicular level and nervous tissue rostral to the transection was aspirated. Prior to decerebration, the level of anaesthesia was assessed periodically by a noxious stimulus (toe pinch). If the withdrawal reflex occurred or there was an increase in blood pressure or respiration, additional anaesthesia was given until the response was absent. Femoral arteries and veins were catheterized for monitoring arterial blood pressure, acquisition of arterial blood samples, and administration of intravenous fluids and drugs. Arterial blood samples were analysed periodically for PO2, PCO2, pH, and [HCO3−]; these parameters were maintained within normal limits. Solutions of 5 % dextrose in 0.45 % NaCl, 5 % Dextran, or lactated Ringer solution were administered intravenously as needed to maintain a mean blood pressure of at least 100 mmHg. Before surgery was initiated, atropine (0.5 mg kg−1i.m.) was administered to reduce mucous secretion in the airways, and dexamethasone (2.0 mg kg−1i.m.) was given to help prevent hypotension and minimize brainstem swelling. During and subsequent to the decerebration, animals were paralysed by continuous intravenous infusion of gallamine triethiodide (4.0 mg kg−1 h−1), and artificially ventilated through a tracheal cannula with a phrenically driven respirator. End-tidal CO2 was maintained at 4.0-5.0 %. A bilateral thoracotomy was performed to minimize brainstem movement. When necessary, the fraction of inspired O2 was increased to prevent hypoxaemia that often occurs during long-term experiments because of ventilation-perfusion mismatching resulting from the open chest. The functional residual capacity of the lungs in thoracotomized animals was maintained within a normal range by adjustment of end-expiratory pressure. Periodically, the trachea was cleared by suction and the lungs were hyperinflated. Rectal temperature was maintained at 38.0 ± 0.5°C. Animals were placed prone in a stereotaxic frame. At the end of the experiments, cats were killed with an overdose of sodium pentobarbital.
Nerve recordings
The right cranial iliohypogastric (L1) and left phrenic (C5) nerves were desheathed, cut and their efferent activity recorded with bipolar silver electrodes in pools of mineral oil. The right recurrent laryngeal nerve was desheathed and cut close to the larynx in order to leave the tracheal innervation intact; efferent activity was recorded with bipolar silver electrodes covered with cotton pledgets saturated with mineral oil. Nerve signals were amplified and filtered (bandpass 0.1-5 kHz). Phrenic and lumbar nerve discharges were integrated with a leaky resistor-capacitor circuit (0.2 s time constant) and recorded on a polygraph to monitor the effectiveness of the stimuli to elicit cough.
Neurone recordings and characterization
An occipital craniotomy was performed and portions of the caudal cerebellum were removed by suction to expose the medulla. Medullary respiratory neurones were monitored with two independently controlled planar arrays of tungsten microelectrodes (10-12 MΩ) positioned on the same side of the medulla (Fig. 1a). Each array consisted of six to eight microelectrodes. In the initial experiments, individual electrodes in an array were fixed to each other. In later experiments, the depth of each electrode was adjusted individually with micromotor controllers. Signals were amplified and filtered (bandpass 0.1-5 kHz). The medullary surface was covered with a pool of warm mineral oil.
Figure 1. Methods illustrations.

A, schematic diagram of electrode array recording sites in the ventral respiratory group. B, cough stimulator. C, firing incidence of a set of 14 simultaneously recorded neurones along with pulses representing the onset of the inspiratory and expiratory phases (channels 15 and 16), integrated phrenic (∫PHR), lumbar (∫LUM) and recurrent laryngeal nerve (∫RLN) efferent activities, tracheal pressure (TP), arterial blood pressure (BP), end-tidal CO2 (ETCO2), and stimulus marker (Stim). The boxed areas of traces 15 and 16 indicate control (left box) and cough (right box) data segments used for statistical examination of changes in neurone firing rates during cough. Fictive cough was characterized generally by a large increase in phrenic and then lumbar nerve activities. D, integration (∫), cycle-triggered histogram (CTH) and autocorrelogram (ACH) of neurone 11. E, illustration of the identification of a laryngeal motoneurone with spike-triggered averaging of recurrent laryngeal nerve efferent activity. rVRG and i-cVRG, rostral and intermediate-caudal ventral respiratory group, respectively. Böt, Bötzinger. pre-Böt, pre-Bötzinger.
Regions of the ventral lateral medulla that were searched for respiratory modulated neurones included the following. (a) The rostral ventral respiratory group (VRG), which contains the Bötzinger and pre-Bötzinger complexes (BÖT/rVRG); 3.0-5.5 mm rostral to obex, 3.0-4.5 mm lateral to mid-line, 3.0-5.5 mm below dorsal surface. (b) The intermediate-caudal VRG (i-cVRG); 2.0 mm rostral to 4.0 mm caudal to obex, 3.0-5.0 mm lateral to mid-line, 2.5-4.5 mm below dorsal surface (Lindsey et al. 1987; Ezure, 1990; Bianchi et al. 1995; Schwarzacher et al. 1995; Shannon et al. 1998). Neurones antidromically activated (positive collision test) from the spinal cord were designated bulbospinal. Bipolar stainless steel electrodes were placed in the ventral spinal cord at the T1 level contralateral to medullary recording sites. Single pulses ranging in intensity from 1 to 10 V and 0.1 ms duration were used. Spike-triggered averaging of contralateral phrenic and ipsilateral recurrent laryngeal nerve efferent activities was used to identify putative phrenic premotoneurones and laryngeal motoneurones, respectively. The identification of laryngeal motoneurones was used to distinguish them from propriobulbar neurones; they were not evaluated further in this study (see section headed ‘Spike-triggered averaging of efferent nerve signals’).
Evoking fictive cough
Mechanical stimulation of the intrathoracic trachea has been used in spontaneously breathing animals to elicit cough and in paralysed, ventilated animals to produce cough-like patterns (fictive cough) in respiratory motor activity (Korpas & Tomori, 1979; Bolser, 1991). Fictive coughing was elicited by stimulating sections of the intrathoracic trachea (mid-cervical to carinal region) with two loops of polyethylene tubing configured as ellipses and attached to a thin wire inserted through a port in the tracheal cannula (Fig. 1b). The tubing stimulator was positioned normally in the tracheal cannula extension (plastic tubing). Movement of the stimulator into and out of the trachea, its rotation rate and the region of stimulation were controlled electronically. The same parameters were used in each cough series. Following each stimulus period, the polyethylene tubing was retracted into the cannula. Multiple coughs were usually elicited with minimal stimulation of the trachea. When more than one cough occurred in a trial, only the first was analysed. Cough was characterized by a large increase in phrenic activity coincident with or immediately followed by a large increase in lumbar activity (Fig. 1C). At least five separate episodes of cough were produced in each recording. Each stimulus trial was separated by at least 1 min, which was sufficient for inspiratory and expiratory burst patterns to return to control levels. Because pulmonary stretch receptor feedback to the medulla is important in the production of cough (Sant'Ambrogio, 1993), a phrenically driven ventilator was used to allow matching of pulmonary stretch receptor activity with central inspiratory activity.
Data acquisition, entry and preprocessing
During the experiments, appropriate signals were monitored on oscilloscopes, a polygraph and audio monitors. Signals from the microelectrode arrays, efferent nerve activities, arterial blood pressure, tracheal pressure, and stimulus timing signals were recorded on magnetic tape for off-line analysis (Fig. 1C). Multi-fibre efferent phrenic, lumbar and recurrent laryngeal nerve activities were integrated (full-wave rectified signal to a resistor-capacitor integrator; time constant, 0.2 s) to obtain a moving time average of activity in the nerves. These analog signals, together with arterial blood pressure, tracheal pressure, stimulus timing signals, and signals from each microelectrode, were entered into a computer via a 16 channel analog-to-digital converter. Because the signals from a single experimental run were recorded on two 16 channel FM instrument recorders, a synchronization timing pulse recorded on each tape was also entered to permit later merging of data from the tapes into one master file (Morris et al. 1996). During the merge, time stamps were derived from the integrated phrenic signal to indicate the onset of each inspiratory and expiratory phase (see channels 15 and 16 in Fig. 1C). Action potentials of single neurones were converted to times of occurrence with spike-sorting software (Datawave Tech. Corp.). These data files were transferred to a Hewlett-Packard 9000/735 computer for subsequent processing and analysis. The signals of efferent multiunit nerve activities were high-pass filtered (40 Hz, 3 dB cut-off), and along with the common synchronization timing pulses, were digitized (5 kHz) with a 16 bit ADC488/16 analog-to-digital converter hosted by a Hewlett-Packard 9000/380 computer. These files were subsequently analysed with the corresponding spike files for spike-triggered averaging as described below. The program Xscope (Lindsey et al. 1992) provided a graphical representation of the times of action potentials and other digital and analog signals (Fig. 1C). The program allowed additional event codes to be added and graphically confirmed the selection of data segments to be written as separate files for later analysis.
Spike train analysis methods for each single neurone
Spike trains were subjected to two statistical evaluations of respiratory modulation and a measure of respiratory modulation, η2, was calculated (Orem & Dick, 1983; Morris et al. 1996). Neurone cycle-triggered histograms were compared to phrenic cycle-triggered histograms to define the respiratory phase (as inspiratory – I, or expiratory – E) in which the neurone was more active (Fig. 1D). Neurones with peak firing rates in the first half of the phase were classified as decrementing (Dec), whereas those cells with peak firing rates in the second half of the phase were denoted as augmenting (Aug). Cells with a relatively constant discharge rate throughout a respiratory phase were classified as plateau (Plat). Inspiratory or expiratory modulated cells with activity also traversing the transition between the respiratory phases were denoted with the modifiers I/E or E/I (e.g. I-E/I); these cells do not have the Aug, Dec or Plat firing patterns. Neurones with very low firing rates were classified as I-Other or E-Other. Cells active only during cough were denoted as Recruit. Neurones with no preferred phase of maximum activity were classified as non-respiratory modulated (NRM).
Autocorrelograms were computed for each spike train to ensure that it represented the activity of one neurone (Fig. 1D). Multiple spike train data would include short intervals not constrained by refractoriness. Spike trains were also evaluated statistically for changes in discharge pattern during cough. The peak firing rate, average firing rate and duration of firing of the neurones during the first cough cycle, averaged over five trials, had to be significantly different from the mean for five control cycles just preceding the cough (P < 0.05, Student's t test). For example, see the dotted line sections on channels 15 and 16 in Fig. 1C.
Cross-correlation histograms
Cross-correlograms were calculated for each pair of simultaneously recorded spike trains to detect and evaluate effective connectivity. Cough segments were deleted from the spike train files to ensure that correlograms were computed under the same ‘state’. Connectivity could not be evaluated during the cough cycles only; there were too few spikes. Inferred functional interactions congruent with data from simulations of neurones with known connections are considered in Discussion (Perkel et al. 1967; Moore et al. 1970; Aertsen & Gerstein, 1985). An offset trough suggests an inhibitory process, defined operationally as any mono- or paucisynaptic relationship that reduces target cell firing probability. An offset peak suggests either an excitatory action between the neurones or an unobserved shared input that influences both cells with different delays. Shared inputs or cross-connections with similar action result in synchronous discharge reflected as a central peak. A central trough can be attributed to functional inputs with opposite actions on each of the monitored neurones. A detectability index (DI, equal to the ratio of the maximum amplitude of departure from background amplitude, D, to the background amplitude, divided by the standard deviation of the correlogram noise) was used to test significance (Aertsen & Gerstein, 1985). Values greater than two were considered significant. If this criterion was met, the D/background ratio was used as an indicator of the visibility or strength, S, of the correlation.
Spike-triggered averaging of efferent nerve signals
Unrectified and full-wave rectified digitized signals from phrenic and recurrent laryngeal nerves were averaged, using the spikes of each simultaneously recorded neurone as trigger events. Short-latency, short-duration offset peaks (1.5 ± 0.3 ms, < 1.1 ms half-width) in rectified phrenic nerve averages were used as evidence that the cell was (1) a premotoneurone that projected to the monitored motoneurone pool, or (2) tightly synchronized with such a cell by functionally antecedent shared inputs (Cohen et al. 1974; Davies et al. 1985). Presynaptic synchronization is the simplest explanation for medium-width peaks (> 1.1 ms half-width), but the participation of oligosynaptic excitation cannot be excluded. A short-latency (1.5-3.5 ms; Christakos et al. 1994), short-duration biphasic feature in the unrectified recurrent laryngeal nerve average provided evidence that the recorded neurone was a laryngeal motoneurone (Botteron & Cheney, 1989; Maier et al. 1998; Perlmutter et al. 1998). The biphasic feature represents ‘motoneurone’ or ‘motor unit’ action potentials. The presence of offset troughs is consistent with functional inhibition.
RESULTS
In 34 cats, the spike trains of 420 neurones were recorded in the region of the rostral (Bötzinger, pre-Bötzinger), intermediate and caudal ventral respiratory group and evaluated for responses during fictive cough. Other results from 306 of the neurones were included in a previous report (Shannon et al. 1998). Among the 420 neurones, 351 were respiratory modulated and 297 had altered activities during cough. Table 1 presents a summary of neuronal discharge patterns, changes in peak firing rate during cough, and results from antidromic stimulation and spike-triggered averages of phrenic activity. Some neurones were not tested for evidence of spinal projections with these methods. Putative propriobulbar neurones with potential roles in the generation of the cough motor pattern and control of bulbospinal pre-motoneurones were evaluated. Twenty-five neurones were identified as laryngeal motoneurones based on spike-triggered averages as illustrated in Fig. 1E. The offset biphasic feature in the unrectified spike-triggered average was indicative of spikes arising from a motoneurone with an axon in the recorded nerve (Botteron & Cheney, 1989; Maier et al. 1998; Perlmutter et al. 1998). Neurones so classified were not included in Table 1 nor considered further in this study.
Table 1.
Discharge pattern, bulbospinal projection, primary offset feature in phrenic spike-triggered averages, and changes in peak firing rate of BÖT/rVRG and i-cVRG neurones during cough
| BÖT/rVRG | i-cVRG | |||||||
|---|---|---|---|---|---|---|---|---|
| n | BS | PHR-STA | CG | n | BS | PHR-STA | CG | |
| I-Aug | 32 | 9/25 | 5sp, 12mp | 32↑ | 43 | 24/39 | 12sp, 6mp | 43↑ |
| I-Dec | 28 | 1/23 | 4mp | 23↑,1↓, 4→ | 17 | 5/10 | 4mp | 15↑,2→ |
| I-Plat | 5 | 0/5 | 2sp,1mp | 1↑, 4→ | 7 | 3/7 | 2mp | 7↑ |
| I-E/I | 11 | 1/6 | 2mp | 9↑, 2→ | 8 | 0/7 | — | 7↑,1→ |
| I-I/E | — | — | — | — | 3 | 0/3 | — | 3↑ |
| I-Other | 19 | 0/8 | 1sp | 8↑,3↓, 8→ | 18 | 1/8 | — | 8↑, 10→ |
| E-Aug | 28 | 1/20 | 2t | 19↑, 9→ | 35 | 8/25 | 2t | 32↑,3↓ |
| E-Dec | 21 | 0/18 | 1t | 15↑,5↓,1→ | 36 | 2/22 | — | 29↑,3↓,4→ |
| E-I/E | 6 | 0/5 | — | 4↑, 2→ | 3 | 0/3 | — | 3↑ |
| E-Other | 10 | 0/8 | — | 8↑,2↓ | 6 | 1/5 | — | 4↑,2↓ |
| E-Recruit | 4 | 0/3 | — | 4↑ | 12 | 2/5 | — | 12↑ |
| NRM | 40 | — | — | 4↑, 36→ | 29 | — | — | 5↑, 24→ |
| Total | 204 | 216 | ||||||
Neurones are classified as expiratory (E) or inspiratory (I), and augmenting (Aug), decrementing (Dec), other, plateau (Plat), phase spanning (I/E, E/I), recruited (Recruit), or nonrespiratory modulated (NRM). n, number of neurones; BS, results of bulbospinal identification; PHRSTA, results of spike-triggered averaging with phrenic nerve efferent activity (sp, short-duration peaks; mp, medium-duration peaks; t, troughs); CG, neurone peak firing rate changes during cough (↑, increase; ↓, decrease; →, no change). The denominator in column BS represents the number of cells tested. The recording domains are fully defined in the text.
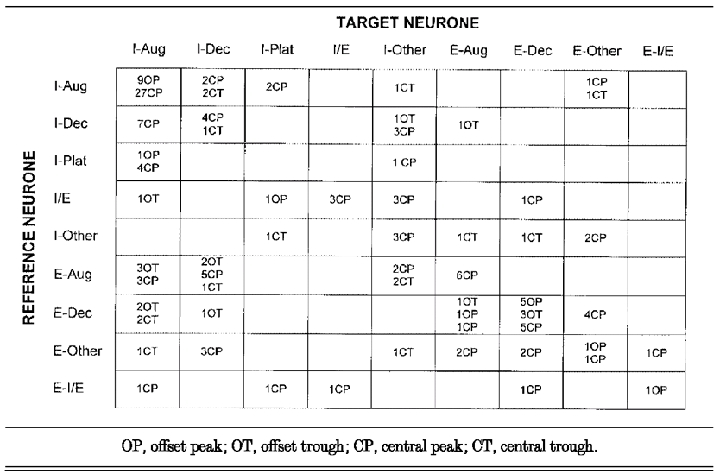
Each analysed recording lasted approximately 45 min. Cross-correlograms of 1988 pairs of respiratory modulated neurones yielded significant features among inspiratory neurones (n = 54), expiratory neurones (n = 30), and inspiratory and expiratory neurones (n = 27). There were 59 central peaks, 5 central troughs, 11 offset peaks and 2 offset troughs among inspiratory neurones. Among expiratory neurones there were 23 central peaks, 8 offset peaks and 4 offset troughs. Interactions among inspiratory and expiratory neurones included 20 central peaks, 10 central troughs and 9 offset troughs. Table 2 presents a tally of pairs of neurones with short time scale correlations arranged by respiratory modulation. Cross-correlograms of neurones recorded on the same electrode are not included in these results because of the artifact at the origin due to overlapping spike waveforms.
Table 2.
Tally of pairs of neurones with short time scale correlations arranged by respiratory modulation
Spike-triggered averages of efferent phrenic activity also revealed evidence of functional links with phrenic motoneurones (Table 1). There were offset peaks (n = 51) following inspiratory neurone spikes (i.e. I-Aug, I-Dec, I-Plat, I-E/I, I-Other) and offset troughs (n = 5) following expiratory neurone spikes (i.e. E-Aug, E-Dec). Data presented here include only primary features in the spike-triggered averages. Secondary features were observed, particularly multiple peaks and troughs when the averages were triggered by an inspiratory neurone (e.g. high frequency and medium frequency oscillations; Christakos et al. 1994), but are not considered further.
Multiple correlations in groups of simultaneously recorded neurones
Simultaneously recorded spike trains were screened for short time scale correlations that could provide evidence of paucisynaptic interactions. The number of neurones recorded simultaneously ranged from 6 to 20 (mean = 10). Examples of results from several separate groups of neurones show that multi-site recordings aided placement of neurones into functional contexts. The four groups (A-D) presented below were chosen because each contained multiple examples of correlations detected in this study. These groups do not contain the entire set of simultaneously recorded neurones. The figures include only those cells with inferred functional links.
Group A: I-Aug neurones
Figure 2 shows integrated activity of five I-Aug neurones, phrenic, lumbar and recurrent laryngeal nerves, and tracheal pressure during control and cough cycles. The laryngeal nerve recording was included here as an example because its spike-triggered averages were used to help characterize neurone function as noted above. The I-Aug neurones increased their firing rate in a manner similar to the phrenic motoneurones during the cough cycle. Cross-correlograms of three pairs of the I-Aug neurones had offset peaks with positive time lags (Fig. 3A–C). These significant primary features documented an increased firing probability in intermediate-caudal VRG (i-cVRG) target neurone 68 following reference spikes in two rostral neurones, 41 and 46, and i-cVRG cell 72.
Figure 2. Concurrent responses of I-Aug neurones (Group A) during fictive cough.
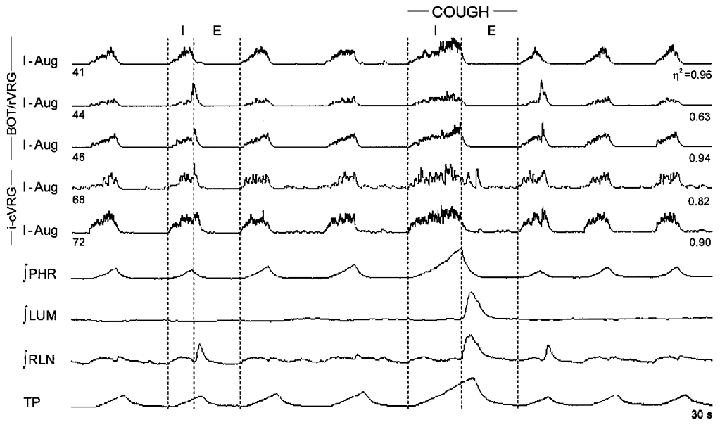
Integrated activities of five I-Aug neurones, phrenic, lumbar and recurrent laryngeal nerves, and tracheal pressure. η2, statistical measure of respiratory modulation. All I-Aug neurones showed a pattern change similar to the phrenic pattern.
Figure 3. Cross-correlograms and spike-triggered averages of I-Aug neurones (Group A).
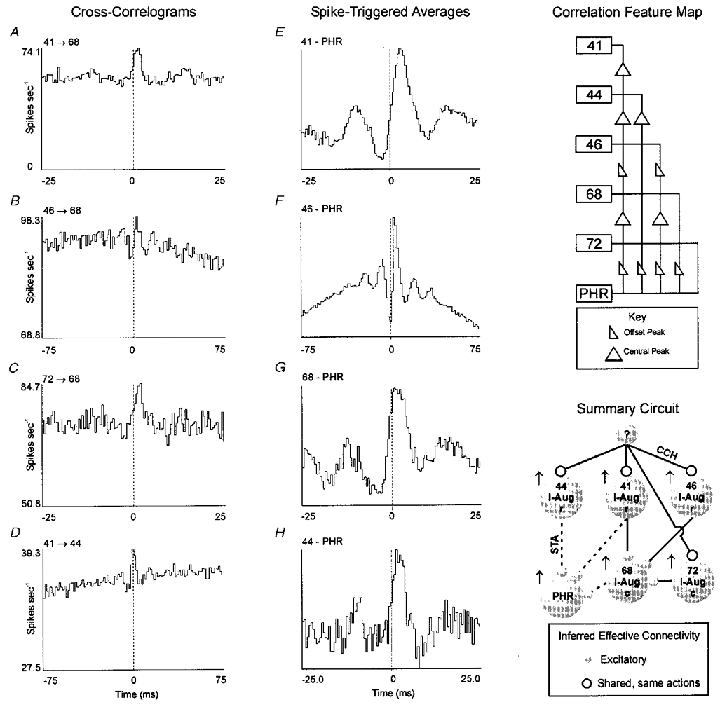
Primary features suggested excitatory connectivity among I-Aug neurones and between I-Aug neurones and phrenic motoneurones. Cross-correlograms B–D have been scaled-up to show significant primary features by subtraction of a percentage (70, 60 and 70%, respectively) of the counts in the minimum bin from each bin. A, CCH; offset peak with a lag of 0.5 ms; half-width (HW), 1.0 ms; detectability index (DI), 9.3; correlation strength (S), 0.33; 53914 reference and 28594 target spikes. B, CCH; offset peak with a lag of 3.0 ms; HW, 1.0 ms; DI, 3.9; S, 0.07; 63998 reference and 22118 target spikes. C, CCH; offset peak with a lag of 1.0 ms; HW, 1.0 ms; DI, 4.6; S, 0.16; 63999 reference and 23566 target spikes. D, CCH; central peak; HW, 3.0 ms; DI, 7.3; S, 0.14; 53914 reference and 28962 target spikes. Number of trigger events in spike-triggered averages: E, 53854; F, 84084; G, 28563; H, 28947. The correlation feature map (top right) summarizes primary features in correlation and spike-triggered average histograms. The horizontal line arising from the nth box (from the top) is followed lateral to the nth vertical line from the left. Symbols (see Key) on the vertical line represent the primary feature calculated with the use of the nth neurone as the reference cell and the neurone or phrenic below the symbol as the target neurone (cross-correlogram) or nerve (spike-triggered average). The summary circuit (bottom right) shows inferred functional connections for correlations detected in the data set including neurones in the BÖT/rVRG (r) and i-cVRG (c); cross-correlograms, continuous lines; spike-triggered averages, dashed lines. Changes in peak firing rate during cough: ↑, increase.
Central peaks indicative of shared inputs were observed in six cross-correlograms from Group A (e. g. cross-correlogram in Fig. 3D). The neurones involved are indicated in the correlation feature map (Fig. 3). Medium width peaks (> 1.1 ms half-width) in spike-triggered averages from Group A indicated that I-Aug neurone spikes (neurones 41, 44, 46 and 68) were associated with transient increases in phrenic motoneurone activity (Fig. 3E–H). Units 41, 46 and 72 had negative bulbospinal tests and 44 and 68 were not tested. The summary circuit in Fig. 3 shows functional connections inferred from the detected correlations. This and other subsequent summary diagrams were placed adjacent to corresponding results to facilitate further considerations in Discussion.
Overall, offset peaks with positive lags were detected in eight cross-correlograms calculated with spikes in rostral VRG (rVRG) I-Aug neurones as reference events and i-cVRG I-Aug cells as targets. One example of an offset peak was found in the cross-correlogram for a pair of i-cVRG I-Aug cells. Central peaks were observed in 27 cross-correlograms of I-Aug pairs.
Short-duration (< 1.1 ms half-width) and medium-duration (> 1.1 ms half-width) offset peaks were detected in 35 I-Aug/phrenic spike-triggered averages (17 rVRG, 18 i-cVRG). Thirty-three neurones were identified as bulbospinal (24 i-cVRG, 9 rVRG). All I-Aug neurones showed a pattern change during cough similar to the phrenic nerve pattern.
Group B: I-Dec, I-Other, E-Aug and E-Dec neurones
Evidence for functional links among this set of BÖT/rVRG neurones, with altered activities during cough, is illustrated in Figs 4 and 5. All cells had negative bulbospinal tests. Figure 4 shows the control and cough discharge patterns of four BÖT/rVRG neurones and one i-cVRG neurone; the set included one E-Dec, two E-Aug, one I-Dec and one I-Other neurone.
Figure 4. Responses during fictive cough of I-Dec, I-Other, E-Aug and E-Dec neurones (Group B).

Concurrent and sequential changes in discharge patterns were consistent with I-Dec cell 57 inhibiting E-Aug cell 41 (1) and I-Other cell 43 (2), and E-Aug cell 44 inhibiting I-Dec cell 57 and phrenic activity (3) and being inhibited by E-Dec cell 56 (4). Events indicated by the circled numbers in the designated cough phase are detailed further in the text.
Figure 5. Cross-correlograms and spike-triggered averages of Group B neurones.
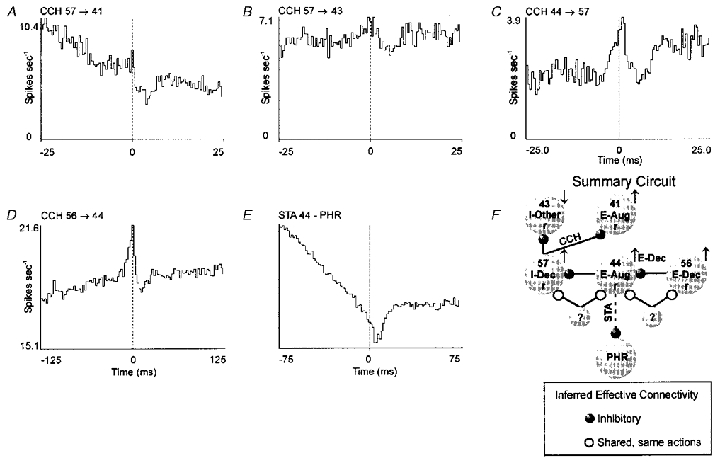
Primary features suggested that I-Dec cell 57 inhibited E-Aug cell 41 and I-Other cell 43, and E-Aug cell 44 inhibited I-Dec cell 57 and phrenic activity and was inhibited by E-Dec cell 56. Correlograms D and E have been scaled-up to show significant primary features by subtraction of 70 % of the counts in the minimum bin from each bin. A, CCH; offset trough with a lag of 1.0 ms; HW, 5.0 ms; DI, 7.2; S, 0.61; 63938 reference and 53713 target spikes. B, CCH; offset trough with a lag of 3.0 ms and a central peak; HW, 2.0 ms; DI, 3.16; S, 0.22; 63993 reference and 12091 target spikes. C, CCH; offset trough with a lag of 4.5 ms and a central peak; HW, 2.5 ms; DI, 4.4; S, 0.45; 46934 reference and 63979 target spikes. D, CCH; offset trough with a lag of 10.0 ms and a central peak; HW, 2.5 ms; DI, 4.1; S, 0.09; 29285 reference and 47105 target spikes. E, STA; number of trigger events, 17875. F, summary circuit of inferred connectivity. Changes in peak firing rate (↑, increase; ↓, decrease) and pattern (Dec, decrementing) during cough.
Cross-correlograms for two BÖT/rVRG neurone pairs indicated transient declines in the firing probabilities of E-Aug and I-Other neurones 41 and 43, respectively, following spikes in I-Dec neurone 57 (Fig. 5a and B). During eupnoea and cough, the onset of I-Dec cell 57 activity was associated with the termination of E-Aug cell 41 discharge (Fig. 4, label 1). During cough, there was almost complete absence of I-Other cell 43 discharge whilst I-Dec cell 57 activity increased (Fig. 4, label 2).
The cross-correlogram for E-Aug neurone 44 and I-Dec neurone 57 had two primary features (Fig. 5C). The central peak indicated that the cells tended to discharge synchronously; the offset trough with a positive time lag revealed a transient decrease in the firing probability of the I-Dec neurone following spikes in the E-Aug cell. The average of phrenic activity triggered by spikes in E-Aug neurone 44 also had a trough with a positive lag (Fig. 5E). The simultaneous recording of the discharge patterns showed that I-Dec neurone 57 and phrenic motoneurone activities were silent when E-Aug neurone 44 discharged (Fig. 4, label 3).
E-Aug neurone 44 also had a reduced discharge probability following spikes in E-Dec neurone 56 (Fig. 5D); the cross-correlogram also featured a central peak. During both eupnoea and cough, the firing rate of the E-Aug neurone was lowest when the E-Dec neurone firing rate was highest and vice versa (Fig. 4, label 4).
Group C: I-Aug, I-Dec and E-Dec neurones
Integrated records from this set of correlated VRG neurones are shown in Fig. 6. This group included one BÖT/rVRG I-Dec neurone, three i-cVRG E-Dec cells, and a bulbospinal I-Aug neurone. During cough, the increased firing rate of E-Dec unit 67 at the inspiratory-expiratory transition was associated with the termination of I-Aug unit 70 and the delayed large increase in E-Dec unit 66 activity during the early expiratory phase (Fig. 6, asterisks). Cycle-triggered histograms (Fig. 7D–F) illustrate a decrease in the firing rate of neurone 66 coincident with the peak firing rate in neurone 67 during control cycles (see asterisk in Fig. 7F). Corresponding short-time scale transient declines in the firing probabilities of both E-Dec neurone 66 and bulbospinal I-Aug neurone 70 following spikes in E-Dec neurone 67 were indicated by offset troughs in the correlograms (Fig. 7a and B). Synchronized activity among E-Dec cells 66, 67 and 68 was indicated by central peaks in their respective cross-correlograms; an example is shown in Fig. 7C.
Figure 6. Changes in the discharge patterns of I-Aug, I-Dec and E-Dec neurones (Group C) during fictive cough.
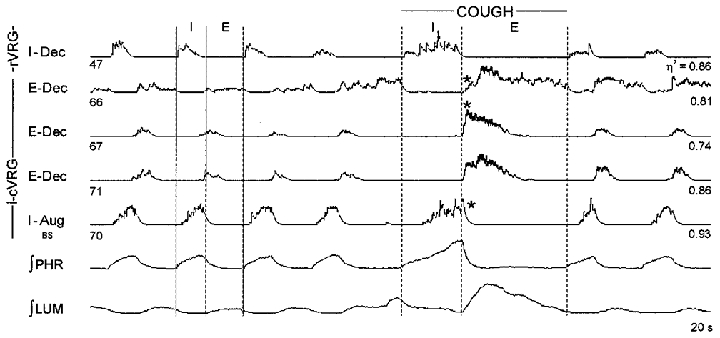
Responses were consistent with E-Dec cell 67 inhibiting E-Dec cell 66 and I-Aug cell 70. Events indicated by the asterisks in the designated cough phase are detailed further in the text.
Figure 7. Cross-correlograms and spike-triggered averages of Group C neurones.
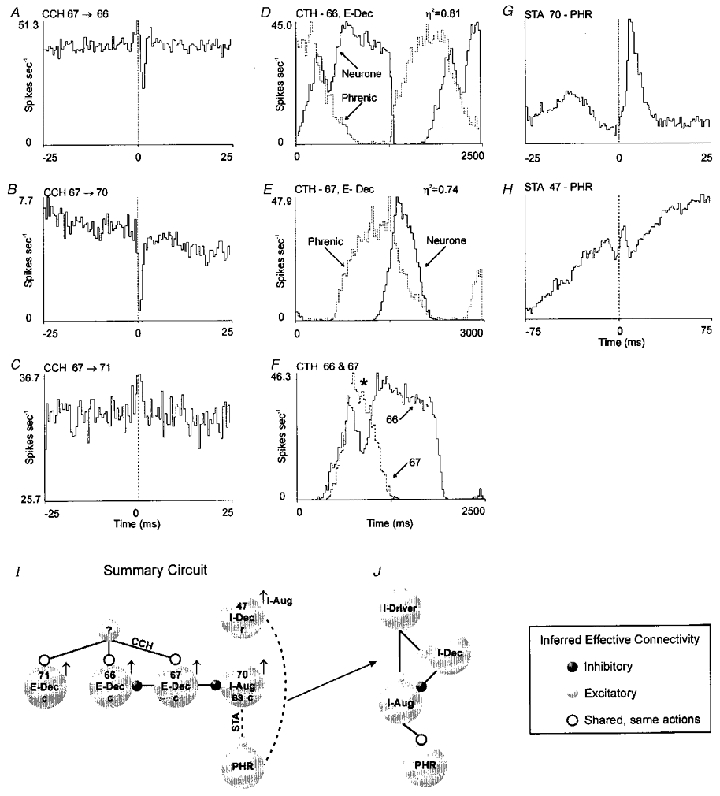
Data is consistent with E-Dec cell 67 inhibiting E-Dec cell 66 and bulbospinal (premotor) I-Aug cell 70, and I-Aug cell 70 exciting phrenic motoneurones; E-Dec cells 66, 67 and 71 also receive shared inputs. Correlogram C was scaled up 70 % to show significant primary features. A, CCH; offset trough with a lag of 1.5 ms; HW, 0.75 ms; DI, 7.4; S, 0.45; 15273 reference and 43966 target spikes. B, CCH; offset trough with a lag of 0.5 ms; HW, 0.75 ms; DI, 6.3; S, 0.85; 15262 reference and 22858 target spikes. C, CCH; central peak; HW, 0.5 ms; DI, 3.5; S, 0.17; 15270 reference and 27721 target spikes. D, E and F, cycle-triggered histograms (CTH); 100 cycles averaged. G, STA; number of trigger events, 23906. H, STA; number of trigger events, 12862. I, summary circuit of inferred connectivity. Changes in firing rate: ↑, increase and pattern (Aug, augmenting) during cough. J, summary model representing a plausible interpretation of the spike-triggered average in H (see text for interpretation).
A pronounced offset peak in one spike-triggered average indicated a transient increase in phrenic activity associated with spikes in the bulbospinal I-Aug neurone 70 (Fig. 7G). The medium-width offset peak in the spike-triggered average for I-Dec neurone 47 (Fig. 7H) was consistent with an increased probability of firing of phrenic motoneurones. Both inspiratory neurones showed augmenting discharge patterns during cough (Fig. 6).
Group D: I-Aug, E-Aug and E-Dec neurones
Figure 8 illustrates functional links of four neurones in this group and changes in their activities during cough. The group included E-Aug, E-Dec and I-Aug neurones in the BÖT/rVRG and an I-Plat cell in the i-cVRG. An increased probability of firing of the I-Aug neurone 43 following spikes in I-Plat neurone 71 is documented by an offset-correlogram peak (Fig. 8b). The firing rates of both neurones increased during the latter part of the inspiratory phase of cough (Fig. 8a, label 1). A broad offset peak in the phrenic spike-triggered average (not shown) suggested neurone 71 was synchronized on a short time scale with phrenic activity.
Figure 8. Alterations in firing rates during fictive cough and functional interactions among I-Aug, I-Plat, E-Aug and E-Dec neurones (Group D).
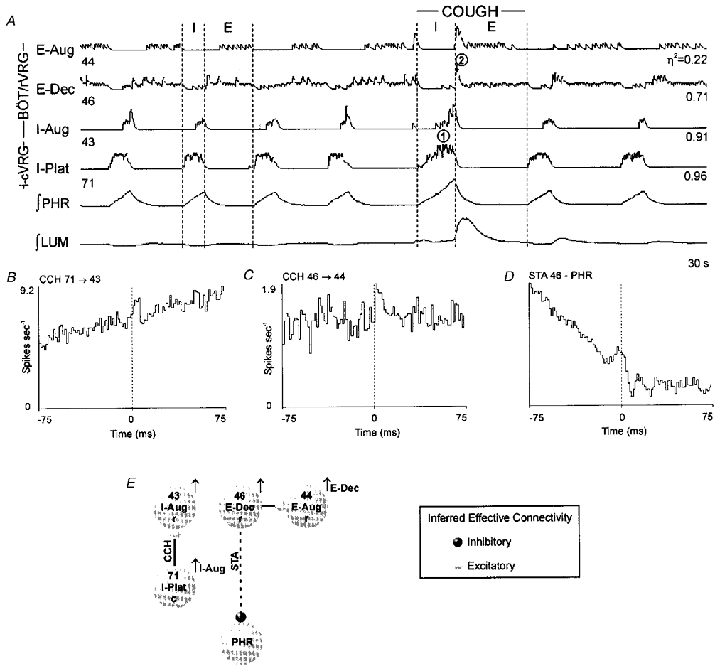
Data are consistent with I-Plat cell 71 exciting I-Aug cell 43, and E-Dec cell 46 exciting E-Aug cell 44 and inhibiting phrenic motoneurones. A, events indicated by the circled numbers in the designated cough period are detailed in the text. B, CCH; offset peak with a lag of 1.5 ms; HW, 3.0 ms; DI, 5.3; S, 0.41; 19082 reference and 4702 target spikes. C, CCH; offset peak with a lag of 1.5 ms; HW, 3.0 ms; DI, 3.2; S, 0.43; 27822 reference and 1938 target spikes. D, STA; number of trigger events, 32500. E, summary circuit of inferred connectivity.
Augmenting expiratory neurone 44 had an increased firing probability following spikes in E-Dec cell 46 (Fig. 8C), whereas an offset trough to the right of origin in the average triggered by spikes in E-Dec neurone 46 indicated a short time scale transient decline in phrenic activity (Fig. 8D). During cough, a rapid increase in E-Dec activity at the inspiratory-expiratory phase transition was associated with increased E-Aug and cessation of phrenic activities (Fig. 8a, label 2).
Other correlations: I-Aug, I-Dec, E-Aug, E-Dec and E-I/E neurones
Data supporting functional links among other neurones with activities that changed during cough are shown in Fig. 9. In Fig. 9a, the integrated traces show that I-Aug activity ceased concurrently with the onset of E-Aug activity during cough (top panel, asterisk). The corresponding correlogram documents a decline in the firing probability of the I-Aug neurone following spikes in the E-Aug cell.
Figure 9. Responses and short-time scale correlations between other sets of neurones.
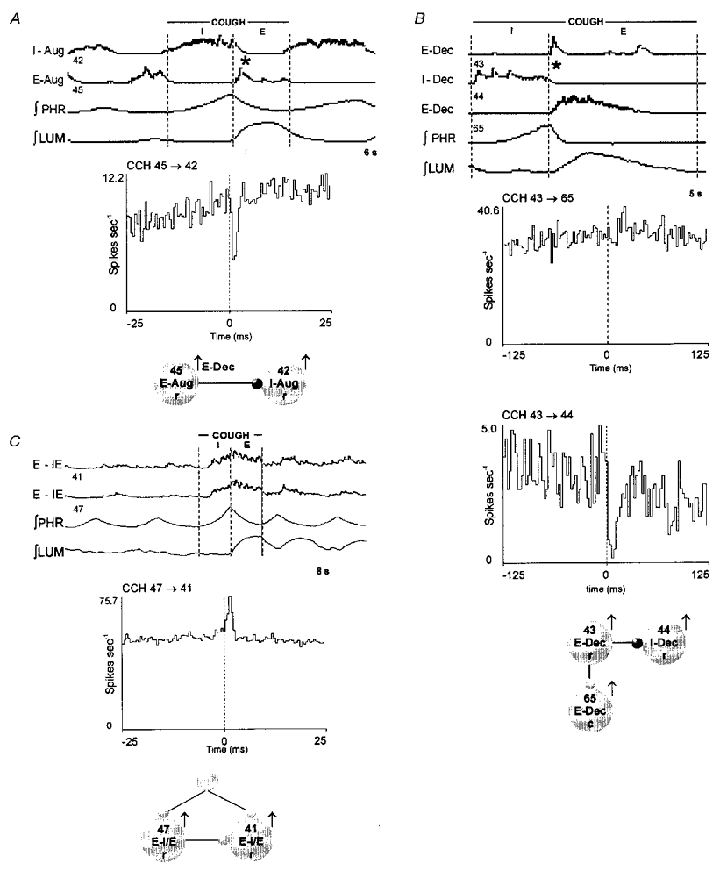
Results suggest inhibition of I-Aug cell 42 by E-Aug cell 45 (A), inhibition of I-Dec cell 44 and excitation of E-Dec cell 65 by E-Dec cell 43 (B), and excitation of E-I/E cell 41 by E-I/E cell 47 (C). Events indicated by the asterisks in the designated cough phase are detailed in the text. A, CCH: offset trough with a lag of 1.0 ms; HW, 0.75 ms; DI, 6.7; S, 0.57; 25800 reference and 36840 target spikes. η2: neurone 42, 0.93; neurone 45, 0.87. B, upper CCH: offset peak with a lag of 20.0 ms; HW, 5.0 ms; DI, 4.5; S, 0.33; 2423 reference and 20791 target spikes; lower CCH: offset trough with a lag of 5.5 ms; HW, 5.5 ms; DI, 3.3; S, 0.70; 2423 reference and 10496 target spikes. η2: neurone: 43, 0.28; neurone 44, 0.89; neurone 65, 0.84. C, CCH: offset peak with a lag of 0.5 ms and a central peak; HW, 2.0 ms; DI, 18.0; S, 0.45; 62204 reference and 64000 target spikes. η2: neurone 41, 0.44; neurone 47, 0.51.
Two correlated pairs were detected among the neurones represented in Fig. 9B. During cough the brief discharge of E-Dec neurone 43 was associated with the onset of activity in E-Dec neurones 65 and 67 and cessation of the discharge of I-Dec neurone 44 (Fig. 9b, top panel, asterisk). Following spikes in BÖT/rVRG E-Dec neurone 43, there was an increased probability of firing of i-cVRG E-Dec neurone 65 and a decreased probability of discharge in BÖT/rVRG I-Dec neurone 44 (histograms in Fig. 9b).
The top panel in Fig. 9C documents that discharge patterns of two expiratory neurones with inspiratory-expiratory phase spanning activity were similar during control cycles. The firing rates of both cells increased during the inspiratory and expiratory phases of cough. The corresponding cross-correlogram had an offset peak superimposed on a broad central peak.
One I/E phase spanning cell with an erratic discharge pattern during control exhibited increased activity near the inspiratory-expiratory phase transition during cough. Cross-correlation and spike-triggered average results (not shown) indicated that spikes in the I/E neurone were followed by an increased firing probability in an I-Plat neurone and transient declines in the activities of both an I-Aug neurone and phrenic nerve activity.
DISCUSSION
The concurrent responses and short time scale correlations reported here support parallel and serial network interactions proposed in our model for the generation of the cough motor pattern in the respiratory pump muscles (Shannon et al. 1998). The results also confirm previous findings from cross-correlation analysis and support hypotheses detailed in current models of the generation of the eupnoeic pattern (Ogilvie et al. 1992; Balis et al. 1994; Feldman & Smith, 1995; Rybak et al. 1997).
Cross-correlation and spike-triggered averaging methods measure firing rate changes due to direct and indirect or parallel paths. Advantages and limitations of these methods have been considered elsewhere (Cohen et al. 1974; Davies et al. 1985; Aertsen & Gerstein, 1985; Lindsey et al. 1994). The connections considered in the following paragraphs represent simple interpretations of the correlograms and spike-triggered averages. The ‘mosaic’ of network interactions inferred from the detected correlational sub-assemblies represents an advance over earlier models of the ventrolateral medullary respiratory network. The results from adjustable electrode array technology enhance the placement of neurones in functional contexts and eliminate model assumptions that are based solely on response properties of single neurones or single pair correlations.
Functional connectivity among I-Aug neurones and phrenic motoneurones
All I-Aug neurones showed a pattern change during cough similar to the phrenic nerve pattern. The most frequently detected correlations were indicative of functional connectivity among medullary inspiratory neurones and between inspiratory neurones and phrenic motoneurones (Group A; Fig. 3, summary circuit). Central peaks in cross-correlograms of inspiratory neurone pairs and in inspiratory neurone triggered averages of phrenic motoneurone activity suggested actions of widely distributed, shared inputs. Connectivity inferred from offset peaks in the cross-correlograms included excitatory actions of rVRG neurones on i-cVRG I-Aug neurones (including bulbospinal/putative premotor) and interactions among i-cVRG I-Aug neurones. Short latency, small- and medium-width offset peaks in the spike-triggered averages of phrenic nerve activity also identified medullary inspiratory neurones with putative roles in the control of phrenic motor discharge during control periods and cough.
Collectively, these results support the hypothesized connections shown in the cough model for propriobulbar and premotor I-Aug neurones and their involvement in shaping phrenic motoneurone activity during cough (see connections 1, 2 and 3 in Fig. 10). These proposed relationships are also consistent with previous reports (for reviews see Ezure, 1990; Balis et al. 1994; Duffin et al. 1995; see also references Feldman & Speck, 1983; Davies et al. 1985; Segers et al. 1987).
Figure 10. Cough network model.
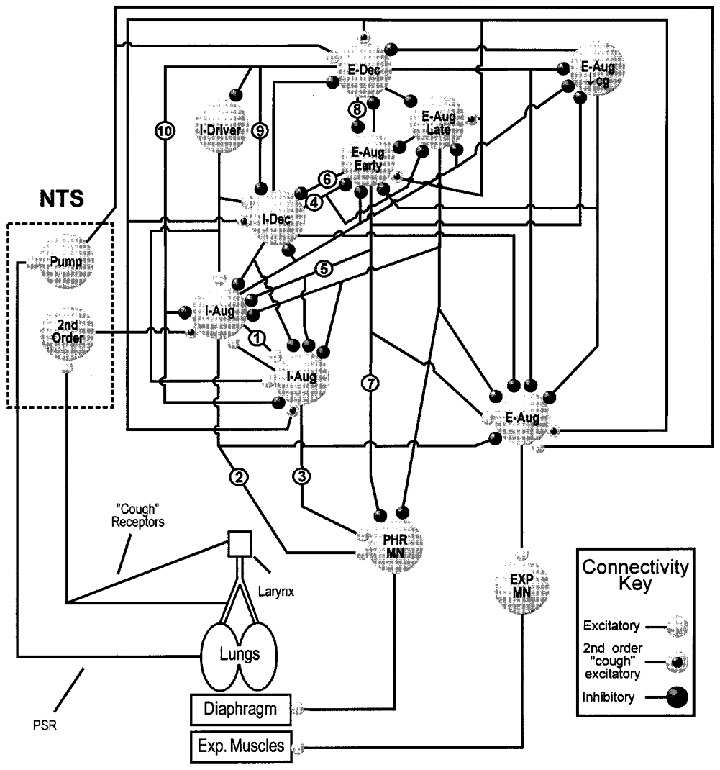
Scheme of ventrolateral medullary respiratory neuronal network connections and inputs from nucleus tractus solitarius (NTS) cough receptor second-order neurones and pulmonary stretch receptor (PSR) PUMP cells. EXP MN, spinal expiratory motoneurone. PHR MN, phrenic motoneurone. E-Aug Early and E-Aug Late, neurones that begin discharging prior to and during expiratory phase 2, respectively. E-Aug (↓cg), neurone that decreased firing rate during cough. I-Driver, inspiratory neurone also active before the expiratory-inspiratory phase transition (I-E/I) and with a relatively constant discharge rate throughout the inspiratory phase; definition specifically limited to BÖT/rVRG neurones with previously identified excitatory functional links to other inspiratory neurones (Balis et al. 1994). Other abbreviations have been described in detail in the text. For detailed description of the model see Shannon et al. (1998).
Actions of I-Dec neurones
Inhibitory actions of I-Dec neurones on E-Aug and I-Other neurones were inferred from offset troughs in correlograms (Group B; Fig. 5F). The discharge patterns of the neurones were consistent with these putative actions. During both eupnoea and cough, the onset of the I-Dec cell activity would contribute to the termination and suppression of the E-Aug cell discharge. With the increase in I-Dec cell activity during cough, there was concurrently almost a complete absence of the I-Other cell activity. The role of such I-Other cells remains unclear. The inferred inhibition of an E-Aug by an I-Dec neurone is congruous with previous reports (Richter et al. 1979; Segers et al. 1987; Ezure, 1990; Bianchi et al. 1995) and supports the inclusion of such a connection in the cough model (Fig. 10, connection 4).
The offset peaks in averages of phrenic activity triggered by I-Dec neurone spikes suggested direct excitatory influences or the effects of presynaptic synchrony. For example, the offset peak and bilateral troughs shown in Fig. 7H could reflect the (unobserved) shared influence of I-Driver neurones on both I-Aug and I-Dec neurones. This possibility is implicit in our model; the I-Dec neurones could contribute to the bilateral troughs through inhibition of I-Aug neurones that directly excite the phrenic motoneurones (Fig. 7J).
Actions of E-Aug neurones
Inhibitory actions of BÖT/rVRG E-Aug neurones on I-Aug and I-Dec neurones and phrenic motoneurones were inferred from offset troughs in cross-correlograms and spike-triggered averages. The correlogram feature in Fig. 9a suggests functional inhibition of the I-Aug neurone by the E-Aug cell. The patterns of discharge during control and cough were consistent with this interpretation: I-Aug activity ceased concurrently with the onset of E-Aug activity.
Inhibitory actions of an E-Aug neurone on an I-Dec neurone and phrenic motoneurones were also inferred from offset troughs in cross-correlograms and spike-triggered averages, respectively (Fig. 5F). Observed neuronal and phrenic discharge patterns supported these inferences; I-Dec and phrenic were silent when E-Aug was active. The E-Aug/I-Dec correlogram also included a central peak indicative of a shared input to the cells; I-Dec neurones with inhibitory influences on both E-Aug and I-Dec neurones represent one possible shared influence (see Fig. 10). Collectively, these observations are consistent with other evidence (Merrill & Fedorko, 1984; Lindsey et al. 1987; Fedorko et al. 1989; Ezure, 1990; Jiang & Lipski, 1990; Duffin & Douse, 1993) and support hypotheses on actions of E-Aug neurones proposed in the cough model (connections labelled 5, 6, and 7 in Fig. 10).
Actions of E-Dec neurones
Correlation results and neuronal discharge patterns during control intervals and the cough motor pattern suggested widespread actions of propriobulbar E-Dec neurones, including inhibition of I-Aug (bulbospinal), I-Dec, E-Aug and E-Dec neurones, and excitation of E-Dec and E-Aug neurones. Divergent inhibitory actions of an E-Dec neurone on another E-Dec and a bulbospinal I-Aug neurone were inferred from offset troughs in the correlograms from Group C neurones (Fig. 7I). During cough, the increased discharge rate of the reference E-Dec neurone at the inspiratory- expiratory phase transition was associated with both termination of the I-Aug neurone and a ‘delayed’ increase in the firing rate of the other E-Dec neurone during the early expiratory phase.
The inhibitory action of an E-Dec neurone on an E-Aug cell was inferred from the offset trough in a correlogram from Group B (Fig. 5F). Neurone discharge patterns matched this interpretation; during expiration, the firing rate of the E-Aug neurone was lowest when the E-Dec firing rate was highest and vice versa. The central peak in the correlogram suggests that the two neurones were partially synchronized by shared inputs; I-Dec cells constitute a plausible candidate population for this role (see Fig. 10).
Both functional excitation of an E-Dec neurone and inhibition of an I-Dec cell by an E-Dec neurone were suggested by features in two correlograms (Fig. 9b). The activity patterns of the neurones were compatible with simple interpretations of the correlogram features (Fig. 9b, summary circuit). The brief discharge of the reference E-Dec neurone was associated with the onset of activity in the target E-Dec neurone and cessation of activity in the I-Dec neurone.
The suggested functional excitatory connection between the two E-Dec neurones inferred from the offset correlogram peak, could be indirect and reflect the consequences of disinhibition as well as paucisynaptic excitation. Excitatory connections among propriobulbar E-Dec neurones have not been reported previously. The function of the target cells in this study is unknown. Results from spike-triggered averaging of recurrent laryngeal motoneurone activity suggested the target cells were not laryngeal motoneurones. They may be other upper airway, vagal or facial motoneurones (Ezure, 1990; Bianchi et al. 1995).
Inferred connectivity between neurones of Group D (Fig. 8E) included divergent functional excitatory and inhibitory actions of an E-Dec neurone on an E-Aug neurone and phrenic motoneurones, respectively. Neuronal and phrenic responses during cough were consistent with these simple interpretations of the correlogram features and spike-triggered average. There was a rapid increase in E-Dec activity at the inspiratory-expiratory phase transition associated with increased E-Aug and cessation of phrenic activities.
The inferred inhibitory links from E-Dec to E-Aug, I-Dec and I-Aug neurones and the neurone responses during cough support several connections proposed in the cough model (Fig. 10, connections 8, 9 and 10). The results and inferences also confirm and extend previous work (Lindsey et al. 1987, 1989; Ezure, 1990).
Functional connectivity of other respiratory modulated neurones
Correlations among infrequently observed neurones suggested several additional possible functional relationships. These inferences included: (a) excitation of BÖT/rVRG I-Aug by i-cVRG I-Plat neurones (Fig. 8E); (b) excitation of BÖT/rVRG I-Plat neurones and concurrent inhibition of BÖT/rVRG I-Aug and phrenic motoneurones by i-cVRG inspiratory-expiratory phase spanning neurones (not shown), and (c) excitatory interactions between BÖT/rVRG E-I/E neurones (Fig. 9C). Additional data are needed before putative functions can be assigned to these inferred relationships.
Summary of connectivity results and specific model hypotheses on the production of cough
The ten numbered functional connections in the graphical summary of the cough model shown in Fig. 10 were supported by the results of this study. Several additional associations inferred from the results were not included in this model because of insufficient correlational data and corroborative evidence in the literature needed to place them in functional contexts. These relationships included: (a) I-Dec neurone inhibition of I-Other neurones and phrenic motoneurones, (b) E-Dec excitation of E-Dec and E-Aug neurones, and (c) E-Dec inhibition of other E-Dec neurones and phrenic motoneurones. The reduction in phrenic motoneurone discharge following spikes in E-Dec neurones may reflect disfacilitation following inhibition of bulbospinal I-Aug neurones by the E-Dec activity.
The results of this study support many of the detailed hypotheses proposed in the network model for generation of the cough motor pattern proposed by Shannon et al. (1998). The specific actions of neurones supported by data from the present study are in italics.
Inspiratory phase of cough
Cough afferents excite second order neurones in the nucleus tractus solitarius (NTS) which, in turn, excite (directly or indirectly) propriobulbar I-Aug and I-Dec and premotor bulbospinal inspiratory (I-Aug) neurones. Bulbospinal neurones are excited by propriobulbar I-Aug and inhibited by I-Dec neurones. Phrenic and inspiratory intercostal motoneurones receive excitatory drive from bulbospinal neurones located in the rostral and intermediate-caudal VRG. The collective action leads to an increased ramp and duration of inspiratory motor activity. Expiratory neurones are suppressed by the inhibitory actions of propriobulbar I-Dec and I-Aug neurones. The duration of the inspiratory phase is determined in part by I-Driver neurones. The inspiratory phase is terminated by the inhibitory actions of propriobulbar E-Dec and early E-Aug cells. The increased E-Dec and E-Aug neurone activities are due in part to reduced inhibitory actions of I-Aug and I-Dec neurones, and excitation from increased pulmonary stretch receptor (PSR) and ‘cough’ receptor activity.
Compressive phase of cough
A large increase in the firing rate of bulbospinal premotor expiratory neurones (E-Aug) occurs near the end of the inspiratory phase primarily because of excitation by ‘cough’ receptors and PSR. Other factors that promote this expiratory activity include reduced inhibition from propriobulbar I-Dec and I-Aug neurones, the resulting post-inhibitory rebound, and reduced inhibition and increased excitation by different sub-populations of propriobulbar E-Aug neurones.
Expulsive phase of cough
For a short time after the compressive phase, the firing rates of premotor bulbospinal E-Aug neurones, and thus expiratory motoneurones (EXP MN), continue to increase. As the expiratory phase progresses further, discharge rates decrease in a decrementing pattern shaped by decreasing PSR activity and a decline in excitation from propriobulbar early E-Aug neurones, and increasing inhibition from other propriobulbar late E-Aug neurones.
Acknowledgments
This research was supported by grant HL49813 from the National Heart, Lung and Blood Institute. We thank Jan Gilliland, Rebecca McGowan, Kim Ruff and Peter Barnhill for excellent technical support.
References
- Aertsen AMH, Gerstein GL. Evaluation of neuronal connectivity sensitivity of cross-correlation. Brain Research. 1985;340:341–354. doi: 10.1016/0006-8993(85)90931-x. [DOI] [PubMed] [Google Scholar]
- Baekey DM, Morris KF, Li Z, Lindsey BG, Shannon R. Functional connectivity among ventral respiratory group neurons and responses during fictive cough. Society for Neuroscience Abstracts. 1997;23:724. [Google Scholar]
- Baekey DM, Morris KF, Li Z, Lindsey BG, Shannon R. Functional connectivity of ventral respiratory group expiratory neurons (Bötzinger) and responses during fictive cough. Federation of American Societies for Experimental Biology Journal Abstracts. 1998a;12:A497. [Google Scholar]
- Baekey DM, Morris KF, Li Z, Lindsey BG, Shannon R. Functional connectivity and responses during fictive cough of inspiratory neurons in the rostral ventrolateral medullary respiratory network. Society for Neuroscience Abstracts. 1998b;24:875. [Google Scholar]
- Balis UJ, Morris KF, Koleski J, Lindsey BG. Simulation of ventrolateral medullary neural network for respiratory rhythmogenesis inferred from spike train cross-correlation. Biological Cybernetics. 1994;70:311–327. doi: 10.1007/BF00200329. [DOI] [PubMed] [Google Scholar]
- Bianchi AL, Denavit-Saubie M, Champagnat J. Central control of breathing in mammals: Neuronal circuitry, membrane properties, and neurotransmitters. Physiological Reviews. 1995;75:1–45. doi: 10.1152/physrev.1995.75.1.1. [DOI] [PubMed] [Google Scholar]
- Bianchi AL, Grelot L, Iscoe S, Remmers JE. Electrophysiological properties of rostral medullary respiratory neurones in the cat: An intracellular study. The Journal of Physiology. 1988;407:293–310. doi: 10.1113/jphysiol.1988.sp017416. [DOI] [PMC free article] [PubMed] [Google Scholar]
- Bolser DC. Fictive cough in the cat. Journal of Applied Physiology. 1991;71:2325–2331. doi: 10.1152/jappl.1991.71.6.2325. [DOI] [PubMed] [Google Scholar]
- Bongianni F, Mutolo D, Fontana GA, Pantaleo T. Discharge patterns of Bötzinger complex neurons during cough in the cat. American Journal of Physiology. 1998;274:R1015–1024. doi: 10.1152/ajpregu.1998.274.4.R1015. [DOI] [PubMed] [Google Scholar]
- Botteron GW, Cheney PD. Corticomotoneronal postspike effects in averages of unrectified EMG activity. Journal of Neurophysiology. 1989;52:1127–1139. doi: 10.1152/jn.1989.62.5.1127. [DOI] [PubMed] [Google Scholar]
- Christakos CN, Cohen MI, Sica AL, Huang W, See WR, Barnhardt R. Analysis of recurrent laryngeal inspiratory discharges in relation to fast rhythms. Journal of Neurophysiology. 1994;72:1304–1316. doi: 10.1152/jn.1994.72.3.1304. [DOI] [PubMed] [Google Scholar]
- Cohen MI, Piercey MF, Gootman PM, Wolotsky P. Synaptic connections between medullary inspiratory neurons and phrenic motoneurons as revealed by cross-correlation. Brain Research. 1974;81:319–324. doi: 10.1016/0006-8993(74)90946-9. [DOI] [PubMed] [Google Scholar]
- Davies J G McF, Kirkwood PA, Sears TA. The detection of monosynaptic connexions from inspiratory bulbospinal neurones to inspiratory motoneurones in the cat. The Journal of Physiology. 1985;368:33–62. doi: 10.1113/jphysiol.1985.sp015845. [DOI] [PMC free article] [PubMed] [Google Scholar]
- Dawid-Milner MS, Lara JP, Milan A, Gonzalez-Baron S. Activity of inspiratory neurones of the ambiguus complex during cough in the spontaneously breathing decerebrate cat. Experimental Physiology. 1993;78:835–838. doi: 10.1113/expphysiol.1993.sp003730. [DOI] [PubMed] [Google Scholar]
- Duffin J, Douse MA. Botzinger expiratory neurons inhibit propriobulbar decrementing inspiratory neurons. NeuroReport. 1993;4:1215–1218. doi: 10.1097/00001756-199309000-00001. [DOI] [PubMed] [Google Scholar]
- Duffin J, Ezure K, Lipski J. Breathing rhythm generation: Focus on the rostral ventrolateral medulla. News In Physiological Sciences. 1995;10:133–140. [Google Scholar]
- Engelhorn R, Weller E. Zentrale representation hustenwirksamer afferenzen in der medulla oblongata der katze. Pflügers Archiv. 1965;284:224–239. [PubMed] [Google Scholar]
- Ezure K. Synaptic connections between medullary respiratory neurons and considerations on the genesis of respiratory rhythm. Progressive Neurobiology. 1990;35:429–450. doi: 10.1016/0301-0082(90)90030-k. [DOI] [PubMed] [Google Scholar]
- Fedorko LM, Duffin J, England S. Inhibition of inspiratory neurons of the nucleus retroambigualis by expiratory neurons of the Botzinger complex in the cat. Experimental Neurology. 1989;106:74–77. doi: 10.1016/0014-4886(89)90146-5. [DOI] [PubMed] [Google Scholar]
- Feldman JL, Smith JC. Neural control of respiratory pattern in mammals: an overview. In: Dekker M, editor. Regulation of Breathing, Lung Biology in Health and Disease. New York, NY: 1995. pp. 39–69. [Google Scholar]
- Feldman JL, Speck DF. Interactions among inspiratory neurons in dorsal and ventral respiratory groups in cat medulla. Journal of Neurophysiology. 1983;49:472–490. doi: 10.1152/jn.1983.49.2.472. [DOI] [PubMed] [Google Scholar]
- Gestreau C, Milano S, Bianchi AL, Grelot L. Activity of dorsal respiratory group inspiratory neurons during laryngeal-induced fictive coughing and swallowing in decerebrate cats. Experimental Brain Research. 1996;108:247–256. doi: 10.1007/BF00228098. [DOI] [PubMed] [Google Scholar]
- Jakus J, Tomori Z, Stransky A, Boselova L. Bulbar respiratory activity during defensive airways reflexes in cats. Acta Physiologica Hungarica. 1987;70:245–254. [PubMed] [Google Scholar]
- Jiang C, Lipski J. Extensive monosynaptic inhibition of ventral respiratory group neurons by augmenting neurons in the Botzinger complex in the cat. Experimental Brain Research. 1990;81:639–648. doi: 10.1007/BF02423514. [DOI] [PubMed] [Google Scholar]
- Kirsten EB, St John WM. A feline decerebration technique with low mortality and long-term homeostasis. Journal of Pharmacological Methods. 1978;1:263–268. [Google Scholar]
- Korpas J, Tomori Z. Cough and other respiratory reflexes. Progress in Respiration Research. 1979;12:15–179. [Google Scholar]
- Lindsey BG, Hernandez YM, Morris KF, Shannon R, Gerstein GL. Dynamic reconfiguration of brainstem neural assemblies: Respiratory phase-dependent synchrony vs. modulation of firing rates. Journal of Neurophysiology. 1992;67:923–930. doi: 10.1152/jn.1992.67.4.923. [DOI] [PubMed] [Google Scholar]
- Lindsey BG, Segers LS, Morris KF, Hernandez YM, Saporta S, Shannon R. Distributed actions and dynamic associations in respiratory-related neuronal assemblies of the ventrolateral medulla and brain stem midline: Evidence from spike train analysis. Journal of Neurophysiology. 1994;72:1830–1851. doi: 10.1152/jn.1994.72.4.1830. [DOI] [PubMed] [Google Scholar]
- Lindsey BG, Segers LS, Shannon R. Functional associations among simultaneously monitored lateral medullary respiratory neurons in the cat. II. Evidence for inhibitory actions of expiratory neurons. Journal of Neurophysiology. 1987;57:1101–1117. doi: 10.1152/jn.1987.57.4.1101. [DOI] [PubMed] [Google Scholar]
- Lindsey BG, Segers LS, Shannon R. Discharge pattern of augmenting expiratory neurons in rostral lateral medulla of cat: Regulation by concurrent network processes. Journal of Neurophysiology. 1989;61:1185–1196. doi: 10.1152/jn.1989.61.6.1185. [DOI] [PubMed] [Google Scholar]
- Maier MA, Perlmutter SI, Fetz EE. Response patterns and force relations of monkey spinal interneurons during active wrist movement. Journal of Neurophysiology. 1998;80:2495–2513. doi: 10.1152/jn.1998.80.5.2495. [DOI] [PubMed] [Google Scholar]
- Merrill EG, Fedorko LM. Monosynaptic inhibition of phrenic motoneurons: a long descending projection from Botzinger neurones. Journal of Neuroscience. 1984;4:2350–2353. doi: 10.1523/JNEUROSCI.04-09-02350.1984. [DOI] [PMC free article] [PubMed] [Google Scholar]
- Moore GP, Secundo JP, Perkel DH, Levitan H. Statistical signs of synaptic interaction in neurons. Biophysical Journal. 1970;10:876–900. doi: 10.1016/S0006-3495(70)86341-X. [DOI] [PMC free article] [PubMed] [Google Scholar]
- Morris KF, Arata A, Shannon R, Lindsey BG. Inspiratory drive and phase duration during carotid chemoreceptor stimulation: Medullary neurone correlations. The Journal of Physiology. 1996;491:241–259. doi: 10.1113/jphysiol.1996.sp021212. [DOI] [PMC free article] [PubMed] [Google Scholar]
- Ogilvie MD, Gottschalk A, Anders K, Richter DW, Pack AI. A network model of respiratory rhythmogenesis. American Journal of Physiology. 1992;263:R962–975. doi: 10.1152/ajpregu.1992.263.4.R962. [DOI] [PubMed] [Google Scholar]
- Oku Y, Tanaka I, Ezure K. Activity of bulbar respiratory neurons during fictive coughing and swallowing in the decerebrate cat. The Journal of Physiology. 1994;480:309–324. doi: 10.1113/jphysiol.1994.sp020361. [DOI] [PMC free article] [PubMed] [Google Scholar]
- Orem J, Dick T. Consistency and signal strength of respiratory neuron activity. Journal of Neurophysiology. 1983;50:1098–1107. doi: 10.1152/jn.1983.50.5.1098. [DOI] [PubMed] [Google Scholar]
- Perkel DH, Gerstein GL, Moore GP. Neuronal spike trains and stochastic point processes. Biophysical Journal. 1967;7:419–440. doi: 10.1016/S0006-3495(67)86597-4. [DOI] [PMC free article] [PubMed] [Google Scholar]
- Perlmutter SI, Maier MA, Fetz EE. Activity of spinal interneurons and their effects on forearm muscles during voluntary wrist movements in the monkey. Journal of Neurophysiology. 1998;80:2475–2494. doi: 10.1152/jn.1998.80.5.2475. [DOI] [PubMed] [Google Scholar]
- Richter DW, Heyde F, Gabriel M. Intracellular recordings from different types of medullary respiratory neurons of the cat. Journal of Neurophysiology. 1975;38:1162–1171. doi: 10.1152/jn.1975.38.5.1162. [DOI] [PubMed] [Google Scholar]
- Rybak IA, Paton JFR, Schwaber JS. Modeling neural mechanisms for genesis of respiratory rhythm and pattern. II. Network models of the central respiratory pattern generator. Journal of Neurophysiology. 1997;77:2007–2026. doi: 10.1152/jn.1997.77.4.2007. [DOI] [PubMed] [Google Scholar]
- Sant'Ambrogio G. Pathophysiology of the Gut and Airways. Studies in Physiology. APS, Chapel Hill, NC, USA: Portland Press; 1993. Coughing: an airway defensive reflex; pp. 89–96. [Google Scholar]
- Schwarzacher SW, Smith JC, Richter DW. Pre-Botzinger complex in the cat. Journal of Neurophysiology. 1995;73:1452–1461. doi: 10.1152/jn.1995.73.4.1452. [DOI] [PubMed] [Google Scholar]
- Segers LS, Shannon R, Saporta S, Lindsey BG. Functional associations among simultaneously monitored lateral medullary respiratory neurons in the cat. I. Evidence for excitatory and inhibitory actions of inspiratory neurons. Journal of Neurophysiology. 1987;57:1078–1100. doi: 10.1152/jn.1987.57.4.1078. [DOI] [PubMed] [Google Scholar]
- Shannon R, Baekey DM, Morris KF, Lindsey BG. Ventrolateral medullary respiratory network and a model of cough motor pattern generation. Journal of Applied Physiology. 1998;84:2020–2035. doi: 10.1152/jappl.1998.84.6.2020. [DOI] [PubMed] [Google Scholar]
- Widdicombe JG. Reflexes from the upper respiratory tract. In: Cherniack NS, Widdicombe JG, editors. Handbook of Physiology, section 3, The Respiratory System, Control of Breathing. II. Bethesda, MD, USA: American Physiological Society; 1986. pp. 363–394. part 1, chap. 11. [Google Scholar]