

Abstract
The intracellular calcium concentration ([Ca2+]i) near the plasma membrane was measured in mouse pancreatic islet cells using confocal spot detection methods.
Whereas small cytosolic Ca2+ gradients were observed with 3 mM glucose, a steeper sustained gradient restricted to domains beneath the plasma membrane (space constant, 0.67 μm) appeared with 16.7 mM glucose.
When the membrane potential was clamped with increasing K+ concentrations (5, 20 and 40 mM), no [Ca2+]i gradients were observed in any case.
Increasing glucose concentration (0, 5 and 16.7 mM) in the presence of 100 μM diazoxide, a K+ channel opener, plus 40 mM K+ induced steeper [Ca2+]i gradients, confirming the role of membrane potential-independent effects of glucose.
Prevention of Ca2+ store refilling with 30 μM cyclopiazonic acid (CPA) or blockade of uniporter-mediated Ca2+ influx into the mitochondria with 1 μM carbonyl cyanide m-chlorophenyl hydrazone (CCCP) or 1 μM Ru-360 significantly reduced the steepness of the 16.7 mM glucose-induced [Ca2+]i gradients.
Measured values of [Ca2+]i reached 6.74 ± 0.67 μM at a distance of 0.5 μm from the plasma membrane and decayed to 0.27 ± 0.03 μM at a distance of 2 μm. Mathematically processed values at 0.25 and 0 μm gave a higher [Ca2+]i, reaching 8.18 ± 0.86 and 10.05 ± 0.98 μM, respectively.
The results presented indicate that glucose metabolism generates [Ca2+]i microgradients, which reach values of around 10 μM, and whose regulation requires the involvement of both mitochondrial Ca2+ uptake and endoplasmic reticulum Ca2+ stores.
Many mechanisms of exocytosis in excitable secretory cells are located at the cell membrane and are regulated by the [Ca2+]i just beneath the plasma membrane. The observation that exocytosis is triggered more effectively by agents that stimulate Ca2+ influx than by those that mobilize intracellular Ca2+ led to the suggestion that spatially localized [Ca2+] increases might be responsible for triggering exocytosis (Augustine & Neher, 1992). Models of Ca2+ entry, binding and diffusion (Sala & Hernandez-Cruz, 1990) have predicted that the opening of Ca2+ channels causes the formation of Ca2+ gradients (Ca2+ microdomains) reaching a concentration of tens or hundreds of micromolar just beneath the plasma membrane. This has been confirmed by digital imaging using a ‘no neighbours’ deblurring filter in chromaffin cells (Monck et al. 1994). As supported by several pieces of evidence, in order to generate these Ca2+ microdomains without a high energy cost, the Ca2+ homeostasis within cells needs to be highly co-ordinated and strongly related to the cellular energetic economy (Petersen et al. 1994; Berridge, 1998).
In pancreatic β-cells the main physiological secretagogues are metabolized by the cell, causing an increase in the ATP/ADP ratio and the diadenosine polyphosphate concentration (Ripoll et al. 1996; Martín et al. 1998), which leads to the closure of ATP-sensitive K+ (KATP) channels and depolarization of the plasma membrane potential (Ashcroft & Rorsman, 1989). This in turn leads to Ca2+ influx through voltage-gated Ca2+ channels and a rise in cytosolic [Ca2+] (Dunne & Petersen, 1991; Wollheim et al. 1996). Recent studies using a combination of techniques have demonstrated that, as predicted by the models, the insulin-containing secretory granules and the voltage-dependent Ca2+ channels co-localize within the β-cell (Bokvist et al. 1995). In addition, stimulatory glucose concentrations induced steep spatial gradients of [Ca2+]i in the vicinity of the plasma membrane (Martín et al. 1997). The complex interplay between Ca2+ influx and the Ca2+ release and uptake mechanisms activated by nutrient secretagogues suggests that physiological stimulators may influence the Ca2+ microdomains through additional regulatory systems.
Although radial gradients in [Ca2+]i have been estimated in pancreatic β-cells using digital imaging techniques (Theler et al. 1992; Bokvist et al. 1995; Martín et al. 1997), a direct measurement of submembrane [Ca2+]i is still lacking. In addition, these gradients are much smaller in magnitude than predicted for secretory cells (Klingauf & Neher, 1997). This suggests that although large [Ca2+]i changes immediately beneath the cell membrane do occur, they are in many cases obscured. This may be attributed, at least in part, to limitations in currently available imaging technology.
One strategy for selectively monitoring near-membrane [Ca2+] changes is to use a probe that only indicates [Ca2+] directly beneath the membrane by virtue of its localized distribution (Etter et al. 1994; Blatter & Niggli, 1998). Alternatively, confocal spot detection methods (Escobar et al. 1994; Quesada et al. 1998) would also be a powerful tool for selectively monitoring the near-membrane [Ca2+]. In this study, the successful use of a PIN photodiode connected to a high-gain patch-clamp amplifier, together with the optical configuration of the system made the detection of sustained submembrane Ca2+ gradients in pancreatic islet cells possible, with an excellent signal-to-noise ratio. Moreover, we were able to use this new method to measure and characterize the glucose-induced [Ca2+]i gradients within the first 2 μm of the plasma membrane. Finally, we provide evidence indicating that glucose regulates the [Ca2+]i gradients through mitochondrial Ca2+ uptake and the involvement of endoplasmic reticulum (ER) Ca2+ stores.
METHODS
Islet cell isolation and perifusion
Islets from adult (8-10 weeks old) Swiss albino male mice (OF1), killed by cervical dislocation in accordance with national guidelines, were isolated as previously described (Lenmark, 1974). Briefly, after pancreas digestion with collagenase (collagenase A, Boehringer Mannheim, Mannheim, Germany) in a stationary bath at 37°C, islets were separated by centrifugation and hand picked under a stereomicroscope. Once isolated, islets were dispersed into single cells by enzymatic digestion in the presence of 0.05 % trypsin plus 0.02 % EDTA for 3 min. Cells were plated onto coverslips and cultured overnight in RPMI 1640 supplemented with 10 % fetal calf serum, 100 i.u. ml−1 penicillin, 0.1 mg ml−1 streptomycin and 5.6 mM glucose (Martín et al. 1997).
Loading and perifusion of islet cells
Islet cells were loaded with 2 μM fluo-3 AM (Molecular Probes) by a 60 min incubation at room temperature in the above-mentioned culture medium. Laser-scanning confocal microscopy (Leica TCS-NT System, Germany) was used to confirm the homogeneous distribution of the dye in the cytoplasm of the islet cells. The confocal detector aperture was set at 64.3 μm and a × 40 Pl Fluotar Leica objective was used. After acquiring eight optical slices of 100 μm × 100 μm × 1 μm, a uniform localization of fluo-3 throughout the cytoplasm of the pancreatic islet cells (in the presence of 3 mM glucose) was observed (80 %; Fig. 2A, n = 5). The same uniform localization of fluo-3 throughout the cytoplasm was observed in the presence of 16.7 mM glucose (data not shown; n = 4).
Figure 2. Confocal spot detection of submembrane Ca2+ microgradients.
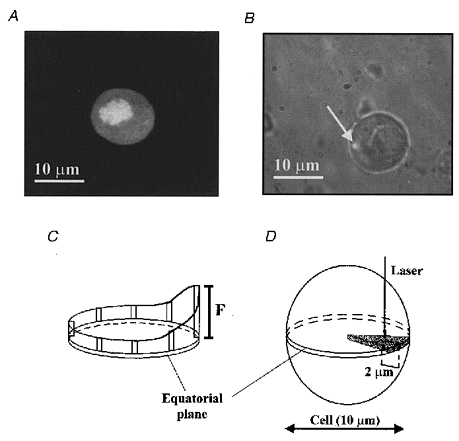
A, confocal fluorescence image of a fluo-3-loaded pancreatic islet cell, in the presence of 3 mM glucose, showing the distribution of the fluo-3 fluorescence. B, phase-contrast image (× 100 lens) of a cultured pancreatic islet cell (Ø= 10 μm) with the fluorescence illumination spot (arrow; 0.6 × 0.6 × 1.1 μm3 fluorescence detection volume) focused near to the plasma membrane. C and D, schematic design of the experimental procedure: (i) selection of the cell equatorial plane; (ii) localization of the area of polarity; and (iii) perifusion of the cells for 5 min with Krebs-Ringer buffer plus the different agents. In the last 30 s of the stimulus the first 2 μm beneath the plasma membrane were explored using seven detection spots (0.5, 0.65, 0.8, 1.0, 1.25, 1.5 and 2.0 μm) at 5 s intervals for each distance.
For all cases, pancreatic islet cells were perifused at a rate of 0.5 ml min−1 with a modified Krebs-Ringer buffer (mM): 119 NaCl, 4.7 KCl, 1.2 MgSO4, 1.2 KH2PO4, 25 NaHCO3 and 2.5 CaCl2, constantly bubbled with a mixture of 95 % O2, 5 % CO2, giving a final pH of 7.4, plus the different agents applied in each experiment. Diazoxide, CPA and CCCP were obtained from Sigma; Ru-360 was from Calbiochem-Novabiochem GmbH (Bad Soden, Germany). All experiments were performed at 37°C.
Confocal spot detection of submembrane Ca2+ microgradients
Cells were placed in a specimen chamber mounted on the stage of an inverted epifluorescence microscope (Nikon-Diaphot, Nikon, Tokyo, Japan) modified for confocal spot detection (Fig. 1a). The cell images were acquired with a cooled CCD camera (MCD-220, Spectra Source. Agoura Hills, CA, USA) using an oil-immersion × 100 Plan Fluor phase objective lens (numerical aperture (NA), 1.3; Nikon). The bright-field images shared the optics pathway with the confocal illumination, so the position of the spot could be followed throughout the experiments. The spot illumination-detection configuration was similar to that described previously (Escobar et al. 1994; Quesada et al. 1998). The illumination source was a multiline argon laser (5 W, Innova-70, Coherent Inc., Santa Clara, CA, USA). A spatial Gaussian filter allowed reduction of the laser beam diameter (Ø = 50 μm) and selection of the Gaussian profile of illumination (Fig. 1b). The resulting beam illuminated a 10 μm pinhole and was then focused into a spot on a cell through the × 100 objective lens (arrow in Fig. 2b). The full-width half-maximal (FWHM) dimension of the illumination spot was 0.6 μm, measured with the CCD camera in the same experimental conditions and analysed with the image analysis software. Changes in fluorescence were recorded by aligning and focusing the illumination spot onto the photosensitive area (Ø= 100 μm) of a photodiode (HR008, UDT, Hawthorne, CA, USA) mounted on a three-axis positioner (Newport, Irvine, CA, USA) with a detected dark current of less than 100 pA. The predicted detection volume was approximately 0.6 × 0.6 × 1.1 μm3. The current output of the photodiode was amplified using an Axopatch 200A amplifier (50 GΩ feedback; Axon Instruments). The output voltages were filtered with an eight-pole Bessel filter (Frequency Devices, Haverhill, MA, USA) at corner frequencies of 2 kHz. Shutters (Uniblitz, Vincent Associates, Rochester, NY, USA) placed in the laser pathway controlled the illumination time (30 ms). The x–y-axis position of the spot was controlled by stepper motorized translation stages (Newport), whilst a piezoelectric device controlled the fine z-axis movement of the objective. The fluorescence signals were always recorded from the equatorial plane of each cell. The signal-to-noise ratio of the system was 20 pA/0.18 pA. A home-made program installed in a Pentium computer controlled data acquisition, movement of stepper motors and illumination exposure time.
Figure 1. Schematic diagram of the experimental set-up.
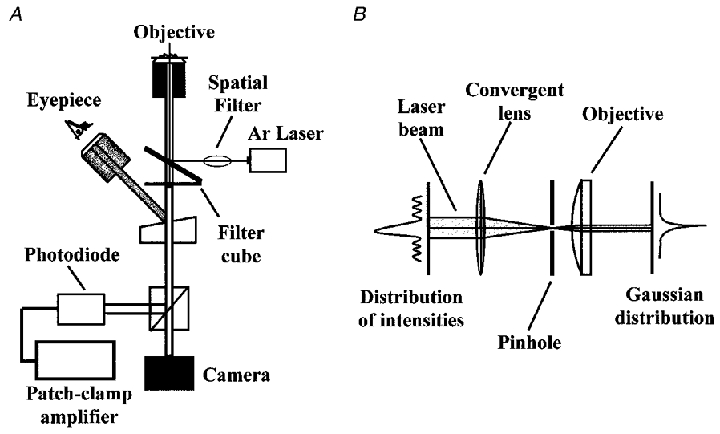
A, basic optical components: an inverted microscope equipped with a standard epifluorescence port, a Peltier cooled CCD camera used to image the cells and the position of the spot, a beam splitter to split bright-field images from emitted fluorescence light, an argon laser which provides the high-intensity monochromatic light used to excite the fluorescence dyes, a spatial filter, a photodiode centred on the spot to record the fluorescence emitted by the cells, and a high-gain patch-clamp amplifier to convert the fluorescence intensity to current. B, schematic design of the Gaussian spatial filter which in combination with the objective focuses the beam into a spot on the preparation.
Ca2+-dependent fluo-3 fluorescence (F) was expressed as F/Fmax in order to normalize data. Fmax (maximal fluorescence) was recorded after each experiment in the modified Krebs-Ringer buffer under conditions of saturating [Ca2+]i and in the absence of Na2+ (mM: 85 LiCl, 40 KCl, 1.2 MgSO4, 1.2 KH2PO4, 25 NaHCO3 and 10 CaCl2, with 10 μM ionomycin). Since fluorescence values were below Fmax, conditions were not saturating for the dye. Fmin (minimum fluorescence) was calculated by lysing the cells with 50 μM digitonin (Sigma) to obtain the background fluorescence (Fbkg). From Fmax and Fbkg, the value of Fmin can be calculated as proposed by Nadal et al. (1996). The data were fitted to the standard calibration equation of Grynkiewicz et al. (1985) and used to calculate [Ca2+]i:
The Kd value of the fluo-3 batch, measured as previously described (Escobar et al. 1997), was 0.69 ± 0.02 μM.
Autofluorescence was < 3 %. Photobleaching was only 5 % after ten consecutive 30 ms illumination pulses at the same point of detection (n = 6).
Experimental procedure
In order to explore the submembrane [Ca2+] gradients, the cell equatorial plane was selected, followed by the positioning of eight detection spots around the cell but immediately beneath the plasma membrane with a separation distance of 1 μm in the presence of the different stimuli (glucose or K+). Then, the area of highest fluorescence delimited by one of the eight spots was selected (Fig. 2C). Finally, cells were perfused for 5 min (or 2 min for KCl experiments; steady-state conditions) with the modified Krebs-Ringer buffer plus the different agents, and the first 2 μm beneath the plasma membrane were explored during the last 30 s of the stimulus at seven detection spots (0.5, 0.65, 0.8, 1.0, 1.25, 1.5 and 2.0 μm) at 5 s intervals for each distance, as shown schematically in Fig. 2D. The small overlapping distance between each two adjacent spots did not interfere with the results obtained as photobleaching was minimized. For plots of the data, each point is the value of the spot fluorescence (Ø = 0.6 μm) and its position was calculated as the distance between the plasma membrane and the centre of the spot. To randomize the measurements, the procedure was also inverted and spot detection experiments were performed starting with the point furthest from the plasma membrane (2 μm) in the presence of 16.7 mM glucose. Data are expressed as means ±s.e.m.
Mathematical estimation of [Ca2+]i close to the plasma membrane
Due to the fact that the limit of the edge of the closest spot (0.5 μm) was only 0.2 μm away from the plasma membrane, closer points to the membrane were unreliable because a part of the spot detection area was out of the cell in the z-axis as a consequence of cell curvature. To obtain the [Ca2+]i at distances smaller than 0.5 μm from the plasma membrane a mathematical approach was used. Since geometric characteristics of the illumination spot and the equatorial plane of the cell are known, the fluorescence detection volume for each distance, which results from the interaction between the cell and the illumination spot, can be calculated using the following function:
where x is d/a, d is the distance from the centre of the illumination spot to the plasma membrane and a is the radius of the illumination spot. Thus, estimated fluorescence values for these distances (0 and 0.25 μm) can be generated with the mathematical approach from the measured fluorescence values of partially out of cell spots whose distance from the plasma membrane can be finely controlled.
RESULTS
Polarity of the Ca2+ signal
In order to avoid the effect of a minimization of the fluorescence signal due to ion diffusion over the distance from the point of Ca2+ entry to the area of recording, Ca2+ gradients were only studied in areas with a noticeable localization of the Ca2+ signal and with the highest fluorescence values. Thus, eight equidistant detection spots were positioned around the cell but immediately beneath the plasma membrane (Fig. 2C) with a separation distance of 1 μm in the presence of the different stimuli (16.7 mM glucose, 3 mM glucose or 40 mM extracellular K+ ()). Polarity was assumed when significant differences (higher than 30 %) in fluorescence values from one position with respect to other positions appeared (Fig. 2C); 86 and 76 % of the cells were polarized with 16.7 mM glucose (n = 29) and 40 mM K+ (n = 21), respectively. In addition, polarized cells (81 %) were also observed with 3 mM glucose (n = 21). Thus, a remarkable spatial distribution of Ca2+ appeared in the majority of cells. Since the equatorial plane was selected to detect Ca2+ gradients, it was possible that some of these gradients could be attenuated because of Ca2+ diffusion to other areas. Thus, to minimize this diffusion process, gradients were only studied in cells showing the highest polarity of the signal and in areas of maximal polarity.
Detection of submembrane Ca2+ gradients modulated by glucose
To study the Ca2+ gradients, the first 2 μm beneath the plasma membrane were explored using several detection spots (0.5, 0.65, 0.8, 1.0, 1.25, 1.5 and 2.0 μm) at 5 s intervals for each distance, as shown schematically in Fig. 2D. As shown in Fig. 3, pancreatic islet cells stimulated with different nutrient and non-nutrient agents showed submembrane Ca2+ gradients with different characteristics. Note that in all cases, the gradients were localized to restricted domains beneath the plasma membrane.
Figure 3. Submembrane Ca2+ gradients modulated by physiological stimuli.
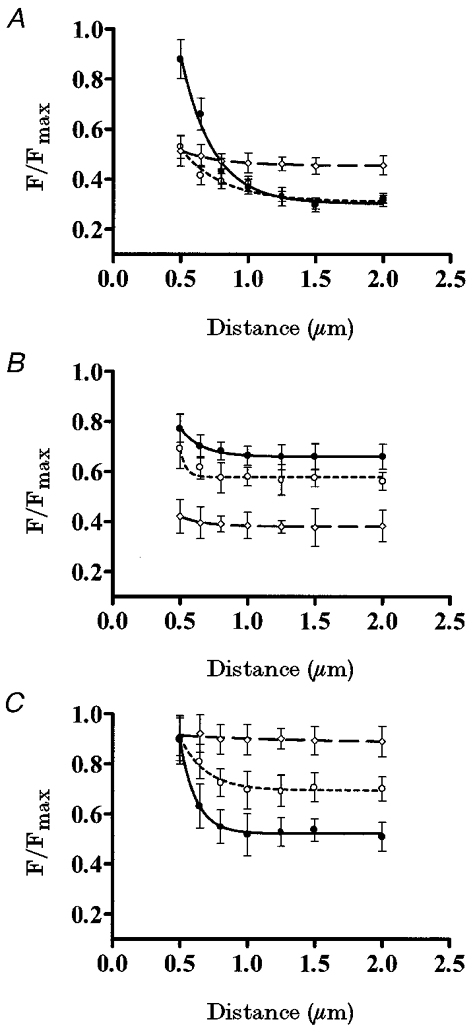
A, pancreatic islet cells were perifused with different glucose concentrations: 16.7 mM (•, continuous line), 3 mM (○, short-dash line) and 0 mM (⋄, long-dash line) (n = 7 cells). B, pancreatic islet cells were perifused in the presence of 3 mM glucose with different concentrations: 40 mM (•, continuous line), 20 mM (○, short-dash line) and 5 mM (⋄, long-dash line) (n = 7 cells). C, pancreatic islet cells were perifused with different glucose concentrations: 16.7 mM (•, continuous line), 5 mM (○, short-dash line) and 0 mM (⋄, long-dash line), in the presence of 40 mM [K+]o and 100 μM diazoxide (n = 7 cells).
Figure 3a shows the effect of different glucose concentrations on the Ca2+ gradients (n = 7). Cells stimulated with 16.7 mM glucose showed a steeper Ca2+ gradient than when stimulated with 3 mM glucose. The same Ca2+ gradient (n = 4) was observed when starting the measurements at the point furthest from the plasma membrane (data not shown). Since this submembrane Ca2+ distribution was glucose induced, such Ca2+ gradients should be due to the interplay between the extracellular Ca2+ source and the internal Ca2+ sinks. The higher [Ca2+]i reached close to the plasma membrane in the presence of 16.7 mM glucose (compared with 3 mM glucose) is due to a higher Ca2+ influx through voltage-dependent Ca2+ channels, as has previously been described (Ashcroft & Rorsman, 1989). The Ca2+ activity profile at distinct glucose concentrations suggests a role for glucose in creating these steep gradients as much in the extracellular Ca2+ source as in the internal Ca2+ sinks, since when removed, the submembrane Ca2+ gradient disappeared and a homogeneous spatial Ca2+ distribution was observed throughout the cytosol. Furthermore, in the absence of glucose, a higher [Ca2+]i was observed in the plateau, when compared with that in the presence of glucose.
When the membrane potential was clamped with increasing K+ concentrations (5, 20 and 40 mM) in the presence of 3 mM glucose (Fig. 3b), subsequent voltage-dependent effects on Ca2+ patterns were observed. As shown in Fig. 3b, induced an increase in the [Ca2+]i, whilst maintaining the same Ca2+ pattern as observed with 3 mM glucose (Fig. 3a). In all cases, Ca2+ gradients had the same spatial distribution but different amplitudes (n = 7), but no significant gradient was detected in any case.
In order to distinguish between membrane potential-dependent and -independent effects of glucose in this phenomenon (Fig. 3C), membrane potential was clamped by exposing the pancreatic islet cells (n = 7) to 100 μM diazoxide to avoid the effects of glucose on membrane potential and 40 mM K+ to depolarize the membrane, then different glucose concentrations (0, 5 and 16.7 mM) were applied (Nadal et al. 1994; Miura et al. 1997). Under these conditions, by increasing the glucose concentration it was possible to induce steeper Ca2+ gradients, showing an involvement of glucose in the internal buffering of the Ca2+ influx induced by 40 mM K+. Conversely, lowering the glucose concentration (5 mM) attenuated this effect on the Ca2+ gradient (Fig. 3C). Finally, no submembrane Ca2+ gradient was observed in the absence of glucose.
Sustained response to the stimulation
In order to find out the temporal pattern of these submembrane Ca2+ gradients, the following protocol was designed. A detection spot was positioned at 1 μm under the plasma membrane in the area of maximal polarization of the signal (see Methods) and cells were perifused with 16.7 mM glucose (n = 6). After 5 min stimulation, cells were illuminated at the same spatial point with four consecutive laser pulses (30 ms) with a time separation of 5 s. After 30 s the cell received the same sequence of pulses. This protocol was repeated after 10 min. Other distances from the plasma membrane were also tested (0.5, 1.5 and 2 μm). In all cases the results indicated that once established there was no time-dependent variation of the Ca2+-dependent fluorescence signal for each spot of detection, so sustained Ca2+ gradients could be assumed during stimulation. The same protocol was performed with 3 mM glucose and 40 mM K+ and similar results were observed (n = 5).
Effects of SERCA pump inhibition on submembrane Ca2+ gradients
CPA, the specific inhibitor of the sarcoplasmic reticulum (SR)-ER Ca2+-ATPase (SERCA) pump family (Demaurex et al. 1992), has been used to show the role of intracellular Ca2+ stores in Ca2+ signalling (Nadal et al. 1996). Since the previous Ca2+ output from intracellular stores through leak channels could mask the submembrane Ca2+ gradients, recordings started after 5 min of perifusing cells with CPA. Figure 4a shows the effect of 30 μM CPA on the 16.7 mM glucose-induced Ca2+ gradient (n = 6). CPA caused a significant reduction in the steepness of the Ca2+ gradient by abolishing a cytoplasmic element of the Ca2+ sink system. This experiment proves the involvement of the ATP-dependent SERCA pumps in the origin of the submembrane Ca2+ gradients.
Figure 4. Homeostatic mechanisms involved in Ca2+ gradients.
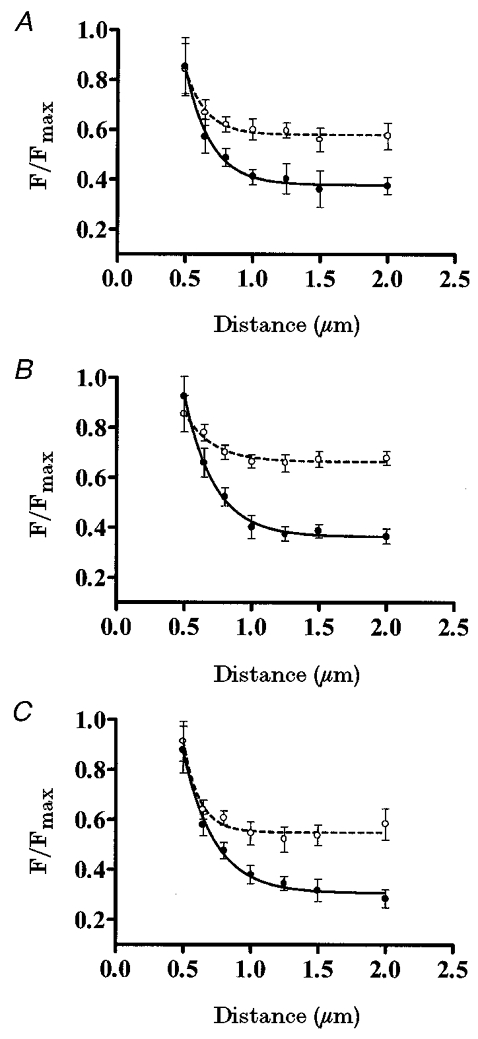
A, pancreatic islet cells were perifused with 16.7 mM glucose (•) and with 16.7 mM glucose plus 30 μM CPA (○) (n = 6 cells). B, pancreatic islet cells were perifused with 16.7 mM glucose (•) and with 16.7 mM glucose plus 1 μM CCCP (○) (n = 5 cells). C, pancreatic islet cells were perifused with 16.7 mM glucose (•) and with 16.7 mM glucose plus 1 μM Ru-360 (○) (n = 6 cells).
Role of mitochondria in submembrane Ca2+ gradients
Since clearance of cytosolic Ca2+ by mitochondria can be perturbed when the mitochondrial membrane potential (Ψm) is altered or the Ca2+ uniporter is blocked (Maechler et al. 1997), CCCP protonophore and the specific inhibitor of mitochondrial Ca2+ uptake Ru-360 (Matlib et al. 1998) were used for this purpose in order to ascertain the involvement of this organelle in the generation of the Ca2+ gradients. In these experiments the participation of the mitochondrial stores in the Ca2+ gradients was tested in the presence of 16.7 mM glucose (n = 6). For experiments involving 1 μM CCCP, recordings started after 5 min of perifusing the cells. Figure 4b shows that when ΔΨm was diminished with 1 μM CCCP, the 16.7 mM glucose-induced Ca2+ gradient was smaller, indicating a putative role for the mitochondrial store as a Ca2+ sink. The same effect was observed when the isolated pancreatic islet cells (Fig. 4C; n = 6) were perifused for 5 min with 1 μM Ru-360.
[Ca2+]i close to the plasma membrane
We were interested in estimating the [Ca2+]i in the first 0.5 μm beneath the plasma membrane in order to find out the [Ca2+]i directly ‘seen’ by secretory granules during glucose stimulation near a channel pore. Due to the fact that reliable direct measurements were beyond our capabilities at these distances (see Methods), a mathematical approach was used. Figure 5 shows the measured values obtained with fluo-3 when cells were perifused with 16.7 mM glucose (•; n = 7) and the calculated values for the two distances of 0 and 0.25 μm (○). Measured values of [Ca2+]i reached 6.74 ± 0.67 μM at a distance of 0.5 μm and decayed to 0.27 ± 0.03 μM at a distance of 2 μm. Mathematically processed [Ca2+]i values obtained with signals from partially out of cell spots were higher, reaching 8.18 ± 0.86 and 10.05 ± 0.98 μM at 0.25 and 0 μm, respectively.
Figure 5. [Ca2+]i close to the plasma membrane.
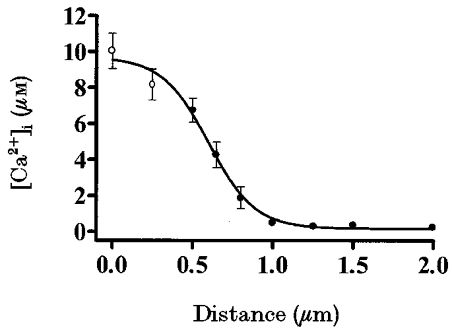
[Ca2+]i in pancreatic islet cells loaded with fluo-3 and stimulated with 16.7 mM glucose (•) (n = 7 cells). The experimental design is shown in Fig. 2D. The calibration equation of Grynkiewicz et al. (1985) was used to calculate [Ca2+]i, assuming a Kd of 0.69 μM for fluo-3. A mathematical estimation of [Ca2+]i within a pancreatic islet cell at distances of 0 and 0.25 μm beneath the plasma membrane is also shown (○).
DISCUSSION
In this paper, we have described the use of a confocal spot technique in pancreatic islet cells (Fig. 1) to detect the existence of sustained polarized submembrane Ca2+ microgradients regulated by nutrient stimulators.
In secretory cells, mechanisms involved in the regulation of exocytosis and Ca2+ permeability are located at the cell membrane and are regulated by the [Ca2+]i just beneath the membrane. In pancreatic β-cells, recent studies (Bokvist et al. 1995; Martín et al. 1997) have demonstrated that the [Ca2+] underneath the plasma membrane is very different from the [Ca2+] in the bulk cytosol.
Nutrient secretagogues, through a membrane depolarization secondary to nutrient metabolism, raise β-cell [Ca2+]i and cause insulin release (Ashcroft & Rorsman, 1989). In contrast to fast synapses in which neurotransmitter release is mostly dependent on an extremely rapid [Ca2+] increase (≤ 100 μs), endocrine cells maintain hormone release for minutes to hours. Thus, regulation of exocytosis by localized (sustained Ca2+ microgradients) rather than global increases in [Ca2+]i is advantageous to the β-cell (Petersen et al. 1994) because the expenditure of metabolic energy to subsequently restore [Ca2+]i to the resting level is minimized. Given the importance of the increase of [Ca2+]i in restricted parts of the cell, it is not surprising to find a polarization of the Ca2+ microgradients in response to glucose. In this regard, polarity of the pancreatic islet cell even with non-stimulatory glucose concentrations confirms recent studies of Bokvist et al. (1995) that show that L-type Ca2+ channels of pancreatic β-cells are clustered in the regions containing the secretory granules, raising the interesting possibility that these regions could correspond to hot-spots of exocytosis. It now seems likely that Ca2+ homeostasis is very important for the presence of maintained Ca2+ microgradients and, as Nadal et al. (1994) suggested, the main mechanism responsible for Ca2+ homeostasis is dependent on metabolic energy directly provided by glucose metabolism. As a result, metabolism of glucose is a prerequisite for the maintenance of the steep spatial Ca2+ microgradients (Fig. 3a). The need for glucose to supply the energy demanded by this process was supported by the observation that in the absence of glucose (Fig. 3a) no submembrane Ca2+ microgradients were induced, whereas a small Ca2+ gradient was obtained with non-stimulatory glucose concentrations (Fig. 3a), indicating the presence of some ATP-dependent Ca2+ homeostatic mechanism with a high affinity for Ca2+ that can be activated with low ATP concentrations. Further evidence of the need for glucose metabolism is that high Ca2+ influx elicited by [K+]o-dependent voltage depolarization did not modify the steepness of the small Ca2+ gradient elicited by non-stimulatory glucose concentrations (Fig. 3b), since the fuel component given by the low glucose concentrations was not enough to counteract the high [K+]-induced Ca2+ influx. Finally, nutrient-induced Ca2+ microgradients reflect the activation of glucose-dependent sequestering mechanisms. This was demonstrated by using diazoxide (Fig. 3C), which opens KATP channels and permits clamping of the membrane potential at stable levels determined by the concentration of extracellular K+ (Nadal et al. 1994; Miura et al. 1997).
The ER and its specialized subcompartments are believed to be an important dynamic Ca2+ storage compartment of the cell. In fact, the overall Ca2+ content of the ER from different cell types has been found to be in the range 0.5-5 mM (Meldolesi & Pozzan, 1998). The effects of the SERCA pump blocker CPA on the glucose-induced Ca2+ microgradient (Fig. 4a) revealed the involvement of this Ca2+ store in modulating these Ca2+ gradients. The mechanisms involved in the function of the ER as a sustained sink need further investigation. However, the cellular architecture in low and high [Ca2+] subcompartments within the ER proposed by Montero et al. (1997), and the dynamic interplay between them, suggests that the ER is heterogeneous in terms of Ca2+ handling and can contribute to the generation of the Ca2+ microgradients observed in pancreatic islet cells. Finally, [Ca2+]i increases in regions further from the plasma membrane should cause an elevation of [Ca2+]i near the location of the exocytotic machinery complex (e.g. the first 200 nm). Thus, an explanation for the finding that while the fluorescence signal increased in the presence of CPA in regions further from the plasma membrane, this signal did not increase accordingly near the membrane, is that given its Kd of 0.69 ± 0.02 μM, fluo-3 near the membrane is in almost saturating conditions, thus further [Ca2+] increases cannot be detected. Other dyes (such as Calcium Green-2) would be able to detect the increase in [Ca2+]i near the plasma membrane, but due to its higher Kd the submicromolar Ca2+ levels present in the gradients would be difficult to see. However, the possibility cannot be excluded that Ca2+ can move from specific regions to other sites via an operational Ca2+ tunnel without any change in [Ca2+]i (Mogami et al. 1997).
Apart from the production of ATP, the major contribution of mitochondria to cell physiology lies in their impact on Ca2+ signalling. In fact, signals from populations of cells expressing mitochondrially targeted aequorin showed that mitochondria sequester Ca2+ from microdomains of locally high [Ca2+]i (Rizzuto et al. 1992). Moreover, other studies have concluded that mitochondria buffer Ca2+ reversibly with a Ca2+-binding ratio of ∼4000 (Babcock et al. 1997; Xu et al. 1997). In this regard, in primary rat islet cells (Maechler et al. 1997) and β-cell line INS-1 cells (Kennedy et al. 1996) increases of glucose concentration in the physiological range caused a graded rise in mitochondrial Ca2+ concentration ([Ca2+]m). Thus, mitochondrial Ca2+ uptake has an important role in the quantitative and spatiotemporal characteristics of [Ca2+]i. A crucial point, which is especially important in pancreatic β-cells, is to differentiate between changes in [Ca2+]i signal due specifically to reduced mitochondrial Ca2+ uptake, and changes due to ATP depletion that may follow a loss of ΔΨm, since depletion of ATP will clearly alter the ability of cells to take up, extrude or sequester a Ca2+ load quite independently of mitochondrial Ca2+ uptake. The latter was shown in the present study by the addition of the ionophore CCCP to reduce ΔΨm and inhibit ATP production. This also disturbs Ca2+ influx via KATP channels and smaller Ca2+ fluorescence values were detected at 0.5 μm from the plasma membrane (Fig. 4b). In addition, the loss of ΔΨm prevents Ca2+ uptake by the mitochondria, resulting in higher fluorescence values at greater distances from the plasma membrane (more than 0.65 μm; Fig. 4b). Finally, blockade of the mitochondrial Ca2+ uniporter greatly inhibits the clearance of Ca2+ from the cytosol in a direct manner, thus reducing the steepness of the Ca2+ microgradient (Fig. 4C). Note that Ru-360 specifically blocks Ca2+ uptake into mitochondria without any effect on ER Ca2+ uptake or release, L-type Ca2+ channel current and cytosolic Ca2+ transients (Matlib et al. 1998). All these data confirm the prediction of Kennedy et al. (1996) that in pancreatic β-cells the mitochondria are, to a significant extent, close to plasma membrane Ca2+ channels, and thus are strategically situated to sense the microdomains of high [Ca2+]i in their proximity and to fuel the exocytotic process. Moreover, some studies point to a tight local coupling of the ER and mitochondria (Duchen, 1999). The functional consequences of this local juxtaposition are: (i) mitochondria take up Ca2+ as it enters the cell and therefore limit the spatial spread of the [Ca2+]i signal, acting as a spatial buffer and modulating [Ca2+]i signalling; (ii) the increase in [Ca2+]m leads to increased activity of the mitochondrial metabolism, thereby facilitating exocytosis of insulin from secretory granules.
A growing body of evidence suggests that high Ca2+ concentrations are needed at exocytotic sites. Indeed, half-maximal rates of exocytosis required about 16 μM Ca2+ underneath the plasma membrane in rat pituitary gonadotrophs (Tse et al. 1997), 30 μM in rat melanotrophs (Thomas et al. 1993) and 50 μM in bovine chromaffin cells (Augustine & Neher, 1992). In addition Bokvist et al. (1995) estimated that [Ca2+]i may well approach 7 μM following a 50 ms depolarization pulse for mouse pancreatic islet cells. Using the confocal spot detection technique together with a mathematical approximation for distances closer than 0.5 μm from the plasma membrane, we have found that, in mouse pancreatic islet cells, [Ca2+]i at the release sites peaks at approximately 10 μM after glucose stimulation. These values are close to those predicted by Klingauf & Neher (1997) after trains of depolarizations in excitable cells.
Our findings demonstrated that in pancreatic islet cells nutrient secretagogues induce Ca2+ microgradients which dissipate within the first micrometre from the membrane, and where [Ca2+]i readily reaches around 10 μM. Moreover, these pancreatic islet cells have a specialized and compartmentalized Ca2+ homeostatic machinery, mainly controlled by the mitochondria, ER and their close proximity to the plasma membrane, and designed to regulate [Ca2+]i at the exocytotic zone.
Acknowledgments
The authors thank E. Pérez and A. Pérez for expert technical assistance. We are also grateful to Dr A. Nadal and Dr F. Sala for helpful comments on the manuscript. The mathematical model was devised by Dr A. Gil and Dr J. Segura. Finally, we are particularly grateful to Dr A. Escobar and Dr J. M. Vergara for their help in the set-up of the spot confocal system. The English was revised by I. Ward. I. Quesada is a recipient of a research studentship from Ministerio de Educación y Cultura. This work was supported in part by grants GV99-139-1-04 (from Generalitat Valenciana), IFD97-1065-CO3-02 (from European Union-CICYT), PM98-0105 and PM99-0142 (from Dirección General de Investigación Científica y Técnica) and 99–1210 (from Fundació Marató TV3).
References
- Ashcroft FM, Rorsman P. Electrophysiology of the pancreatic β-cell. Progress in Biophysics and Molecular Biology. 1989;54:87–143. doi: 10.1016/0079-6107(89)90013-8. [DOI] [PubMed] [Google Scholar]
- Augustine GJ, Neher E. Calcium requirements for secretion in bovine chromaffin cells. The Journal of Physiology. 1992;450:247–271. doi: 10.1113/jphysiol.1992.sp019126. [DOI] [PMC free article] [PubMed] [Google Scholar]
- Babcock DF, Harrington J, Goodwin PC, Park YB, Hille B. Mitochondrial participation in the intracellular Ca2+ network. Journal of Cell Biology. 1997;136:833–844. doi: 10.1083/jcb.136.4.833. [DOI] [PMC free article] [PubMed] [Google Scholar]
- Berridge MJ. Neuronal calcium signalling. Neuron. 1998;21:13–26. doi: 10.1016/s0896-6273(00)80510-3. [DOI] [PubMed] [Google Scholar]
- Blatter LA, Niggli E. Confocal near-membrane detection of calcium in cardiac myocytes. Cell Calcium. 1998;23:269–279. doi: 10.1016/s0143-4160(98)90023-9. [DOI] [PubMed] [Google Scholar]
- Bokvist K, Eliasson L, Ämmälä C, Renström E, Rorsman P. Co-localization of L-type Ca2+ channels and insulin-containing secretory granules and its significance for the initiation of exocytosis in mouse pancreatic β-cells. EMBO Journal. 1995;14:50–57. doi: 10.1002/j.1460-2075.1995.tb06974.x. [DOI] [PMC free article] [PubMed] [Google Scholar]
- Demaurex N, Lew D, Krause KH. Cyclopiazonic acid depletes intracellular Ca2+ stores and activates an influx pathway for divalent cations in HL-60 cells. Journal of Biological Chemistry. 1992;267:2318–2324. [PubMed] [Google Scholar]
- Duchen MR. Contributions of mitochondria to animal physiology: from homeostatic sensor to calcium signalling and cell death. The Journal of Physiology. 1999;516:1–17. doi: 10.1111/j.1469-7793.1999.001aa.x. [DOI] [PMC free article] [PubMed] [Google Scholar]
- Dunne MJ, Petersen OH. Potassium selective ion channels in insulin-secreting cells: physiology, pharmacology and their role in stimulus-secretion coupling. Biochimica et Biophysica Acta. 1991;1071:67–82. doi: 10.1016/0304-4157(91)90012-l. [DOI] [PubMed] [Google Scholar]
- Escobar AL, Monck JR, Fernandez JM, Vergara J L. Localization of the site of Ca2+ release at the level of a single sarcomere in skeletal muscle fibres. Nature. 1994;367:739–741. doi: 10.1038/367739a0. [DOI] [PubMed] [Google Scholar]
- Escobar AL, Velez P, Kim AM, Cifuentes F, Fill M, Vergara JL. Kinetic properties of DM-nitrophen and calcium indicators: rapid transient response to flash photolysis. Pflügers Archiv. 1997;434:615–631. doi: 10.1007/s004240050444. [DOI] [PubMed] [Google Scholar]
- Etter EF, Kuhn MA, Fay FS. Detection of changes in near-membrane Ca2+ concentration using a novel membrane-associated Ca2+ indicator. Journal of Biological Chemistry. 1994;269:10141–10149. [PubMed] [Google Scholar]
- Grynkiewicz G, Poenie M, Tsien RY. A new generation of Ca2+ indicators with greatly improved fluorescence properties. Journal of Biological Chemistry. 1985;260:3440–3450. [PubMed] [Google Scholar]
- Kennedy ED, Rizzuto R, Theler J, Pralong W, Bastianutto C, Pozzan T, Wollheim CB. Glucose-stimulated insulin secretion correlates with changes in mitochondrial and cytosolic Ca2+ in aequorin-expressing INS-1 cells. Journal of Clinical Investigation. 1996;98:2524–2538. doi: 10.1172/JCI119071. [DOI] [PMC free article] [PubMed] [Google Scholar]
- Klingauf J, Neher E. Modeling buffered Ca2+ diffusion near the membrane: implications for secretion in neuroendocrine cells. Biophysical Journal. 1997;72:674–690. doi: 10.1016/s0006-3495(97)78704-6. [DOI] [PMC free article] [PubMed] [Google Scholar]
- Lenmark A. The preparation of, and studies on, free cell suspensions from mouse pancreatic islets. Diabetologia. 1974;10:431–438. doi: 10.1007/BF01221634. [DOI] [PubMed] [Google Scholar]
- Maechler P, Kennedy ED, Pozzan T, Wollheim CB. Mitochondrial activation directly triggers the exocytosis of insulin in permeabilized pancreatic β-cells. EMBO Journal. 1997;16:3833–3841. doi: 10.1093/emboj/16.13.3833. [DOI] [PMC free article] [PubMed] [Google Scholar]
- Martín F, Pintor J, Rovira JM, Ripoll C, Miras-Portugal MT, Soria B. Intracellular diadenosine polyphosphates: a novel second messenger in the stimulus-secretion coupling. FASEB Journal. 1998;12:1499–1506. doi: 10.1096/fasebj.12.14.1499. [DOI] [PubMed] [Google Scholar]
- Martín F, Ribas J, Soria B. Cytosolic Ca2+ gradients in pancreatic islet-cells stimulated by glucose and carbachol. Biochemical and Biophysical Research Communications. 1997;235:465–468. doi: 10.1006/bbrc.1997.6804. [DOI] [PubMed] [Google Scholar]
- Matlib MA, Zhou Z, Knight S, Ahmed S, Choi KM, Krause-Bauer J, Phillips R, Altschuld R, Katsube Y, Sperelakis N, Bers DM. Oxygen-bridged dinuclear ruthenium amine complex specifically inhibits Ca2+ uptake into mitochondria in vitro and in situ in single cardiac myocytes. Journal of Biological Chemistry. 1998;17:10223–10231. doi: 10.1074/jbc.273.17.10223. [DOI] [PubMed] [Google Scholar]
- Meldolesi J, Pozzan T. The endoplasmic reticulum Ca2+ store: a view from the lumen. Trends in Biological Sciences. 1998;23:10–14. doi: 10.1016/s0968-0004(97)01143-2. [DOI] [PubMed] [Google Scholar]
- Miura Y, Henquin JC, Gilon P. Emptying of intracellular Ca2+ stores stimulates Ca2+ entry in mouse pancreatic β-cells by both direct and indirect mechanisms. The Journal of Physiology. 1997;503:387–398. doi: 10.1111/j.1469-7793.1997.387bh.x. [DOI] [PMC free article] [PubMed] [Google Scholar]
- Mogami H, Nakano K, Tepikin AV, Petersen OH. Ca2+ flows via tunnels in polarized cells: recharging of apical Ca2+ stores by focal Ca2+ entry through basal membrane patch. Cell. 1997;88:49–55. doi: 10.1016/s0092-8674(00)81857-7. [DOI] [PubMed] [Google Scholar]
- Monck JR, Robinson IM, Escobar A, Vergara JL, Fernandez JM. Pulsed laser imaging of rapid Ca2+ gradients in excitable cells. Biophysical Journal. 1994;67:505–514. doi: 10.1016/S0006-3495(94)80554-5. [DOI] [PMC free article] [PubMed] [Google Scholar]
- Montero M, Alvarez J, Scheenen WJJ, Rizzuto R, Meldolesi J, Pozzan T. Calcium homeostasis in the endoplasmic reticulum: coexistence of high and low [Ca2+] subcompartments in intact HeLa cells. Journal of Cell Biology. 1997;139:601–611. doi: 10.1083/jcb.139.3.601. [DOI] [PMC free article] [PubMed] [Google Scholar]
- Nadal A, Fuentes E, McNaughton PA. Albumin stimulates uptake of calcium into subcellular stores in rat cortical astrocytes. The Journal of Physiology. 1996;492:737–750. doi: 10.1113/jphysiol.1996.sp021342. [DOI] [PMC free article] [PubMed] [Google Scholar]
- Nadal A, Valdeolmillos M, Soria B. Metabolic regulation of intracellular calcium concentration in mouse pancreatic islets of Langerhans. American Journal of Physiology. 1994:E769–774. doi: 10.1152/ajpendo.1994.267.5.E769. [DOI] [PubMed] [Google Scholar]
- Petersen OH, Petersen CCH, Kasai H. Calcium and hormone action. Annual Review of Physiology. 1994;56:297–319. doi: 10.1146/annurev.ph.56.030194.001501. [DOI] [PubMed] [Google Scholar]
- Quesada I, Martin F, Soria B. Detection of submembrane cytosolic Ca2+ gradients by the laser spot confocal technique in pancreatic islet cells stimulated by nutrient secretagogues. The Journal of Physiology. 1998;509:105. [Google Scholar]
- Ripoll C, Martin F, Rovira JM, Pintor J, Miras-Portugal MT, Soria B. Diadenosine polyphosphates: a novel class of glucose-induced intracellular messengers in the pancreatic β-cell. Diabetes. 1996;45:1431–1434. doi: 10.2337/diab.45.10.1431. [DOI] [PubMed] [Google Scholar]
- Rizzuto R, Simpson AWM, Brini M, Pozzan T. Rapid changes of mitochondrial Ca2+ by specifically targeted recombinant aequorin. Nature. 1992;358:325–327. doi: 10.1038/358325a0. [DOI] [PubMed] [Google Scholar]
- Sala F, Hernandez-Cruz A. Calcium diffusion modeling in a spherical neuron. Relevance of buffering system. Biophysical Journal. 1990;57:313–324. doi: 10.1016/S0006-3495(90)82533-9. [DOI] [PMC free article] [PubMed] [Google Scholar]
- Theler JM, Mollard P, Guérineau N, Vacher P, Pralong WF, Schlegel W, Wollheim CB. Video imaging of cytosolic Ca2+ in pancreatic β-cells stimulated by glucose, carbachol and ATP. Journal of Biological Chemistry. 1992;267:18110–18117. [PubMed] [Google Scholar]
- Thomas P, Wong JG, Lee AK, Almers W. A low affinity Ca2+ receptor controls the final steps in peptide secretion from pituitary melanotrophs. Neuron. 1993;11:93–104. doi: 10.1016/0896-6273(93)90274-u. [DOI] [PubMed] [Google Scholar]
- Tse FW, Tse A, Hille B, Horstmann H, Almers W. Local Ca2+ release from internal stores controls exocytosis in pituitary gonadotrophs. Neuron. 1997;18:121–132. doi: 10.1016/s0896-6273(01)80051-9. [DOI] [PubMed] [Google Scholar]
- Wollheim CB, Lang J, Regazzi R. The exocytotic process of insulin secretion and its regulation by Ca2+ and G-proteins. Diabetes Review. 1996;4:276–297. [Google Scholar]
- Xu T, Naraghi M, Kang H, Neher E. Kinetic studies of Ca2+ binding and Ca2+ clearance in the cytosol of adrenal chromaffin cells. Biophysical Journal. 1997;73:532–545. doi: 10.1016/S0006-3495(97)78091-3. [DOI] [PMC free article] [PubMed] [Google Scholar]