

Abstract
The consequence of reduced uptake of neurotransmitters into synaptic vesicles on synaptic transmission was examined in rat hippocampal slices and culture using bafilomycin A1 (Baf), a potent and specific blocker of the vacuolar-type (V-type) ATPase, which eliminates the driving force for the uptake of both glutamate and GABA into synaptic vesicles.
After incubation with Baf, both the amplitude and frequency of GABAergic miniature inhibitory postsynaptic currents (mIPSCs) were reduced in the slice preparation. Similar effects were seen with glutamatergic miniature excitatory postsynaptic currents (mEPSCs) and GABAergic mIPSCs from cultured neurons. This result indicates that vesicular content is reduced by Baf. The dramatic reduction in the frequency of mPSCs could result either from the exocytosis of empty vesicles or from a mechanism which prevents the exocytosis of depleted vesicles.
Vesicle cycling was directly examined using confocal imaging with FM 1–43. In the presence of Baf, vesicles could still be endocytosed and they were released at the same probability as from control untreated synapses.
Prolonged high-frequency electrical stimulation of synapses in culture failed to alter the amplitude of mEPSCs, suggesting that the filling of vesicles is rapid compared to the rate of vesicle recycling during repetitive synaptic stimulation.
Profound release of glutamate with α-latrotoxin did cause a small, but reproducible, reduction in quantal size.
These results indicate that decreasing the amount of glutamate and GABA in synaptic vesicles reduces quantal size. Furthermore, the probability of vesicle exocytosis appears to be entirely independent of the state of filling of the vesicle. However, even during high-frequency action potential-evoked release of glutamate, quantal size remained unchanged.
The essence of quantal synaptic transmission is that a relatively fixed amount of neurotransmitter is packaged into synaptic vesicles and is released onto postsynaptic neurons upon stimulation. The extent of vesicle filling and the rate at which they are filled could have significant effects on synaptic transmission. It has been estimated that the time between the endocytosis of a vesicle and its priming for release is rapid and in cultured neurons can be as fast as 15 s (Ryan & Smith, 1995). However, at many synapses even during intense high-frequency stimulation the size of quantal events remains relatively constant (Molenaar & Oen, 1988; Reid et al. 1999). These results suggest that vesicles are rapidly filled with transmitter to their final equilibrium concentration. Alternatively it is possible that control mechanisms exist whereby empty or partially filled vesicles are excluded from the release process. Such regulation could underlie experimental data from cholinergic preganglionic nerve terminals (Sacchi & Perri, 1973; McLachlan, 1975), cholinergic synapses of Aplysia buccal ganglion (Poulain et al. 1986) and GABAergic crayfish opener neuromuscular synapses (Golan & Grossman, 1996) where altering the vesicular neurotransmitter content induces changes in the apparent release probability of synaptic vesicles.
A variety of approaches have been used at the vertebrate neuromuscular junction (NMJ) to alter the amount of neurotransmitter within synaptic vesicles and determine the consequences that this has on synaptic transmission. The filling of synaptic vesicles with acetylcholine has been altered by blocking choline uptake (Elmqvist & Quastel, 1965; Jones & Kwanbunbumpen, 1970; Ceccarelli & Hurlbut, 1975), blocking the vesicular acetylcholine transporter (VAChT) (Van der Kloot, 1986; Searl et al. 1991; Prior et al. 1992) and altering the number of functional VAChT molecules expressed on the vesicular membrane (Song et al. 1997). While the findings varied considerably depending on the study and to some extent on the manipulation, changes in either the size or the frequency of quantal events have been observed. In one study, blocking the VAChT did not appear to alter vesicle recycling as measured with FM 1–43 (N-(3-triethylammoniumpropyl)-4-(4-(dibutylamino)styryl)pyridinium dibromide) (Parsons et al. 1999). These results at the neuromuscular junction suggest that vesicles with altered content can be released, but they do not exclude the possibility of a quantitative change. Finally, studies on cultured midbrian dopamine-containing neurons have reported an increase in quantal size after exposure to glial-derived neurotrophic factor (GDNF), as measured by amperometric recordings (Pothos et al. 1998). It was concluded that this increase was caused by more dopamine molecules inside the synaptic vesicles.
Due to the lack of appropriate pharmacological agents, it has not been possible to carry out similar experiments on glutamatergic and GABAergic synapses in the CNS. However, the finding that bafilomycin A1 (Baf) can block both glutamate (Roseth et al. 1995) and GABA (Fonnum et al. 1998) uptake into synaptic vesicles offers the opportunity to determine the effects of depleting synaptic vesicles of glutamate or GABA on synaptic transmission. Baf exerts its effects by blocking the vacuolar-type proton pump (V-ATPase) which is responsible for translocating protons into the lumen of the vesicle and establishing pH and electrical gradients (Drose & Altendorf, 1997). It is these gradients that are used by the glutamate and GABA vesicular transporters to concentrate these amino acids in the vesicle (Maycox et al. 1990). Although the effects of Baf on quantal parameters have not been examined, it has been shown that the release of labelled aspartate from cultured cerebellar granule cells by field stimulation is reduced and yet vesicular exocytosis, as measured by FM 2-10, appears to be grossly intact (Cousin & Nicholls, 1997).
In the present study we have used Baf to determine the consequence of depleting vesicles of GABA and glutamate on evoked and quantal transmission. In addition, we have used FM 1–43 to monitor the probability of stimulus-evoked exocytosis after severely depleting vesicles of their content. We have found that Baf causes a dramatic decrease in mEPSC and mIPSC frequency as well as a decrease in quantal amplitude. However, despite these changes the probability of exocytosis in response to electrical stimulation, as measured with FM 1-43, was unaltered.
METHODS
Tissue culture
Neonatal rats were anaesthetised with halothane before decapitation, in accordance with the guidelines of the University of California, San Francisco Committee on Animal Research. Autaptic cultures were prepared from hippocampal neurons of the CA1 and CA3 regions of the hippocampus of postnatal day (P)0 Sprague-Dawley rat pups. The dentate gyri were grossly dissected away, and cells derived from the remaining tissue were prepared as described in Tong & Jahr (1994), except that B27 (Gibco BRL) was added to the culture medium. The growth medium was exchanged fully 1 day after plating and weekly in part thereafter. Autaptic recordings were obtained from isolated neurons on collagen-poly-D-lysine microdots. Confluent cultures were prepared in a similar way except that a higher density of neurons was plated together with glia.
Electrophysiology experiments
Recordings were made at room temperature from 10- to 28-day-old cultured neurons, using an Axopatch-1D amplifier (Axon Instruments) with patch pipette electrodes (resistance between 4 and 8 MΩ). Pipette solutions contained (mM): 120 potassium gluconate, 10 KCl, 10 Hepes, 0.2 EGTA, 5 Mg-ATP and 0.3 GTP, adjusted to pH 7.3 with KOH. For recording action potential-driven EPSCs in the autapse culture the external solution contained (mM): 140 NaCl, 3.5 KCl, 10 Hepes, 20 glucose, 0.3-2 CaCl2 and 1–3 MgCl2. Picrotoxin (100 μM) was added to isolate glutamatergic EPSCs, while 10 μM 6-cyano-7-nitroquinoxaline-2,3-dione (CNQX), an AMPA receptor antagonist, and 100 μM D(-)2-amino-5-phosphonovaleric acid (D-APV), an NMDA receptor antagonist, were added to isolate GABAergic IPSCs. For acquisition of miniature EPSCs (mEPSCs), 2 mM CaCl2, 2 mM MgCl2 and 0.5 μM tetrodotoxin (TTX) were added to the external solution. To evoke EPSCs in autaptic neurons, the cells were held at -70 mV, and were stimulated every 20 s with a 2 ms, 80 mV depolarising voltage step. The series and input resistance were monitored throughout each experiment with a 4 mV calibration pulse given 90 ms before each stimulation. Evoked EPSCs were acquired and analysed with IGOR Pro software (National Instruments). Currents were low-pass filtered at 2 kHz and digitally sampled at 5 kHz. mEPSCs were acquired using Fetchex (Axon Instruments) and were analysed using a custom-made program, Mini (J. H. Steinbach, Washington University). Threshold mEPSC amplitude was set at 5 pA. An increase in mEPSC frequency was seen during the few seconds after intense stimulation. In some cells, overlap of mEPSCs occurred immediately after the termination of the stimulation, and only mEPSCs that could be clearly distinguished from each other were included for analysis. In some experiments a high sucrose solution, made by adding 200 mM sucrose to the external solution, was applied through a quartz pipe positioned within 500 μm from the recorded neuron. Brief applications (<5 s) were used on control neurons, while longer applications (10-60 s) were used on Baf-treated neurons to collect as many events as possible. Baf was dissolved in DMSO to 500 μM and kept at -20°C. Baf was added to the culture dish to a final concentration of 1 μM, and kept at 37°C in the incubator for the durations indicated in the text. Baf was added to the internal solution to the final concentration of 10 μM. For the experiments using confluent cultures, different coverslips from the same batch of cultures were used for comparison.
Synaptic currents were also studied in hippocampal slices, prepared from 10- to 14-day-old Sprague-Dawley rats. The slices were arbitrarily divided into two groups. The test group was treated with 1 μM Baf. The control group was treated with 0.2 % DMSO to match the solvent concentration added to the test slices. After over 2 h of incubation, whole-cell recordings with access resistances between 10 and 15 MΩ were made from CA1 pyramidal neurons visualised with IR-DIC microscopy (Olympus BX50) and spontaneous GABAergic synaptic currents measured with the soma voltage clamped at 0 mV in the presence of 10 μM 6-nitro-7-sulfamoylbenzo(f)quinoxaline-2,3-dione (NBQX), an AMPA receptor antagonist, 100 μM D-APV and 1 μM TTX. The whole-cell recording electrode contained (mM): 120 caesium gluconate, 15 CsCl, 10 Hepes, 5 NaCl, 5 QX-314, 2 Mg3ATP2, 0.3 Na3GTP and 0.2 Cs-EGTA (pH 7.2). The extracellular medium contained (mM): 119 NaCl, 26 NaHCO3, 10 D-glucose, 2.5 KCl, 2 CaCl2, 1 NaH2PO4 and 1 MgCl2, bubbled continuously with 95 % O2-5 % CO2. The recorded currents were filtered at 2 kHz, digitised at 5 kHz and analysed using IGOR Pro software. Fully automated detection of spontaneous events was achieved by setting a threshold for both the rise time and amplitude (8 pA) of putative events. Setting the amplitude threshold to 3 pA gave higher frequencies of detected events (some of which did not appear to be of synaptic origin) but did not alter the qualitative differences induced by Baf treatment.
Imaging experiments
Imaging experiments were performed using an Olympus Fluoview laser scanning confocal microscope, connected to an Olympus BX50WI upright microscope. An Olympus ×60 water-immersion objective (NA 0.9) was used to collect images. The 488 line of the argon laser attenuated to 0.3 % was used for excitation, and a 510 nm long pass filter was used for emission. To load the synaptic vesicles with FM 1-43, a train of 900 pulses at 10 Hz (1 ms in duration) was delivered through two parallel strips of platinum foil positioned at the opposite side of the chamber, in the presence of 15 μM FM 1–43. FM 1–43 was present in the chamber for 1 min after the end of the pulses to ensure that all vesicles exocytosed would take up the dye. The preparation was washed for 10 min with dye-free solution before any images were acquired. Five control images were collected at 5 s intervals before the onset of the destaining pulses. Another 20 images were collected at the same rate during the 900 destaining pulses at 10 Hz. Then another 900 pulses were delivered, and only one image was collected after termination of the pulses. The confocal aperture was fully open during image collection. Image analysis was done using software provided by Olympus. A 4 pixel × 4 pixel square was centred on the fluorescent spots, and the mean fluorescence intensity of the square was measured frame by frame to construct a destaining curve for each bouton. The fluorescence intensity of the last image was used as the background (non-destainable fluorescence) and subtracted from all the previous ones. Each destaining curve was then normalised to construct the population data shown in Fig. 5.
Figure 5. Baf does not change the destaining rate of FM 1–43 from synaptic boutons.
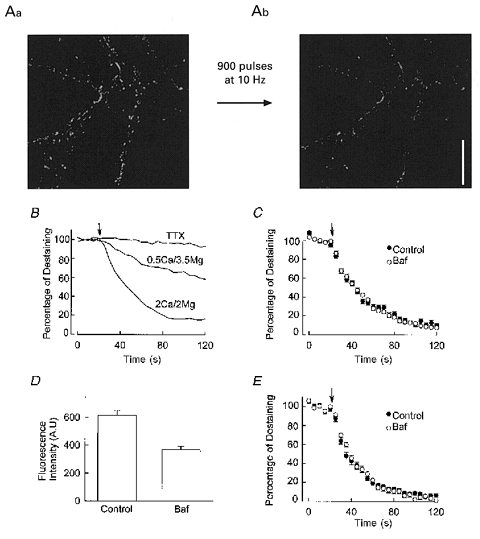
A, demonstration of FM 1–43 loading and unloading into synaptic vesicles with electrical stimulation. The image on the left (Aa) was obtained after 900 pulses (at 10 Hz) delivered in the presence of FM 1–43 and extensive wash. The distinct FM 1–43 puncta disappeared after 900 pulses in the absence of FM 1–43 as FM 1–43 was lost from the synaptic vesicles during exocytosis (Ab). Scale bar, 20 μm. B, the destaining rate of FM 1–43 is action potential dependent and related to the release probability. Destaining of FM 1–43 was abolished in the presence of the sodium channel blocker TTX and reduced when the Ca2+/Mg2+ ratio was reduced. Both curves were normalised by using the background fluorescence level obtained after 1800 pulses in 2 mM Ca2+-2 mM Mg2+. The arrow indicates the onset of the destaining pulses. All data were collected from 33 boutons on the same coverslip. Different solutions were added sequentially and a complete destaining was done under each condition before introducing the next solution (except for TTX, which required a 20 min wash). C, synaptic vesicles were loaded with FM 1–43 after 1 h incubation in Baf. The destaining rate of these vesicles does not differ from that obtained from control boutons (91 boutons/3 coverslips for Baf-treated cells and 68 boutons/3 coverslips for control cells). D, uptake of FM 1–43 into synaptic vesicles may be reduced after incubation with Baf. The intensity of the destainable fluorescence (difference between the initial value after loading and the background level after 1800 unloading pulses, in arbitrary units) in the control and Baf-treated boutons was measured under the same instrument settings. There is a reduction in the uptake of FM 1–43 in the Baf-treated group (from 614 ± 37 to 368 ± 26, 84 boutons/3 coverslip for Baf-treated cells and 42 boutons/2 coverslips for control cells). E, synaptic vesicles were loaded with FM 1–43 before incubation with Baf. The destaining rate of these vesicles after incubation does not differ from that obtained from control boutons (64 boutons/4 coverslips in Baf-treated cells and 62 boutons/3 coverslips for control cells).
Chemicals and drugs
FM 1–43 was obtained from Molecular Probes. The rest of the chemicals used were obtained from Sigma or Tocris.
RESULTS
Baf reduces the amplitude and frequency of mIPSCs in CA1 pyramidal cells
We first tested the effect of Baf on mIPSCs in CA1 pyramidal neurons in acute hippocampal slices. As shown in the sample traces in Fig. 1a, a 2 h exposure of the slice to Baf dramatically reduced the frequency of mIPSCs. In addition to the large reduction in mIPSC frequency, there was also a significant reduction in the amplitude of detected mIPSCs, which is evident by the shift to the left of the cumulative probability distribution (Fig. 1b). The reduction of detected mIPSC amplitude is consistent with a reduction in the GABA content of the vesicles. The reduction in the frequency of detected mIPSCs is most easily explained as a consequence of the reduction in mIPSC amplitude, since some of the events that were detected before Baf treatment would be below the threshold for detection in Baf.
Figure 1. Spontaneous GABAergic synaptic currents are reduced in Baf-treated hippocampal slices.
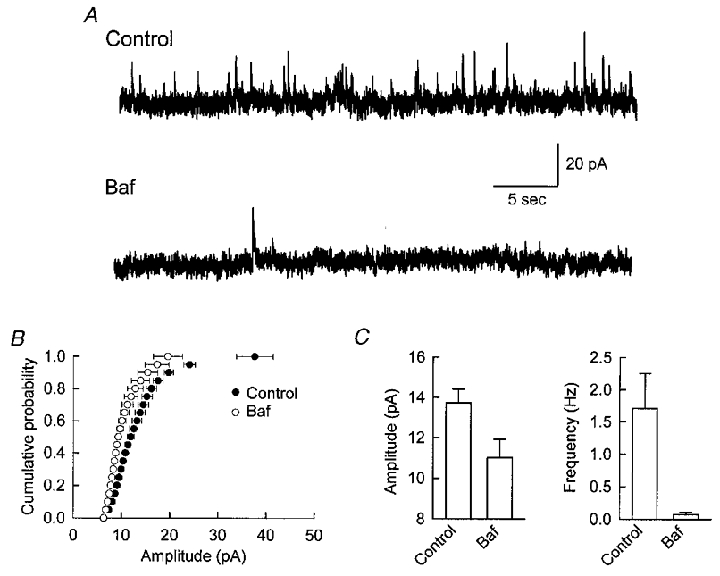
A, representative current traces from CA1 pyramidal cells held at 0 mV showing spontaneous GABAergic events in control (upper trace) and Baf-treated (lower) slices. The records show a dramatic reduction in the frequency of detected events. B, cumulative frequency distributions from all recorded cells separated into control and Baf-treated groups. The distributions show that the amplitude of detected minis is decreased in Baf-treated slices. The horizontal bars represent the s.e.m.C, both amplitude (control, 13.7 ± 0.7 pA, n = 5; Baf, 11.0 ± 0.9 pA, n = 5) and frequency (control, 1.7 ± 0.5 Hz; Baf, 0.1 ± 0.03 Hz) of detected events are reduced by Baf treatment (P < 0.05, Student's t test). All values in this and subsequent figures are expressed as the mean ±s.e.m.
Baf reduces the amplitude and frequency of mIPSCs in neuronal cultures
In order to study the effect of Baf in more detail, we switched to hippocampal neuronal cultures. Since the number of mIPSCs that can be collected after Baf incubation is quite small, we applied a hypertonic solution (containing 200 mM sucrose) externally to ensure that enough events could be collected in a short period of time. Rosenmund & Stevens (1996) have shown that a large number of mEPSCs can be elicited by the hypertonic solution, and that the amplitude of the events is not altered by this application. In the present study a similar enhancement in mIPSC frequency occurred during the application of hypertonic sucrose and this enhancement is greatly reduced in cells exposed to Baf (Fig. 2a). A clear leftward shift is also seen in the cumulative probability plot (Fig. 2b), indicating a reduction in quantal size. This change cannot be explained by a change in input resistance, since no systematic difference was found between control and Baf-treated neurons. We then studied the time course of the action of Baf by varying the length of exposure to Baf. As shown in Fig. 2C, there is a significant reduction in detected mIPSC amplitude (P < 0.01), and this reduction was maximal (∼ 56 %) at 1 h incubation (P > 0.4). In these same experiments a dramatic reduction is seen in the frequency of detected mIPSCs (Fig. 2D). The above results demonstrated that the action of Baf on cultured neurons is similar to that recorded in acute slice preparations.
Figure 2. Baf reduces the amplitude and frequency of mIPSCs from cultured hippocampal neurons.
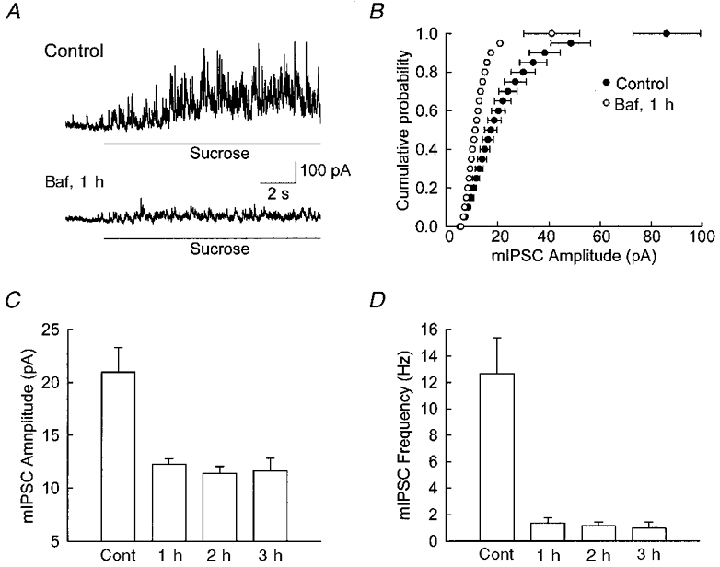
A, sample traces of mIPSCs. The bar indicates application of high sucrose solution. The mean amplitude and frequency of mIPSCs was reduced after neurons had been incubated in Baf for 1 h. B, cumulative probability distribution of mIPSCs. For the open circles the error bars are smaller than the symbol. A clear leftward shift is seen for the mIPSCs from neurons incubated in Baf for 1 h. C and D, time course of the effect of Baf on mIPSCs. Under all conditions, mIPSCs during sucrose application were analysed, and the mean amplitude (C) and frequency (D) were plotted. The effect of Baf reached a maximum within 1 h of incubation. The amplitude of the mIPSCs decreased from 21.0 ± 2.3 pA (control) to 12.3 ± 0.5 pA (1 h), 11.4 ± 0.7 pA (2 h) and 11.6 ± 1.2 pA (3 h). The frequency of mIPSCs decreased from 12.7 ± 2.7 Hz (control) to 1.4 ± 0.4 Hz (1 h), 1.1 ± 0.3 Hz (2 h) and 1.0 ± 0.4 Hz (3 h).
Baf reduces the amplitude and frequency of mEPSCs in neuronal cultures
As stated in Introduction, Baf should be as effective in blocking the vesicular uptake of glutamate at excitatory synapses as it is at blocking vesicular uptake of GABA at inhibitory synapses. Figure 3a shows that this is indeed the case. The dramatic increase in mEPSC frequency evoked by a brief application of hypertonic sucrose solution (see bar above record) is essentially abolished in the presence of Baf. In addition, a 1 h exposure to Baf caused a clear leftward shift in the cumulative probability plot of detected mEPSC amplitudes (Fig. 3b). Longer incubation times in Baf did not appreciably increase the magnitude of the effect on detected mEPSC amplitude, which plateaued at about 58 % (P > 0.1) (Fig. 3C), while in the same experiments the frequency continued to decline somewhat with the longer incubations (Fig. 3D). The mEPSCs included for data analysis in Fig. 3b and C for the 1 h incubation with Baf were collected in the control solution (no sucrose added), indicating that the effect was not an artifact caused by the application of hypertonic solution.
Figure 3. Baf reduces the amplitude and frequency of mEPSCs from cultured hippocampal neurons.
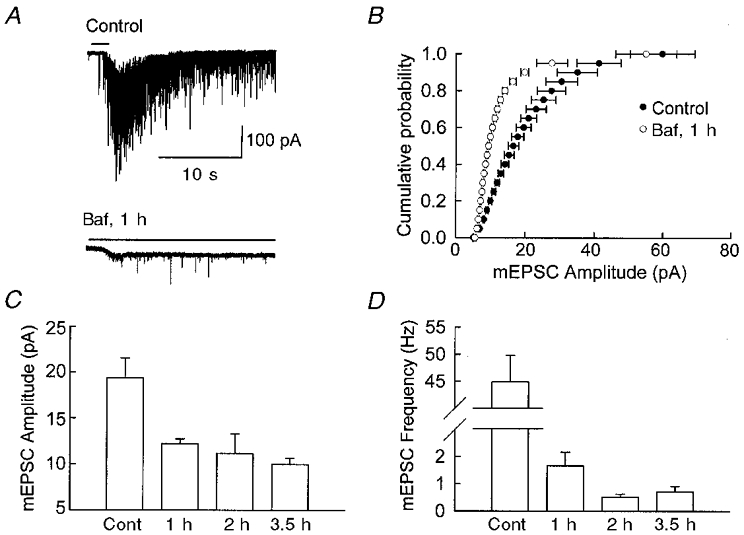
A, sample traces of mEPSCs. The bar indicates application of high sucrose solution. A reduction in mEPSC amplitude and frequency is seen in neurons after 1 h incubation with Baf. B, cumulative probability distribution of mEPSCs. A clear leftward shift is seen for the mEPSCs recorded from neurons incubated in Baf for 1 h (n = 5 for control cells and n = 7 for Baf-treated cells). C and D, time course of the effect of Baf on mEPSCs. Most of the effect of Baf on the mEPSC amplitude (C) was reached within 1 h of incubation, while longer incubations caused a slight further reduction in the mEPSC frequency (n = 4-7). The amplitude of mEPSCs decreased from 19.4 ± 2.2 pA (control) to 12.2 ± 0.5 pA (1 h), 11.2 ± 2.1 pA (2 h), and 10.0 ± 0.7 pA (3.5 h). The frequency of mEPSCs decreased from 44.9 ± 4.9 Hz (control) to 1.7 ± 0.5 Hz (1 h), 0.5 ± 0.1 Hz (2 h), and 0.7 ± 0.2 Hz (3.5 h).
Baf reduces evoked EPSCs and mEPSCs in autaptic cultures
The above results were obtained by comparing data collected from different cells on different coverslips. Since the amplitude and, to an even greater extent, the frequency vary considerably, depending on the age and density of connectivity of the cultures, we wished to compare the effect of Baf in the same cell. Thus we took advantage of the autapses made by single neurons cultured in isolation in which drugs can be applied via the whole cell pipette to the synaptic terminal. Action potential-driven EPSCs and mEPSCs from the same cell can be recorded simultaneously. A high concentration of Baf (10 μM) was included in the recording pipette so that the time course of the effect of Baf could be studied as it diffused to the terminals. Results from a representative cell are shown in Fig. 4A–C. The very beginning of the recording period (0-3 min after whole-cell configuration was obtained) was used as the control period, since it takes some time for Baf to diffuse along the axon to the synaptic terminals. Over time the amplitude of the detected mEPSCs decreased and reached a plateau, while the evoked EPSC and frequency of the detected mEPSCs continued to decrease (Fig. 4a and open symbols in Fig. 4b). This cumulative effect is presumably due to an increasing concentration of Baf in the terminal with time, as well as a continuous loss of glutamate from the vesicles. A similar effect was observed in three additional experiments. The observed decrease in synaptic transmission could be due to a non-specific rundown induced through prolonged whole-cell dialysis. Figure 4b shows that in control cells recorded with an internal solution containing the same concentration of DMSO, only a very small rundown occurred over the same time period as used for the Baf experiments.
Figure 4. Baf reduces evoked EPSC and mEPSCs in autaptic cultures.
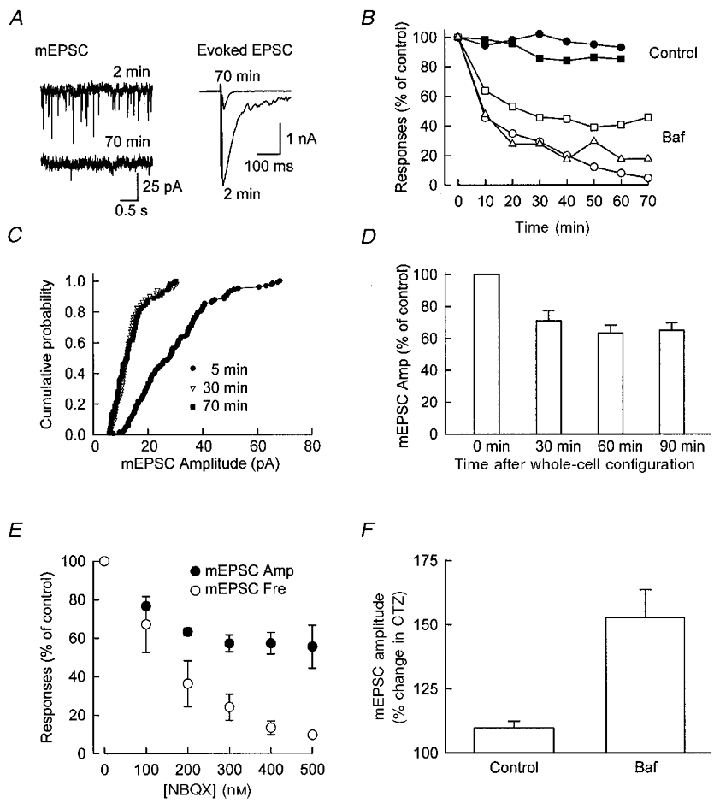
A, sample traces of mEPSCs (left) and evoked EPSCs (right) at 2 and 70 min after whole-cell configuration was established in an autaptic neuron. Baf was present in the recording pipette. Note the dramatic reduction in the amplitude and frequency of mEPSCs and a large reduction in the size of the evoked EPSC. B, time course of the change in mEPSCs and evoked EPSC from one representative cell. The abscissa indicates the time after whole-cell configuration was obtained. Note that the reduction of mEPSCs amplitude (□) plateaued around 30–40 min, while the reduction in mEPSC frequency (▵) and evoked EPSC amplitude (○) continued. The amplitudes of evoked EPSCs (•) and mEPSC s (▪) from a control cell are also shown on the same graph for comparison. The dramatic reduction in evoked EPSCs and mEPSC amplitude and frequency are not caused by rundown of the synaptic responses as a result of long recording. For control cells, the same concentration of DMSO was added to the internal solution. C, cumulative probability distribution of mEPSCs. A clear leftward shift is seen as Baf diffuses into the neuron, while the distribution of mEPSCs at 30 and 70 min are similar to each other. D, the effect of Baf appears to be independent of neuronal activity. The time course of reduction in mEPSC amplitude is shown for four autaptic cells, which were held at -70 mV during the entire course of recording. The time course of the reduction of mEPSC amplitude is similar to that shown in B, which suggests that neuronal activity (action potentials or activity-dependent turnover of synaptic vesicles) is not required for the effect of Baf (71 ± 6 % (30 min), 63 ± 5 % (60 min), and 65 ± 5 % (90 min) of control values). E, the effect of increasing the concentration of NBQX on mEPSC amplitude and frequency. At low concentrations, NBQX causes a reduction in both amplitude and frequency. However, the reduction in amplitude plateaus while the decrease in frequency continues with higher concentrations of NBQX. These results point out the limitation in the analysis of mEPSCs in terms of interpreting the changes in both amplitude and frequency. F, the increase of mEPSC amplitude by CTZ is larger in neurons treated with Baf. mEPSCs were collected in the normal solution and in the presence of 200 μM CTZ, for both control and Baf-treated cells. The relative change of mEPSC was calculated for each cell. The increase in mEPSC amplitude caused by CTZ is larger for Baf-treated cells (mean = 153 ± 11 %, n = 7) than control cells (mean = 110 ± 3 %, n = 10). This result indicates that Baf causes a significant reduction in the concentration of glutamate in the vesicles. Confluent cultures were used for experiments shown in E and F.
The fairly modest stimulus frequency (0.05 Hz) used in the above experiments suggests that only a very small portion of the vesicle pool has been turned over by the stimuli. This is further supported by the imaging data presented below. Nevertheless, a clear reduction in the amplitude of detected mEPSCs was seen within 10 min of recording in the autaptic cells. This indicates that the reduction in detected mEPSC amplitude must be due, at least in part, to the leakage of glutamate from the preformed vesicles. Consistent with this idea, we found that the time course of reduction in mEPSC amplitude was similar whether the autapse was stimulated or not. Thus in the experiments shown in Fig. 4D the cells were not stimulated and the membrane potential was held at -70 mV throughout the experiment. Yet the time course of the amplitude reduction in this series of experiments is similar to that in Fig. 4b where the cell was continuously stimulated at 0.05 Hz.
Since a plateau in mIPSC and mEPSC amplitude was reached regardless of the duration of exposure to Baf, we decided to determine the cause of this apparent plateau. The steady state mPSC amplitude could indicate that it is only possible to deplete vesicles of neurotransmitter to a certain extent before affecting the availability of the vesicle for release. Alternatively, this plateau may be introduced, at least in part, by data collection and analysis. To test this issue, we used a purely postsynaptic manipulation, reducing the mEPSC amplitude systematically by adding increasing concentrations of the AMPA receptor antagonist NBQX. The amplitude and frequency of detected mEPSCs were plotted against the concentration of NBQX (Fig. 4E). The data show that a plateau of mEPSC amplitude was reached, while the frequency continued to fall. The finding that the frequency of detected mEPSCs continues to decrease with higher concentrations of antagonist is similar to that observed in the autaptic culture treated with Baf (Fig. 4b) and is explained by fewer events reaching the detection threshold. Thus, these results suggest that the plateau reached in Baf is an artifact as a consequence of difficulties in mPSP resolution and point out the limitations in the analysis of mPSCs in terms of interpreting changes in both amplitude and frequency.
To confirm that Baf reduces the concentration of glutamate in the vesicles we measured the change of mEPSC amplitude caused by cyclothiazide (CTZ), a drug that blocks the desensitisation of AMPA receptors. It has been shown that the increase in AMPA receptor-mediated currents caused by CTZ is inversely dependent on the concentration of glutamate (Yamada & Tang, 1993; Dzubay & Jahr, 1999). CTZ clearly prolonged the decay of mEPSCs, for both control and Baf-treated cells (data not shown). Furthermore, in cells treated with Baf, the increase in detected mEPSC amplitude was significantly larger than that seen in the control cells (P < 0.0005) (Fig. 4F). This result supports the conclusion that Baf reduces the concentration of glutamate in the vesicles, and the smaller quanta observed are due to a lower vesicular concentration of glutamate. A large increase in mEPSC frequency occurred in control cells in the presence of CTZ, which suggests that CTZ may alter the release probability (Barnes-Davies & Forsythe, 1995; Diamond & Jahr, 1995). No quantification of mEPSC frequency was done as a result.
Baf does not change the destaining rate of FM 1–43 from synaptic boutons
To determine whether the decrease in mPSC frequency is entirely due to the inability to detect the release of vesicles with little or no transmitter, or whether the probability of exocytosis has been reduced, we turned to imaging presynaptic boutons and directly examining the release of vesicles with FM 1–43. The cultures we used for imaging experiments contained both GABAergic and glutamatergic synapses, but since we have demonstrated that the effect of Baf on these two types of synapses is very similar in both the magnitude of the effect and time course, there is no need to distinguish between these two classes of synapse. After loading the synaptic vesicles with FM 1–43 a series of 900 pulses were delivered to the cultured neurons, which caused a dramatic loss of staining (Fig. 5a). This unloading of FM 1–43 from the synaptic vesicles is action potential dependent, since it is prevented by the sodium channel blocker TTX (Fig. 5b). In addition, the rate of unloading is governed by the release probability, since a faster destaining rate was seen in an external solution with a higher Ca2+/Mg2+ ratio (Fig. 5b). We first examined the destaining rate of synaptic vesicles loaded with FM 1–43 after they had been treated with Baf for 1 h. There was no appreciable difference between the control and the treated boutons (Fig. 5C). This result indicates that at least some vesicles are able to take up FM 1–43 in the presence of Baf and that these vesicles are released with a normal probability. However, it is possible that in this experiment we were selectively examining a subpopulation of vesicles which were unaffected by Baf. In addition, it was found that Baf caused a modest, presumably non-specific, reduction in the uptake of FM 1–43 into the vesicles (Fig. 5D; see figure legend for details of the experiment). To circumvent these issues we loaded the vesicles with FM 1–43 before incubation with Baf, and then measured the destaining rate of the prelabelled pool of vesicles. The destaining rate of the vesicles is identical to that in the control (Fig. 5E). The above results indicate that for both recycled and preformed vesicles, severe depletion of neurotransmitter content by Baf has no effect on the probability of vesicular exocytosis.
Effects of high-frequency stimulation on the amplitude of mEPSCs
Given that reducing glutamate uptake into synaptic vesicles clearly reduces quantal size, we wondered if rapid recycling of vesicles might outpace the ability of the transporters to completely fill the vesicles. We first used the stimulus protocol of 900 pulses at 10 Hz because this protocol was shown to completely destain synapses of accumulated FM 1–43 and thus cause a complete recycling of the vesicles. However, this level of stimulation failed to cause any change in the detected mEPSC amplitude, even immediately after the stimuli (Fig. 6a and B), when stimulus-evoked asynchronous release of mEPSCs transiently increases. We therefore greatly increased the number of pulses and the frequency (4000 pulses at 50 Hz) and still failed to observe any effect on the amplitude of detected mEPSCs (Fig. 6C). These results suggest that even with patterns of stimulation likely to be outside of the physiological range, vesicle filling is capable of keeping up with vesicle recycling. In a final attempt to force the release of incompletely filled vesicles we caused the massive release of vesicles with α-latrotoxin. This toxin caused a large increase in the frequency of mEPSCs which peaked in 10–20 min and then gradually returned to control frequencies (Fig. 7a) or to frequencies below control. Under these conditions there was a small, but significant, decease in the mean amplitude of detected mEPSCs (Fig. 7b).
Figure 6. Quantal size is not altered by intense synaptic stimulation.
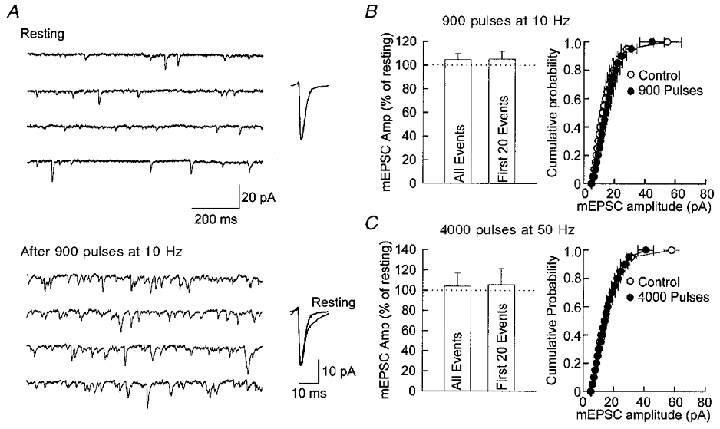
A, four consecutive traces of mEPSCs recorded from an autaptic neuron under resting conditions and after 900 pulses at 10 Hz. An increase in mEPSC frequency is seen after the stimulation, but the size of the average mEPSC remains the same. Average mEPSCs are shown to the right of the sample traces. B, mean amplitude (Amp) and distribution of mEPSCs are not altered after 900 pulses delivered at 10 Hz. Mean mEPSC amplitudes are 105 ± 5 % for all events and 105 ± 7 % for the first 20 events. The mean amplitude of all events (at least 100 events collected within the first minute after the stimulation) or the first 20 events after stimulation were not different from that under resting condition. The distribution of mEPSCs is not altered by stimulation, as shown by the cumulative probability plot on the right (n = 6). C, mean amplitude and distribution of mEPSCs are not altered after 4000 pulses delivered at 50 Hz (n = 5). Mean mEPSC amplitudes are 104 ± 13 % for all events and 105 ± 16 % for the first 20 events. All the above experiments were performed on confluent cultures, and field stimulation was delivered through two parallel platinum foil electrodes.
Figure 7. A small reduction in quantal size is observed after intense release of synaptic vesicles triggered by α-latrotoxin.

A, representative experiment from confluent culture. mEPSCs were recorded in the absence of calcium (no calcium was added to the external solution). α-Latrotoxin (α-Ltx) at 0.5 nM caused a large increase in the mEPSC frequency which gradually declined until it was actually below the original resting level. In the latter condition, a small reduction in quantal size is observed. Access resistance (Rs) of the recording pipette did not change significantly during the recording. A 10 min region was blanked out to compress the display of the experiment. B, amplitude (Amp) and frequency (Freq) of mEPSCs collected after intense release of synaptic vesicles by α-latrotoxin. When compared to the values under resting condition, a reduction in both amplitude and frequency of mEPSCs is seen (amplitude = 79 ± 7 % of control value; frequency = 29 ± 12 % of control value; n = 5).
DISCUSSION
In this paper we provide the first physiological evidence that depleting CNS synaptic vesicles of either GABA or glutamate profoundly depresses both GABAergic and glutamatergic synaptic transmission. As might be expected this depression is accompanied by a reduction in the amplitude of mPSCs and a dramatic decrease in their frequency. For our physiological studies we have used the V-type ATPase inhibitor Baf (Bowman et al. 1988; Floor et al. 1990; Drose & Altendorf, 1997), which is known from biochemical studies to deplete synaptic vesicles of glutamate and GABA (Roseth et al. 1995; Fonnum et al. 1998). It should be pointed out that the classic interpretation of a reduction in quantal size, i.e. a decrese in postsynaptic transmitter sensitivity, is unlikely, because neurons exposed to Baf for 3 h still exhibited robust responses to exogenously applied GABA and glutamate (n = 3). These physiological studies cannot address whether the profound decrease in frequency can be accounted for entirely by the failure to detect the release of empty vesicles, or whether there has been a change in the actual exocytosis of vesicles. Using FM 1–43 to directly measure the probability of vesicle exocytosis, we find that, despite the severe reduction in vesicular content of neurotransmitter, these vesicles can still be released with the same probability as those that have a normal neurotransmitter content. Thus it is reasonable to conclude that the mechanisms involved in controlling the release of synaptic vesicles are completely oblivious to the state of filling of synaptic vesicles.
Our results are consistent with those of Cousin & Nicholls (1997), who found that, while Baf caused a reduction in the release of labelled aspartate from cerebellar granule cells, the release of synaptic vesicles as measured with FM 2–10 appeared to be intact. They are also similar to the results of Parsons et al. (1999), who found that depleting vesicles of acetylcholine at the neuromuscular junction with a blocker of vesicular acetylcholine transport resulted in a decrease in miniature endplate responses, while the exocytosis of vesicles measured with FM 1–43 was grossly normal.
From our results, we suggest that the reduction of mPSCs by Baf is at least partially mediated by leakage of transmitter from the vesicles. The imaging data show that a substantial portion of the preformed vesicles are not turned over during the time period of the incubation with Baf, in the absence of stimulation. Thus it is likely that many of the mPSC events collected in Baf were due to the exocytosis of preformed vesicles, which means that transmitter must have leaked from the fully filled vesicles. Consistent with this conclusion is our observation that neuronal activity or turnover of the vesicles is not required for the reduction of mEPSC (Fig. 4D). Earlier biochemical work in more reduced preparations, which demonstrated that the proton gradient is essential for the retention of glutamate in the vesicles (Carlson & Ueda, 1990; Maycox et al. 1990), is in accord with our observations.
We have clearly shown that the transmitter content of synaptic vesicles can be dramatically reduced by pharmacological means and that the exocytotic machinery releases these partially filled vesicles with normal probability. This raises an extremely important question, which is whether the amount of transmitter in vesicles can be altered by physiological processes. The most likely condition in which one might detect the release of partially filled vesicles is during high-frequency stimulation when the lifetime of a vesicle in the presynaptic terminal would be greatly reduced. The literature from the NMJ on the change of quantal size induced by activity is mixed. In some studies, no change was observed even after prolonged stimulation (Molenaar & Oen, 1988; Reid et al. 1999), whereas in other studies small reductions were seen after moderate stimulation (Jones & Kwanbunbumpen 1970; Kriebel & Gross, 1974; Doherty et al. 1984; Glavinovic, 1987). Since only a small portion of the vesicle pool was turned over by the stimuli, and the newly endocytosed vesicles mix freely with the reserve pool of vesicles (Betz & Bewick, 1992, 1993) it has been suggested that the docked vesicles are filled to a greater extent than the rest of the pool of vesicles (Van der Kloot & Molgó, 1994).
In the present studies intense electrical stimulation protocols designed to burden the presynaptic release of vesicles failed to alter quantal size. Only after massive vesicle depletion of the presynaptic terminal with α-latrotoxin did we detect a small decrease in quantal amplitude. Since the exocytotic machinery is perfectly capable of releasing incompletely filled quanta, it must be concluded that the refilling of newly formed vesicles is extremely rapid and is not normally a rate-limiting step in the recycling of vesicles. Recent studies have suggested that the probability of release depends on the size of the readily releasable pool of vesicles and during intense stimulation, either with high potassium (Liu & Tsien, 1995) or hypertonic sucrose (Stevens & Tsujimoto, 1995; Rosenmund & Stevens, 1996) the probability of release and the size of the readily releasable pool are severely depressed. It has been estimated that the time for a newly endocytosed vesicle to be released can be as brief as 15 s and that the newly endocytosed vesicles mix rapidly with the readily releasable pool (Ryan & Smith, 1995). Thus, complete filling of the vesicle presumably could occur within 15 s and before the vesicle mixes with the pool. This requires that the vesicular transporters must be very rapid and/or that the vesicle membrane has a large number of transporter molecules. The fact that the vesicle filling step is rapid compared to the other steps in the vesicle cycle ensures that quantal transmission will be preserved during extremely different demands on the release process.
Acknowledgments
We thank Sue Giller for preparation of culture, Helen Czerwonka for expert secretarial assistance, Dr S. M. Frerking and R. Edwards for comments on the manuscript, and the members of the Nicoll laboratory for discussion. C.C.H.P. was supported by the Wellcome Trust and Q.Z. by an NIH postdoctoral training grant. R.A.N. is supported by grants from the NIH and the Bristol-Myers Squibb Co. R.A.N. is a member of the Keck Centre for Integrative Neuroscience and the Silvio Conte Centre for Neuroscience Research.
References
- Barnes-Davies M, Forsythe ID. Pre- and postsynaptic glutamate receptors at a giant excitatory synapse in rat auditory brainstem slices. The Journal of Physiology. 1995;488:387–406. doi: 10.1113/jphysiol.1995.sp020974. [DOI] [PMC free article] [PubMed] [Google Scholar]
- Betz WJ, Bewick GS. Optical analysis of synaptic vesicle recycling at the frog neuromuscular junction. Science. 1992;255:200–203. doi: 10.1126/science.1553547. [DOI] [PubMed] [Google Scholar]
- Betz WJ, Bewick GS. Optical monitoring of transmitter release and synaptic vesicle recycling at the frog neuromuscular junction. The Journal of Physiology. 1993;460:287–309. doi: 10.1113/jphysiol.1993.sp019472. [DOI] [PMC free article] [PubMed] [Google Scholar]
- Bowman EJ, Siebers A, Altendorf K. Bafilomycins: a class of inhibitors of membrane ATPases from microorganisms, animal cells, and plant cells. Proceedings of the National Academy of Sciences of the USA. 1988;85:7972–7976. doi: 10.1073/pnas.85.21.7972. [DOI] [PMC free article] [PubMed] [Google Scholar]
- Carlson MD, Ueda T. Accumulated glutamate levels in the synaptic vesicle are not maintained in the absence of active transport. Neuroscience Letters. 1990;110:325–330. doi: 10.1016/0304-3940(90)90868-a. [DOI] [PubMed] [Google Scholar]
- Ceccarelli B, Hurlbut WP. The effects of prolonged repetitive stimulation in hemicholinium on the frog neuromuscular junction. The Journal of Physiology. 1975;247:163–188. doi: 10.1113/jphysiol.1975.sp010926. [DOI] [PMC free article] [PubMed] [Google Scholar]
- Cousin MA, Nicholls DG. Synaptic vesicle recycling in cultured cerebellar granule cells: role of vesicular acidification and refilling. Journal of Neurochemistry. 1997;69:1927–1935. doi: 10.1046/j.1471-4159.1997.69051927.x. [DOI] [PubMed] [Google Scholar]
- Diamond JS, Jahr CE. Asynchronous release of synaptic vesicles determines the time course of the AMPA receptor-mediated EPSC. Neuron. 1995;15:1097–1107. doi: 10.1016/0896-6273(95)90098-5. [DOI] [PubMed] [Google Scholar]
- Doherty P, Hawgood BJ, Smith IC. Changes in miniature end-plate potentials after brief nervous stimulation at the frog neuromuscular junction. The Journal of Physiology. 1984;356:349–358. doi: 10.1113/jphysiol.1984.sp015469. [DOI] [PMC free article] [PubMed] [Google Scholar]
- Drose S, Altendorf K. Bafilomycins and concanamycins as inhibitors of V-ATPases and P-ATPases. Journal of Experimental Biology. 1997;200:1–8. doi: 10.1242/jeb.200.1.1. [DOI] [PubMed] [Google Scholar]
- Dzubay JA, Jahr CE. The concentration of synaptically released glutamate outside of the climbing fiber-Purkinje cell synaptic cleft. Journal of Neuroscience. 1999;19:5265–5274. doi: 10.1523/JNEUROSCI.19-13-05265.1999. [DOI] [PMC free article] [PubMed] [Google Scholar]
- Elmqvist D, Quastel DMJ. Prejunctional action of hemicholinium at the neuromuscular junction. The Journal of Physiology. 1965;177:463–482. doi: 10.1113/jphysiol.1965.sp007605. [DOI] [PMC free article] [PubMed] [Google Scholar]
- Floor E, Leventhal PS, Schaeffer SF. Partial purification and characterization of the vacuolar H+-ATPase of mammalian synaptic vesicles. Journal of Neurochemistry. 1990;55:1663–1670. doi: 10.1111/j.1471-4159.1990.tb04954.x. [DOI] [PubMed] [Google Scholar]
- Fonnum F, Fykse EM, Roseth S. Uptake of glutamate into synaptic vesicles. Progress in Brain Research. 1998;116:87–101. doi: 10.1016/s0079-6123(08)60432-x. [DOI] [PubMed] [Google Scholar]
- Glavinovic MI. Synaptic depression in frog neuromuscular junction. Journal of Neurophysiology. 1987;58:230–246. doi: 10.1152/jn.1987.58.1.230. [DOI] [PubMed] [Google Scholar]
- Golan H, Grossman Y. Block of glutamate decarboxylase decreases GABAergic inhibition at the crayfish synapses: possible role of presynaptic metabotropic mechanisms. Journal of Neurophysiology. 1996;75:2089–2098. doi: 10.1152/jn.1996.75.5.2089. [DOI] [PubMed] [Google Scholar]
- Jones SF, Kwanbunbumpen S. The effects of nerve stimulation and hemicholinium on synaptic vesicles at the mammalian neuromuscular junction. The Journal of Physiology. 1970;207:31–50. doi: 10.1113/jphysiol.1970.sp009046. [DOI] [PMC free article] [PubMed] [Google Scholar]
- Kriebel ME, Gross CE. Multimodal distribution of frog miniature endplate potentials in adult denervated and tadpole leg muscle. Journal of General Physiology. 1974;64:85–103. doi: 10.1085/jgp.64.1.85. [DOI] [PMC free article] [PubMed] [Google Scholar]
- Liu G, Tsien RW. Properties of synaptic transmission at single hippocampal synaptic boutons. Nature. 1995;375:404–408. doi: 10.1038/375404a0. [DOI] [PubMed] [Google Scholar]
- McLachlan EM. Changes in statistical release parameters during prolonged stimulation of preganglionic nerve terminals. The Journal of Physiology. 1975;253:477–491. doi: 10.1113/jphysiol.1975.sp011201. [DOI] [PMC free article] [PubMed] [Google Scholar]
- Maycox PR, Hell JW, Jahn R. Amino acid neurotransmission: spotlight on synaptic vesicles. Trends in Neurosciences. 1990;13:83–87. doi: 10.1016/0166-2236(90)90178-d. [DOI] [PubMed] [Google Scholar]
- Molenaar PC, Oen BS. Analysis of quantal acetylcholine noise at end-plates of frog muscle during rapid transmitter secretion. The Journal of Physiology. 1988;400:335–348. doi: 10.1113/jphysiol.1988.sp017123. [DOI] [PMC free article] [PubMed] [Google Scholar]
- Parsons RL, Calupca MA, Merriam LA, Prior C. Empty synaptic vesicles recycle and undergo exocytosis at vesamicol-treated motor nerve terminals. Journal of Neurophysiology. 1999;81:2696–2700. doi: 10.1152/jn.1999.81.6.2696. [DOI] [PubMed] [Google Scholar]
- Pothos EN, Davila V, Sulzer D. Presynaptic recording of quanta from midbrain dopamine neurons and modulation of the quantal size. Journal of Neuroscience. 1998;18:4106–4118. doi: 10.1523/JNEUROSCI.18-11-04106.1998. [DOI] [PMC free article] [PubMed] [Google Scholar]
- Poulain B, Baux G, Tauc L. Presynaptic transmitter content controls the number of quanta released at a neuro-neuronal cholinergic synapse. Proceedings of the National Academy of Sciences of the USA. 1986;83:170–173. doi: 10.1073/pnas.83.1.170. [DOI] [PMC free article] [PubMed] [Google Scholar]
- Prior C, Marshall IG, Parsons SM. The pharmacology of vesamicol: an inhibitor of the vesicular acetylcholine transporter. General Pharmacology. 1992;23:1017–1022. doi: 10.1016/0306-3623(92)90280-w. [DOI] [PubMed] [Google Scholar]
- Reid B, Slater CR, Bewick GS. Synaptic vesicle dynamics in rat fast and slow motor nerve terminals. Journal of Neuroscience. 1999;19:2511–2521. doi: 10.1523/JNEUROSCI.19-07-02511.1999. [DOI] [PMC free article] [PubMed] [Google Scholar]
- Rosenmund C, Stevens CF. Definition of the readily releasable pool of vesicles at hippocampal synapses. Neuron. 1996;16:1197–1207. doi: 10.1016/s0896-6273(00)80146-4. [DOI] [PubMed] [Google Scholar]
- Roseth S, Fykse EM, Fonnum F. Uptake of L-glutamate into rat brain synaptic vesicles: effect of inhibitors that bind specifically to the glutamate transporter. Journal of Neurochemistry. 1995;65:96–103. doi: 10.1046/j.1471-4159.1995.65010096.x. [DOI] [PubMed] [Google Scholar]
- Ryan TA, Smith SJ. Vesicle pool mobilization during action potential firing at hippocampal synapses. Neuron. 1995;14:983–989. doi: 10.1016/0896-6273(95)90336-4. [DOI] [PubMed] [Google Scholar]
- Sacchi O, Perri V. Quantal mechanism of transmitter release during progressive depletion of the presynaptic stores at a ganglionic synapse. The action of hemicholinium-3 and thiamine deprivation. Journal of General Physiology. 1973;61:342–360. doi: 10.1085/jgp.61.3.342. [DOI] [PMC free article] [PubMed] [Google Scholar]
- Searl T, Prior C, Marshall IG. Acetylcholine recycling and release at rat motor nerve terminals studied using (-)-vesamicol and troxpyrrolium. The Journal of Physiology. 1991;444:99–116. doi: 10.1113/jphysiol.1991.sp018868. [DOI] [PMC free article] [PubMed] [Google Scholar]
- Song H, Ming G, Fon E, Bellocchio E, Edwards RH, Poo M. Expression of a putative vesicular acetylcholine transporter facilitates quantal transmitter packaging. Neuron. 1997;18:815–826. doi: 10.1016/s0896-6273(00)80320-7. [DOI] [PubMed] [Google Scholar]
- Stevens CF, Tsujimoto T. Estimates for the pool size of releasable quanta at a single central synapse and for the time required to refill the pool. Proceedings of the National Academy of Sciences of the USA. 1995;92:846–849. doi: 10.1073/pnas.92.3.846. [DOI] [PMC free article] [PubMed] [Google Scholar]
- Tong G, Jahr CE. Block of glutamate transporters potentiates postsynaptic excitation. Neuron. 1994;13:1195–1203. doi: 10.1016/0896-6273(94)90057-4. [DOI] [PubMed] [Google Scholar]
- Van der Kloot W. 2-(4-Phenylpiperidino) cyclohexanol (AH5183) decreases quantal size at the frog neuromuscular junction. Pflügers Archiv. 1986;406:83–85. doi: 10.1007/BF00582958. [DOI] [PubMed] [Google Scholar]
- Van der Kloot W, Molgó J. Quantal acetylcholine release at the vertebrate neuromuscular junction. Physiological Reviews. 1994;74:899–991. doi: 10.1152/physrev.1994.74.4.899. [DOI] [PubMed] [Google Scholar]
- Yamada KA, Tang CM. Benzothiadiazides inhibit rapid glutamate receptor desensitization and enhance glutamatergic synaptic currents. Journal of Neuroscience. 1993;13:3904–3915. doi: 10.1523/JNEUROSCI.13-09-03904.1993. [DOI] [PMC free article] [PubMed] [Google Scholar]