

Abstract
This study examined the effects of activator Ca2+ on loaded shortening and power output in skinned rat cardiac myocyte preparations, and fast- and slow-twitch skeletal muscle fibres at 12 °C.
Shortening velocities were slowed at nearly all relative loads when Ca2+ activation levels were reduced to ≈70 % maximal isometric force (P4.5) in cardiac myocyte preparations, as well as in fast-twitch and slow-twitch skeletal muscle fibres.
Peak absolute power outputs declined significantly as Ca2+ activation levels were progressively reduced from maximal to 30 %P4.5 in all three striated muscle types, with the greatest change in fast-twitch fibres. In cardiac myocyte preparations, even peak relative power output progressively fell when Ca2+ activation levels were lowered to ≈70, 50 and 30 %P4.5. Peak relative power output also progressively fell in fast-twitch fibres as Ca2+ activation levels were lowered from maximal down to 50 %P4.5. However, in slow-twitch fibres, peak relative power output decreased only at 70 %P4.5 and then remained unchanged with further reductions in Ca2+ activation levels. The greater Ca2+ dependence of peak relative power output in cardiac myocytes and fast-twitch fibres may arise from a shared mechanism such as cooperative inactivation of the thin filament, which is likely to be slowest in less cooperative slow-twitch fibres.
During submaximal Ca2+ activations, the time course of shortening became markedly curvilinear during isotonic shortening in all three muscle types. The progressive slowdown in shortening velocity during isotonic contractions was greatest in fast-twitch fibres, consistent with the higher degree of cooperativity of Ca2+ activation in fast-twitch fibres. Additionally, fast-twitch and slow-twitch fibre stiffness decreased in concert with the curvature of length traces during loaded shortening. These results are consistent with the idea that cooperative inactivation of the thin filament occurs during loaded shortening and such a mechanism may contribute to the progressive slowing and overall Ca2+ dependence of loaded shortening velocity.
At the onset of systole, cardiac myofilaments are Ca2+ activated and first contract against nearly isometric loads. The cardiac myofilaments remain Ca2+ activated during ejection and, during this phase of the cardiac cycle, myofilaments contract against a nearly constant arterial pressure, i.e. the myofilaments undergo loaded shortening. Despite the physiological importance of these isotonic contractions, little is known about the mechanisms that regulate isotonic contractions and power output in cardiac myocytes. One likely physiological modulator of isotonic contractions is activator Ca2+, in that the levels of Ca2+ vary on a beat-to-beat basis in the heart. This study tested the hypothesis that activator Ca2+ tightly regulates loaded shortening and power output in cardiac myocytes, which was tested by measuring load dependence of shortening velocity and power output at four different levels of Ca2+ activation in skinned rat cardiac myocyte preparations. The Ca2+ dependence of these mechanical properties was also measured in rat fast-twitch and slow-twitch skinned skeletal muscle fibres in order to gain additional insight(s) into potential mechanisms by which Ca2+ regulates loaded shortening and power output.
During submaximal Ca2+ activations, velocity of shortening has been shown to slow throughout isotonic contractions in cardiac muscle preparations (Brenner, 1986; Sweitzer & Moss, 1993; McDonald et al. 1998) as well as in skeletal muscle fibre preparations (Podolsky & Teichholz, 1970; Moss, 1982; Brenner, 1986; Podolin & Ford, 1986). Several mechanisms may be involved to bring about the progressive slowing of velocity as shortening proceeds, including (1) passive elastic elements that arise from elements in parallel with the cross-bridges (Brenner, 1986; Granzier & Irving, 1995), (2) elasticity associated with compliant end attachments to the muscle (Seow & Ford, 1992), (3) a cross-bridge-dependent internal load that arises from slowly detaching cross-bridges (Moss, 1986), and (4) cooperative inactivation of the thin filament as the muscle shortens (Edman, 1975; Gulati & Podolsky, 1981; Iwamoto, 1998). The second aim of this study was to examine the nature of these curvilinear length traces in the three muscle types and specifically test the hypothesis that curvilinear shortening during isotonic contractions arises, in part, from cooperative inactivation of the thin filament as muscle shortens.
This work has been described in part in abstract form (Herron & McDonald, 1999; McDonald, 2000).
METHODS
Cardiac myocyte preparation
Myocytes were obtained by mechanical disruption of hearts from Sprague-Dawley rats as described previously (McDonald et al. 1998). Rats were placed in a small air-tight chamber, anaesthetized by inhalation of methoxyflurane, and their hearts quickly removed and placed in ice-cold relaxing solution. The hearts were cut into 2–3 mm pieces and further disrupted for 5–10 s using a Waring blender. The resulting suspension of cells and cell fragments was centrifuged for 105 s at 165 g. The myocytes were subsequently skinned by suspending the pellet for 4 min in 0.3 % ultrapure Triton X-100 (Pierce Chemical Co.) in relaxing solution. The pellet was washed twice with cold relaxing solution, and the skinned cells were then resuspended in 10–20 ml of relaxing solution and kept on ice during the day of the experiment.
Skeletal muscle fibre preparation
Skeletal muscle fibres were also obtained from Sprague-Dawley rats anaesthetized by inhalation of methoxyflurane. Rats were subsequently killed by administering an overdose of nembutal and thoracotomy. Fast-twitch and slow-twitch skeletal muscle fibres were obtained from the psoas and soleus muscles, respectively. The muscles were isolated and placed in relaxing solution at 4°C, and bundles of ∼50 fibres were separated, tied to capillary tubes and stored in relaxing solution containing 50 % (v/v) glycerol for up to 4 weeks. Single fibres for mechanical measurements were dissected by gently pulling them from the end of the bundle (McDonald & Fitts, 1993).
Experimental apparatus
The experimental apparatus for physiological measurements of myocyte preparations and skeletal muscle fibres was similar to one previously described in detail (Moss, 1979) and recently modified for cardiac myocyte preparations (McDonald et al. 1998). Briefly, myocyte/fibre preparations were attached between a force transducer and torque motor by placing the ends of the myocyte preparation into stainless steel troughs (25 gauge). The ends of the myocyte/fibre preparations were secured by overlaying a 0.5 mm length of 4–0 monofilament nylon suture (Ethicon, Inc.) onto each end of the myocyte, and then tying the suture into the troughs with two loops of 10–0 monofilament (Ethicon, Inc). The attachment procedure was performed under a stereomicroscope (∼×100 magnification) using finely shaped forceps. The dimensions of the myocyte/fibre preparations are provided in Table 1. The sarcomere length of these preparations was set to yield passive forces slightly above zero. In all instances, passive forces were set to <1 % of peak force (i.e. P4.5) prior to transferring preparations to Ca2+ activation solutions for isotonic contractions.
Table 1.
Muscle preparation characteristics
| Sarcomere length | |||||||
|---|---|---|---|---|---|---|---|
| n | Length (μm) | Width (μm) | pCa 9.0 (μm) | pCa 4.5 (μm) | Maximum force (μN) | Peak power output (μW mg−1) | |
| Cardiac myocytes | 8 | 138 ± 36 | 20 ± 4 | 2.29 ± 0.06 | 2.27 ± 0.05 | 9.4 ± 3.5 | 3.21 ± 1.60 |
| Fast-twitch fibres | 6 | 929 ± 125 | 79 ± 10 | 2.68 ± 0.07 | 2.54 ± 0.06 | 395 ± 70 | 12.0 ± 3.8 |
| Slow-twitch fibres | 5 | 1200 ± 208 | 88 ± 10 | 2.38 ± 0.14 | 2.31 ± 0.12 | 485 ± 62 | 2.72 ± 0.68 |
Values are means ± s. d.
Prior to mechanical measurements the experimental apparatus was mounted on the stage of an inverted microscope (model IX-70, Olympus Instrument Co., Japan), which was placed upon a pneumatic vibration isolation table having a cut-off frequency of -1 Hz. Mechanical measurements were performed using a capacitance-gauge transducer (Model 403 – sensitivity of 20 mV mg−1 and resonant frequency of 600 Hz; or Model 400 – sensitivity of 2 mV mg−1 and resonant frequency of 1000 Hz; Cambridge Technology, Inc., Cambridge, MA, USA). Length changes during mechanical measurements were introduced at one end of the preparation using a DC torque motor (model 308, Cambridge Technology) driven by voltage commands from a personal computer via a 12 bit D/A converter (AT-MIO-16E-1, National Instruments Corp., Austin, TX, USA). Force and length signals were digitized at 1 kHz using a 12-bit A/D converter and each was displayed and stored on a personal computer using custom-made software based on LabView for Windows (National Instruments Corp.).
Images of the skinned myocyte preparations were recorded on videotape using a Hamamatsu CCD camera (model 2400) and a Mitsubishi VHS recorder (HS-u780). Videomicroscopy was done using a ×40 objective (Olympus UWD 40) and a ×2.5 intermediate lens. After each experiment, the videotape was played back to allow measurement of sarcomere length of the myocyte while relaxed and during activation.
Solutions
Compositions of relaxing and activating solutions used in mechanical measurements were as follows: 7 mM EGTA, 1 mM free Mg2+, 20 mM imidazole, 4 mM MgATP, 14.5 mM creatine phosphate, pH 7.0, various Ca2+ concentrations between 10−9 M (relaxing solution) and 10−4.5 M (maximal Ca2+ activating solution), and sufficient KCl to adjust ionic strength to 180 mM. The final concentrations of each metal, ligand and metal-ligand complex at 12°C were determined with the computer program of Fabiato (1988). Preceding each activation, myocyte preparations were immersed for 30 s in a solution of reduced Ca2+-EGTA buffering capacity, which was identical to normal relaxing solution except that EGTA was reduced to 0.5 mM. This protocol resulted in more rapid development of steady-state force during subsequent activation and helped preserve the striation pattern during activation. Relaxing solution in which the ventricles were mechanically disrupted and myocytes resuspended contained 2 mM EGTA, 5 mM MgCl2, 4 mM ATP, 10 mM imidazole and 100 mM KCl at pH 7.0.
Force-velocity and power-load measurements
All mechanical measurements were made at 12°C. For force-velocity and power-load measurements, a servo-system incorporating integrative gain feedback (Cambridge Technology) was used to control the load on the myocyte preparation (Sweitzer & Moss, 1993; McDonald et al. 1998). Muscle force was controlled by comparing the force transducer output to a command signal generated by the computer via the D/A board. The protocol for measuring force-velocity curves involved first transferring the myocyte preparation into pre-activating solution (30 s) and then into activating solution. Once steady-state force developed, the computer switched the comparator circuit from length control to force control by applying a 5 V logic pulse. The myocyte preparation was then stepped to a specified force less than steady state. Force was maintained constant for a designated period of time (100-300 ms) during which the length change was continuously monitored (Fig. 1). Following the force clamp, the myocyte preparation was slackened to reduce force to near zero to allow estimation of the relative load sustained during isotonic shortening, after which the myocyte preparation was re-extended to its initial length. Because of the short lengths of the myocyte preparations, the rapid length change introduced after isotonic shortening did not always slacken (i.e. buckle) the preparation to yield a baseline force value. This resulted in an underestimation of peak force in many cases and, thus, relative force during loaded contractions. To obtain more accurate estimates of relative forces borne during loaded contractions, relative forces were calculated by interpolating peak force from activations performed before and after the series of loaded contractions.
Figure 1. Length and force traces of a maximally Ca2+-activated cardiac myocyte preparation.
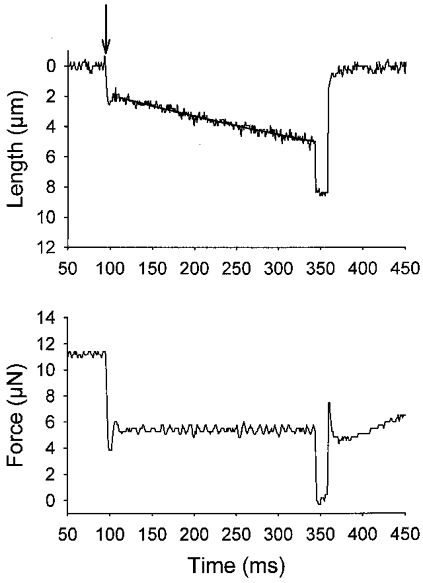
In this example, force was clamped to ≈50 % isometric force using an integrative gain feedback circuit. The length trace was fitted using a decaying exponential equation and loaded shortening velocity was calculated as the tangent to the fitted curve extrapolated back to the onset of the force clamp (i.e. time = 0 ms, which is indicated by the arrow). The force was clamped for 250 ms, after which the myocyte preparation was rapidly slackened and after 15 ms the preparation was relengthened to its original length.
To test the effects of variable Ca2+ activations on force-velocity and power-load curves, a series of isotonic contractions was first performed in a myocyte preparation during maximal activation (pCa 4.5). The myocyte preparation was then activated in a series of solutions to determine the pCa that yielded approximately 70, 50 and 30 % maximum force (P4.5). The pCa solution required to obtain a given fraction of maximum force (P4.5) varied from preparation to preparation, even within the same muscle type (see s.d. bars in Fig. 2); the range of pCa solutions used to obtain a given fraction of P4.5 are provided in Table 2. The myocyte preparation was then transferred into a pCa solution yielding submaximal force and a second series of isotonic shortening contractions was performed. This protocol was repeated to obtain a series of isotonic contractions in at least three different submaximal Ca2+ activating solutions.
Figure 2. Tension-pCa relationships.
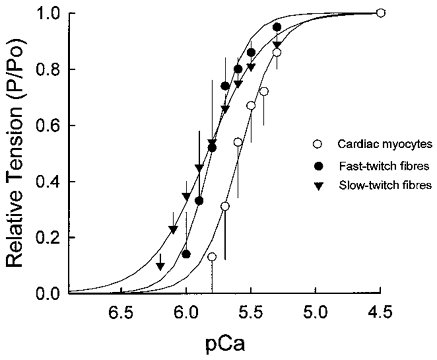
Mean (±s.d.) tension-pCa relationships for cardiac myocytes (○), fast-twitch skeletal muscle fibres (•), and slow-twitch skeletal muscle fibres (▾). Steepness of the tension-pCa relationships was quantified for Ca2+-activated forces of <=50 %P4.5 (i.e. Hill coefficient, n2) since most of the cooperative activation of the thin filament is apparent at these forces. The Hill coefficients (n2, mean ±s.d.) were 5.45 ± 2.39 for cardiac myocytes, 9.80 ± 1.10 for fast-twitch fibres and 2.54 ± 0.30 for slow-twitch fibres, indicative of a higher cooperativity of Ca2+ activation in fast-twitch fibres and cardiac myocyte preparations than in slow-twitch fibres.
Table 2.
Force-velocity and power output characteristics during maximal and submaximal Ca2+ activations
| pCa range | Relative force (P/P4.5) | Vmax (MLs−1) | Force optimum (p/Po) | Absolute power output (μW mg−1) | Peak relative power output (P/Po MLs−1) | |
|---|---|---|---|---|---|---|
| Cardiac myocytes (n = 8) | 4.5 | 1.0 | 1.27 ± 0.43 | 0.28 ± 0.03 | 3.24 ± 1.53 | 0.095 ± 0.026 |
| 5.6–5.4 | 0.70 ± 0.08 | 0.83 ± 0.26* | 0.30 ± 0.05 | 1.76 ± 1.09* | 0.071 ± 0.022* | |
| 5.7–5.5 | 0.51 ± 0.06 | 0.69 ± 0.18* | 0.30 ± 0.06 | 1.08 ± 0.55*† | 0.062 ± 0.023*† | |
| 5.8–5.6 | 0.27 ± 0.06 | 0.40 ± 0.17*†‡ | 0.37 ± 0.08*‡ | 0.49 ± 0.36*†‡ | 0.050 ± 0.026*†‡ | |
| Fast-twitch fibres (n = 6) | 4.5 | 1.0 | 2.00 ± 0.35 | 0.25 ± 0.02 | 11.98 ± 3.76 | 0.131 ± 0.034 |
| 5.8–5.6 | 0.74 ± 0.06 | 0.90 ± 0.27* | 0.31 ± 0.04* | 5.75 ± 1.98* | 0.085 ± 0.024* | |
| 5.9–5.7 0 | 57 ± 0.07 | 0.50 ± 0.20*† | 0.37 ± 0.04*† | 3.61 ± 1.33*† | 0.069 ± 0.016*† | |
| 6.0–5.8 | 0.25 ± 0.05 | 0.43 ± 0.10*† | 0.36 ± 0.06*† | 1.14 ± 0.48*†‡ | 0.055 ± 0.001*† | |
| Slow-twitch fibres (n = 5) | 4.5 | 1.0 | 0.94 ± 0.41 | 0.18 ± 0.03 | 2.70 ± 0.70 0 | 030 ± 0.003 |
| 5.8–5.6 | 0.65 ± 0.03 | 0.43 ± 0.10* | 0.23 ± 0.03* | 1.27 ± 0.41* | 0.021 ± 0.003* | |
| 6.0–5.8 | 0.50 ± 0.06 | 0.52 ± 0.23* | 0.22 ± 0.05 | 0.96 ± 0.27* | 0.022 ± 0.002* | |
| 6.1–6.0 | 0.25 ± 0.07 | 0.40 ± 0.13* | 0.24 ± 0.03* | 0.54 ± 0.15*†‡ | 0.022 ± 0.002* |
ML, muscle length. Values are means ± s. d.
P < 0.05vs.P/P4.5 = 1.0
P< 0.05 vs. P/P4.5 = 0.70
P < 0.05 vs.P/P4.5 = 0.50.
Ten to twenty-five force clamps were performed on a myocyte/fibre preparation activated with a given pCa solution. Typically, myocyte/fibre preparations could be kept in activating solution (duration 2 to 10 min) throughout the entire series of force clamps without significant loss of force. If maximal force fell below 75 % throughout the different series of force clamps, the preparation was discarded.
Fibre stiffness during isotonic shortening
Fibre stiffness was assessed in a subgroup of slow-twitch (n = 5) and fast-twitch fibres (n = 5) during submaximal Ca2+ activations (∼0.20P4.5) at various times during lightly loaded (∼0.20P0) contractions. Fibre stiffness was measured by applying a small lengthening step (0.3-0.6 % of fibre segment length or ∼4-5 nm per half-sarcomere; duration of length change, 0.5-1 ms) at a specified time into a load clamp and measuring the resultant change in force (see Figs 6 and 7). At the end of each load clamp the fibre preparation was re-extended to its isometric length and the procedure for measuring fibre stiffness was repeated to obtain several stiffness measurements at particular time points of loaded shortening. This procedure for measuring fibre stiffness yielded isometric fibre stiffness values very similar to those previously reported for mammalian skeletal muscle fibres (Metzger & Moss, 1990b; McDonald & Fitts, 1995). This method provided only an estimate of true fibre stiffness especially during shortening since the duration of length change was not likely to be fast enough to avoid phase 1 recovery of force, which has been shown to get faster during shortening (Ford et al. 1985). It is worth noting, however, that because of velocity dependence of force recovery, fibre stiffness was probably underestimated to a greater extent early during load clamps (when shortening velocities were faster) than later in the load clamps (when velocities were slowed). Overall, this would tend to underestimate the actual changes in stiffness (i.e. decrease in number of attached cross-bridges) during loaded shortening.
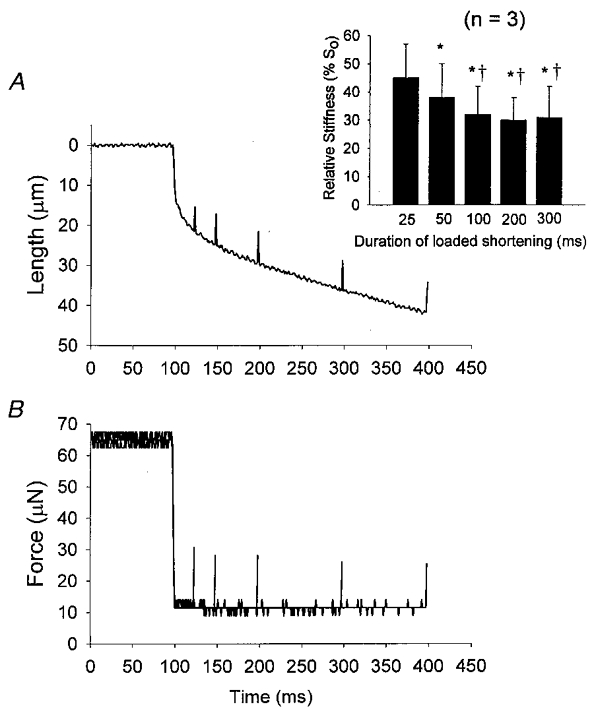
Figure 6. Effects of loaded shortening on the stiffness of a slow-twitch fibre during submaximal Ca2+ activation.
A, a length trace during a 300 ms load clamp (≈20 % of isometric force). Small length changes (≈0.4 % of fibre length) are superimposed at various times during the load clamp. B, force traces in response to the length changes. In this example, stiffness (ΔF/ΔL) was ≈16.00 N m−1 under isometric conditions and progressively decreased to 8.29, 7.11, 6.32 and 5.62 N m−1 after 50, 100, 200 and 300 ms of loaded shortening, respectively. The inset shows averaged changes in relative stiffness during loaded shortening for 5 slow-twitch fibre preparations. *P < 0.05vs. 50 ms, †P < 0.05vs. 100 ms.
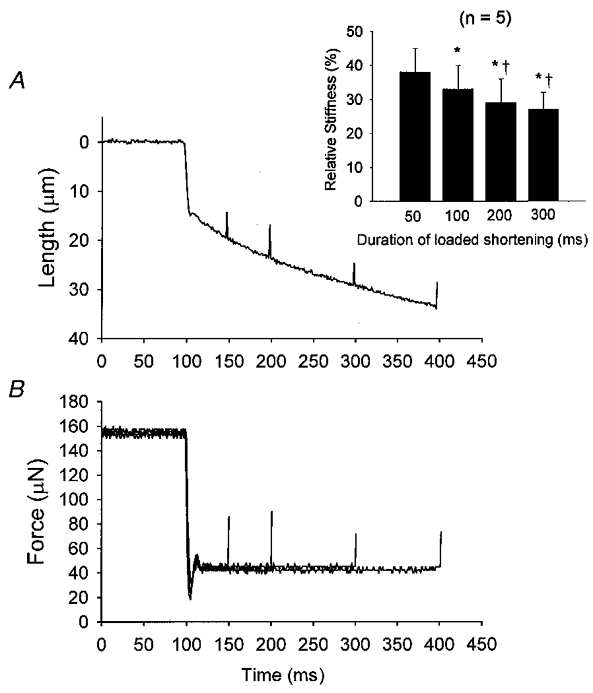
Figure 7. Effects of loaded shortening on the stiffness of a fast-twitch fibre during submaximal Ca2+ activation.
A, a length trace during a 300 ms load clamp (≈20 % of isometric force). Small length changes (≈0.4 % of fibre length) are superimposed at various times during the load clamp. B, force traces in response to the length changes. In this example, stiffness (ΔF/ΔL) was ≈5.00 N m−1 under isometric conditions and progressively fell to 3.16 and 2.26 N m−1 after 25 and 50 ms of loaded shortening, respectively. After 50 ms of shortening, fibre stiffness continued to decrease, although to a lesser extent, with additional shortening. Stiffness was 2.19 N m−1 after 100 ms, 1.98 N m−1 after 200 ms, and 1.89 N m−1 after 300 ms of loaded shortening. The inset shows averaged changes in relative stiffness during loaded shortening for 3 fast-twitch fibre preparations. *P < 0.05vs. 25 ms; †P < 0.05vs. 50 ms.
Data analysis
Myocyte/fibre preparation length traces were fitted to a single decaying exponential equation of the following form:
where L is cell length at time t, A is initial length, k is the rate constant of shortening (kshortening), and C is the length at which velocity became zero. Velocity of shortening at any given time, t, was determined as the slope of the tangent to the fitted curve at that time point. For this study, velocities of shortening were calculated at t = 0 ms (time = 0 is indicated by arrows in Figs 1 and 3-5).
Figure 3. Ca2+ dependence of isotonic shortening and power output in a skinned cardiac myocyte preparation.
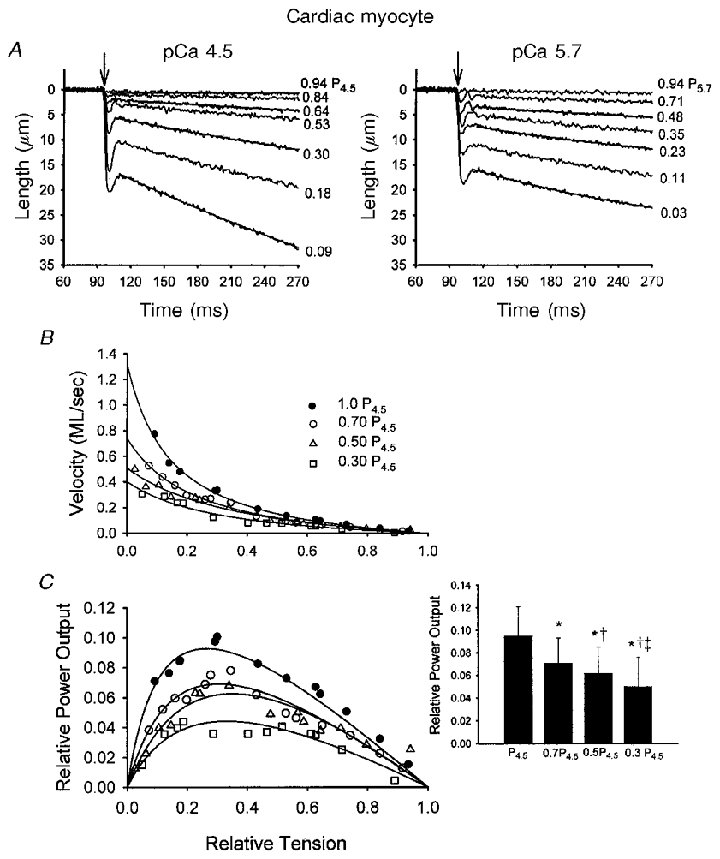
A, myocyte preparation length traces during different isotonic contractions at two different levels of Ca2+ activation (left, pCa 4.5; right, pCa 5.7). The percentage isometric force is written to the right of each length trace. The arrows indicate the onset of the force clamp. Fitted exponential curves are superimposed on every other length trace. The data were fitted using the equation L =Ae−kt+C as described in Methods. B, force-velocity relationships obtained during four different levels of Ca2+ activation in this myocyte preparation. As the level of activator Ca2+ was reduced, isometric force decreased; the relative forces (i.e. P/P4.5) are indicated. Reducing activator Ca2+ also resulted in a progressive downward shift in the force-velocity relationships (i.e. for a given relative load, shortening velocity was slower at lower Ca2+ activation levels). C, relative power-load relationships at the four different levels of Ca2+ activation in this myocyte preparation. There was a progressive reduction in power-load relationships as level of Ca2+ activation was reduced. The inset illustrates the changes in relative power output at different levels of Ca2+ activation for 8 cardiac myocyte preparations. *P < 0.05vs. P4.5; †P < 0.05vs. 0.7P4.5;‡P < 0.05vs. 0.5P4.5.
Figure 5. Ca2+ dependence of isotonic shortening and power output in a slow-twitch skeletal muscle fibre.
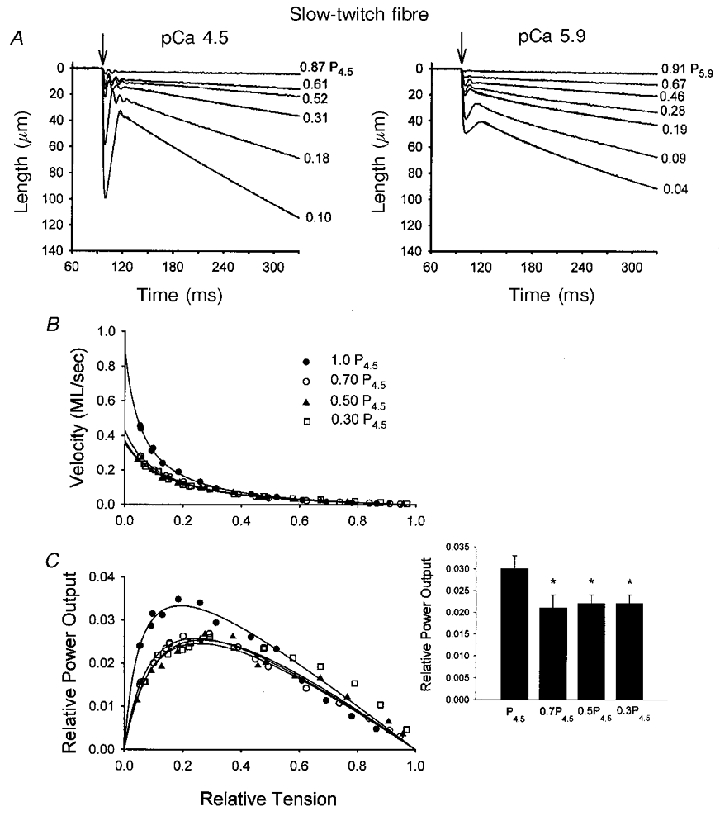
A, loaded shortening traces for a range of force clamps in pCa 4.5 and pCa 5.9 solutions. The arrows indicate the onset of the force clamp. Again, fitted decaying exponentials are superimposed on every other length trace using the equation L = Ae−kt+C. B, Ca2+ dependence of force-velocity relationships for this fibre preparation. As activator Ca2+ was reduced from maximal to yield ≈70 %P4.5, the force-velocity relationship shifted downward, but further reductions in activator Ca2+ elicited no additional changes in force-velocity curves. C, Ca2+ dependence of power-load relationships in this slow-twitch fibre preparation. The inset illustrates the changes in relative power output at different levels of Ca2+ activation for 5 slow-twitch fibre preparations. *P < 0.05vs. P4.5.
Hyperbolic force-velocity curves were fitted to the relative force-velocity data using the Hill equation (Hill, 1938):
where P is force during shortening at velocity V; Po is the peak isometric force; and a and b are constants with dimensions of force and velocity, respectively. Power-load curves were obtained by multiplying force by velocity at each load on the force-velocity curve. The optimum force for mechanical power output (Fopt) was calculated using the equation (Woledge et al. 1985):
Curve fitting was performed using a customized program written in Qbasic, as well as commercial software (SigmaPlot).
To determine whether there were significant effects on velocity or power due to variations in activator Ca2+ concentration, one-way repeated measures ANOVA was performed. One-way ANOVA was used to test for changes in fibre stiffness at different time points throughout a load clamp. The Student-Newman-Keuls test was used post hoc to assess differences among means. Student's t test was used to test for differences in rate constants of shortening (kshortening) between fast-twitch and slow-twitch fibres. P < 0.05 was chosen as indicating significance. All values are expressed as means ±s.d.
RESULTS
Ca2+ dependence of loaded shortening in cardiac myocyte preparations
The Ca2+ dependence of loaded shortening was examined by characterizing force-velocity and power-load curves during maximal Ca2+ activation (pCa 4.5) and three different submaximal Ca2+ activation levels in eight myocyte preparations. Figure 3 illustrates the Ca2+ dependence of loaded shortening and relative power output (normalized for isometric force) from a skinned cardiac myocyte preparation. During both maximal and submaximal Ca2+ activations, shortening velocities became faster as loads were reduced. Decreasing the level of Ca2+ elicited two clear differences in loaded shortening of cardiac myocyte preparations. First, the time course of shortening became considerably more curvilinear especially at low loads, i.e. velocity progressively slowed as shortening continued (see top panel of Fig. 3). Second, shortening velocity slowed at nearly all relative loads. This is demonstrated more clearly in Fig. 3b, which shows force-velocity relationships obtained during four different levels of Ca2+ activation in this particular myocyte preparation. As the level of activator Ca2+ was reduced, isometric force decreased and there was a progressive downward shift in the force-velocity relationships. Figure 3C shows relative power-load relationships at the four different levels of Ca2+ activation. Power output was calculated by multiplying relative force by velocity. Thus, as with the force-velocity curves, there was a progressive depression in relative power-load curves as the level of Ca2+ activation was reduced. Force-velocity and power output characteristics are presented in Table 2 for eight paired myocyte preparations. Reducing the level of Ca2+ activation caused a progressive reduction in absolute peak power output (μW mg−1) and also in power output normalized to isometric force generated in the different pCa solutions (Table 2 and Fig. 3C inset).
Ca2+ dependence of loaded shortening in fast-twitch and slow-twitch skeletal muscle fibres
The Ca2+ dependence of loaded shortening was also examined in fast-twitch and slow-twitch skinned skeletal muscle fibres. Figure 4 illustrates the Ca2+ dependence of loaded shortening and relative power output from a skinned fast-twitch skeletal muscle fibre isolated from rat psoas muscle. As with the cardiac myocyte preparations, decreasing the level of activator Ca2+ yielded more curvilinear length traces during shortening at low loads, as well as slowed shortening velocities at nearly all relative loads. Figure 4b shows force-velocity curves during four different levels of Ca2+ activation for this fast-twitch fibre. Consistent with the myocyte preparation, decreasing Ca2+ reduced isometric force and resulted in a progressive downward shift in the force-velocity relationships. The bottom panel shows that relative power-load curves were also progressively shifted downward with lower Ca2+. Force-velocity and power output characteristics for six fast-twitch fibres are presented in Table 2. Absolute peak power output progressively fell with lower levels of Ca2+ activation. Also, there was a progressive decrease in peak relative power output as the level of Ca2+ activation was reduced to yield 70 and 50 % of peak force (P4.5). However, unlike the example in Fig. 4, the averaged fall in peak relative power output did not reach statistical significance as isometric force was further reduced from 50 to 30 % peak force (P4.5) (Table 2 and Fig. 4C inset). These results indicate that power output is also highly regulated by activator Ca2+ in fast-twitch skeletal muscle fibres.
Figure 4. Ca2+ dependence of isotonic shortening and power output in a fast-twitch skeletal muscle fibre.
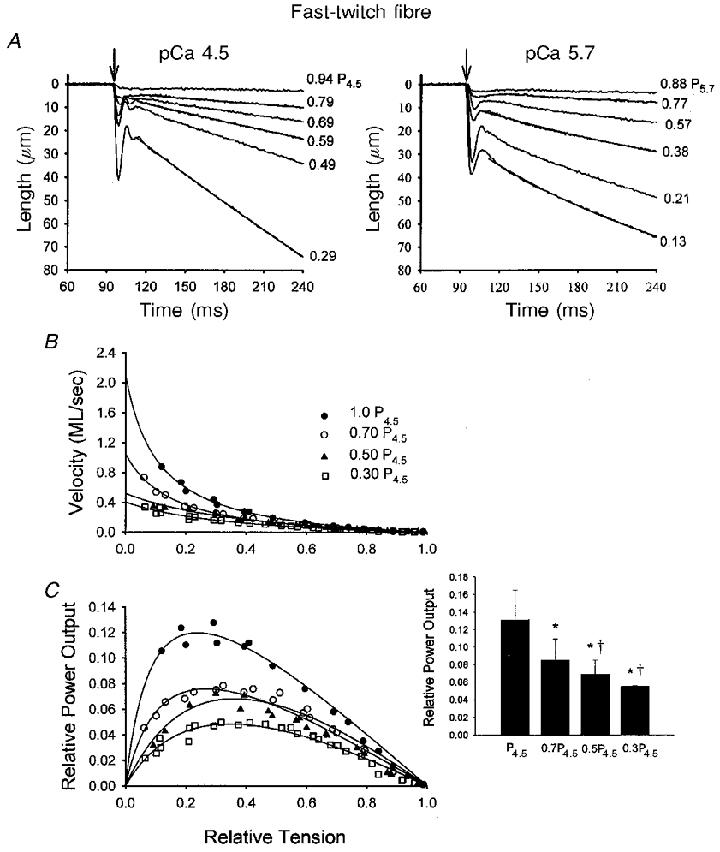
A, length traces during isotonic contractions over a range of loads in pCa 4.5 (left) and pCa 5.7 (right) solutions. The arrows indicate the onset of the force clamp. Fitted exponential curves are superimposed on every other length trace using the equation L = Ae−kt+C as described in Methods. B, force-velocity relationships during four different levels of Ca2+ activation in this fibre preparation. C, relative power-load curves as activator Ca2+ was progressively reduced. The inset illustrates the changes in relative power output at different levels of Ca2+ activation for 6 fast-twitch fibre preparations. The decline in relative power output did not reach statistical significance when relative force was reduced from 0.50P4.5 to 0.30P4.5. This differs somewhat from the example fast-twitch fibre preparation shown in the figure, in which relative power output appears to progressively fall over the four different levels of Ca2+ activation. *P < 0.05vs. P4.5; †P < 0.05vs. 0.7P4.5.
The Ca2+ dependence of loaded shortening is shown for a representative slow-twitch fibre from rat soleus in Fig. 5. Figure 5a shows fibre preparation length traces at various loads during maximal Ca2+ activation (pCa 4.5) and submaximal Ca2+ (pCa 5.9). Again, submaximal Ca2+ activation caused length traces to exhibit more curvilinearity during lightly loaded isotonic contractions and velocity of shortening was slower at comparable relative loads. Varying the level of Ca2+ activation, however, had a different effect on force-velocity curves in the slow-twitch fibres. In slow-twitch fibres, reducing Ca2+ to yield 70 % of peak force caused a downward shift in the force-velocity relationship, yet further reductions in Ca2+ had no additional effect on force-velocity curves. Consistent with this result, peak relative power output decreased as Ca2+ was reduced to yield 70 % of peak force but held constant even as Ca2+ was further reduced (Table 2 and Fig. 5 inset), indicating a clear difference in Ca2+ regulation in power output between muscle types. Absolute peak power output, however, did progressively fall in slow-twitch fibres as Ca2+ activation levels were reduced as a result of the decline in force associated with lower [Ca2+] (Table 2).
Potential mechanisms underlying curvilinear length traces observed during loaded shortening at submaximal Ca2+ activations
A consistent observation during isotonic shortening measurements was the greater curvature of length traces during submaximal Ca2+ activations. A number of potential mechanisms may underlie this progressive slowdown of muscle shortening during loaded shortening. These include passive and/or cross-bridge-dependent loads that arise during shortening that impede additional shortening. Another potential mechanism is the cooperative inactivation of the thin filament as muscle shortening proceeds (Iwamoto, 1998). According to this hypothesis, thin filaments are cooperatively inactivated as the muscle shortens, leaving fewer and fewer cross-bridges available to bear the fixed load. One potential means by which fewer cross-bridges can bear more load is by slowing down and increasing the proportion of time that cycling cross-bridges generate force (i.e. an increase in duty cycle). A consequence of slower cross-bridge cycling rates would be curvilinear length traces, similar to those observed in this study. To examine cooperative inactivation as a potential mechanism, advantage was first taken of the natural differences in cooperativity of steady-state Ca2+ activation between highly cooperative fast-twitch and less cooperative slow-twitch skeletal muscle fibre types (McDonald et al. 1997 and see Fig. 2). Assuming that cooperativity of Ca2+ activation is qualitatively similar to the cooperativity of thin filament inactivation, then the more highly cooperative fast-twitch fibres should exhibit more curvilinear length traces than slow-twitch fibres. Consequently, the hypothesis was tested that more cooperative muscle fibres (i.e. fast-twitch fibres) will exhibit greater curvature of length traces during isotonic contractions. This hypothesis was tested by comparing rate constants of shortening (kshortening) between fast-twitch and slow-twitch muscle fibres. Comparisons were made using kshortening values obtained only during submaximal Ca2+ activations (∼30 %P4.5), where traces were markedly curvilinear, and following the same degree of overall fibre shortening (fast-twitch fibres shortened 4.38 ± 0.91 % ML; slow-twitch fibres shortened 4.14 ± 0.75 % ML; P = 0.44). Consistent with the hypothesis, kshortening values were significantly greater in fast-twitch fibres (7.47 ± 2.11, n = 17) compared to slow-twitch fibres (5.45 ± 0.65, n = 14) (P = 0.002), a result that would be expected if cooperative inactivation of the thin filament contributes to curvilinear shortening.
To further test whether the number of attached cross-bridges decreases during loaded shortening (a process that may arise from cooperative inactivation of thin filaments), fibre stiffness was measured in a subgroup of slow-twitch fibres and fast-twitch fibres. In these experiments, fibres were submaximally Ca2+ activated (∼0.20P4.5) and underwent lightly loaded contractions (∼0.20Po) to induce curvilinear length traces. Fibre stiffness was measured at various times during shortening by applying a small lengthening step (0.3-0.6 % of fibre segment length or ∼4-5 nm per half-sarcomere). Examples of lengthening traces and resultant changes in force are shown in Fig. 6 for a slow-twitch fibre preparation. In this preparation, fibre stiffness progressively decreased from 16.1 ± 0.6 N m−1 during isometric conditions to 7.5 ± 0.5, 6.9 ± 0.3, 6.4 ± 0.3 and 5.5 ± 0.5 N m−1, at times 50, 100, 200 and 300 ms into shortening, respectively (n = 3-11 for each time point, P < 0.05 for each time point except between 100 and 200 ms). Assuming stiffness is proportional to the number of strongly bound cross-bridges, these results imply fewer cross-bridges are attached to the thin filament as shortening proceeds. Overall, for slow-twitch fibres (n = 5) stiffness fell to 38 ± 7, 33 ± 7, 29 ± 7 and 27 ± 5 % of isometric stiffness at 50, 100, 200 and 300 ms of shortening, respectively (Fig. 6 inset). Next, since loaded shortening velocities were nearly constant during maximal Ca2+ activations (i.e. length traces were nearly linear), it stands to reason that thin filament activation levels should remain nearly constant and, thus, fibre stiffness should be unaffected during loaded shortening of a maximally Ca2+-activated fibre. This was also borne out experimentally; during maximal Ca2+ activation of a slow-twitch fibre preparation, fibre stiffness was 22.2 ± 1.8 N m−1 under isometric conditions and decreased to 14.1 ± 1.8 N m−1 in response to a 20 % load clamp yet remained unchanged (13.8 ± 1.5 N m−1) throughout 400 ms of shortening (traces not shown).
To further test the idea that the number of attached cross-bridges decreases during loaded shortening, fibre stiffness was estimated in a subgroup of submaximally Ca2+-activated fast-twitch fibres (n = 5). In fast-twitch fibre preparations, stiffness also fell during loaded shortening, but only during the first 50–100 ms of shortening and then remained unchanged with additional shortening. The fall in stiffness coincided with the portion of the length trace that exhibited the greatest curvature (see Fig. 7). Stiffness was not significantly reduced at later times of shortening (e.g. 100- 300 ms), which might be expected given the reduced curvature over this region of the length trace. For fast-twitch fibres (n = 5) stiffness fell to 36 ± 9, 31 ± 8, 29 ± 7 and 28 ± 8 % of isometric stiffness at 50, 100, 200 and 300 ms of shortening, respectively (Fig. 7 inset). In three fast-twitch fibres, stiffness was also measured at 25 ms into shortening, which yielded 45 ± 12 % isometric stiffness, indicating that the largest change in stiffness occurred early into loaded shortening where the length trace was most curved (see Fig. 7 inset). Overall these results on slow-twitch and fast-twitch fibre stiffness are consistent with the idea that a reduced number of strongly bound cross-bridges, perhaps induced by cooperative inactivation of the thin filaments, contributes to the curvilinear length traces seen during submaximal Ca2+ activations.
DISCUSSION
Ca2+ dependence of loaded shortening in skinned cardiac myocyte preparations
Increased activator Ca2+ has previously been shown to elicit increases in power output and/or faster shortening velocities in intact mammalian heart muscle preparations during twitch contractions (Sonnenblick, 1962; Brutsaert et al. 1973; Martyn et al. 1983; Daniels et al. 1984; Chiu et al. 1989; De Tombe & ter Keurs, 1992). In particular, the studies of ter Keurs and co-workers (Daniels et al. 1984; De Tombe & Ter Keurs, 1990) examined the Ca2+ dependence of lightly loaded shortening velocity at the level of the sarcomeres in intact rat trabeculae preparations. Shortening velocity progressively rose with increased [Ca2+]o, reaching a plateau at [Ca2+]o that yielded ∼65 % of peak twitch force. The present study used a skinned cardiac myocyte preparation to examine the subcellular basis by which Ca2+ modulates loaded shortening and power output in the heart. Both loaded shortening velocities and power output were very tightly regulated by Ca2+ in skinned cardiac myocyte preparations, providing a myofibrillar basis for the previously observed Ca2+ regulation of myocardial shortening velocity.
The Ca2+ dependence of isotonic shortening has been previously studied in skinned cardiac muscle preparations, with the nature of these effects being variable. Lowering activator Ca2+ has been reported to slow (Brutsaert et al. 1973; Maughan et al. 1978), elicit no change (Brenner, 1980), or speed (Sweitzer & Moss, 1993) isotonic shortening velocities when instantaneous shortening velocity is taken at the onset of the load clamp. The exact reasons for the variability in these and the present results are unknown. One possible explanation is variations in passive tension levels prior to the onset of isotonic contractions, previously discussed by Sweitzer & Moss (1993). Passive elastic elements would first facilitate shortening by unloading the contractile elements, which would yield faster shortening than could be supported by the contractile elements alone. However, later in the load clamp the passive elements would be shortened and unable to bear any load; at this point shortening velocity would be reflective of cross-bridge cycling rates only. In fact, when shortening velocities are measured later in the load clamps they are consistently slower during submaximal Ca2+ activations than during maximal Ca2+ activations. In the present experiments, effects related to passive extracellular and intracellular elastic elements were minimized by using single myocyte preparations that lacked extracellular elements and by reducing resting tensions to very low levels (<1 % peak force). Under these experimental conditions, loaded shortening velocities progressively slowed with lower Ca2+ activation levels, even when shortening velocities were measured at the onset of the load clamp, providing evidence that Ca2+ alters loaded cross-bridge cycling rates.
The exact mechanisms are unclear as to how Ca2+ alters initial loaded shortening velocities in cardiac muscle. Ca2+ may directly modulate myosin cross-bridge cycling kinetics, a process perhaps mediated by the regulatory light chain (Diffee et al. 1996). Alternatively, decreased activator [Ca2+] may slow shortening velocities indirectly by reducing thin filament activation levels. Lowering [Ca2+] would lower steady-state thin filament activation levels as well as allow additional reductions in activation levels at the onset of muscle shortening by cooperative deactivation processes such as reduced cross-bridge binding and reduced thin filament affinity for Ca2+ (Hofmann & Fuchs, 1987). Consistent with this indirect Ca2+ mechanism, increasing thin filament activation levels (using NEM-S1) at the same activator [Ca2+] yields faster shortening velocities in skinned cardiac myocytes (McDonald & Moss, 1998). Along these lines, De Tombe & ter Keurs (1992) provided evidence that a passive internal viscous load exists in intact myocardium, at least during variable speed sarcomere lengthening. The authors suggested that shortening velocity at low loads was limited by this passive viscosity, which may arise from compression of titin molecules. Thus, Ca2+ dependence of initial shortening velocities may result from fewer cross-bridges being available to shorten against a passive viscous load and/or other internal loads (e.g. negatively strained cross-bridges) when thin filament activation levels are reduced by lower [Ca2+]. Consistent with this idea, Josephson & Edman (1998) recently reported that isotonic shortening velocities at very light loads were slower during early relaxation of tetanic contractions, i.e. when thin filaments are being inactivated, than during the beginning or plateau of contraction, when thin filaments are being activated or are completely activated.
Ca2+ dependence of loaded shortening in three different types of skinned striated muscle
This study found a Ca2+ dependence of loaded shortening and relative power output not only in skinned cardiac myocyte preparations but also in both fast-twitch and slow-twitch skeletal muscle fibres. Several previous studies have reported slower loaded shortening velocities during submaximal Ca2+ activations in skinned amphibian (Julian, 1971; Julian & Moss, 1981) and mammalian skeletal muscle fibres (Moss, 1982), but this remains controversial as similar studies using skinned amphibian (Podolsky & Teichholz, 1970; Podolin & Ford, 1986) and mammalian (Ford et al. 1991) muscle fibres showed no Ca2+ dependence. The exact reasons for these differences remain unclear with potential explanations reviewed by Podolin & Ford (1983, 1986) and Moss (1992).
The decline in both absolute and relative peak power output was greatest in fast-twitch fibres, intermediate in cardiac myocyte preparations, and least in slow-twitch fibres as Ca2+ activation levels were reduced. Interestingly, lowering [Ca2+] yielded a more progressive fall of loaded shortening and relative power output in cardiac myocytes and fast-twitch fibres than in slow-twitch fibres. This result may at first seem somewhat surprising since physiologically both myocardium and slow-twitch muscle exhibit more graded contractile responses, whereas fast muscle yields more explosive, all-or-none contractile responses. However, it is becoming clear that contraction of skinned myocardial preparations is regulated in a manner that more closely resembles fast-twitch fibres than slow-twitch fibres. For example, the cooperativity of Ca2+-activated isometric force (Fig. 2), and the Ca2+ dependence of rate of isometric force development (Metzger & Moss, 1990a, 1991; Vannier et al. 1996) are more similar between cardiac and fast-twitch fibre preparations than between cardiac and slow-twitch fibre preparations. The exact molecular mechanisms that convey different Ca2+ dependencies of these processes are unknown. One potential mechanism may involve the cooperative activation/inactivation of thin filaments, which appears to be more similar between fast-twitch and cardiac muscle and considerably less in slow-twitch muscle. Any number of thin and thick filament molecules may be involved in manifesting these differences in cooperativity of Ca2+ activation and Ca2+ dependence of power output. Determining which molecules or combination of molecules mediate these Ca2+-dependent effects will necessitate systematic expression of specific protein isoforms into an otherwise constant myofibrillar lattice.
Slowdown in muscle shortening velocities during isotonic contractions
A prevalent characteristic during isotonic contractions was the slowing of shortening velocity with time. During maximal Ca2+ activations, myocyte/fibre shortening traces showed only slight curvature during isotonic contractions even at low loads (<30 % isometric force). The mechanism(s) underlying this minimal slowdown in shortening velocity is unknown, but may involve a fixed internal load that is independent of Ca2+ activation levels, presumably due to passive elastic elements (Brenner, 1986; Granzier & Irving, 1995). In contrast, when Ca2+ activation levels were reduced, length traces became substantially more curvilinear. Several explanations have previously been suggested to explain curvilinear length traces. These include, as mentioned above, passive elastic elements in parallel with cross-bridges, which would tend to retard shortening by transferring load to the cross-bridges and, with further shortening, would actually become compressed and produce a force that opposes shortening. If passive elastic elements are involved in curvilinear shortening, their contribution appears to be minimal since length traces were nearly linear even during very low load clamps in maximally Ca2+-activated myocyte/fibre preparations. This implies that additional factors underlie the curvature of length traces during submaximal Ca2+ activations. One potential factor is series compliance arising from the points of myocyte/fibre attachment. Series end compliance could contribute to curvilinear shortening if, as proposed by Seow & Ford (1992), shortening of the end elements is damped so that shortening extends into the measurement period. Like fixed elastic elements, damped recoil of end elements would first speed velocity of shortening by unloading contractile elements, but then cause slower velocity after the elements shorten and no longer bear any load. This effect should be greater (i.e. more curvature) the greater the stretch of the compliant ends. However, since curvature of length traces increased at lower Ca2+ activation levels, damped recoil of stretched ends is not likely to account for the curvature. Consistent with this, curvilinear shortening can be significantly reduced at constant end compliance by the addition of NEM-S1 to cardiac myocyte preparations (McDonald, 2000).
A third mechanism that may yield curvilinear shortening is an internal load that arises from slowly detaching cross-bridges during submaximal Ca2+ activations (Moss, 1986). According to this idea, at the onset of muscle shortening, slowly detaching or long-lived cross-bridges bear a minimal compressive load, but with further shortening these cross-bridges remain attached and bear a considerable load that retards shortening. This activation-dependent cross-bridge load has been proposed to explain the characteristic biphasic shortening pattern in slack-test plots of unloaded shortening (Moss, 1986), and could also contribute to the time course of loaded shortening traces (McDonald & Moss, 1998).
A fourth potential mechanism to explain curvilinear shortening involves the cooperative activation of the thin filament by strongly bound cross-bridges. Strongly bound cross-bridges increase the tendency of a seven actin-one tropomyosin functional unit to make the transition from the closed to the open state (Bremel & Weber, 1972; Lehrer, 1994). Since the number of strongly bound cross-bridges is lowered during active shortening (Julian & Sollins, 1975; Ford et al. 1985), it would be predicted that the level of thin filament activation would decrease, thereby reducing the number of cycling cross-bridges available to bear a given afterload. One way for fewer cross-bridges to bear a constant load would be to slow down and generate more force per remaining cross-bridge. This hypothesis that cooperative inactivation of the thin filament plays a role in determining velocity of shortening at submaximal [Ca2+] was recently supported in rabbit fast-twitch skeletal muscle fibres (Iwamoto, 1998). In these experiments, the number of strongly bound cross-bridges was reduced by using a repetitive isotonic shortening protocol. Reduction of the number of strongly bound cross-bridges reversibly eliminated an initial fast component of shortening that was present in the first isotonic contraction prior to repetitive shortening. The author concluded that velocity of shortening was slowed following cooperative inactivation of the thin filament induced by a reduction in the number of strongly bound cross-bridges. If cooperative inactivation of the thin filament contributes to curvilinear length traces, two predictions can be made: (1) fast-twitch fibres, which possess the greatest degree of cooperative activation, should exhibit the greatest curvilinear length traces and (2) the stiffness of the fibre, which reflects the number of strongly bound cross-bridges should decrease throughout isotonic shortening. These hypotheses were tested in this study and, consistent with the hypotheses, the more cooperative fast-twitch fibres exhibited the greatest curvature of length traces during lightly loaded contractions. Also during submaximal Ca2+ activations, the stiffness of both slow-twitch and fast-twitch fibres progressively fell during isotonic shortening. Both of these results are consistent with the idea that cooperative inactivation of the thin filament acts to slow muscle shortening velocities during loaded contractions. These results, however, do not exclude other mechanisms that may also be involved in slowing muscle shortening velocity, such as passive internal loads, cross-bridge-dependent loads, or the translation of inactivated regions of the thin filament into the areas of cross-bridge overlap as the muscle shortens from isometric lengths (Swartz et al. 1996). In fact, the latter mechanism is also consistent and could exclusively explain the finding that fibre stiffness falls during loaded shortening.
One interesting question relating to curvilinear shortening is to what extent it occurs in intact muscle. Isotonic sarcomere shortening appeared nearly linear over a sarcomere length range of 2.1 to 1.9 μm at both high and low levels of [Ca2+] in intact myocardium (Daniels et al. 1984; De Tombe & Ter Keurs, 1990). This is consistent with length traces observed during maximal Ca2+ activation of skinned muscle preparations, but inconsistent with the greater curvature observed during submaximal Ca2+ activations. It is possible that the increased swelling of the myofilament lattice or loss of specific cofactors associated with skinning may enhance curvilinear shortening in skinned muscle preparations. In intact skeletal muscle preparations, isotonic traces also appear linear (Eddinger et al. 1986; Edman, 1988; Granzier et al. 1989). This is in agreement with skinned skeletal muscle fibre results obtained during maximal Ca2+ activations since studies on intact muscle used tetanic contractions, where thin filament activation levels were maximal. It would be interesting to see whether isotonic shortening becomes curvilinear during load clamps induced during early relaxation from tetanic contractions where shortening velocities are slowed and active cross-bridges are rapidly being removed (Josephson & Edman, 1998).
Physiological significance
During the cardiac cycle an afterload is imposed on the ventricle after contraction has started. The capacity of the ventricle to move this load or perform work determines the volume of blood ejected into the circulation during a heartbeat (i.e. stroke volume). This study examined (after)loaded contractions in cardiac myocyte preparations, with the purpose of gaining insight into the cellular and subcellular mechanisms that regulate power output and, thus, the functional performance of the myocardium. Power output was found to be tightly regulated by Ca2+ activation levels of cardiac myocyte preparations. Power output progressively decreased as Ca2+ activation levels were reduced, and this reduction in power output occurred even when power output was normalized for decreases in contractility (i.e. isometric force). This result is physiologically predictable given that the heart's contractility is regulated solely by factors intrinsic to the myocytes, such as activator Ca2+ levels, covalent modulation of proteins and sarcomere length. This contrasts with skeletal muscle where force is predominantly modulated by recruitment of greater or lesser number of motor units. Overall, the level of thin filament activation induced by Ca2+ appears to play a very important role in regulating power output of cardiac myofibrils and, thus, stroke volume of the heart.
Acknowledgments
I would like to acknowledge Todd Herron for technical assistance in skeletal muscle fibre experiments, Gary Thornhill for help with muscle dissections, and Steve Korte for his assistance in preparing the manuscript. I am also grateful to Dr Richard Moss for his comments about an earlier version of this manuscript. This work is supported by National Institutes of Health grant (HL57852).
References
- Bremel RD, Weber A. Cooperation within actin filament in vertebrate skeletal muscle. Nature New Biology. 1972;238:97–101. doi: 10.1038/newbio238097a0. [DOI] [PubMed] [Google Scholar]
- Brenner B. Calcium activation and maximum unloaded shortening velocity. Investigations on glycerinated skeletal and heart muscle preparations. Basic Research in Cardiology. 1980;75:40–46. doi: 10.1007/BF02001392. [DOI] [PubMed] [Google Scholar]
- Brenner B. The necessity of using two parameters to describe isotonic shortening velocity of muscle tissues: the effect of various interventions upon initial shortening velocity (vi) and curvature (b) Basic Research in Cardiology. 1986;81:54–69. doi: 10.1007/BF01907427. [DOI] [PubMed] [Google Scholar]
- Brutsaert DL, Claes VA, Goethals MA. Effect of calcium on force-velocity-length relations of heart muscle of the cat. Circulation Research. 1973;32:385–392. doi: 10.1161/01.res.32.3.385. [DOI] [PubMed] [Google Scholar]
- Chiu YC, Walley KR, Ford LE. Comparison of the effects of different inotropic interventions of force, velocity, and power in rabbit myocardium. Circulation Research. 1989;65:1161–1171. doi: 10.1161/01.res.65.5.1161. [DOI] [PubMed] [Google Scholar]
- Daniels M, Noble MIM, Ter Keurs H E D J, Wohlfart B. Velocity of sarcomere shortening in rat cardiac muscle: Relationship to force, sarcomere length, calcium and time. The Journal of Physiology. 1984;355:367–381. doi: 10.1113/jphysiol.1984.sp015424. [DOI] [PMC free article] [PubMed] [Google Scholar]
- De Tombe PP, ter Keurs EDJ. An internal viscous element limits unloaded velocity of sarcomere shortening in rat cardiac trabeculae. The Journal of Physiology. 1992;454:619–642. doi: 10.1113/jphysiol.1992.sp019283. [DOI] [PMC free article] [PubMed] [Google Scholar]
- De Tombe PP, Ter Keurs HEDJ. Force and velocity of sarcomere shortening in trabeculae from rat heart: effects of temperature. Circulation Research. 1990;66:1239–1254. doi: 10.1161/01.res.66.5.1239. [DOI] [PubMed] [Google Scholar]
- Diffee GM, Patel JR, Reinach FC, Greaser ML, Moss RL. Altered kinetics of contraction in skeletal muscle fibers containing a mutant myosin regulatory light chain with reduced divalent cation binding. Biophysical Journal. 1996;71:341–350. doi: 10.1016/S0006-3495(96)79231-7. [DOI] [PMC free article] [PubMed] [Google Scholar]
- Eddinger TJ, Cassens RG, Moss RL. Mechanical and histochemical characterization of skeletal muscles from senescent rats. American Journal of Physiology. 1986;251:C421–430. doi: 10.1152/ajpcell.1986.251.3.C421. [DOI] [PubMed] [Google Scholar]
- Edman KAP. Mechanical deactivation induced by active shortening in isolated muscle fibres of the frog. The Journal of Physiology. 1975;246:255–275. doi: 10.1113/jphysiol.1975.sp010889. [DOI] [PMC free article] [PubMed] [Google Scholar]
- Edman KAP. Double-hyperbolic force-velocity relation in frog muscle fibres. The Journal of Physiology. 1988;404:301–321. doi: 10.1113/jphysiol.1988.sp017291. [DOI] [PMC free article] [PubMed] [Google Scholar]
- Fabiato A. Computer programs for calculating total from specified free or free from specified total ionic concentrations in aqueous solutions containing multiple metals and ligands. Methods in Enzymology. 1988;157:378–417. doi: 10.1016/0076-6879(88)57093-3. [DOI] [PubMed] [Google Scholar]
- Ford LE, Huxley AF, Simmons RM. Tension transients during steady shortening of frog muscle fibres. The Journal of Physiology. 1985;361:131–150. doi: 10.1113/jphysiol.1985.sp015637. [DOI] [PMC free article] [PubMed] [Google Scholar]
- Ford LE, Nakagawa K, Desper J, Seow CY. Effect of osmotic compression on force-velocity properties of glycerinated rabbit skeletal muscle cells. Journal of General Physiology. 1991;97:73–88. doi: 10.1085/jgp.97.1.73. [DOI] [PMC free article] [PubMed] [Google Scholar]
- Granzier HL, Irving TC. Passive tension in cardiac muscle: Contribution of collagen, titin, microtubules, and intermediate filaments. Biophysical Journal. 1995;68:1027–1044. doi: 10.1016/S0006-3495(95)80278-X. [DOI] [PMC free article] [PubMed] [Google Scholar]
- Granzier HLM, Burns DH, Pollack GH. Sarcomere length dependence of the force-velocity relation in single frog muscle fibers. Biophysical Journal. 1989;55:499–507. doi: 10.1016/S0006-3495(89)82843-7. [DOI] [PMC free article] [PubMed] [Google Scholar]
- Gulati J, Podolsky RJ. Isotonic contraction of skinned muscle fibers on a slow time base: Effects of ionic strength and calcium. Journal of General Physiology. 1981;78:233–257. doi: 10.1085/jgp.78.3.233. [DOI] [PMC free article] [PubMed] [Google Scholar]
- Herron TJ, McDonald KS. Work capacity is tightly regulated by activator Ca2+ in skinned cardiac myocytes. Biophysical Journal. 1999;76:A311. [Google Scholar]
- Hill AV. The heat of shortening and the dynamic constants of muscle. Proceedings of the Royal Society. 1938;B 126:136–195. [Google Scholar]
- Hofmann PA, Fuchs F. Evidence for a force-dependent component of calcium binding to cardiac troponin C. American Journal of Physiology. 1987;253:C541–546. doi: 10.1152/ajpcell.1987.253.4.C541. [DOI] [PubMed] [Google Scholar]
- Iwamoto I. Thin filament cooperativity as a major determinant of shortening velocity in skeletal muscle fibers. Biophysical Journal. 1998;74:1452–1464. doi: 10.1016/S0006-3495(98)77857-9. [DOI] [PMC free article] [PubMed] [Google Scholar]
- Josephson RK, Edman KAP. Changes in the maximum speed of shortening of frog muscle fibres early in a tetanic contraction and during relaxation. The Journal of Physiology. 1998;507:511–525. doi: 10.1111/j.1469-7793.1998.511bt.x. [DOI] [PMC free article] [PubMed] [Google Scholar]
- Julian FJ. The effect of calcium on the force-velocity relation of briefly glycerinated frog muscle fibres. The Journal of Physiology. 1971;218:117–145. doi: 10.1113/jphysiol.1971.sp009607. [DOI] [PMC free article] [PubMed] [Google Scholar]
- Julian FJ, Moss RL. Effects of calcium and ionic strength on shortening velocity and tension development in frog skinned muscle fibres. The Journal of Physiology. 1981;311:179–199. doi: 10.1113/jphysiol.1981.sp013580. [DOI] [PMC free article] [PubMed] [Google Scholar]
- Julian FJ, Sollins MR. Variation of muscle stiffness with force at increasing speeds of shortening. Journal of General Physiology. 1975;66:287–302. doi: 10.1085/jgp.66.3.287. [DOI] [PMC free article] [PubMed] [Google Scholar]
- Lehrer S. The regulatory switch of the muscle thin filament: Ca2+ or myosin heads? Journal of Muscle Research and Cell Motility. 1994;15:232–236. doi: 10.1007/BF00123476. [DOI] [PubMed] [Google Scholar]
- McDonald KS. Thin filament inactivation during isotonic shortening in skinned striated muscle preparations. Biophysical Journal. 2000;78:225A. [Google Scholar]
- McDonald KS, Fitts RH. Effect of hindlimb unweighting on single soleus fiber maximal shortening velocity and ATPase activity. Journal of Applied Physiology. 1993;74:2949–2957. doi: 10.1152/jappl.1993.74.6.2949. [DOI] [PubMed] [Google Scholar]
- McDonald KS, Fitts RH. Effect of hindlimb unloading on rat soleus fiber force, stiffness, and calcium sensitivity. Journal of Applied Physiology. 1995;79:1796–1802. doi: 10.1152/jappl.1995.79.5.1796. [DOI] [PubMed] [Google Scholar]
- McDonald KS, Moss RL. The time course of shortening under load is regulated by the level of thin filament activation in skinned cardiac myocytes. Biophysical Journal. 1998;74:A349. [Google Scholar]
- McDonald KS, Wolff MR, Moss RL. Sarcomere length dependence of the rate of tension redevelopment and submaximal tension in rat and rabbit skinned skeletal muscle fibres. The Journal of Physiology. 1997;501:607–621. doi: 10.1111/j.1469-7793.1997.607bm.x. [DOI] [PMC free article] [PubMed] [Google Scholar]
- McDonald KS, Wolff MR, Moss RL. Force-velocity and power-load curves in rat skinned cardiac myocytes. The Journal of Physiology. 1998;511:519–531. doi: 10.1111/j.1469-7793.1998.519bh.x. [DOI] [PMC free article] [PubMed] [Google Scholar]
- Martyn DA, Rondinone JF, Huntsman LL. Myocardial segment velocity at a low load: time, length, and calcium dependence. American Journal of Physiology. 1983;13:H708–714. doi: 10.1152/ajpheart.1983.244.5.H708. [DOI] [PubMed] [Google Scholar]
- Maughan DW, Low ES, Alpert NR. Isometric force development, isotonic shortening, and elasticity measurements from Ca2+-activated ventricular muscle of the guinea pig. Journal of General Physiology. 1978;71:431–451. doi: 10.1085/jgp.71.4.431. [DOI] [PMC free article] [PubMed] [Google Scholar]
- Metzger JM, Moss RL. Calcium-sensitive cross-bridge transitions in mammalian fast and slow skeletal muscle fibers. Science. 1990a;247:1088–1090. doi: 10.1126/science.2309121. [DOI] [PubMed] [Google Scholar]
- Metzger JM, Moss RL. Effects on tension and stiffness due to reduced pH in mammalian fast- and slow-twitch skinned skeletal muscle fibres. The Journal of Physiology. 1990b;428:737–750. doi: 10.1113/jphysiol.1990.sp018238. [DOI] [PMC free article] [PubMed] [Google Scholar]
- Metzger JM, Moss RL. Kinetics of a Ca2+-sensitive cross-bridge state transition in skeletal muscle fibers: Effects due to variations in thin filament activation by extraction of troponin C. Journal of General Physiology. 1991;98:233–248. doi: 10.1085/jgp.98.2.233. [DOI] [PMC free article] [PubMed] [Google Scholar]
- Moss RL. Sarcomere length-tension relations of frog skinned muscle fibres during calcium activation at short lengths. The Journal of Physiology. 1979;292:177–202. doi: 10.1113/jphysiol.1979.sp012845. [DOI] [PMC free article] [PubMed] [Google Scholar]
- Moss RL. The effect of calcium on the maximum velocity of shortening in skinned skeletal muscle fibers of the rabbit. Journal of Muscle Research and Cell Motility. 1982;3:295–311. doi: 10.1007/BF00713039. [DOI] [PubMed] [Google Scholar]
- Moss RL. Effects of shortening velocity of rabbit skeletal muscle due to variations in the level of thin-filament activation. The Journal of Physiology. 1986;377:487–505. doi: 10.1113/jphysiol.1986.sp016199. [DOI] [PMC free article] [PubMed] [Google Scholar]
- Podolin RA, Ford LE. The influence of calcium on shortening velocity of skinned frog muscle cells. Journal of Muscle Research and Cell Motility. 1983;4:263–282. doi: 10.1007/BF00711996. [DOI] [PubMed] [Google Scholar]
- Podolin RA, Ford LE. Influence of partial activation on force-velocity properties of frog skinned muscle fibers in millimolar magnesium ion. Journal of General Physiology. 1986;87:607–631. doi: 10.1085/jgp.87.4.607. [DOI] [PMC free article] [PubMed] [Google Scholar]
- Podolsky RJ, Teichholz LE. The relation between calcium and contraction kinetics in skinned muscle fibres. The Journal of Physiology. 1970;211:19–35. doi: 10.1113/jphysiol.1970.sp009263. [DOI] [PMC free article] [PubMed] [Google Scholar]
- Seow CY, Ford LE. Contribution of damped passive recoil to the measured shortening velocity of skinned rabbit and sheep muscle fibers. Journal of Muscle Research and Cell Motility. 1992;13:295–307. doi: 10.1007/BF01766457. [DOI] [PubMed] [Google Scholar]
- Sonnenblick EH. Force-velocity relations in mammalian heart muscle. American Journal of Physiology. 1962;202:931–939. doi: 10.1152/ajplegacy.1962.202.5.931. [DOI] [PubMed] [Google Scholar]
- Swartz DR, Moss RL, Greaser ML. Calcium alone does not fully activate the thin filament for S1 binding to rigor myofibrils. Biophysical Journal. 1996;71:1891–1904. doi: 10.1016/S0006-3495(96)79388-8. [DOI] [PMC free article] [PubMed] [Google Scholar]
- Sweitzer NK, Moss RL. Determinants of loaded shortening velocity in single cardiac myocytes permeabilized with α-hemolysin. Circulation Research. 1993;73:1150–1162. doi: 10.1161/01.res.73.6.1150. [DOI] [PubMed] [Google Scholar]
- Vannier C, Chevassus H, Vassort G. Ca-dependence of isometric kinetics in single skinned ventricular cardiomyocytes from rats. Cardiovascular Research. 1996;32:580–586. [PubMed] [Google Scholar]
- Woledge RC, Curtin NA, Homsher E. Energetic Aspects of Muscle Contraction. London: Academic Press; 1985. pp. 47–71. [PubMed] [Google Scholar]