

Abstract
Discrete, localized elevations of myoplasmic [Ca2+], Ca2+‘sparks’, were readily detected using the fluorescent Ca2+ indicator fluo-3 and laser scanning confocal microscopy in ‘dyspedic’ 1B5 myotubes, i.e. myotubes which do not express ryanodine receptors (RyRs), transduced with virions containing cDNA for RyR type 3 that were saponin permeabilized to allow dye entry. Ca2+ sparks were never observed in non-transduced RyR null myotubes.
The spatial locations of sparks observed in permeabilized myotubes roughly corresponded to regions of RyR protein expression in the same myotube as detected after subsequent fixation and antibody staining.
Permeabilized RyR3-transduced myotubes exhibited similar punctate peripheral RyR3 protein immunohistochemical patterns as myotubes fixed before permeabilization indicating that permeabilization did not affect the structural organization of the triad.
Ca2+ sparks, recorded in line scan mode, in permeabilized myotubes expressing RyR3 exhibited mean amplitudes (change in fluorescence/mean fluorescence, ΔF/F: 1.20 ± 0.04) and temporal rise times (10-90 %; 6.31 ± 0.12 ms) similar to those of sparks recorded in permeabilized frog skeletal muscle fibres (0.98 ± 0.01; 6.11 ± 0.07, respectively) using the same confocal system. Spatial extent and temporal duration of the Ca2+ sparks were ≈40 % larger in the RyR3-expressing myotube cultures than in frog fibres.
Ca2+ sparks recorded in line scan mode often occurred repetitively at the same spatial location in RyR3-expressing myotubes. Such repetitive events were highly reproducible in amplitude and spatio-temporal properties, as previously observed for repetitive mode sparks in frog skeletal muscle.
Ca2+ sparks recorded in xy mode were frequently compressed in the y (slower scan) direction compared to the x direction. This asymmetry was reproduced assuming spatially symmetric events having the time course of Ca2+ sparks recorded in line scan (xt) mode.
These expression studies demonstrate that the presence of RyR3 is sufficient for the production of Ca2+ sparks in a skeletal muscle system lacking the expression of any other RyR isoform.
Discrete localized elevations of myoplasmic [Ca2+], Ca2+‘sparks’, have been detected in cardiac (Cheng et al. 1993), skeletal (Tsugorka et al. 1995) and smooth muscle (Nelson et al. 1995). Ca2+ sparks represent functional increments of Ca2+ release arising from a local cluster of sarcoplasmic reticulum (SR) Ca2+ release channels or perhaps even a single channel (Cheng et al. 1993; Schneider, 1999). In skeletal muscle Ca2+ sparks can be initiated by fibre depolarization. This is presumably via dihydropyridine receptor (DHPR) voltage sensors of the transverse (T-) tubule membrane initiating Ca2+ release from the opposing RyR Ca2+ release channels in the SR membrane (Schneider & Chandler, 1973; Rios et al. 1987; Tanabe et al. 1987). In addition, Ca2+ sparks also occur spontaneously in skeletal muscle (Klein et al. 1996). These spontaneous events occur independently of activation of the T-tubule voltage sensor and are ligand gated (Lacampagne et al. 1998), presumably through a Ca2+-induced Ca2+ release pathway (CICR; Meissner, 1994).
Two different RyR isoforms, RyR1 and RyR3, have been shown to be expressed in skeletal muscle in varying amounts. From experiments with RyR null mice (Nakai et al. 1996), it is known that RyR1 is required for normal voltage-dependent skeletal type E-C coupling, but the functional role of RyR3, if any, is not known. In this investigation we have utilized a homologous expression system to investigate the elemental Ca2+ release behaviour of RyR3. Myotubes cultured from the dyspedic 1B5 myogenic cell line totally lack expression of any RyR but still express key skeletal muscle E-C coupling components (Moore et al. 1998; Protasi et al. 1998). These myotubes exhibit no forms of Ca2+ release (Moore et al. 1998) in response to caffeine, 4-chloro-m-cresol, or depolarization. Transduction of RyR3 cDNA into these dyspedic myotubes with HSV-1 amplicon virions restores Ca2+ release in response to caffeine application, the hallmark of CICR (Moore et al. 1998, 1999), but does not restore skeletal-type E-C coupling in response to depolarization (Moore et al. 1999). We now show that transduction of dyspedic myotubes with RyR3 causes the appearance of spontaneous Ca2+ sparks, which are never observed in non-transduced dyspedic myotubes. Thus, expression of RyR3 as the sole ryanodine receptor is sufficient to cause the appearance of spontaneous Ca2+ sparks in dyspedic myotubes.
METHODS
Cell culture
1B5 cells (RyR1 null) (Moore et al. 1998) were cultured on plastic coverslips (Fisher Scientific; mounted over a 15 mm hole in a 35 mm Petri dish) or in opticlear 96-well plates (Costar) in Dulbecco's modified Eagle's medium (DMEM) with 20 % fetal bovine serum (FBS), 100 μg ml−1 streptomycin sulfate, 100 units ml−1 penicillin-G, 5 % CO2. This cell line has previously been shown to lack expression of not only RyR1 but also all other RyR isoforms (Moore et al. 1998). Cells were then allowed to differentiate into myotubes (5-7 days) in a low growth factor medium (no FBS) containing 5 % heat-inactivated horse serum, 23 % CO2, pH ∼7.05.
Viral expression of RyR proteins
Differentiated myotubes were exposed to helper-free HSV-1 amplicon virions (Fraefel et al. 1996; Moore et al. 1999; Wang et al. 2000) containing RyR3 cDNA at a moiety of infection of ∼1 for 1–2 h, and then cultured for 24–36 h in differentiation medium (above; with either 5 or 18 % CO2) prior to imaging for functional Ca2+ release. Similar results were obtained with both CO2 levels.
Preparation of frog skeletal muscle fibres
Single frog fibres were isolated as previously described (Lacampagne et al. 1998). In brief, frogs (Rana pipiens) were placed into a crushed ice slurry to induce torpor and killed by rapid decapitation and spinal cord destruction as approved by the University of Maryland School of Medicine Institutional Animal Care and Use Committee. The ileofibularis muscle was removed and pinned in a dissecting dish containing standard amphibian Ringer solution. Following a solution exchange to a relaxing solution (mM: 120 potassium glutamate, 2 MgCl2, 0.1 EGTA, 5 Na-Tris-maleate, pH 7.00) single fibres were manually dissected. Small fibre segments were transferred to an experimental chamber containing the same relaxing solution.
Fluorescence imaging
Differentiated myotubes from RyR3-transduced cultures were chemically permeabilized by exposure to saponin (12 μg ml−1; 30 s) in internal solution (mM: 95 caesium glutamate, 20 creatine phosphate, 4.5 Na-Tris-maleate, 13.2 Cs-Tris-maleate, 5 glucose, 0.1 EGTA, 1 DTT, 0.18-1.87 Mg2+ free, and 5.0 ATP), then washed in internal solution and finally bathed in internal solution containing 0.05 mM fluo-3 (pentapotassium salt) for fluorescence imaging. Single cut frog skeletal muscle fibres were chemically permeabilized by exposure to saponin (12 μg ml−1; 1 min) in relaxing solution with 1 mM EGTA added. Fibres were then washed with internal solution and finally bathed in internal solution containing 0.05 mM fluo-3 (pentapotassium salt) for fluorescence imaging. Myotubes were monitored for functional Ca2+ release at ∼37°C in a custom-built air-jacketed chamber while frog fibres were monitored for Ca2+ at room temperature (∼22°C). Both preparations were imaged on an inverted microscope (Olympus IX-70 with a × 60, 1.4 NA oil or a 60, 1.3 NA water objective) coupled to a Bio-Rad MRC-600 laser scanning confocal system (488 nm excitation). The confocal system was used in either xy or in line scan xt mode (1 s acquisition time; 2 ms per line; 768 pixels per line in x, 512 lines in y per image). The confocal aperture was set to 25 % of maximal setting; the resolution was estimated at 0.4 μm in the x and y dimensions and 0.8 μm in the z dimension. In all confocal images presented here, the x scan distance is represented as vertical displacement and the horizontal displacement represents either the y scan distance in the xy images or time in the xt line scan images.
Line scan (xt) image acquisition and processing
Myotube cultures were screened for locations of spark generation by monitoring 10–20 successive xy confocal fluorescence images of a randomly selected field containing several myotubes. Local areas of fluorescence fluctuation were identified by visual inspection during the acquisition of images. Fluorescence time courses were then recorded in line scan mode by positioning the scan line so as to pass through the identified locations of local fluorescence fluctuation.
Single cut frog skeletal muscle fibres were monitored for Ca2+ sparks as previously described (Lacampagne et al. 1998). Line scan images were acquired near the coverslip and initiated at a random location along the fibre axis. Following a run of five 1 s scans the scan line was incremented by 0.9 μm perpendicular to the fibre axis and scanning was repeated.
Line scan images were processed and events selected as described in detail previously (Lacampagne et al. 1998). In brief, fluorescence line scan images were converted to images of change in fluorescence (ΔF) by subtracting the mean fluorescence (F) of the five sequential images at each spatial location from each raw fluorescence image. Each ΔF image was then divided by F to create a ΔF/F image. Ca2+ sparks were selected visually from ΔF/F images and accepted or rejected according to the following criteria: a change in ΔF/F≥ 0.3, full duration at half-maximal amplitude (FDHM) ≥ 6 ms, and full width at half-maximal amplitude (FWHM) ≥ 1 μm. The rise time of the events was taken as the time from 10 to 90 % of the maximal amplitude. Results are expressed as means ±s.e.m.
Full-frame (xy) image acquisition and processing
Myotube cultures were screened for locations of spark generation by monitoring 10–20 successive xy confocal fluorescence images of a randomly selected field containing several myotubes. In selected regions, a series of 30 successive images of each field were collected, summed and averaged to generate a mean fluorescence image (F) which was then subtracted from each image in the series to create a change in fluorescence image (ΔF). ΔF images were then divided, pixel-by-pixel, by F to give a ΔF/F image. Ca2+ release events, identified as regions of varying local fluorescence, were visually identified in each ΔF/F image and corresponding pixel locations were stored. ΔF/F images were then recalculated to ignore regions of Ca2+ release in any image. Previously identified regions of fluorescence fluctuation were analysed for peak amplitude and total area ≥ 50 % of peak amplitude, with Ca2+ sparks being defined as having a peak amplitude (ΔF/F) ≥ 0.3and area (pixel area ≥ 50 % of peak amplitude) of ≥ 0.35 μm2.
Immunohistochemistry
Both intact and chemically skinned cells were fixed in ice-cold methanol for 20 min, blocked in PBS containing 1 % bovine serum albumin (BSA) and 10 % goat serum for 1 h, and then incubated with a monoclonal primary antibody (34C; Developmental Studies Hybridoma Bank, University of Iowa, USA; Airey et al. 1990) overnight at 4°C. This antibody was raised against chick RyR but recognizes mammalian RyR1 and RyR3 as well as frog RyRα/β. After washing (4 × 10 min) in PBS-BSA, the myotubes were incubated with Cy3-conjugated goat anti-mouse secondary antibodies (The Jackson Laboratories, Lexington, KY, USA) for 1 h using standard techniques. Non-confocal fluorescence images were obtained using an Olympus IX-70 epifluorescence microscope and either a ×10, 0.3 NA or ×100, 1.3 NA oilplan apochromat objective. A few myotube cultures were permeabilized, used for fluo-3 experiments and subsequently fixed, labelled and imaged on the same confocal system as was used to make the Ca2+ measurements.
Data analysis
Quantitative analysis of fluorescence images was performed with custom image analysis routines written in IDL 5.0 (Boulder, CO, USA). Statistical comparisons between response variables were conducted by Student's non-paired t test with significance set at the P < 0.05 level.
RESULTS
RyR3 expression in 1B5 myotubes
Figure 1A–D shows epifluorescence images (non-confocal) of RyR3-transduced 1B5 myotubes immunostained with RyR-specific primary antibody 34C and Cy3-conjugated secondary antibody at low (A and B) and high (C and D) magnification. The RyR protein immunostaining exhibits a punctate pattern with frequency and localization similar to what was shown previously for RyR1 (Protasi et al. 1998). This punctate expression pattern is attributable to a predominance of peripheral couplings between the SR and surface membrane due to the absence of a well-formed T-tubular system at this relatively early stage of differentiation compared to adult muscle fibres. Additionally, the planar appearance of this punctuate expression is due to the tight adherence of the myotube to the planar coverslip surface. Co-localization of RyR1 with DHPR and triadin in a punctate distribution have been shown previously in RyR1-transduced myotubes (Protasi et al. 1998) and similar co-localization is found with RyR3 (Protasi et al. 1999). No differences were seen between the expression pattern of RyR in fibres fixed before (Fig. 1a and C) or after (Fig. 1b and D) saponin permeabilization. Thus the permeabilization procedure used to attain access of ionic fluo-3 to the fibre interior did not disrupt the pattern of RyR3 protein in RyR3-expressing myotubes. Additionally, untransduced differentiated 1B5 cells showed no reactivity to the RyR-specific antibody (Fig. 1E; scale bar, 100 μm).
Figure 1. Expression of RyR protein and caffeine responsiveness in 1B5 myotubes virally transduced with RyR3 cDNA.
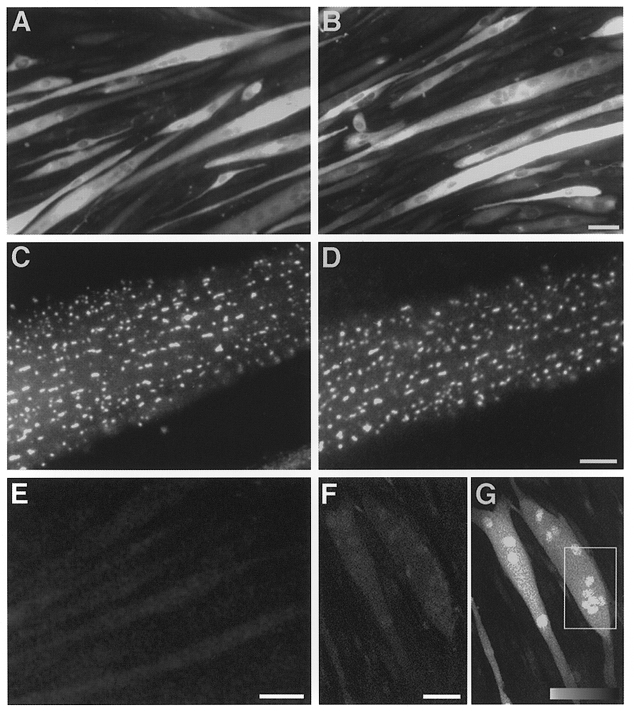
Immunofluorescence images (non-confocal) of cells without (A and C) or with (B and D) saponin permeabilization prior to fixation and labelling with antibody (ab) 34C are shown. A and B, low magnification immunofluorescence images, scale bar = 100 μm. C and D, high magnification images, scale bar = 10 μm. E, low magnification immunofluorescence image of untransduced differentiated 1B5 cells, scale bar = 100 μm. Confocal xy fluorescence images of permeabilized 1B5 myotubes loaded with fluo-3 before (F) and after (G) a 15 mM caffeine challenge, scale bar = 100 μm. Boxed area defines the region of imaging for the high magnification view in Fig. 2A.
Expression of functional RyR3 protein was assessed with a caffeine challenge. Permeabilized RyR3-expressing myotubes bathed in fluo-3-containing internal solution (Fig. 1F) exhibited a brisk Ca2+ release in response to 10 mM caffeine (Fig. 1G) whereas non-transduced control myotubes never exhibited Ca2+ release in response to caffeine (data not shown). Please note that in our confocal images nuclei routinely appear as more brightly fluorescent relative to the myoplasm both at rest (Fig. 1F) and during activation of Ca2+ release (Fig. 1G). The relatively greater nuclear fluorescence in such images is probably due to exclusion of fluo-3 from the SR and other intracellular organelles, producing a relatively greater volume accessible to the dye in the nucleus than the myoplasm. In addition the brighter nuclear fluorescence could possibly also be due to differences in dye binding in nucleus and myoplasm (Perez-Terzic et al. 1997).
Ca2+ sparks appear after transfection with virions containing RyR3 cDNA
Figure 2a presents a laser scanning confocal xy image (‘x’ vertical, ‘y’ horizontal) of fluo-3 fluorescence in saponin-permeabilized myotubes from a RyR3-transduced culture. The myotube in Fig. 2a exhibits many highly localized regions of increased fluorescence, or Ca2+ sparks (arrows), in this laser scanning confocal xy image. Each spark corresponds to a discrete Ca2+ release event in this RyR3-expressing dyspedic myotube. A subsequent exposure of this myotube culture to 15 mM caffeine resulted in a brisk, global Ca2+ release (Fig. 1F and G; boxed area is low magnification view of Fig. 2a).
Figure 2. 1B5 myotubes transduced with RyR3 virions, express RyR3 and produce Ca2+ sparks.
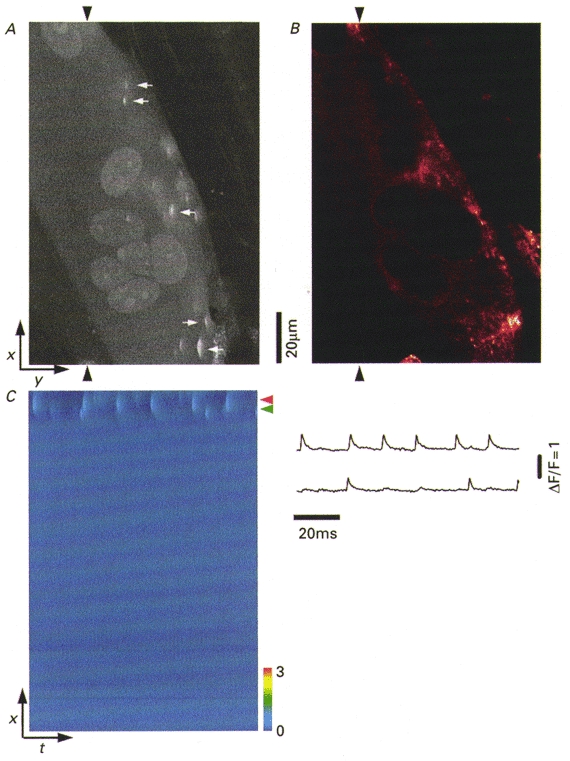
A, confocal xy fluorescence image of a single permeabilized myotube. White arrows indicate discrete localized regions of elevated fluo-3 fluorescence (Ca2+ sparks). B, the same myotube as in A after fixation and labelling with ab34C. The pseudocoloured confocal image was obtained at approximately the same z axis plane (based on nucleus morphology) as in A using the same confocal system. The regions of immunolabelling at this visual plane were analogous to the areas in which Ca2+ sparks are seen in (A). C, line scan xt image of ΔF/F recorded at the spatial location indicated by the arrowheads in (A) and corresponding ΔF/F transients (right, 5 temporal lines averaged through the centre of the events) at two locations along the scan line which exhibit repetitive activity during the 1 s scan.
Imaging the same permeabilized myotube after subsequent fixation and staining with anti-RyR antibody reveals that the regions of Ca2+ spark occurrence prior to fixation (Fig. 2a) correspond to regions of expression of RyR3 protein after fixation (Fig. 2b). The peripheral pattern of RyR labelling in Fig. 2b is the result of the confocal plane being within the centre of the myotube, which is lacking in RyR expression due to the lack of T-tubule formation in these relatively immature myotubes (Protasi et al. 1998, 1999). This peripheral labelling is similar to the punctuate labelling seen homogeneously across the entire myotube when the focal plane (non-confocal) is at the myotube coverslip interface surface (Fig. 1a).
Localized Ca2+ sparks were detected in multiple permeabilized myotubes in xy fluo-3 fluorescence images of all RyR3-transduced cultures examined. The sparks observed in these permeabilized, and thus depolarized, RyR3-expressing myotubes were presumably ligand activated by CICR. DHPR voltage sensors, present in surface couplings in such myotubes (Protasi et al. 1998, 1999), would be expected to be in a fully inactivated state (Chandler et al. 1976) following membrane permeabilization and depolarization and thus incapable of activating the observed sparks. No local regions of fluo-3 fluorescence fluctuation were ever observed in non-transduced 1B5 myotubes (not shown). Additional experiments were conducted with the Ca2+-insensitive RyR3 mutant E3885A (Chen et al. 1999). Viral transduction of this RyR3 mutant resulted in similar expression patterns to that of RyR3 (data not shown); however, no spontaneous Ca2+ release events (14 random fields of 3 myotube cultures), or caffeine (10 mM)-induced Ca2+ release was evident. These results suggest that the appearance of Ca2+ sparks required the expression of RyR3 protein capable of activation by CICR.
Line scan images of myotube regions which exhibited localized Ca2+ elevation in xy images were obtained using the confocal system in xt mode. This repetitive scanning through a given spatial location exhibiting local Ca2+ release activity allows Ca2+ spark visualization with increased time resolution. Repetitive line scanning between the two arrowheads in Fig. 2a produced a line scan image (xt; ‘x’ vertical, ‘t’ horizontal) showing the occurrence of six relatively large Ca2+ sparks at one spatial location and two smaller Ca2+ sparks at another nearby location. Both locations of Ca2+ spark activity were near the periphery of the myotube, with no events detected within the central region of the myotube (Fig. 2C). As discussed previously, this peripheral appearance of Ca2+ spark activity is presumably due to RyR3 localization near the surface of the cell. The observed amplitude of an event decreases as the scan line is displaced from the spatial location of the SR Ca2+ channels generating the spark (Pratusevich & Balke, 1996; Jiang et al. 1999). Thus the relative amplitude of a spark in time courses as in Fig. 2C does not necessarily provide a measure of the actual magnitude of the underlying Ca2+ release.
Each xy confocal image is acquired over a total time of 1 s, with the image recorded at 2 ms per line at successive 0.18 μm y increments. Thus, spherically symmetric events that grow and decline within tens of milliseconds (Fig. 2C) would be intercepted by only a few scan lines. This accounts for the observation that sparks recorded in xy images (Fig. 2a) appear compressed in the y (horizontal) dimension compared to the x (vertical) dimension (see below; Fig. 7). In all cases in which elongated spatially asymmetric Ca2+ sparks were observed in xy images of RyR3-infected cultures, the elongated dimension of the spark was always parallel to the x scan direction, independent of whether the myotube was oriented perpendicular or parallel to the x scan direction.
Figure 7. Use of an average Ca2+ spark imaged in xt line scan mode to reconstruct a Ca2+ spark as imaged in xy mode.
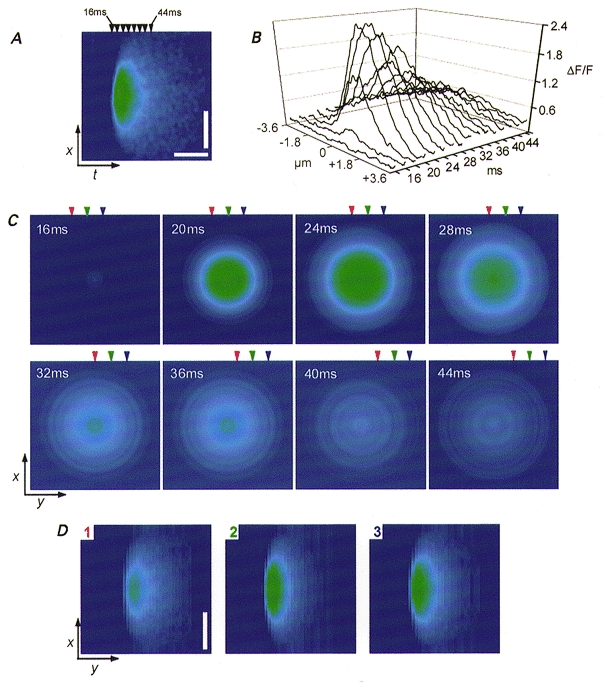
A, pseudocolour xt image of a Ca2+ spark which was used as a representative Ca2+ spark for data reconstruction. This Ca2+ spark is the same average event shown in Fig. 4C. B displays spatial fluorescence profiles of the spark taken at 2 ms increments between 16 and 44 ms of the 80 ms image (only 4 ms increments between 16 and 44 ms are shown for presentation, corresponding arrowheads in A, top). The half spatial profiles on either side of the peak along each x line in B were averaged to obtain a mean radial spatial fluorescence profile which was then used to construct an instantaneous xy representation of the spatial fluorescence at each time. C displays the fluorescence xy reconstructions at each time point indicated by the arrowheads in A. Ca2+ sparks imaged in xy scanning were reconstructed by selecting an arbitrary line in the first image and then successively incrementing y position to the next pixel location in the instantaneous xy image calculated for 2 ms later. D, three reconstructions based on successive y increments noted in the corresponding arrowheads seen in C. The reconstructions were designed to simulate the xy scan arriving 5 pixel lines prior to the peak of the spark (1; red), arriving at the peak of the spark (2; green) and arriving 5 pixel lines after the peak of the spark (3; blue).
Modulation of Ca2+ spark frequency
Ligands known to modulate Ca2+ sparks were manipulated in the internal solution in permeabilized myotube cultures in order to further verify the functional status of the expressed RyR3 protein. Permeabilized cultures were initially incubated in a control solution and scanned for regions of Ca2+ spark activity in which to make measurements. Once a field of moderate Ca2+ spark activity was identified, 30 successive xy scans were collected first in the control condition, then in the experimental condition, and finally in the control condition. Ca2+ spark activity was determined in successive ΔF/F xy images as described in Methods. Figure 3a demonstrates that in fields (n = 4) of RyR3-expressing myotubes, Ca2+ spark activity was inhibited, and partially reversible, by increasing the free Mg2+ from 0.65 to 1.87 mM, as expected for Mg2+ suppression of CICR in skeletal RyR. Additional experiments also demonstrated that in permeabilized myotubes with very low Ca2+ spark activity due to exposure to high [Mg2+] (1.87 mM free) in the internal solution, detectable Ca2+ spark activity could be reversibly induced by the addition of 0.25 mM caffeine (Fig. 3b) without an increase in global Ca2+. Both of these ligands have previously been shown to be modulators of RyR-dependent Ca2+ spark activity in frog skeletal muscle (Klein et al. 1996; Lacampagne et al. 1998) and mammalian RyR3 (Murayama et al. 1999).
Figure 3. Ca2+ sparks in RyR3-expressing myotubes are sensitive to ligands known to affect RyR Ca2+ sparks.
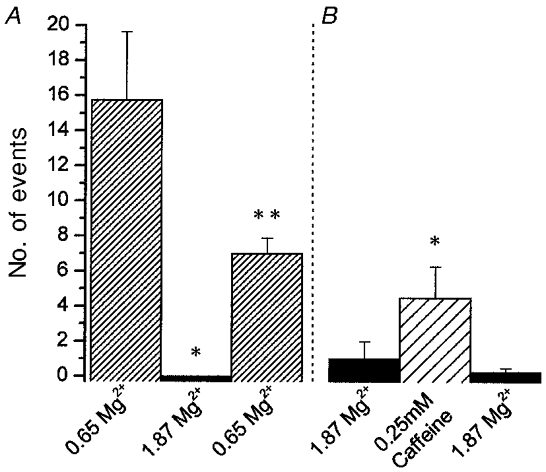
A, image fields of RyR3-transduced myotube cultures (n = 4) exhibiting moderate Ca2+ spark activity in control internal solution (0.65 mM Mg2+) were exposed to an internal solution with increased [Mg2+] which resulted in an inhibition of Ca2+ spark activity. A return to the control solution resulted in a return of Ca2+ spark activity, but to a lesser level than in the initial control. B, RyR3-transduced myotube cultures exhibiting a very low Ca2+ spark activity (1.87 mM Mg2+) exibited a significant increase in spark activity when exposed to 0.25 mM caffeine. This increased activity was reduced to control levels following removal of the caffeine-containing solution. Event frequency was determined as the number of events in 30 successive xy scans in each condition (n = 4) (*P < 0.05vs. control; **P < 0.05vs. experimental treatment and control).
Repetitive Ca2+ sparks at specific spatial locations
Figure 4A, B and D displays strips of ΔF/F line scan images with corresponding ΔF/F fluorescence transients collected from myotubes in three different cultures expressing RyR3. At each spatial location (arrowheads) localized Ca2+ sparks occur repetitively with varying frequency. Interestingly, whereas the amplitude and spatial characteristics of the events vary considerably between spatial locations in the same or different myotubes, the events within a repetitive train at a given location are remarkably similar. Figure 4C presents a surface plot and contour map of the average of eight sparks which were averaged after spatio-temporal shifting so as to coincide at the peak amplitude of each event. Three of the events in this average are seen in the 1 s strip image (1 out of 5 successive images) in Fig. 4B. The range of values (minimum vs. maximum) for amplitude (ΔF/F; 2.03 vs. 2.43), rise time (3.0 vs. 5.0 ms), spatial full width at half-maximal amplitude (FWHM; 2.57 vs. 3.27 μm), and temporal full duration at half-maximal amplitude (FDHM; 10.8 vs. 13.8 ms) were very similar for the eight events at this location. Figure 4E presents a contour plot of five successive line scan image strips, which include the events in Fig. 4D. Note that the time scale in Fig. 4E is highly compressed compared to Fig. 4C in order to display a total of 5 s of recording time. The events in this line scan had a high signal-to-noise ratio and were spatially isolated from nearby events allowing for a non-obstructed surface plot of numerous events. This surface plot reinforces the amplitude and spatial homogeneity of the individual events recorded at a given spatial location. The highly stereotyped nature of successive sparks in a train of repetitive events from a RyR3-transduced myotube is reminiscent of the repetitive trains of spontaneous Ca2+ sparks seen in rat (Parker & Wier, 1997) and mouse (Bridge et al. 1999) cardiac myocytes or frog skeletal muscle fibres (Klein et al. 1999).
Figure 4. Repetitive Ca2+ spark activity in myotubes transduced with RyR3.
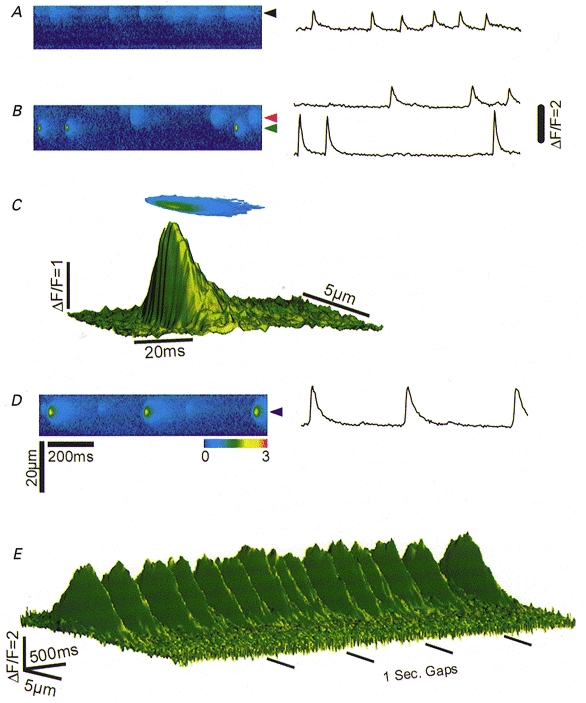
A, B and D display three ΔF/F line scan image strips from different myotube cultures transduced with RyR3. Each 1 s image strip is a section of a series of five 1 s line scans of the same spatial location. The ΔF/F transient (right, 5 temporal lines averaged through the centre of the events) shows the repetitive nature of the events within the 1 s line scan image strip. C displays a surface plot and ΔF/F contour plot of 8 events spatio-temporally shifted and averaged to the peak amplitude of fluorescence. These 8 events are from 5 consecutive images including B (lower spatial location). E, surface plot of the 5 consecutive line scan images at the spatial location which includes D. Lateral black bars represent 1 s gaps between consecutive line scan images removed for presentation purpose.
Properties of Ca2+ sparks in RyR3-transduced myotubes and in frog fibres
The spatio-temporal properties of 312 Ca2+ sparks imaged in line scan mode from 47 permeabilized RyR3-expressing myotubes are seen in Fig. 5A. The mean values are: peak amplitude (ΔF/F; 1.20 ± 0.04), rise time (10-90 %; 6.31 ± 0.12 ms), temporal full duration at half-maximal (FDHM; 17.5 ± 0.4 ms) and spatial full width at half-maximal (FWHM; 2.72 ± 0.06 μm). In comparison with the myotube spark properties, Fig. 5b displays histograms of 1254 Ca2+ sparks imaged in saponin-permeabilized frog skeletal muscle fibres (n = 4) on the same confocal system. The mean values for peak amplitude (ΔF/F; 0.98 ± 0.01), and rise time (10-90 %; 6.11 ± 0.07 ms) were not different from the those of RyR3-expressing myotubes whereas the temporal FDHM (10.93 ± 0.1 ms) and spatial FWHM (2.01 ± 0.02 μm) were somewhat smaller (P < 0.05) in frog fibres.
Figure 5. Population histograms of Ca2+ spark properties.
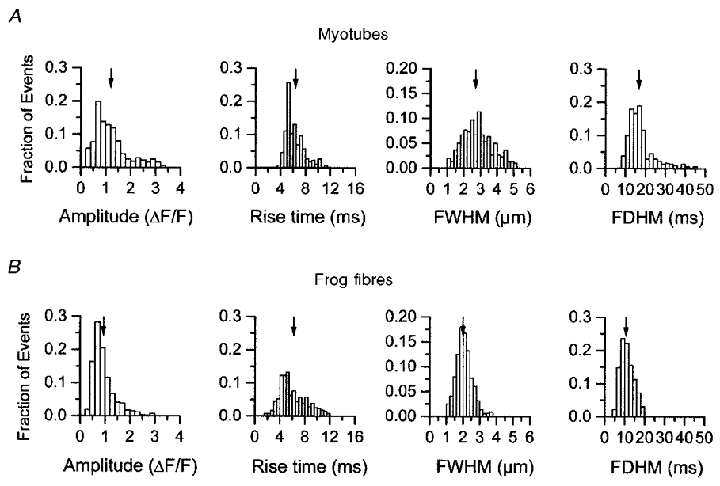
Ca2+ spark populations from 1B5 myotubes transduced with virions containing RyR3 cDNAs (A; n = 312) and from frog skeletal muscle (B; n = 1254). No difference was seen between the mean values for amplitude and rise time between the RyR3-transduced myotubes and frog muscle fibres. However, the spatial (FWHM) and temporal (FDHM) properties of Ca2+ sparks in the frog fibres were significantly smaller than in the RyR3-expressing myotubes.
As previously observed for Ca2+ sparks in frog fibres (Lacampagne et al. 1998) there was no correlation between spark amplitude and spark rise time in either frog skeletal muscle fibres or in myotubes expressing RyR3. Additionally, there was no correlation between the spatial extent of the Ca2+ sparks and the amplitude of the events in either the myotubes or the frog fibres (Fig. 6a and B).
Figure 6. The relationship between the amplitude and both the rise time and spatial half-width (FWHM) in myotubes expressing RyR3 (A) and in frog skeletal muscle (B).
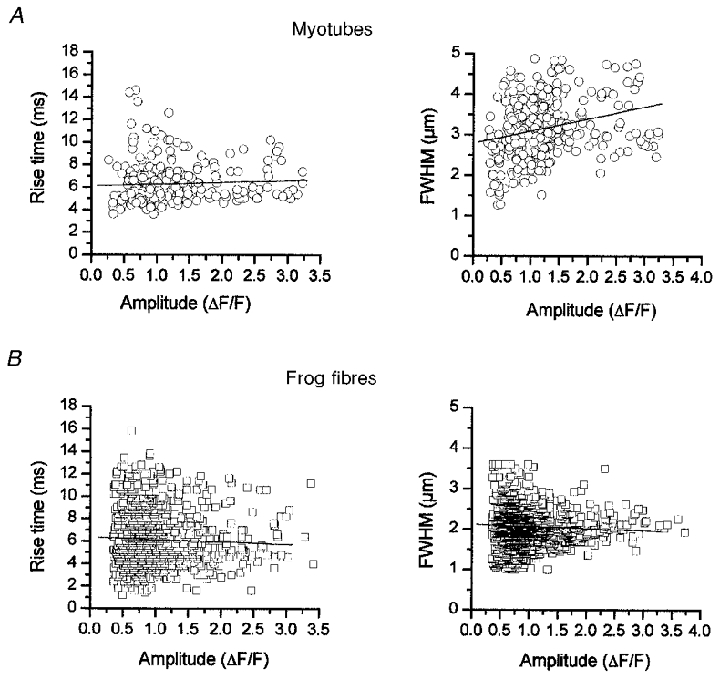
Linear regression analysis of the relationship between spark rise time and amplitude and spark spatial spread (FWHM) and amplitude showed no correlation (P > 0.05).
Asymmetry of Ca2+ sparks in xy images due to non-instantaneous image acquisition
Imaging Ca2+ sparks in xy mode resulted in sparks that appeared compressed in the y (slower scanned) dimension compared to the x dimension. This is consistent with spatially symmetric Ca2+ sparks having a time course comparable to the speed at which the line scan is incremented in the y dimension. In order to understand the implications of imaging Ca2+ sparks in xy mode, a representative Ca2+ spark imaged in xt mode was used to reconstruct an xy-imaged Ca2+ spark. Figure 7a displays a pseudocolour xt line scan image of an average of eight Ca2+ sparks (same average spark as in Fig. 4C) which was used as the representative Ca2+ spark for data reconstruction. Spatial fluorescence profiles of the spark were taken at 2 ms increments between 16 and 44 ms of the 80 ms duration line scan image (Fig. 7b). However, for ease of presentation only 4 ms increments are marked in Fig. 7a (arrowheads, top). For this reconstruction we assume that the line scanned to record the xt line scan image (Fig. 7a) passed through the spatial location of the Ca2+ channel(s) generating the spark. In this case, if there is no anisotropy in either Ca2+ diffusion or binding, the fluorescence should be symmetric around the peak in each x line (Fig. 7b) of the experimentally recorded xt spark (Fig. 7a). We therefore averaged the fluorescence profile of the Ca2+ spark as a function of distance from its peak in each x line of the experimental xt image to obtain a mean radial spatial profile of fluorescence. This radial profile was then used to construct an xy representation of the spatial fluorescence at each temporal instant giving the series of radially symmetric xy‘snapshot’ images shown in Fig. 7C.
Reconstruction of Ca2+ sparks as actually imaged in xy scanning was achieved by combining x lines at successive y locations from successive ‘snapshot’ images in the series of images of Fig. 7C (and in the intervening images not shown). This line selection simulates the y incrementation at 2 ms intervals during the acquisition of an experimental xy image. Additionally, the characteristics of the imaged spark will be affected by the time at which the scan line intercepts the Ca2+ release event as the y dimension is incremented. The colour-coded arrowheads in Fig. 7C indicate the temporal location of the successive y increments designed to simulate the xy scan line arriving five pixel lines prior to the peak of the spark (red), arriving at the peak of the spark (green) and arriving five pixel lines after the peak of the spark (blue). Use of each of these three sets of x lines from the images in Fig. 7C (and intervening images not shown) resulted in the three different reconstructed xy images shown in Fig. 7D (1, red arrow locations from Fig. 7C; 2, green; 3, blue). Each of the resulting reconstructed xy images is compressed in the y dimension compared to the x dimension, as observed in the experimentally derived xy images (Fig. 2a). Thus the relatively rapid time course of a spark together with the 2 ms incrementation rate along the y axis in xy images accounts for the asymmetry of the sparks observed in such images.
DISCUSSION
RyR3 is sufficient for the appearance of Ca2+ sparks
In these experiments we have observed the appearance of spontaneous discrete Ca2+ release events, Ca2+ sparks, in dyspedic myotubes after viral transduction with RyR3 cDNA. Non-transduced dyspedic myotubes that express no RyR isoform never exhibited Ca2+ sparks. The Ca2+ sparks seen in these transduced dyspedic myotubes are similar in many respects to Ca2+ sparks seen in amphibian skeletal muscle.
Our findings represent the first report of the appearance Ca2+ sparks after expression of recombinant RyR in any expression system. A previous report has demonstrated that the expression of the full-length fragment of rabbit skeletal muscle RyR1 cDNA in Chinese hamster ovary (CHO) cells resulted in the appearance of global caffeine-induced Ca2+ release. However the observed Ca2+ release was uniformly graded and did not exhibit discrete localized spark-like fluorescence patterns (Bhat et al. 1997). Since the previous expression studies were carried out in a non-muscle cell context, it is possible that some critical constituent, which was absent in the heterologous cell expression system, is needed for Ca2+ spark generation by either an organized group of channels or by a single channel. In any event, our present expression studies unequivocally establish that the expression of RyR3 is sufficient for the appearance of spontaneous Ca2+ sparks in a skeletal muscle environment.
Spontaneous Ca2+ sparks are readily detected in adult frog skeletal muscle (Klein et al. 1996; Lacampagne et al. 1998) and in embryonic mammalian skeletal muscle (Conklin et al. 1999a, b), but are detected less frequently in adult mammalian skeletal muscle (Shirkova et al. 1998). All embryonic mammalian skeletal muscles express up to 30 % RyR3 in addition to RyR1 (Tarroni et al. 1997) and frog skeletal muscles express equal amounts of the two RyR isoforms (RyR1 and RyR3, or α and β, respectively; Sutko & Airey, 1996). On the other hand all adult mammalian muscles express predominantly the RyR1 isoform, with only diaphragm and some slow twitch fibres expressing any RyR3 at all (Conti et al. 1996). The correlation between the presence of sparks and the presence of RyR3 indicates that expression of RyR3 may possibly be important for the occurrence of spontaneous Ca2+ sparks in skeletal muscle. The present results clearly establish that expression of RyR3 is sufficient to produce detectable spontaneous Ca2+ sparks in an experimental dyspedic skeletal muscle expression system. Protasi et al. have shown that in dyspedic myotubes RyR3 is targeted appropriately and forms arrays of feet similar to the RyR1 arrays (Protasi et al. 1999). However, since in vivo no muscle expresses only RyR3, the local organization of Ca2+ release channels in this system must be somewhat different, due to the fact that RyR1 is at least co-expressed in normal muscle fibres. Notwithstanding, these factors, as well as the level of RyR expression, might influence the detection of Ca2+ sparks. Therefore some caution must be exercised in using the observation that RyR3 is sufficient to generate Ca2+ sparks in dyspedic myotubes to draw firm conclusions regarding the possible role of RyR3 in muscle fibres.
Saponin permeabilization
Our experiments utilized a saponin-permeabilized 1B5 myotube preparation virally transduced with a RyR3 cDNA to probe ligand-activated elementary Ca2+ release behaviour (Ca2+ sparks). Recently, saponin permeabilization techniques have been adapted for use in examining spontaneous ligand-activated Ca2+ sparks in skeletal muscle preparations (Ward et al. 1998). The major benefits of a permeabilized preparation are the ability to control the myoplasmic contents and the ability to alter the composition of the intracellular milieu to examine the effects of specific ligands (i.e. Mg2+) in a semi-intact cellular environment. Furthermore, the permeabilized preparation provides for direct access of fluo-3 salt to the cell interior. One disadvantage of a permeabilized cell preparation is that any voltage sensors present in the sarcolemma experience continuous depolarization due to disruption of the integrity of the external membrane. However, as opposed to voltage-activated Ca2+ release mechanisms, the spontaneous local Ca2+ release behaviour observed here after expression of the RyR3 isoform was not eliminated by the chronic cell depolarization that results from saponin permeabilization. In 1B5 myotubes, expression of RyR3 does not result in the appearance of organized DHPR tetrads (Protasi et al. 1999), which are observed after the expression of RyR1 (Protasi et al. 1998). Similarly RyR3 expression in these myotubes fails to restore depolarization-induced Ca2+ release which is restored with the expression of RyR1 (Moore et al. 1998). Thus, it is unlikely that the RyR3 molecules expressed in these dyspedic myotubes would specifically interact with the DHPRs and thus the occurrence of Ca2+ sparks in this expression system should therefore be independent of the state of the voltage sensors.
Properties of Ca2+ sparks in various systems
The mean values of the rise time and amplitude of the Ca2+ sparks observed here after expression of RyR3 in dyspedic myotubes were not statistically different from the mean values of the same properties of Ca2+ sparks in frog skeletal muscle fibres acquired using the same confocal microscope system. In contrast, the spatial half-width (FWHM) and the temporal half-width (FDHM) were larger (P < 0.05) in the RyR3-expressing myotubes than in frog fibres. The larger spatial and temporal extent of the Ca2+ sparks in the 1B5 myotube expression system might indicate that multiple channels are involved in a spark and that the channel(s) generating a spark may cover a larger spatial area in their less organized myotube system than in the highly organized adult frog fibres. Alternatively, differences in Ca2+ diffusion and binding might give rise to the observed differences in the Ca2+ spark spatial and temporal extent between the RyR3-expressing myotubes and frog muscle fibres. However, the similarity of rise times in the two systems indicates that the net open time of the channel(s) underlying the sparks is similar.
Several recent reports have identified Ca2+ sparks in wild-type (WT) embryonic mammalian skeletal muscle myotubes (Shirakova et al. 1998; Conklin et al. 1999a, b), which have been reported to co-express RyR1 and RyR3 isoforms (Tarroni et al. 1997). Embryonic WT myotubes from E18 mouse fetuses (Conklin et al. 1999b) were found to exhibit Ca2+ sparks having mean values of amplitude (ΔF/F; 1.6 ± 0.6) and spatial extent (FWHM; 3.5 ± 1.1 μm) which are roughly similar to the values reported here (ΔF/F; 1.20 ± 0.04and 2.72 ± 0.06 μm, respectively) for RyR3 expressing 1B5 myotubes. However, substantially larger values of mean temporal rise time (42.8 ± 24 ms) and durations (FDHM; 84.5 ± 46 ms) were reported in the E18 WT myotubes than found here for RyR3-expressing myotubes (6.31 ± 0.12 ms and 17.5 ± 0.4 ms, respectively). Additionally, Conklin et al. (1999b) also reported Ca2+ sparks in embryonic E18 myotubes from RyR3 knockout mice, suggesting that the involvement of RyR3 cannot be the sole mechanism for generating Ca2+ sparks under all conditions in skeletal muscle. The Ca2+ sparks imaged in the RyR3-deficient E18 myotubes had similar magnitudes (ΔF/F; 1.5 ± 0.6)but significantly smaller temporal rise time (19.2 ± 16 ms) and duration (FDHM; 44.5 ± 25 ms), and smaller spatial spread (FWHM; 2.6 ± 0.6 μm) than the WT control cells examined. Even so, these RyR3-deficient myotubes still produced events which were 2.5- to 3-fold greater in temporal rise time and duration (FDHM) than those reported here for RyR3-expressing myotubes or for frog fibres. The smaller event size in the RyR3-deficient myotubes compared to WT myotubes had led these authors to speculate that RyR3 and RyR1 co-contributed to Ca2+ sparks in WT myotubes (Conklin et al. 1999b). The interpretation of our present results neither discounts nor supports this possibility. However we find that frog fibres, which co-express RyR1 and RyR3 homologues, produce Ca2+ sparks which are quite similar if not smaller than the exclusively RyR3-expressing myotubes.
In RyR3-expressing myotubes, Ca2+ sparks recorded in repetitive trains at a given spatial location were closely similar in amplitude, with a clear absence of smaller events. Since the amplitude of a spark provides a measure of the Ca2+ release during the opening of the underlying channel(s), the absence of smaller events is inconsistent with the stochastic closing of a single Ca2+ release channel (Klein et al. 1999). The stereotypic amplitudes in a repetitive train at a given location may thus be indicative of a tight regulation of the amount of Ca2+ released in each of these repetitive sparks (Klein et al. 1999; Schneider, 1999). Such regulation of release appears to reside with RyR function since the reproducibility of release in repetitive sparks is seen in both intact (Parker & Wier, 1997; Klein et al. 1996; Bridge et al. 1999) and membrane-disrupted cells (Klein et al. 1999; and present data).
The Ca2+ sparks observed here in permeabilized myotubes expressing RyR3 might be generated by the activity of either a single RyR3 Ca2+ release channel or by the integrated activity of a small cluster of such channels (Cheng et al. 1993; Lipp & Niggli, 1996; Schneider, 1999). In either case, the net amplitude and spatial extent of locally elevated [Ca2+] was sufficient to cause a detectable increase in local fluorescence without initiating a spread of activation to neighbouring channels or groups of channels. We conclude that RyR3 channels must have the requisite properties of Ca2+ release, either individually or in clusters, to produce detectable spontaneous Ca2+ sparks when expressed in a skeletal muscle environment. Furthermore, expression of RyR3 (or its non-mammalian homologue) may be a critical factor determining the appearance of spontaneous Ca2+ sparks in skeletal muscle.
References
- Airey JA, Beck CF, Murakami K, Tankesley SJ, Deerinck TJ, Ellisman MH, Sutko JL. Identification and localization of two triad junctional foot protein isoforms in mature avian fast twitch skeletal muscle. Journal of Biological Chemistry. 1990;265:14187–15194. [PubMed] [Google Scholar]
- Bhat MB, Zhao J, Zang W, Balke W, Takeshima H, Wier WG, Ma J. Caffeine-induced release of intracellular Ca2+ from Chinese hamster ovary cells expressing skeletal muscle ryanodine receptor. Journal of General Physiology. 1997;110:749–762. doi: 10.1085/jgp.110.6.749. [DOI] [PMC free article] [PubMed] [Google Scholar]
- Bridge JB, Ershler PR, Cannell MB. Properties of Ca2+ sparks evoked by action potentials in mouse ventricular myocytes. The Journal of Physiology. 1999;518:469–478. doi: 10.1111/j.1469-7793.1999.0469p.x. [DOI] [PMC free article] [PubMed] [Google Scholar]
- Chandler WK, Rakowski RF, Schneider MF. Effects of glycerol treatment and maintained depolarization on charge movement in skeletal muscle. The Journal of Physiology. 1976;254:285–316. doi: 10.1113/jphysiol.1976.sp011233. [DOI] [PMC free article] [PubMed] [Google Scholar]
- Chen S, Wayne R, Ebisawa K, Li X, Zhang L. Molecular identification of the ryanodine receptor Ca2+ sensor. Journal of Biological Chemistry. 1999;273:14675–14678. doi: 10.1074/jbc.273.24.14675. [DOI] [PubMed] [Google Scholar]
- Cheng H, Lederer WJ, Cannell MB. Ca2+ sparks: elementary events underlying excitation contraction coupling in heart muscle. Science. 1993;262:740–744. doi: 10.1126/science.8235594. [DOI] [PubMed] [Google Scholar]
- Conklin M, Powers P, Gregg RG, Coronado R. Ca2+ sparks in embryonic skeletal muscle myotubes selectively deficient in dihydropyridine receptor α1s or β1a subunits. Biophysical Journal. 1999;76:657–669. doi: 10.1016/S0006-3495(99)77233-4. [DOI] [PMC free article] [PubMed] [Google Scholar]
- Conklin M, Strube C, Sorrentino V, Coronado R. Contribution of ryanodine receptor type 3 to Ca2+ sparks in embryonic skeletal muscle. Biophysical Journal. 1999;77:1394–1403. doi: 10.1016/S0006-3495(99)76988-2. [DOI] [PMC free article] [PubMed] [Google Scholar]
- Conti A, Gorza L, Sorrentino V. Differential distribution of ryanodine receptor type 3 (RyR3) gene product in mammalian skeletal muscle. Biochemical Journal. 1996;316:19–23. doi: 10.1042/bj3160019. [DOI] [PMC free article] [PubMed] [Google Scholar]
- Fraefel C, Song S, Lim F, Lang P, Yu L, Wang Y, Wild P, Geller AI. Helper virus-free transfer of herpes simplex virus type 1 plasmid vectors into neuronal cells. Journal of Virology. 1996;70:7190–7197. doi: 10.1128/jvi.70.10.7190-7197.1996. [DOI] [PMC free article] [PubMed] [Google Scholar]
- Jiang YH, Klein MG, Schneider MF. Numerical simulation of Ca2+‘sparks’ in skeletal muscle. Biophysical Journal. 1999;77:2333–2357. doi: 10.1016/s0006-3495(99)77072-4. [DOI] [PMC free article] [PubMed] [Google Scholar]
- Klein MG, Cheng H, Santana LF, Jiang YH, Lederer WJ, Schneider MF. Two mechanisms of quantized calcium release in skeletal muscle. Nature. 1996;379:455–458. doi: 10.1038/379455a0. [DOI] [PubMed] [Google Scholar]
- Klein MG, Lacampagne A, Schneider MF. A repetitive mode of activation of discrete Ca2+ release events (Ca2+ sparks) in frog skeletal muscle fibres. The Journal of Physiology. 1999;515:391–411. doi: 10.1111/j.1469-7793.1999.391ac.x. [DOI] [PMC free article] [PubMed] [Google Scholar]
- Lacampagne A, Klein MG, Schneider MF. Modulation of the frequency of spontaneous sarcoplasmic reticulum Ca2+ release events (Ca2+ sparks) by myoplasmic [Mg2+] in frog skeletal muscle. Journal of General Physiology. 1998;111:207–224. doi: 10.1085/jgp.111.2.207. [DOI] [PMC free article] [PubMed] [Google Scholar]
- Lacampagne A, Lederer WJ, Schneider MF, Klein MG. Repriming and activation alter the frequency of stereotyped discrete Ca2+ release events in frog skeletal muscle. The Journal of Physiology. 1996;497:581–588. doi: 10.1113/jphysiol.1996.sp021791. [DOI] [PMC free article] [PubMed] [Google Scholar]
- Lipp P, Niggli E. Submicroscopic calcium signals as fundamental events of excitation-contraction coupling in guinea-pig cardiac myocytes. The Journal of Physiology. 1996;492:31–38. doi: 10.1113/jphysiol.1996.sp021286. [DOI] [PMC free article] [PubMed] [Google Scholar]
- Meissner G. Ryanodine receptor/Ca2+ release channels and their regulation by endogenous effectors. Annual Review of Physiology. 1994;56:485–508. doi: 10.1146/annurev.ph.56.030194.002413. [DOI] [PubMed] [Google Scholar]
- Moore RA, Fessendsen JD, Wang Y, Chen SRW, Allen PD, Pessah IN. Viral expression of RYR1 and RYR3 in a myogenic cell line lacking native RyR. Biophysical Journal. 1999;76:A394. [Google Scholar]
- Moore RA, Nguygen H, Galceran J, Pessah IN, Allen PD. A transgenic myogenic cell line lacking ryanodine protein for homologous expression studies: Reconstitution of Ry1R protein and function. Journal of Cell Biology. 1998;140:843–851. doi: 10.1083/jcb.140.4.843. [DOI] [PMC free article] [PubMed] [Google Scholar]
- Murayama T, Oba T, Katayama E, Oyamada H, Oguchi K, Kobayashi M, Otsuka K, Ogawa Y. Further characterization of the type 3 ryanodine receptor (RyR3) purified from rabbit diaphragm. Journal of Biological Chemistry. 1999;274:17297–17308. doi: 10.1074/jbc.274.24.17297. [DOI] [PubMed] [Google Scholar]
- Nakai J, Dirksen RT, Nguyen HT, Pessah IN, Beam KG, Allen PD. Enhanced dihydropyridine receptor channel activity in the presence of ryanodine receptor. Nature. 1996;380:72–75. doi: 10.1038/380072a0. [DOI] [PubMed] [Google Scholar]
- Nelson MT, Cheng H, Rubart M, Santana LF, Bonev AD, Knot HJ, Lederer HJ. Relaxation of arterial smooth muscle by Ca2+ sparks. Science. 1995;270:633–637. doi: 10.1126/science.270.5236.633. [DOI] [PubMed] [Google Scholar]
- Parker I, Wier WG. Variability in frequency and characteristics of Ca2+ sparks at different release sites in rat ventricular myocytes. The Journal of Physiology. 1997;505:337–344. doi: 10.1111/j.1469-7793.1997.337bb.x. [DOI] [PMC free article] [PubMed] [Google Scholar]
- Perez-Terzic C, Stehno-Bittel L, Clapham DE. Nucleoplasmic and cytoplasmic differences in the fluorescence properties of the calcium indicator Fluo-3. Cell Calcium. 1997;21:275–282. doi: 10.1016/s0143-4160(97)90115-9. [DOI] [PubMed] [Google Scholar]
- Pratusevich VR, Balke CW. Factors shaping the confocal image of the calcium spark in cardiac muscle cells. Biophysical Journal. 1996;71:2942–2957. doi: 10.1016/S0006-3495(96)79525-5. [DOI] [PMC free article] [PubMed] [Google Scholar]
- Protasi F, Franzini-Armstrong C, Allen PD. Role of ryanodine receptors in the assembly of calcium release units in skeletal muscle. Journal of Cell Biology. 1998;140:831–842. doi: 10.1083/jcb.140.4.831. [DOI] [PMC free article] [PubMed] [Google Scholar]
- Protasi F, Franzini-Armstrong C, Flucher BE. Coordinated incorporation of skeletal muscle dihydropyridine receptors and ryanodine receptors in peripheral couplings of BC3H1 cells. Journal of Cell Biology. 1997;137:859–870. doi: 10.1083/jcb.137.4.859. [DOI] [PMC free article] [PubMed] [Google Scholar]
- Protasi F, Takekura H, Chen SRW, Franzini-Armstrong C, Allen PD. RyR3 expression in a dyspedic cell line does not restore junctional DHPR-tetrads. Biophysical Journal. 1999;76:A470. [Google Scholar]
- Rios E, Brum G. Involvement of dihydropyridine receptors in excitation-contraction coupling in skeletal muscle. Nature. 1987;325:717–720. doi: 10.1038/325717a0. [DOI] [PubMed] [Google Scholar]
- Rios E, Pizarro G. Voltage sensors and calcium channels of excitation-contraction coupling. News in Physiological Sciences. 1988;3:223–228. [Google Scholar]
- Schneider MF. Ca2+ sparks in frog skeletal muscle: generation by one, some or many SR Ca2+ release channels? Journal of General Physiology. 1999;113:365–371. doi: 10.1085/jgp.113.3.365. [DOI] [PMC free article] [PubMed] [Google Scholar]
- Schneider MF, Chandler WK. Voltage dependent charge movement in skeletal muscle. Nature. 1973;242:244–246. doi: 10.1038/242244a0. [DOI] [PubMed] [Google Scholar]
- Shirokova N, Garcia J, Rios E. Local Ca2+ release in mammalian skeletal muscle. The Journal of Physiology. 1998;512:377–384. doi: 10.1111/j.1469-7793.1998.377be.x. [DOI] [PMC free article] [PubMed] [Google Scholar]
- Sutko JL, Airey JA. Ryanodine receptor Ca2+ release channels: Does diversity in form equal diversity in function? Physiological Reviews. 1996;76:1027–1071. doi: 10.1152/physrev.1996.76.4.1027. [DOI] [PubMed] [Google Scholar]
- Tanabe T, Beam KG, Powel JA, Numa S. Restoration of excitation-contraction coupling and slow calcium current in dysgenic muscle by dihydropyridine receptor complementary DNA. Pflügers Archiv. 1987;410:75–82. doi: 10.1038/336134a0. [DOI] [PubMed] [Google Scholar]
- Tarroni P, Rossi D, Conti A, Sorrentino V. Expression of the ryanodine receptor type 3 calcium channel during muscle development and differentiation of mammalian skeletal muscle cells. Journal of Biological Chemistry. 1997;272:19808–19813. doi: 10.1074/jbc.272.32.19808. [DOI] [PubMed] [Google Scholar]
- Tsugorka A, Rios E, Blatter LA. Imaging elementary events of Ca2+ release in skeletal muscle cells. Science. 1995;269:1723–1726. doi: 10.1126/science.7569901. [DOI] [PubMed] [Google Scholar]
- Wang Y, Fraefel C, Protasi F, Moore RA, Fessenden JD, Pessah IN, DiFrancesco A, Breakefield X, Allen P D. HSV-1 amplicon vectors are a highly efficient gene delivery system for skeletal muscle myoblasts and myotubes. American Journal of Physiology – Cell Physiology. 2000;47:C619–624. doi: 10.1152/ajpcell.2000.278.3.C619. [DOI] [PubMed] [Google Scholar]
- Ward CW, Lacampagne A, Klein MG, Schneider MF. Ca2+ spark properties in saponin permeabilized skeletal muscle fibers. Biophysical Journal. 1998:A269. [Google Scholar]