Abstract
Lymphocyte function and phenotype of peripheral blood and mammary gland cells were evaluated in non-periparturient cows before and at 1, 4 to 8 and 9 to 14 d after inoculation with Staphylococcus aureus, as expressed by percentage of CD3+, CD2+, and CD45R+ cells, antigen density of these markers per lymphocyte, and mitogen-induced blastogenesis. Milk bacterial counts and somatic cell counts (SCC) were also assessed. Mitogen-induced blastogenic responses were strong in blood and weak in mammary gland cells in all observations and positively correlated with the percent of CD45R+ cells. Significantly greater percentages of milk CD3+ lymphocytes and increased CD3, CD2, and CD45R antigen density per cell were observed after challenge. The blood CD3 and CD2 antigen density per lymphocyte and the milk CD2+ lymphocyte percent were negatively correlated with SCC (P ≤ 0.01). No mastitis (SCC ≤ 500 000 cells/mL) was observed in cows showing blood lymphocyte CD2 and CD3 antigen density indices ≥ 2.5 and 6, respectively. Forty-one percent of SCC values were predicted by the combined blood CD2 and milk CD3 antigen density (P ≤ 0.01). These findings support the hypotheses that mitogen-induced lymphocyte blastogenesis is not a valid test to assess mammary gland immunocompetence and that CD2 expression may facilitate immune responses by decreasing the number of T cell receptors required to achieve full activation.
Assessment of cellular immune responses is crucial for the diagnosis of bovine mastitis, as well as for evaluation of management practices and therapeutics aimed at prevention of this disease. A review of the literature indicates that most mastitis-related immunologic research has been based on evaluation of blood cells in spontaneous mastitis while only a few studies of bovine mastitis have compared blood and mammary gland lymphocyte phenotype and function under longitudinal experimental designs (1).
T lymphocytes are the prevailing bovine mammary gland lymphocytes (2). One classic assay of lymphocyte function is mitogen-induced blastogenesis. Previous studies have indicated depressed blood lymphocyte blastogenic responses around parturition (3); however, blastogenic responses have not been investigated in conjunction with phenotypic studies in non-periparturient dairy cows. One molecule associated with blastogenesis is CD45, as suggested by the fact that a monoclonal antibody against CD45R (one CD45 isoform) blocks blastogenic responses in some species (4).
T-lymphocyte-mediated immune responses depend on 2 interrelated events: a) the initial engagement of the T cell receptor (TCR) after antigen recognition, and b) the subsequent TCR downstream signaling process, which leads to proliferation and cytokine production (5). T cell activation depends, at least, on the number of triggered TCRs. Only after a certain threshold is achieved is full T cell activation reached. However, these events are also dependent on small costimulatory molecules, such as CD2 and CD28. Both CD2 and CD28 can significantly reduce the threshold of triggered TCRs required for cell proliferation and cytokine synthesis. Initial binding of TCRs and antigen-presenting cells results in the formation of the “immunologic synapse” (IS), which segregates small molecules (TCR/CD3, CD2) to its center while large molecules (LFA-1, CD45) segregate to the periphery. This results in increased tyrosine kinase-mediated phosphorylation, which is facilitated by CD2, or removal of tyrosine phosphatases, such as CD45 (5).
Formation of the IS, rather than formation of the initial TCR- peptide/major histocompatibility complex (MHC) interaction, appears to be the central event leading to full T cell activation. Consequently, any factor essential for IS formation will be essential for full T cell activation, such as CD2 expression. CD2 stimulates T cell activation in the absence of direct engagement of antigen- specific TCR, induces tyrosine phosphorylation and increases expression of TCR ζ chain, resulting in enhanced CD3 receptor density (6). Increases in CD2 receptor density also lead to augmented cytokine production (7).
Impairments of T cell function (defects in TCR-CD3 expression) have been correlated with greater susceptibility to infection in various clinical conditions (8), and, vice versa, enhanced TCR/CD3 constitutive expression has been reported and commented to be a factor of innate immunity and/or autoimmunity (9).
One major pathogen associated with bovine mastitis is Staphylococcus aureus. Enterotoxins from S. aureus are superantigens that bind MHC class II (MCHII) antigen-presenting cells outside the conventional peptide-binding groove, which results in T cell activation and cytokine production. Optimal T cell activation by S. aureus superantigens, both in humans and bovines, depends on adhesion molecules, such as CD2 (10,11).
Thus, assessment of lymphocyte proliferation and CD3, CD2, and CD45R expression may be relevant to evaluate cell-mediated immune responses associated with S. aureus-induced mastitis. While the individual expression of these differentiation antigens has been investigated before (2,3,12), no study has assessed the role of CD3 in conjunction with CD2 and CD45R in the context of mastitic non-periparturient cows (animals not subject to partum-related immune depression). This study assessed longitudinally peripheral blood and mammary gland lymphocyte phenotype and function in lactating non-periparturient cows experimentally challenged with S. aureus.
First-lactation (2 mo or later within lactation) heifers were recruited for this study based on: 1) no previous history of mastitis; 2) no individual somatic cell count (SCC) greater than 200 000/mL; and 3) an average of 3 consecutive SCCs less than 120 000. Animals were housed, fed, and milked according to United States federal regulations and housed in Association for Assessment and Accreditation of Laboratory Animal Care (AAALAC)-accredited facilities. Six healthy Holstein heifers were tested 4 times (before and 3 times after experimental challenge). Staphylococcus aureus ribotype 116-232-S3 was cultured in Todd-Hewitt broth at 37°C until exponential growth phase was reached, then the colony-forming units (cfu) were counted and diluted to 150 to 200 cfu/mL in the same medium and refrigerated until infused, as described elsewhere (13). Two mammary quarters were randomly selected for bacterial inoculation and tested at time 0 (before) and 1, 4 to 8, and 9 to 14 d postinoculation. All S. aureus isolates recovered from the milk of inoculated cows were ribotype 116-232-S3. Milk SCC was determined with a cell counter at the North East Dairy Herd Improvement Association (Ithaca, New York, USA). No inoculated cow became febrile.
In order to isolate milk leukocytes, 2 L of milk (1 L from each of the 2 selected quarters) from the morning milking was collected in disinfected milkers, mixed, and transported at 4°C in sterile, 1-liter bottles containing 10 mL (100X) of antibiotic-antimycotic (catalog 15240-039; Gibco, Grand Island, New York, USA) and 12.5 μg/mL of gentamicin (catalog 15710-015; Gibco). Processing of milk began within 1 h of collection. Milk was diluted in an equal volume of buffer containing phosphate-buffered saline (PBS), 10% acid citrate dextrose, and 20 mM EDTA (PAE) buffer and centrifuged for 40 min at 350 × g at 15°C. The supernatant and fat layer were decanted, and the cell pellet was washed 3 times in PAE buffer. The cell pellet was resuspended in 30 mL of Hank's balanced salt solution (HBSS; Gibco). Approximately 15 mL of blood from the tail vein was collected in heparinized tubes and stored and transported at 4°C. Cells were diluted 1:1 in HBSS and then were centrifuged, collected, and washed as indicated above. Lymphocytes were isolated by density gradient centrifugation (density: 1.077 g/mL) on Ficoll (blood) or Percoll (milk) (Amersham-Pharmacia Biotech Inc., Piscataway, New Jersey, USA) (30 min at 800 × g, 15°C). The mononuclear cell band was then collected at the interface, washed 3 times in 10% fetal bovine serum (FBS; Hy-Clone, Logan, Utah, USA)-HBSS and resuspended in 5 mL of Roswell Park Memorial Institute buffer (RPMI; Gibco), 10% FBS, and 5% of a tissue culture cocktail containing 0.1 mM non-essential amino acids, 2 mM L-glutamine, 1 mM sodium pyruvate, 10 mM Hepes buffer and 1X antibiotic-antimycotic (Gibco). The volume of each sample (blood and milk) was recorded, as well as the number of collected cells. Cell viability (> 95%, blood; > 50 to 80%, milk) was determined in a hemocytometer after exposure to trypan blue.
Lymphocyte proliferation in response to mitogen stimulation was conducted as described elsewhere (14). One hundred microliters of cells (1 to 5 × 10⁶ cells/well) was diluted in complete medium [CM; composed of Weymouth's MB 721/1 medium (Gibco) with 10% heat-inactivated FBS] and added to 100 μL of each of 6 mitogen (Concanavalin A; Sigma Chemical Company, Saint Louis, Missouri, USA) concentrations (ranging from 50 ng/mL to 0.016 ng/mL per well). Controls were diluted in CM without addition of mitogen. There were 3 replicate wells per treatment. Fourteen to 16 h before the termination of a 3-day culture, 40 μL of [methyl-3H] thymidine (2 Ci/mmol; Amersham, Arlington Heights, Illinois, USA) diluted in CM was added to each well. Cultures were harvested on a multiple automated sample harvester (M.A. Bioproducts, Walkersville, Maryland, USA) and 1-minute counts were recorded by a liquid scintillation counter (model LS-230; Beckman Instruments, Fullerton, California, USA). Stimulation indices (proliferation of mitogen-stimulated over that of non-stimulated cells) reported here are those of the mitogen concentration that gave the highest proliferative response. Leukocyte types were identified by flow cytometry based on their forward and side scatter parameters and backgating was conducted on CD3+ (T lymphocytes) or CD3− cells (monocytes/ macrophages, B lymphocytes, and polymorphonuclear cells), as described (13). Immunophenotyping was conducted with monoclonal antibodies (all IgG1 isotype) against bovine CD3, CD2, and CD45R molecules, which were purchased from one source (VMRD Inc., Pullman, Washington, USA; clones: MM1A, BAQ95A, and GS5A, respectively). Negative control antibody was an IgG1 mouse antibody (catalog 08-6599; Zymed, San Francisco, California, USA). Approximately 5 ×10⁶ leukocytes were incubated in first wash buffer, which contained 2% rabbit serum diluted in pH 7.2 PAE buffer (PBS with 0.1% NaN3, 10% citrate, 10 mM EDTA) and centrifuged for 10 min at 350 × g. One million cells were then transferred to 12 × 75-mm polypropylene tubes (one for each primary antibody, including isotype control) and resuspended in 50 μL of 10% rabbit serum in PAE. After 10 min on ice, 50 μL of isotype control or monoclonal antibody was added to each tube and incubated for 30 min on ice. Cells were washed 3 times with first wash buffer and then incubated with 100 μL of the secondary antibody [optimal dilution, FITC-conjugated rabbit anti-mouse IgG (heavy and light chains) in 10% rabbit serum in PAE]. Cells were then washed 4 times with first wash buffer, fixed in 500 μL of 2% formaldehyde PBS-azide, and refrigerated until analyzed by flow cytometry (FACSCalibur; Becton-Dickinson, San Jose, California, USA). In all tests, bovine cells were isolated, labeled, and fixed within 12 h of being collected. Fluorescence data were acquired and analyzed with commercial computer software (CELLQuest; Becton-Dickinson). Gates of each leukocyte type were customized to achieve the lowest percent of non-specific fluorescence and the highest percent of specific fluorescence, as reported previously (15). At least 40 000 cells were acquired per test.
Surface antigen density index (ADI) was defined as the ratio between the CD3, CD2, or CD45R median fluorescence intensity (MFI) and the MFI of the isotype control. The CD45R percent/CD2 percent ratio was assumed to reflect the profile of blood (approximately 1:1) or milk (1:4) cells (2). Student's t- and Mann-Whitney statistical tests, correlation coefficients, and regression analysis were calculated with commercial computer software (Minitab, v. 12.2; State College, Pennsylvania, USA).
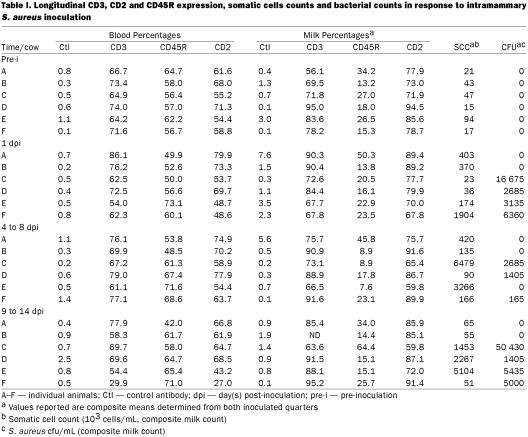
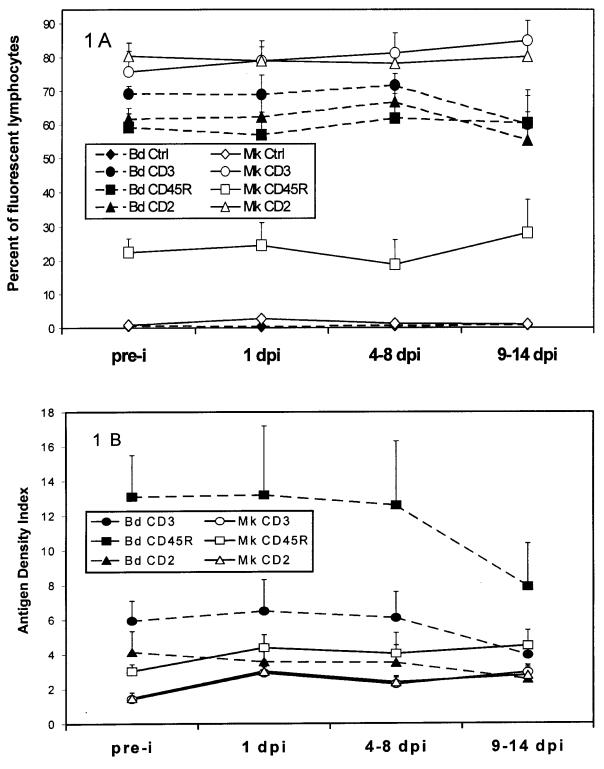
Significantly higher percentages of CD2+ cells were found in milk than in blood, before and after challenge (P ≤ 0.02). The percent of milk CD2+ cells (before and after challenge) was negatively correlated with SCC (r = – 0.53, P ≤ 0.01). Three- to 5-fold greater percentages of CD45R+ cells (P ≤ 0.01) were found in blood than in milk in all observations (Table I). The percentage of CD3+ cells did not differ between blood and milk before challenge, but it decreased in blood and increased in milk after challenge, reaching statistical significance at 9 to 14 d postinoculation (P ≤ 0.01). No significant changes were observed after challenge in the percent of milk CD2+ and CD45R+cells (Figure 1A).
Table I.
Figure 1. Longitudinal blood and mammary gland lymphocyte phenotypes in response to intramammary inoculation with S. aureus. A. Mean percentage [± standard deviation (SD)] of blood (Bd.) and mammary gland (Mk.) lymphocytes identified by fluorescent control (Ctrl), CD3, CD2, or CD45R antibodies (bars represent half of the SD, n = 6 cows). B. Mean antigen density index (± SD) (fluorescence intensity of CD3, CD2, or CD45R over that of control antibody, bars represent half of the SD, n = 6 cows).
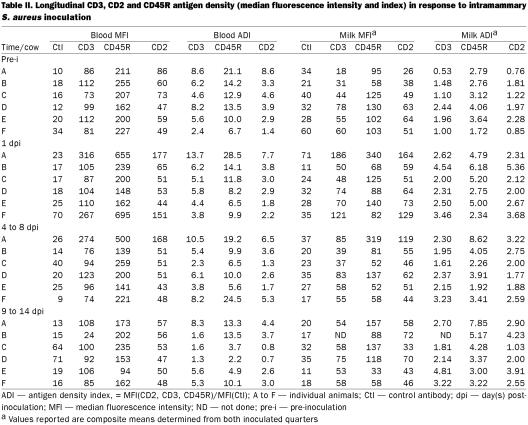
Significant postinoculation increases were noted at 1 d postinoculation in the milk MFI (antigen density per lymphocyte) of all of these markers (P ≤ 0.01, Table II and Figure 1B). Although not statistically significant, decreased antigen density of blood CD45R+ and CD3+ cells was suggested after challenge.
Table II.
Strong mitogen-induced blastogenic responses were shown by blood lymphocytes from healthy and mastitic cows (median stimulation indices: 51–78). In contrast, milk cells of both healthy and mastitic cows showed marginal responsiveness to mitogen stimulation (indices: 3.4–3.9). The CD45R/CD2 index was positively associated with blastogenic responses (r = 0.87, P = 0.06). Since the percentages of CD2+ and CD3+ cells were similar both in blood and milk, differences in the CD45R/CD2 index were mainly explained by differences in the percentage of CD45R+ cells.
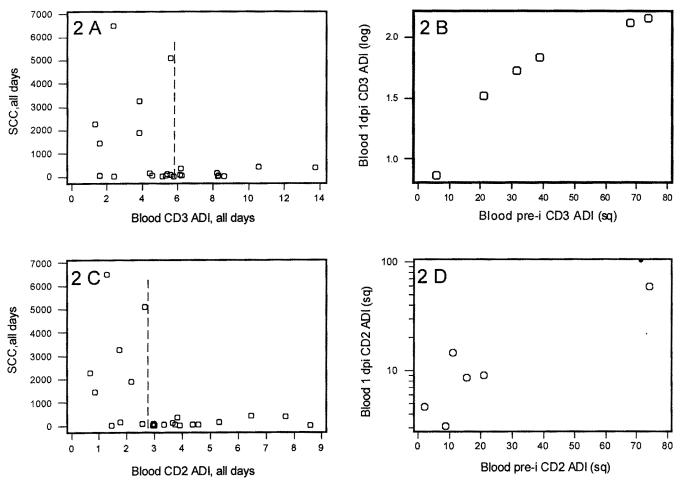
No cow with a blood lymphocyte CD3 ADI ≥ 6 or a blood lymphocyte CD2 ADI > 2.5 showed an SCC ≥ 500 000 cells/mL (Figure 2, 2C). Vice versa, all mastitic cows displayed CD3 and CD2 ADIs of less than 6 or 2.5, respectively. Pre-challenge blood CD3 and CD2 antigen density values were predictive of 1 day post-challenge values (r ≥ 0.93, P ≤ 0.01; Figure 2, 2D).
Figure 2. Relationships of somatic cell counts (SCC) vs. blood CD3 and CD2 antigen density. A. Scatterplot of CD3+ antigen density index (ADI) per blood lymphocyte vs. somatic cell counts [1 × 10³ SCC/mL, n = 24 observations (all pre- and post-inoculation observations)]. B. Correlation of pre-inoculation vs. 1 d postinoculation blood CD3 ADI. Pre-inoculation data are square root-transformed, 1 d postinoculation data are log-transformed (n = 6 cows). C. Scatterplot of CD2+ ADI per blood lymphocyte vs. SCC [n = 24 observations (all pre- and postinoculation observations)]. D. Correlation of pre-inoculation vs. 1 day postinoculation blood CD2 ADI. Data are square root-transformed (n = 6 cows).
The highest prediction of SCC by an individual indicator was found when SCC was regressed on blood CD2 antigen density (adjusted R2 = 19.3%, P ≤ 0.02). When the ADI of all of these markers on milk cells was analyzed against SCC, only CD3 ADI approached significance (P = 0.06). However, the highest explanatory prediction of SCC was obtained when both blood CD2 ADI and milk CD3 ADI were analyzed (R2 = 41%, adjusted R2 = 34.6%, P = 0.006). This analysis indicated a positive relationship between CD3 and SCC and a negative relationship between CD2 and SCC [SCC, log-transformed, all days = 5.90 + (0.145 milk CD3 ADI, square-transformed, all days) − (1.51 CD2 blood ADI, log- transformed, all days)].
These findings support the hypothesis that naive cells (CD45R+) predominate in blood, while memory cells (CD2+) predominate in the mammary gland, as suggested previously (2). Although CD2 may be expressed by CD3− cells (natural killer cells), the fact that the percentage of CD2+cells observed was similar to that of CD3+ cells indicates that most bovine CD2+ cells are lymphocytes.
Blastogenesis was positively correlated with the percent of CD45R lymphocytes. Regardless of health status (non-mastitis vs. mastitis), milk blastogenesis was marginal. This finding is in agreement with previous reports (14) and is consistent with the hypothesis that blastogenesis is associated with CD45R+ lymphocytes (4), which predominate in blood. This would indicate that, regardless of health status, mitogen-induced blastogenesis lacks validity for assessment of milk lymphocyte immunocompetence.
These findings suggest a relevant role for CD2 in conjunction with CD3. The fact that blood CD2 ADI was not positively associated with milk CD3 ADI (variations in one direction by CD2 values were not associated with variations in the same direction by CD3) suggests that increased CD2 expression does not prevent mastitis by increasing the number of triggered TCR/CD3. Yet, an interaction between CD2 and CD3 was indicated by regression analysis. This apparent paradox, observed before, has been interpreted as evidence of the co-stimulatory role of molecules such as CD28 and CD2, which enhance the second phase of T cell activation (the signaling process), not the number of triggered TCRs (16,17). By enhancing the TCR/CD3 downstream signaling process, CD2 may reduce the threshold required to achieve full activation, which would be expressed as a negative relationship by regression analysis (CD2 increases are associated with CD3 decreases which result in SCC decreases), as observed.
The reported CD2-CD3 interaction may have profound implications for prevention of mastitis. While TCR triggering may not require CD2 in presence of excessive antigen concentration, CD2-mediated T cell activation may be crucial when antigen concentration is marginal, such as the early phase of bacterial invasion (when bacteria have not replicated), as suggested before (18). The CD2-mediated decreased TCR threshold required for activation may prevent bacteria replication by facilitating early T cell activation (17). Thus, CD2 does not seem to be an “accessory” molecule, but a co-factor essential for optimal anti-bacterial responses.
Since 1 d postchallenge, CD2 receptor density values were predicted by prechallenge values, it appears that the outcome of bacterial invasion is dependent on prechallenge phenotype. Consequently, it is hypothesized that selection practices for animals of lower S. aureus mastitis incidence could consider the constitutive levels of CD2 and CD3 antigen density per cell. Since CD2 antigen density may be modulated (19), enhanced expression of this marker could be explored in non-periparturient animals. Further longitudinal studies should evaluate the generalizability of these predictions for other S. aureus strains, bacterial species, and animal categories.
Footnotes
Address correspondence and reprint requests to Dr. Ariel L. Rivas, tel: 607-253-3900, fax: 607-253-3943, e-mail: alr4@cornell.edu.
Received August 27, 2001. Accepted January 14, 2002.
References
- 1.Rivas AL, Deshler JD, Quimby FW, et al. Interdisciplinary question generation: synthesis and validity analysis of the 1993–1997 bovine mastitis-related literature. Scientometrics 1998;42:377–403.
- 2.Taylor BC, Dellinger JD, Cullor JS, et al. Bovine milk lymphocytes display the phenotype of memory T cells and are predominantly CD8+. Cell Immunol 1994;156:245–253. [DOI] [PubMed]
- 3.Mallard BA, Dekkers JC, Ireland MJ, et al. Alteration in immune responsiveness during the peripartum period and its ramification on dairy cow and calf health. J Dairy Sci 1998;81:585–595. [DOI] [PubMed]
- 4.Robson SC, Siegel JB, Kirsch RE. Inhibition of T cell mitogenesis by a novel anti-CD45R monoclonal antibody. Immunol Cell Biol 1996;74:65–71. [DOI] [PubMed]
- 5.van der Merwe PA, Davis SJ, Shaw AS, Dustin ML. Cytoskeletal polarization and redistribution of cell-surface molecules during T cell antigen recognition. Semin Immunol 2000;12:5–21. [DOI] [PubMed]
- 6.Lin H, Martelli MP, Bierer BE. The involvement of the proto-oncogene p120 c-Cbl and ZAP-70 in CD2-mediated T cell activation. Int Immunol 2001;13:13–22. [DOI] [PubMed]
- 7.Le Guiner S, Le Dréan E, Labarrière N, et al. LFA-3 co-stimulates cytokine secretion by cytotoxic T lymphocytes by providing a TCR-independent activation signal. Eur J Immunol 2000;28: 1322–1331. [DOI] [PubMed]
- 8.Willard-Gallo KE, Furtado M, Burny A, Wolinsky SM. Down-modulation of TCR/CD3 surface complexes after HIV-1 infection is associated with differential expression of the viral regulatory genes. Eur J Immunol 2001;31:969–979. [DOI] [PubMed]
- 9.Nicolas L, Monneret G, Debard A-L, et al. Human γδ T cells express a higher TCR/CD3 complex density than αβ T cells. Clin Immunol 2001;98:358–363. [DOI] [PubMed]
- 10.Krakauer T. Cell adhesion molecules are co-receptors for staphylococcal enterotoxin B-induced T-cell activation and cytokine production. Immunol Letters 1994;39:121–125. [DOI] [PubMed]
- 11.Ebling TL, Fox LK, Bayles KW, et al. Bovine mammary immune response to an experimental intramammary infection with a Staphylococcus aureus strain containing a gene for staphylococcal enterotoxin C1. J Dairy Sci 2001;84:2044–2050. [DOI] [PubMed]
- 12.Park YH, Fox LK, Hamilton MJ, et al. Suppression of proliferative response of BoCD4+ T lymphocytes by activated BoCD8+ T lymphocytes in the mammary gland of cows with Staphylococcus aureus mastitis. Vet Immunol Immunopathol 1993;36:137–151. [DOI] [PubMed]
- 13.Rivas AL, Quimby FW, Coksaygan O, et al. Longitudinal evaluation of CD4+ and CD8+ peripheral blood and mammary gland lymphocytes in cows experimentally inoculated with Staphylococcus aureus. Can J Vet Res 2000;64:232–237. [PMC free article] [PubMed]
- 14.Concha C, Hu S, Holmberg O. The proliferative responses of cow stripping milk and blood lymphocytes to pokeweed mitogen and ginseng in vitro. Vet Res 1996;27:107–115. [PubMed]
- 15.Rivas AL, Quimby FW, Blue J, et al. Longitudinal evaluation of bovine mammary gland health status by somatic cell counts, flow cytometry and cytology. J Vet Diagn Invest 2001;13:399–407. [DOI] [PubMed]
- 16.Viola A, Lanzavecchia A. T cell activation determined by T cell receptor number and tunable thresholds. Science 1996;273: 104–106. [DOI] [PubMed]
- 17.Bachmann MF, Barner M, Kopf M. CD2 sets quantitative thresholds in T cell activation. J Exp Med 1999;190:1383–1391. [DOI] [PMC free article] [PubMed]
- 18.Shafer-Weaver KA, Sordillo LM. Enhancing bactericidal activity of bovine lymphoid cells during the periparturient period. J Dairy Sci 1996;79:1347–1352. [DOI] [PubMed]
- 19.Heath HL, Blagburn BL, Elsasser TH, et al. Hormonal modulation of the physiological responses of calves infected with Eimeria bovis. Am J Vet Res 1997;58:891–896. [PubMed]


