

Abstract
Motoneurones are particularly vulnerable both in human forms of amyotrophic lateral sclerosis (ALS) and corresponding animal models of the disease. While most motoneurone populations are selectively impaired, oculomotor neurones are essentially resistant to ALS-related damage.
Motoneurone vulnerability has been closely linked to disruptions of calcium signalling. To investigate underlying events, we performed a quantitative analysis of calcium homeostasis in oculomotor neurones from mice by simultaneous patch-clamp recordings in sliced tissue and microfluorometric-calcium measurements.
Somatic calcium dynamics were investigated by using a computer-controlled microfluorometric system. In oculomotor neurones, basal calcium concentrations were around 80 nm and depolarisation-induced calcium responses were observed for membrane voltages positive to −40 mV.
Endogenous calcium homeostasis was quantified by using the ‘added buffer’ approach. The recovery phase of depolarisation-induced calcium transients was well approximated by a mono-exponential function with a decay time constant that showed a linear dependence on dye concentration. The extrapolated time constant in the absence of indicator dye was 1.7 ± 0.2 s (n = 11 cells, 21°C).
Endogenous calcium binding ratios (κs) were found to be 264 ± 25 (n = 11 cells), indicating that 99.6 % of cytosolic calcium ions were taken up by endogenous buffers. Recovery of calcium transients was characterised by an ‘effective’ extrusion rate γ= 156 ± 20 s−1 (n = 11 cells, 21 °C).
Endogenous calcium binding ratios in oculomotor neurones were 5- to 6-fold larger compared with those of more vulnerable motoneurones in the nucleus hypoglossus and spinal cord. In a first order approximation, they reduced the volume of local calcium elevations around open calcium channels, lowered peak amplitudes of global calcium transients for a given influx and prolonged calcium recovery times for a given set of uptake and extrusion mechanisms.
With respect to motoneurone degeneration, our measurements suggest that the exceptional stability of oculomotor neurones partially results from a specialised calcium homeostasis based on high buffering capacities. Furthermore, they indicate that cellular adaptations that account for rapid calcium signalling in hypoglossal and spinal motoneurones enhance their vulnerability during ALS-related motoneurone disease.
Calcium signals in motoneurones are shaped by multiple processes, including calcium influx, release, buffering, uptake and extrusion across cellular membranes (McBurny & Neering, 1987; Blaustein, 1988; Baimbridge et al. 1992; Neher, 1995; Lips & Keller, 1999; Palecek et al. 1999). Under pathophysiological conditions, disturbances of calcium homeostasis have been linked to severe motoneurone damage resulting from either excitotoxic stress or related cellular disruptions (DePaul et al. 1988; Choi, 1988; Rohstein & Kuncl, 1995; Krieger et al. 1996; Shaw & Ince, 1997; Roy et al. 1998; Carriedo et al. 2000). For example, in human amyotrophic lateral sclerosis (ALS) and related animal models of the disease, overexcitation of glutamatergic synapses and excess calcium influx have been associated with severe cell damage (Choi, 1987; Meldrum & Garthwaite, 1990; Rothstein et al. 1992, 1995; Carriedo et al. 1996; Medina et al. 1996; Shaw & Ince, 1997; Bar-Peled et al. 1999). Moreover, in genetically determined forms of ALS, mutations in either axonal neurofilaments (NFL) or the enzyme superoxide dismutase (SOD1) have been shown to trigger calcium-related motoneurone degeneration (Tu et al. 1996; Bruijn et al. 1998; Morrison & Morrison, 1998; Siklos et al. 1998; Williamson et al. 1998; Cleveland, 1999). The clinical importance of these mechanisms is illustrated by the finding that blockers of cellular calcium influx provide neuroprotection, where reductions of neurotransmitter- and voltage-dependent calcium influx display beneficial effects (Smith et al. 1992; Gurney et al. 1996; Roy et al. 1998).
An important question is related to the role of individual cellular parameters for calcium-mediated neuronal damage. For example, studies on hippocampal cells have suggested that high calcium buffering enhances neuronal vulnerability, mainly by disrupting calcium-dependent inactivation of voltage-activated calcium channels (Chad, 1989; Abdel-Hamid & Baimbridge, 1997; Nägerl & Mody, 1998). This view has received support from studies of transgenic animals, where genetic ‘knock-out’ of the cytosolic calcium buffer calbindin protected hippocampal cells against ischaemia-related degeneration (Klapstein et al. 1998). On the other hand, several studies have demonstrated that decreased buffer concentrations can enhance neurodegeneration in other model systems (Alexianu et al. 1994, 1998; Tymianski et al. 1994; Reiner et al. 1995; Roy et al. 1998). In those studies, neuroprotective effects of buffer elevation were mainly attributed to reduced peak amplitudes of intracellular free calcium levels for a given calcium influx.
In this report, we investigated the potential role of endogenous calcium homeostasis for selective motoneurone vulnerability. More specifically, our study was motivated by the fact that selected populations of motoneurones in the nucleus hypoglossus or spinal cord are particularly impaired, while others like oculomotor neurones are essentially unaffected. This is a well-known phenomenon in advanced stages of human ALS, but also in associated animal models of motoneurone disease (Ince et al. 1993; Elliot & Snider, 1995; Reiner et al. 1995). By performing a quantitative analysis based on the ‘added buffer’ approach (Neher & Augustine, 1992; Neher, 1995), we were able to compare in detail individual parameters of cellular calcium homeostasis in oculomotor neurones with values in hypoglossal and spinal cells (Lips & Keller, 1998; Palecek et al. 1999). In summary, our measurements indicate that the calcium buffering capacities in oculomotor neurones are comparable to those found in hippocampal and cortical cells (Neher, 1995), but 5- to 6-fold higher relative to those of hypoglossal and spinal motoneurones. Accordingly, our results are in agreement with the view that the remarkable stability of oculomotor neurones during ALS-related motoneurone disease partially results from a specialised calcium homeostasis with high calcium buffering.
METHODS
Preparation of slices from oculomotor nuclei
In vitro brainstem slice preparations were obtained from 2- to 6-day-old mice. Mice were decapitated with a guillotine and the brain removed. The brainstem was isolated and glued on its rostral end to the stage of a vibroslicer (75 M Vibrosclice, Campden Instruments, UK or Vibracut, Liebscher, Germany). After that the brainstem was sliced from the caudal end to the mid-brain region of oculomotor nucleus (see Fig. 1). Usually two 200 μm thick transversal slices with oculomotor nucleus were received per preparation. Animal experiments were carried out in accordance with the guidelines of the Ethics Committee of the Medical Department at the University of Göttingen as previously described. An essential requirement for simultaneous microfluorometric and patch-clamp recordings was the preservation of neurones close to the slice surface in a functionally intact state. This was achieved by minimising mechanical disturbances of tissue during slice preparations, performing isolation of slices at low temperatures (4°C) and optimising metabolic conditions by maximum oxygen supply. Slices were maintained at room temperature in continuously bubbled (95 % O2-5 % CO2) bicarbonate-buffered saline (mM): 118 NaCl, 3 KCl, 1 MgCl2, 25 NaHCO3, 1 NaH2PO4, 1.5 CaCl2, 20 glucose) at pH 7.4 (Lips & Keller, 1998). For measurements 1 μM TTX was added to the perfusion solution to prevent action potentials. Also 10 μM bicuculline and strychnine were added to the perfusion solution to reduce miniature synaptic activity. If not indicated otherwise, experiments were carried out at room temperature (21-23°C).
Figure 1. Region of interest in the midbrain and motoneurones in the oculomotor nucleus.

A, scheme of a transversal section in the brain stem of young mice. The oculomotor nucleus is located near the red nucleus and aqueduct. B, difference interference contrast picture of oculomotor neurones (Zeiss objective × 63, water immersion). Cells were identified by their large somata and distal dendrites. C, fluorescence image (F360) of an oculomotor neurone filled with fluorescent dye fura-2. Dye filling of dendrites occurred after 10–12 min of dye loading. [Ca2+]i was measured by integrating fura-2 fluorescence in a rectangular window with an average area of 12 μm2 which was located on the somatic surface.
Patch-clamp recordings
Prior to patch-clamp recordings, oculomotor nuclei were visually identified by their location close to central aqueduct (Fig. 1). Patch-clamp experiments on slice preparations were performed as previously described (Keller et al. 1991; Titz & Keller, 1997; Lips & Keller, 1998) with intracellular pipette solutions containing (mM): 130 CsCl, 30 TEACl, 11 Hepes, 2.2 MgCl2, 4.4 Na2-ATP, 0.44 Na-GTP (adjusted to pH 7.3 with CsOH). Fura-2 was purchased from Molecular Probes (Eugene, OR, USA) and used in concentrations of 45–1000 μM in the pipette solution (alternatively 500 μM mag-fura-5; Lips & Keller, 1998). Patch pipettes were pulled from borosilicate glass tubing (Hilgenberg, Malsfeld, Germany). When filled the pipettes displayed resistances of 2.0-3.5 MΩ. Patch-clamp recordings were performed with an EPC-9 amplifier (HEKA Elektronik, Lambrecht, Germany) employing optimal series resistance compensation (Titz & Keller, 1997). Cells with series resistances higher than 15 MΩ were not included in the analysis. Whole-cell currents (Edwards et al. 1989) were recorded with sampling frequencies of 100 Hz to 5 kHz. Analysis of signals was performed off-line by using the software IGOR (Wavemetrics, Oregon, USA) and Photoshop (Adobe Systems, CA, USA).
Microfluorometric calcium measurements
Measurements of intracellular calcium concentrations were performed as previously described (Lips & Keller, 1998). A computer-controlled monochromator, based on a galvanometric scanner (Polychrome I, TILL Photonics), was connected to a microscope (Fa. Zeiss, Göttingen, Germany) via quartz fibre optics (diameter 1.25 mm, NA 0.25) and a minimum number of optical components for maximum UV fluorescence excitation (objective Achroplan W × 63, 0.9 W). Switching between wavelengths was achieved in less than 3 ms, allowing rapid ratiometric calcium measurements. Calculations and analysis of intracellular calcium concentrations were performed off-line after the experiment. Calibration constants for fura-2 were determined according to Grynkiewicz et al. (1985) by patch clamping cells with the following intracellular solutions (mM): Rmin: 130 CsCl, 30 TEACl, 11 Hepes, 2.2 MgCl2, 4.4 Na2-ATP, 0.44 Na-GTP, 10 BAPTA (adjusted to pH 7.3 with KOH), Rmedium: 130 CsCl, 30 TEACl, 11 Hepes, 2.2 MgCl2, 4.4 Na2-ATP, 0.44 Na-GTP, 9.9 BAPTA, 6.6 CaCl2 yielding a final concentration of 450 nM [Ca2+]i and Rmax: 130 CsCl, 11 Hepes, 2.2 MgCl2, 4.4 Na2-ATP, 0.44 Na-GTP, 10 CaCl2. The dissociation constant for fura-2 (Kd) was determined by using the equation:
| (1) |
Calibration constants Kd, Rmax and Rmin were adjusted after several days of experiments to account for small fluorescence changes in the microfluorometric system. Typical values for Kd, Rmin and Rmax were 250 nM, 0.2 and 3.2, respectively. Statistics given throughout the text are means ±s.d., if not otherwise indicated. Fluorescence intensity is given in bead units (cat. no. 18340, Polysciences Inc, PA, USA): bead units (BU) are very small fluorescence plates (diameter around 5 μM), which allow determination of a standardised fluorescence value for different microfluorometric setups (see also Zhou & Neher, 1993a).
A quantitative model for calcium homeostasis in oculomotor neurones
Calcium homeostasis in motoneurones was described by a linear, one compartment model by using the ‘added buffer’ method introduced by Neher & Augustine (1992). In this case, cellular parameters are probed by competition between ‘endogenous’ calcium buffers (S) and ‘exogenously’ added buffer (B), i.e. the calcium indicator dye. Accordingly, the calcium binding ratio κs of endogenous buffers is defined by;
| (2) |
where [CaS]i and [Ca2+]i denote the concentration of calcium bound to endogenous buffers and the intracellular free calcium concentration, respectively. The incremental Ca2+ binding ratio κB′ of indicator dyes is given by (Neher & Augustine, 1992; Neher, 1995; Helmchen et al. 1996, 1997):
| (3) |
where [Ca2+]rest is the free calcium concentration at rest, [Ca2+]peak is the peak calcium concentration during a stimulation and [B]T and Kd are the concentration and dissociation constant of the calcium indicator dye, respectively. Recovery of calcium transients is approximated by an exponential decay time constant:
| (4) |
where γ denotes the ‘effective’ extrusion rate (Neher, 1995; Lips & Keller, 1998; Palecek et al. 1999). Similarly, amplitudes of calcium transients (A) are characterised by the equation:
| (5) |
where qca and F denote the calcium-mediated charge influx per volume element and the Faraday constant, respectively. Stimulus-induced deflections in calcium-dependent fluorescence (dF390) increased with exogenous buffer concentrations, thus providing another monitor of calcium buffering according to the equation (Neher, 1995; Helmchen et al. 1996, 1997; Palecek et al. 1999):
| (6) |
where dFmax denotes the saturating value of dF390. Experimentally, this analysis was performed by plotting dF390 as a function of κB‘.
To evaluate the role of calcium homeostasis for localised calcium signalling, it is useful to consider the length of time that a calcium ion entering through a membrane ion channel can diffuse before it is ‘captured’ by a cytosolic calcium buffer (Neher, 1986):
| (7) |
where kon and [B] denote the on-rate and the concentration of the cytosolic calcium buffer, respectively. For a given value of the calcium diffusion constant DCa (around 220 μm2 s−1) and kon (around 108 m s−1 for large calcium binding proteins like calbindin and parvalbumin) this process defines a ‘shell’ of ‘unbuffered’ (i.e. substantially elevated) calcium concentrations around open calcium channels with a diameter (Neher, 1998),
| (8) |
By assuming that cytosolic calcium buffers are essentially represented by low affinity calcium buffers with Kd values around 10 μM > > [Ca2+]i (Zhou & Neher, 1993b; Klingauf & Neher, 1997), we obtain:
| (9) |
This relationship provides an estimate of the endogenous buffer concentration once the cellular buffering capacity κS is known. For practical purposes, this concept permitted us to evaluate the size of localised (‘unbuffered’) calcium domains as a function of endogenous calcium buffering capacity (see for example Fig. 8B).
Figure 8. Important parameters of the quantitative model of calcium homeostasis in motoneurones as a function of endogenous buffering capacity.

A, theoretical calculations of calcium amplitudes (A) and decay time constants (τ) of calcium transients in oculomotor and spinal motoneurones as a function of endogenous buffering capacity (extrusion rate 145 s−1; calcium influx 54.8 pC pl−1). Note the hyperbolic decrease of amplitudes for increased buffering capacities. B, calculation of the diameter (L) of localised ‘unbuffered’ calcium domains around open calcium channels as a function of κS reveals L= 59.4 nm for spinal motoneurones (κS= 50; Palecek et al. 1999) and L= 25.8 nm for oculomotor motoneurones (κS= 264), respectively. Note the κS−½ dependence of L, which is also based on the assumption that for endogenous buffers Kd is around 10 μM > > [Ca2+]i; see Methods and eqn (8).
RESULTS
In this report, we describe a quantitative analysis of endogenous calcium homeostasis in oculomotor neurones, having performed simultaneous patch-clamp recordings in sliced tissue and microfluorometric calcium measurements. For this, neurones in the oculomotor nucleus (Fig. 1A) from 2- to 6-day-old mice were investigated using infrared differential interference contrast optics (Stuart et al. 1993), where cells could be visually identified by their large somata and their characteristic dendritic arborisation (Fig. 1B). After whole-cell configurations had been established, motoneurones were filled with the calcium indicator dye fura-2 (Fig. 1C) until a stable steady-state situation was reached (usually after 5–6 min). Oculomotor neurones displayed input resistances of 131 ± 13 MΩ (s.e.m.; n = 22 cells) and resting membrane potentials were around −65 mV. To analyse calcium signalling, cells were normally stimulated by somatic depolarisations to +10 mV lasting 500 ms. To provide well-controlled experimental conditions, voltage-clamp protocols started from holding potentials of −70 mV to primarily activate high voltage-activated (HVA) calcium channel types (Snutch & Reiner, 1992).
Figure 2A illustrates stimulus-induced fluorescence responses at 360 nm and 390 nm for different time intervals after establishing the whole-cell recording configuration. F360 provides an estimate of fura-2 loading of cells and downward deflections in F390 (dF390) reflect depolarisation-induced elevations in cytosolic free calcium levels. Exchange of pipette and somatic solutions occurred with a time constant of 2.8 ± 0.8 min (s.e.m.; n = 5 cells) measured by calcium-independent fluorescence F360 (Fig. 2B). An important assumption of our quantitative analysis is that the absolute amount of calcium influx per depolarisation stimulation remains constant during an experiment. To check this, we determined calcium influx from the product of cytosolic calcium amplitudes and decay times (Fig. 2C). Such ‘calcium integrals’ increased only slightly during an experiment, indicating that the assumption was justified. A slight increase in calcium influx was observed for longer whole-cell recording times (Fig. 2C), presumably resulting from indicator dye filling of cells known to reduce calcium-dependent inactivation of voltage-dependent calcium channels (Palecek et al. 1999). Figure 2D further illustrates this effect as a function of the ‘exogenous’ buffering capacity of fura-2 in the cytosol.
Figure 2. Stimulation-induced fluorescence changes during gradual increases in cytosolic fura-2.

A, calcium-dependent (F390) and -independent (F360) fluorescence signals during different time intervals after establishing the whole-cell patch-clamp configuration. At different time periods of the filling process depolarising voltage-steps (+10 mV) of 500 ms duration were performed (see arrow). Note the increasingly prolonged decay times of calcium-dependent F390 signals at the different times after cell rupture. Increased deflections dF390 reflected increasing fractions of cytosolic calcium concentrations captured by fura-2 (500 μM in the pipette solution). B, calcium-independent fluorescence F360 in bead units (BU) plotted as function for different time intervals after establishing the whole-cell recording configuration. F360 signal increase represents the increase in cytoplasmic indicator dye (fura 2) concentration. The continous line represents a single exponential least-square fit (time constant 2.54 min). C, integrated calcium responses as a function of whole-cell recording time. Integrated responses slightly increased during dye loading phase after rupture. Data points were connected with a line fit. •, calcium signals shown in Fig. 2A. D, integrated calcium signals plotted versus calcium binding capacity of fura2 (κB‘). κB′ strongly depends on increasing cytoplasmic fura-2 concentration during dye loading phase (see eqn (3)).
As indicated above, calcium-dependent deflections dF390 were proportional to the relative amount of cytosolic calcium concentrations ‘captured’ by fura-2. Accordingly, dF390 increased with fura-2 concentrations where the maximum value indicated that the indicator dye had largely overruled the endogenous buffers of the cell. In quantitative terms, this process is approximated by the equation (see Methods):
| (6) |
where dFmax denotes the saturating value of dF390 for very high fura-2 concentrations, κS and κB′ denote the endogenous buffering capacity of the cell and the exogenous buffering capacity of the indicator dye, respectively. For our present purposes, this equation permitted an estimate of κS by measuring dF390 for defined depolarisations at different fura-2 loading states. As displayed in Fig. 3, dF390 was plotted as a function κB′ and data points were fitted with eqn (6). This revealed a value dFmax= 3.34 ± 0.11 BU and an endogenous buffering capacity κS= 277 ± 24 (n = 14 cells) for oculomotor neurones.
Figure 3. Determination of the endogenous Ca2+ binding capacity by investigating ΔF390 as a function of κB‘.

Depolarisation-induced deflections in calcium-dependent fluorescence ΔF390 as a function of the binding capacity of fura-2. The analysis reveals κS= 277.0 ± 23.8 in oculomotor neurones and 3.34 ± 0.11 fluorescence bead units (BU) as the maximum value ΔFmax. The half-maximum value ΔFmax/2 reflects the endogenous binding capacity κS (dashed line).
Calcium responses depended strongly on membrane depolarisation as illustrated in Fig. 4. Membrane depolarisations positive to −40 mV were necessary to evoke a robust HVA-mediated calcium response. During depolarising intervals, calcium concentrations increased in a linear manner, consistent with the idea that constant, voltage-dependent calcium influx was an essential determinant. Calcium responses reached a saturating level for membrane depolarisations positive to 0 mV with a half-maximum response at −20 mV. For a systematic analysis of calcium responses and homeostasis, stimulation episodes were separated by time intervals of 30–80 s to achieve complete recovery of calcium transients between consecutive stimulations. Under such conditions, resting calcium concentrations were found to be [Ca2+]rest= 77 ± 24 nM (n = 12 cells). Furthermore, reproducible calcium signals were obtained during standard experiments lasting up to 1 h.
Figure 4. Depolarisation-induced calcium responses in oculomotor neurones.
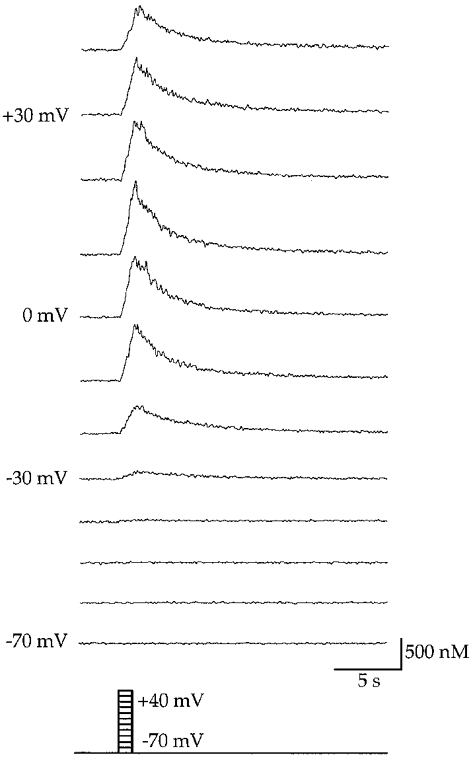
Somatic calcium responses during defined voltage steps from −70 to +40 mV (+10 mV step size) lasting 1 s. To isolate high voltage activated calcium channel (HVA) responses from low voltage (LVA) types, the resting membrane potential was held at −70 mV at the beginning of membrane depolarisation. Voltage steps positive to −40 mV led to robust somatic calcium responses. Half-maximum calcium responses were reached at −20 mV. Membrane depolarisations positive to 0 mV led to saturation of the calcium response. At voltages greater than +30 mV calcium response decreased. Recovery from elevated calcium concentrations to basal levels was adequately described by a mono-exponential function (y=A+Bexp(-Ct)); where A, B and C are constants.
To define the relevant parameters of endogenous calcium homeostasis, amplitudes and decay times of calcium transients were determined for different fura-2 loading states. Figure 5 shows decay times of depolarisation-induced calcium transients as a function of κB‘. As described in Methods, the quantitative model of somatic calcium homeostasis predicts that decay times of calcium transients are a linear function of fura-2 buffering capacity:
| (4) |
(Neher & Augustine, 1992; Helmchen et al. 1997), where γ denotes the effective extrusion rate. Figure 5 displays the analysis of τ as a function of κB‘, where endogenous calcium binding capacities were found to be 264 ± 25 (n = 11 cells). This indicated that only 1 out of 264 calcium ions in the cytosol contributed to the free calcium concentration. An estimate of the ‘effective’ extrusion rate was obtained from the linear slope of the function τ(κB‘), yielding a value γ= 156 ± 20 s−1 (n = 11 cells). As illustrated in Fig. 6, inverse amplitudes of calcium transients provided an independent estimate of the endogenous buffering capacity. This analysis identified a value κS= 258 ± 29 (n = 18), which was in reasonable agreement with previous approximations from decay times and dF390. Measurements of amplitudes as a function of κB′ also provided an estimate for the overall calcium influx into the soma given by (see Methods):
| (5) |
where F denotes the Faraday constant and A calcium amplitude. According to this analysis, 500 ms depolarisations were associated with a calcium-mediated charge influx of 54.9 ± 7.7 pC pl−1 into the somatic compartment.
Figure 5. Decay times of calcium transients as a function of calcium binding capacity of fura-2 (κB‘).
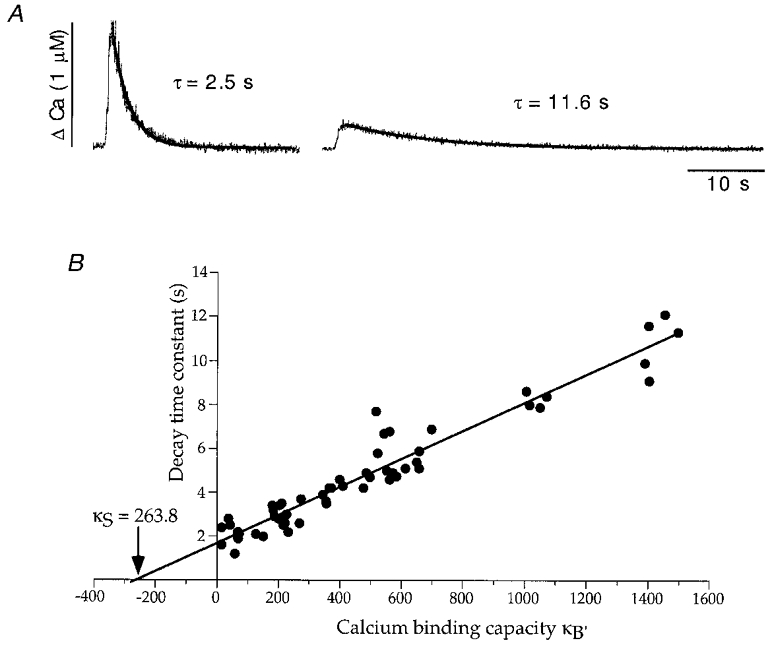
A, calcium transients evoked by 500 ms voltage steps to +10 mV. Decay phases of calcium transients were approximated by a single exponential function. Left trace illustrates a Ca2+ response soon after establishing the whole cell configuration corresponding to low exogenous Ca2+ binding capacity of fura-2 (κB‘) and rapid decay time. Right trace illustrates a Ca2+ response after complete filling of the neurone with fura-2, corresponding to high exogenous Ca2+ binding capacity (κB‘) and slow decay time. Pipette solution contained 1000 μM fura 2. B, decay time constants were plotted against Ca2+ binding capacities, κB‘, of fura-2 and mag-fura-5. Concentrations and binding capacities of indicator dyes were estimated as described in Methods. A linear regression of τversusκB′ was determined according to a least-square fit. The negative intercept of the regression line yielded a calcium binding capacity of 263.8 ± 25.1 (11 cells) for oculomotor neurones. Calcium decay time constant at κB′= 0 was extrapolated to 1.7 ± 0.1 s (11 cells).
Figure 6. Amplitude of calcium transients as determinants of the endogenous Ca2+ binding capacity (κS).

The inverse amplitude of calcium transients was plotted as a function of calcium binding capacity of fura-2 (κB‘). The straight line shows a linear regression and the negative x-axis intercept reflects κS+ 1, thus revealing an endogenous Ca2+ binding capaciy of 258.3 ± 28.7 (n = 18). The intercept with the y-axis identified a value A0 = 1.08 ± 0.11 μM, thus providing an estimate of calcium amplitudes under dye-free conditions.
During patch-clamp experiments, fura-2 loading of cells modified calcium kinetics by retarding recovery phases of calcium transients and reducing peak amplitudes. To approximate calcium dynamics in the absence of indicator dye, we used the quantitative model of somatic calcium homeostasis illustrated in Fig. 7. A linear extrapolation of Fig. 5 to κB′ = 0 identified a recovery time constant of 1.7 ± 0.2 s (21°C) in the absence of fura-2. Fluorescence measurements also indicated that a depolarisation to +10 mV for 500 ms (500 μM fura-2 corresponding to κB′= 493) resulted in a somatic calcium elevation of 0.37 ± 0.04 μM (Fig. 6). By performing a linear extrapolation of calcium amplitudes to κB= 0 (see Fig. 6), we estimated an average elevation of 1.08 ± 0.11 μM for depolarisation-induced calcium transients under dye-free conditions.
Figure 7. Quantitative model of calcium homeostasis in oculomotor neurones.
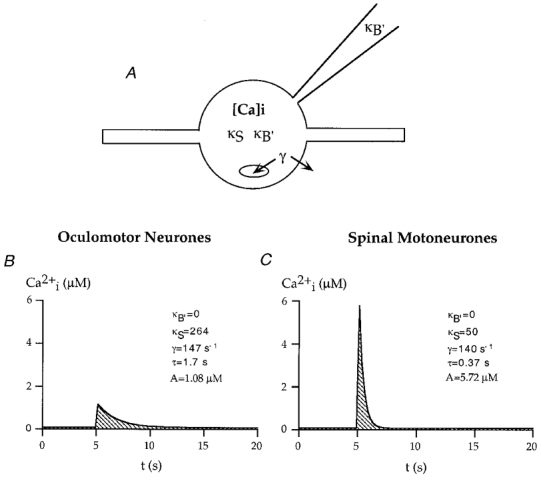
A, scheme of the one compartment model and the main parameters that determine somatic calcium responses. κB′ and κS denote the exogenous and endogenous buffering capacities of the cell, respectively. The ‘effective’ extrusion rate γ provides a quantitative description of combined calcium extrusion across the plasma membrane and calcium uptake in intracellular stores. B, simulation of a somatic calcium response for a calcium influx corresponding to 54.9 pC pl−1 (500 ms lasting depolarisation to +10 mV) in the absence of indicator dye κB′= 0) for oculomotor neurones. C, corresponding simulation for spinal motoneurones (calcium influx 54.9 pC pl−1), values for κS, γ and τ were taken from measurements previously described by Palacek et al. 1998.
One of the most interesting aspects of cellular calcium homeostasis is related to the parameters that specifically protect oculomotor neurones against calcium-related degeneration and motoneurone disease (Ince et al. 1993; Elliot & Snider, 1995; Reiner et al. 1995; Shaw & Ince, 1997; Morrison & Morrison, 1998). As illustrated in Fig. 7, we utilised the quantitative model of calcium homeostasis to evaluate specific scenarios of calcium signalling. Figure 7B displays the calculated amplitude and time course of a somatic calcium transient in an oculomotor neurone evoked by a 500 ms depolarisation to +10 mV (influx of 54.9 pC pl−1). For comparison, Fig. 7C shows a transient evoked by the same influx into a spinal motoneurone, which was calculated from a corresponding model previously described (Palecek et al. 1999). Transients in spinal neurones were characterised by 5.3-fold larger amplitudes, but rapidly recovering calcium transients, resulting from comparable extrusion rates and lower buffering capacities. In more general terms, parameters of calcium responses are plotted in Fig. 8A as a function of endogenous buffering capacity. In this case, extrusion rates were assumed to be 145 s−1, which was similar to values found in the somata of oculomotor and spinal motoneurones. It is interesting to note that for a given calcium influx, amplitudes of calcium transients display a hyperbolic increase for reduced endogenous buffering, and that low capacities (500 ms depolarisation; influx of 54.9 pC pl−1) are associated with an average somatic calcium elevation of several micromolar.
Another interesting aspect of differential calcium homeostasis in motoneurones is related to the volume of localised calcium elevations around open calcium channels. To provide a quantitative estimate, we determined the diameter of a ‘shell’ of ‘unbuffered’ calcium concentrations in the vicinity of an open calcium channel (Neher, 1998; see also Methods). Figure 8B displays this parameter as a function of endogenous buffering capacity by assuming that endogenous buffers are represented by large proteins with a kon rate of 5 × 108μm s−1 and a low affinity for calcium according to Kd= 10 μM >> [Ca2+]i (see also Methods, and eqn (8)). High endogenous buffering with κS= 264 is associated with small calcium domains with an estimated diameter L = 26 nm, while κS= 50 found for spinal neurones accounts for L= 60 nm (see also Table 1). This provides one example for the more general principle that higher buffers facilitate the ‘equilibration’ of local gradients (Roberts, 1994; Neher, 1995; Klingauf & Neher, 1997). One underlying assumption is that calcium influx rates are small, so that ‘buffer depletion’ is negligible. For higher rates where calcium influx ‘depletes’ local concentrations, the relative fraction of calcium ions contributing to [Ca2+]i is significantly increased (Roberts, 1994; Klingauf & Neher, 1997; Neher, 1998). Again, this effect is particularly prominent under low buffering conditions, further magnifying the relatively large size of local calcium domains in spinal and hypoglossal motoneurones compared with oculomotor cells.
Table 1.
A quantitative comparison of calcium homeostasis in selectively vulnerable and resistant motoneurones
| Cell type | OMN selectively resistant | SMN* selectively vulnerable | HMN* selectively vulnerable |
|---|---|---|---|
| κs | 264 | 50 | 41 |
| γ | 156s−1 | 140s−1 | 60s−1 |
| L | 26 nm | 60 nm | 66 nm |
| τ | 1.7 s | 0.4 s | 0.7 s |
| A | 1.08 μM | 5.72 μM | 6.96 μM |
Comparison of important parameters of somatic calcium homeostasis for selectively vulnerable and resistant motoneurone populations. Parameters denote endogenous buffering capacity (κS), extrusion rate (γ), diameter of localised calcium domains (L), recovery time constants (τ) and amplitudes (A) of calcium transients in the absence of indicator dye (κB' = 0; calcium influx was assumed to be 54.9 pC pl−1 for all cell types; at 21 °C). See text for more detailed explanations.
Data for spinal motoneurones (SMN)were taken from Palacek et al. 1998; data for hypoglossal motoneurones (HMN)were taken from Lips & Keller, 1998. OMN, oculomotor neurones.
DISCUSSION
Previous studies have provided convincing evidence that the degeneration of motoneurones both in human amyotrophic lateral sclerosis and corresponding animal models is closely linked to disruptions of calcium homeostasis in selectively vulnerable cells (DePaul et al. 1988; Alexianu et al. 1994; Appel et al. 1995; Reiner et al. 1995; Rothstein & Kuncl, 1995; Krieger et al. 1996; Shaw & Ince, 1997). Several parameters have been associated with differential motoneurone vulnerability, including highly calcium-permeable glutamate-receptor channels (Shaw & Ince, 1997; Roy et al. 1998; Bar-Peled et al. 1999; Shaw et al. 1999; Carriedo et al. 2000; Vandenberghe et al. 2000), excess calcium influx through voltage-activated calcium channels (Smith et al. 1992; Appel et al. 1995; Ho et al. 1996) and low endogenous calcium buffering (Alexianu et al. 1994; Reiner et al. 1995; Lips & Keller, 1998; Palecek et al. 1999). The starting point of our investigation was that defined neuronal populations like oculomotor neurones are particularly resistant to ALS-related degeneration (Ince et al. 1993; Elliot & Snider, 1995; Reiner et al. 1995). By using a combination of patch-clamp recordings and microfluorometric calcium measurements, our aim was to identify cellular adaptations that could account for selective vulnerability.
The ‘added buffer’ approach (Neher & Augustine, 1992) permitted us to address this question in a quantitative way. We found endogenous calcium binding ratios of κS= 264 in oculomotor neurones, which was 5–6 times larger compared with binding ratios κS= 41 and κS= 50 in vulnerable hypoglossal and spinal motoneurones, respectively (see also Table 1; Lips & Keller, 1998; Palecek et al. 1999). This value was 3.5 times lower compared with those found in Purkinje cells (κS= 900; 6-day-old mice; Fierro & Llano, 1996), but comparable to κS= 160–207 in hippocampal CA1 neurones (Helmchen et al. 1996). Extrusion rates in oculomotor neurones were found to be γ= 156 s−1, which was similar to γ= 140 s−1 found in spinal motoneurones. These rates were small, relative to those found in the calyx of Held (400 s−1, 21°C; Helmchen et al. 1997), but several times faster compared with hypoglossal motoneurones (60 s−1; Lips & Keller, 1998) and adrenal chromaffin cells (13 s−1, Neher & Augustine, 1992). Calcium influx during membrane depolarisation was also heterogenous in different motoneurone populations. For a 500 ms depolarisation to +10 mV, we found an influx of 55 ± 8 and 21 ± 5 pC pl−1 in oculomotor and spinal motoneurones, respectively. Our results therefore indicate that differences in buffering capacity, but not in ‘effective’ extrusion rates or voltage-dependent calcium influx, provide a plausible cellular explanation for selective vulnerability (Lips & Keller, 1998; Palacek et al. 1999).
High calcium buffering capacities in ALS-resistant motoneurones are consistent with earlier expression studies of calcium binding proteins (Baimbridge et al. 1992; Ince et al. 1993; Alexianu et al. 1994; Elliot & Snider, 1995; Reiner et al. 1995). In a comparative investigation, DePaul et al. (1988) demonstrated high expression of calcium binding proteins in oculomotor neurones in an immunocytochemical study of selective motoneurone vulnerability. In this case, high buffering in oculomotor neurones has been associated with elevated expression of parvalbumin, a calcium binding protein that is expressed in low concentrations in hypoglossal and spinal motoneurones. Moreover, several in vitro cell culture studies have demonstrated that elevated calcium buffering reduces ALS-related motoneurone damage, providing support for the idea that increased buffer concentrations display beneficial protection (Tymianski et al. 1994; Ho et al. 1996; Roy et al. 1998).
As our investigations were carried out at room temperature, an important question is related to the changes in calcium signalling under physiological temperatures. Previous studies have indeed demonstrated that extrusion rates are strongly temperature dependent, with a Q10 around 2 (Helmchen et al. 1997; Lips & Keller, 1999). This suggested a 3.2-fold acceleration of our experimentally determined transport rates under physiological conditions. As previously shown (Helmchen et al. 1997), cytosolic calcium buffering capacities display only little temperature dependence, indicating that values determined under our experimental conditions were similar to those found in more physiological states. Since our prime objective was a comparison between selectively vulnerable and resistant motoneurones, the most important precondition for the validity of our analysis was that experimental parameters were identical.
Heterogenous effects of calcium buffers in different models of neurodegeneration
In a different line of research, earlier studies have provided evidence that reduced calcium buffering capacities protect neurones against calcium-mediated damage (‘neuroprotection type I’) (Chad, 1989; Abdel-Hamid & Bambridge, 1997; Nägerl & Mody, 1998). In the well-studied example of hippocampal neurones, lowered buffering protected cells against ischaemia-induced degeneration, presumably by enhancing local accumulation of [Ca2+]i. For hippocampal calcium channels characterised by rapid, calcium-dependent inactivation, local accumulation provides a negative feedback mechanism that prevents excess calcium influx during persistent depolarisations. This concept has received support from studies on transgenic animals (Klapstein et al. 1998), where ‘knock-out’ of the calcium-binding protein calbindin protected hippocampal cells during ischaemic episodes. In general, this particular result is explained by several models. One states that calcium calbindin itself mediates toxic effects of large calcium loads, a possibility that cannot be completely excluded based on the data presently available. Electrophysiological studies of voltage-dependent calcium influx, however, supported the notion that reduced calcium buffering enhances calcium channel inactivation and diminishes net calcium loads, thus providing neuroprotective effects in hippocampal neurones (Klapstein et al. 1998).
This concept was inappropriate for interpretation of the results presented in this report, where motoneurone populations with high buffering capacities were best protected (‘neuroprotection type II’; Ince et al. 1993; Elliot & Snider, 1995; Reiner et al. 1995; McMahon et al. 1998). A plausible explanation is that differences in ‘type I’ and ‘type II’ neuroprotection depend on the net effect of variation in buffering capacity. In highly buffered cells like hippocampal neurones, increased buffering magnifies the risk for disruptions in localised calcium regulation (Fig. 8B). In hypoglossal and spinal motoneurones characterised by low endogenous buffering, elevated buffer concentrations apparently prevent excess accumulation of calcium levels around open calcium channels, thus keeping [Ca2+]i in a subcritical range (Fig. 8A). During ‘excitotoxic’ conditions, this reduces the risk for activation of ‘apoptotic’ second messenger cascades including calcium-dependent lipases and phosphatases, which are known to depend on calcium elevations above the micromolar domain (Choi, 1988; Baimbridge et al. 1992; Alexianu et al. 1994; Krieger et al. 1994). Prevention of local calcium accumulation could also reduce the risk of mitochondrial calcium overload and production of reactive oxygen species (ROS), which have been shown to occur in vulnerable motoneurone populations during excess calcium influx through glutamate receptor channels (Carriedo et al. 1996, 2000).
Given the broad diversity of molecular mechanisms associated with motoneurone degeneration (Choi, 1988; Smith et al. 1992; Reiner et al. 1995; Rothstein et al. 1995; Abdel-Hamid et al. 1997; Bruijn et al. 1998; Morrison & Morrison, 1998; Cleveland, 1999), it is clear that amyotrophic lateral sclerosis represents a multifactorial disease. It is interesting to note, however, that most mechanisms that have been linked to ALS share a calcium-dependent signal component. For example, several studies have shown that calcium-permeable glutamate (AMPA) receptors are highly expressed in motoneurone populations that are particularly impaired (Shaw & Ince, 1997; Roy et al. 1998; Bar-Peled et al. 1999; Shaw et al. 1999). Although such receptors have also been demonstrated in other neurone types (Shaw & Ince, 1997; Carriedo et al. 2000; Vandenberghe et al. 2000), low buffering in vulnerable motoneurones accounts for a 5- to 6-fold larger AMPA-receptor-mediated calcium response compared with those in oculomotor, cortical or hippocampal cells (Fig. 8). Another risk factor for ALS is an impairment of synaptic glutamate transport (Rothstein et al. 1992, 1995; Trotti et al. 1999), where resulting overactivation of excitatory synapses is thought to be the key trigger for calcium-dependent degeneration of vulnerable cells. Although such a large spectrum of calcium-dependent mechanisms has been associated with ALS (Alexianu et al. 1994; Shaw & Ince, 1997; Morrison & Morrison, 1998; Cleveland, 1999), the resulting, selective pathology of motoneurones is surprisingly similar. Based on the quantitative investigation of calcium homeostasis presented in this report, this similarity is well explained by the unifying model that low endogenous calcium buffers represent a dominating risk factor.
Implications of differential calcium homeostasis for physiological and pathophysiological conditions
Given the increased risk of neuronal damage imposed by low endogenous buffering, it is important to note that low buffering also provides a valuable functional advantage in rhythmically active cells. As pointed out in Fig. 8A, low buffering directly accounts for rapid recovery times of calcium transients if all other parameters are held constant (Neher & Augustine, 1992). In rhythmically active hypoglossal or spinal motoneurones, where action-potential related calcium oscillations occur at maximum frequencies up to 10 Hz (Ladewig & Keller, 1998; Lips & Keller, 1999; Palecek et al. 1999), rapid recovery of calcium transients is an essential requirement for physiological cell function. Indeed, the recently demonstrated neuroprotective effect of ATP-generating creatine in a mouse model of human ALS might partially be explained by an acceleration of recovery rates of activity-related calcium transients (Klivenyi et al. 1999). Although fast recovery times can also be achieved for high buffering by more effective extrusion, this strategy is associated with higher energy consumption in a permanently oscillating system (Lips & Keller, 1999; Palecek, 1999). Taken together, our results therefore indicate that cellular adaptations that account for rapid calcium signalling at relatively low energy cost also enhance a selective vulnerability of spinal and hypoglossal motoneurones during pathophysiological states and ALS-related motoneurone degeneration.
With respect to clinical motoneurone neuroprotection, our observations provide several arguments. First, elevation of cytosolic buffers could achieve neuroprotection by approximating calcium buffering conditions of ALS-resistant cells. This could reduce amplitudes of ‘excitotoxic’ calcium transients and thus prevent initiation of neurodegenerative cascades (Fig. 8A). However, buffer elevation is also associated with a retardation of calcium oscillations during rhythmic activity, which could lead to increased accumulation of ‘excitotoxic’ calcium levels in rapidly bursting hypoglossal or spinal cells (Ladewig & Keller, 1998; Palecek et al. 1999; Lips & Keller, 1999). As mentioned above, this difficulty could be partially overcome by increasing cellular ATP levels and thus accelerating calcium recovery, but more detailed studies are necessary to further validate this hypothesis. Another argument results from the alteration of spatial calcium profiles after buffer elevation. As indicated in Fig. 8B, increased buffering reduces the size of localised calcium domains (Roberts, 1994; Klingauf & Neher, 1997; Neher, 1998), which presumably supports neuroprotective conditions in oculomotor neurones and cell-culture models of motoneurone disease (Alexianu et al. 1994; 1998; Shaw & Ince, 1997; Roy et al. 1998). Under more complex in vivo conditions characteristic of ALS patients, however, reduction of calcium domains could also disrupt important local regulatory mechanisms and thus even enhance degeneration. In summary, it is necessary to perform a detailed analysis of spatio-temporal profiles of physiologically relevant calcium signals in selectively vulnerable and resistant motoneurones before a final conclusion about the clinical value of elevated buffer concentrations can be drawn.
Acknowledgments
We thank D. Crzan for excellent technical assistance and Drs A. J. Berger, D. Frermann, M. Lips, E. Neher and D. W. Richter for valuable discussions. This research was supported by the Graduiertenkolleg ‘Dynamics and Organisation of Neuronal Networks’ and DFG grants Ke403/6-1, Ke403/12-2. and Sonderforschungsbereich 406 to B.K.
References
- Abdel-Hamid KM, Baimbridge KG. The effects of artificial calcium buffers on calcium responses and glutamate-mediated excitotoxicity in cultured hippocampal neurons. Neuroscience. 1997;81:673–687. doi: 10.1016/s0306-4522(97)00162-0. [DOI] [PubMed] [Google Scholar]
- Alexianu ME, Ho BK, Mohamed AH, La BV, Smith RG, Appel SH. The role of calcium-binding proteins in selective motoneuron vulnerability in amyotrophic lateral sclerosis. Annual Neurology. 1994;36:846–858. doi: 10.1002/ana.410360608. [DOI] [PubMed] [Google Scholar]
- Alexianu ME, Robbins E, Carswell S, Appel SH. 1α,25 dihydroxyvitamin D3-dependent upregulation of calcium-binding proteins in motoneuron cells. Journal of Neuroscience Research. 1998;51:58–66. doi: 10.1002/(SICI)1097-4547(19980101)51:1<58::AID-JNR6>3.0.CO;2-K. [DOI] [PubMed] [Google Scholar]
- Appel SH, Smith RG, Alexianu M, Siklos L, Engelhardt J, Colom LV, Stefani E. Increased intracellular calcium triggered by immune mechanisms in amyotrophic lateral sclerosis. Clinical Neuroscience. 1995;3:368–374. [PubMed] [Google Scholar]
- Baimbridge KG, Celio MR, Rogers JH. Calcium-binding proteins in the nervous system. Trends in Neurosciences. 1992;15:303–308. doi: 10.1016/0166-2236(92)90081-i. [DOI] [PubMed] [Google Scholar]
- Bar-Peled O, O'Brien RJ, Morrison JH, Rothstein JD. Cultured motor neurons possess calcium-permeable AMPA/kainate receptors. NeuroReport. 1999;10:855–859. doi: 10.1097/00001756-199903170-00034. [DOI] [PubMed] [Google Scholar]
- Blaustein MP. Calcium transport and buffering in neurons. Trends in Neurosciences. 1988;11:438–443. doi: 10.1016/0166-2236(88)90195-6. [DOI] [PubMed] [Google Scholar]
- Bruijn LI, Housewaert MK, Kato S, Anderson KL, Anderson SD, Ohama E, Reaume AG, Scott RW, Cleveland DW. Aggregation and motor neuron toxicity of an ALS-linked SOD1 mutant independent from wild-type SOD1. Science. 1998;281:1851–1854. doi: 10.1126/science.281.5384.1851. [DOI] [PubMed] [Google Scholar]
- Carriedo SG, Sensi SL, Yin HZ, Weiss JH. AMPA exposures induce mitochondrial Ca2+ overload and ROS generation in spinal motor neurones in vitro. Journal of Neuroscience. 2000;20:240–250. doi: 10.1523/JNEUROSCI.20-01-00240.2000. [DOI] [PMC free article] [PubMed] [Google Scholar]
- Carriedo SG, Yin HZ, Weiss JH. Motor neurones are selectively vulnerable to AMPA/kainate receptor-mediated injury in vitro. Journal of Neuroscience. 1996;16:4069–4079. doi: 10.1523/JNEUROSCI.16-13-04069.1996. [DOI] [PMC free article] [PubMed] [Google Scholar]
- Chad J. Inactivation of calcium channels. Comparative Biochemistry and Physiology. 1989;A 93:95–105. doi: 10.1016/0300-9629(89)90196-5. [DOI] [PubMed] [Google Scholar]
- Choi DW. Ionic dependence of glutamate neurotoxicity. Journal of Neuroscience. 1987;7:369–379. doi: 10.1523/JNEUROSCI.07-02-00369.1987. [DOI] [PMC free article] [PubMed] [Google Scholar]
- Choi DW. Glutamate neurotoxicity and diseases of the nervous system. Neuron. 1988;1:623–634. doi: 10.1016/0896-6273(88)90162-6. [DOI] [PubMed] [Google Scholar]
- Cleveland DW. From charcot to SOD1: Mechanisms of selective motor neuron death in ALS. Neuron. 1999;24:515–520. doi: 10.1016/s0896-6273(00)81108-3. [DOI] [PubMed] [Google Scholar]
- DePaul R, Abbs JH, Caligiuri M, Gracco VL, Brooks BR. Hypoglossal, trigeminal, and facial motoneuron involvement in amyotrophic lateral sclerosis. Neurology. 1988;38:281–283. doi: 10.1212/wnl.38.2.281. [DOI] [PubMed] [Google Scholar]
- Edwards FA, Konnerth A, Sakmann B, Takahashi T. A thin slice preparation for patch clamp recordings from neurones of the mammalian central nervous system. Pflügers Archiv. 1989;414:600–612. doi: 10.1007/BF00580998. [DOI] [PubMed] [Google Scholar]
- Elliot JL, Snider WD. Parvalbumin is a marker of ALS-resistant motor neurons. NeuroReport. 1995;6:449–452. doi: 10.1097/00001756-199502000-00011. [DOI] [PubMed] [Google Scholar]
- Fierro L, Llano I. High endogenous calcium buffering in Purkinje cells from rat cerebellar slices. The Journal of Physiology. 1996;496:617–625. doi: 10.1113/jphysiol.1996.sp021713. [DOI] [PMC free article] [PubMed] [Google Scholar]
- Grynkiewicz G, Poenie M, Tsien RY. A new generation of Ca2+ indicators with greatly improved fluorescence properties. Journal of Biological Chemistry. 1985;260:3440–3450. [PubMed] [Google Scholar]
- Gurney ME, Cuttings FB, Zhai P, Doble A, Taylor CP, Andrus PK, Hal ED. Benefit of vitamin E, riluzole, and gabapentin in a transgenic model of familial amyotrophic lateral sclerosis. Annual Neurology. 1996;39:147–157. doi: 10.1002/ana.410390203. [DOI] [PubMed] [Google Scholar]
- Helmchen F, Borst JG, Sakmann B. Calcium dynamics associated with a single action potential in a CNS presynaptic terminal. Biophysical Journal. 1997;72:1458–1471. doi: 10.1016/S0006-3495(97)78792-7. [DOI] [PMC free article] [PubMed] [Google Scholar]
- Helmchen F, Imoto K, Sakmann B. Ca2+ buffering and action potential-evoked Ca2+ signaling in dendrites of pyramidal neurons. Biophysical Journal. 1996;70:1069–1081. doi: 10.1016/S0006-3495(96)79653-4. [DOI] [PMC free article] [PubMed] [Google Scholar]
- Ho BK, Alexianu ME, Colom LV, Mohamed AH, Serrano F, Appel SH. Expression of calbindin-D28K in motoneuron hybrid cells after retroviral infection with calbindin-D28K. cDNA prevents amyotrophic lateral sclerosis IgG-mediated cytotoxicity. Proceedings of the National Academy of Sciences of the USA. 1996;93:6796–6801. doi: 10.1073/pnas.93.13.6796. [DOI] [PMC free article] [PubMed] [Google Scholar]
- Ince P, Stout N, Shaw P, Slade J, Hunziker W, Heizmann CW, Baimbridge KG. Parvalbumin and calbindin D-28k in the human motor system and in motoneuron disease. Neuropathology and Applied Neurobiology. 1993;19:291–299. doi: 10.1111/j.1365-2990.1993.tb00443.x. [DOI] [PubMed] [Google Scholar]
- Keller BU, Konnerth A, Yaari Y. Patch clamp analysis of excitatory synaptic currents in granule cells of rat hippocampus. The Journal of Physiology. 1991;435:275–293. doi: 10.1113/jphysiol.1991.sp018510. [DOI] [PMC free article] [PubMed] [Google Scholar]
- Klapstein GJ, Vietla S, Lieberman DN, Gray PA, Airaksinen MS, Thoenen H, Meyer M, Mody I. Calbindin-D28 fails to protect hippocampal neurons against ischemia in spite of its cytoplasmic calcium buffering properties: evidence from calbindin-D28k knockout mice. Neuroscience. 1998;85:361–373. doi: 10.1016/s0306-4522(97)00632-5. [DOI] [PubMed] [Google Scholar]
- Klingauf J, Neher E. Modelling buffered Ca2+ diffusion near the membrane: implications for secretion in neuroendocrine cells. Biophysical Journal. 1997;72:674–690. doi: 10.1016/s0006-3495(97)78704-6. [DOI] [PMC free article] [PubMed] [Google Scholar]
- Klivenyi P, Ferrante RJ, Matthews RT, Bogdanov MB, Klein AM, Andreassen OA, Mueller G, Wermer M, Kaddurah-Daouk R, Beal MF. Neuroprotective effects of creatine in a transgenic animal model of amyotrophic lateral sclerosis. Nature Medicine. 1999;5:347–350. doi: 10.1038/6568. [DOI] [PubMed] [Google Scholar]
- Krieger C, Jones K, Kim SU, Eisen AA. The role of intracellular free calcium in motor neuron disease. Journal of the Neurological Sciences. 1994;124:27–32. doi: 10.1016/0022-510x(94)90173-2. [DOI] [PubMed] [Google Scholar]
- Krieger C, Lanius RA, Pelech SL, Shaw CA. Amyotrophic lateral sclerosis: the involvement of intracellular Ca2+ and protein kinase C. Trends in Pharmacological Sciences. 1996;17:114–120. doi: 10.1016/0165-6147(96)10004-3. [DOI] [PubMed] [Google Scholar]
- Ladewig T, Keller BU. Calcium imaging in rhythmically active motoneurones in the nucleus hypoglossus from mouse. Pflügers Archiv. 1998;435:R62. [Google Scholar]
- Lips MB, Keller BU. Endogenous calcium buffering in motoneurones of the nucleus hypoglossus from mouse. The Journal of Physiology. 1998;511:105–117. doi: 10.1111/j.1469-7793.1998.105bi.x. [DOI] [PMC free article] [PubMed] [Google Scholar]
- Lips MB, Keller BU. Activity-related calcium dynamics in motoneurones of the nucleus hypoglossus from mouse. Journal of Neurophysiology. 1999;82:2936–2946. doi: 10.1152/jn.1999.82.6.2936. [DOI] [PubMed] [Google Scholar]
- McBurney RN, Neering IR. Neuronal calcium homeostasis. Trends in Neurosciences. 1987;10:164–169. [Google Scholar]
- McMahon A, Wong BS, Iacopino AM, Ng MC, Chi S, German DC. Calbindin-D28k buffers intracellular calcium and promotes resistance to degeneration in PC12 cells. Molecular Brain Research. 1998;54:56–63. doi: 10.1016/s0169-328x(97)00305-7. [DOI] [PubMed] [Google Scholar]
- Medina L, Figueredo CG, Rothstein JD, Reiner A. Differential abundance of glutamate transporter subtypes in amyotrophic lateral scleroses (ALS)-vulnarable versus ALS-resistant brain stem motor cell groups. Experimental Neurology. 1996;142:287–295. doi: 10.1006/exnr.1996.0198. [DOI] [PubMed] [Google Scholar]
- Meldrum B, Garthwaite J. Excitatory amino acid neurotoxicity and neurodegenerative disease. Trends in Pharmacological Sciences. 1990;11:379–387. doi: 10.1016/0165-6147(90)90184-a. [DOI] [PubMed] [Google Scholar]
- Morrison BM, Morrison JH. Amyotrophic lateral sclerosis associated with mutations in superoxide dismutase: a putative mechanism of degeneration. Brain Research Reviews. 1998;29:121–135. doi: 10.1016/s0165-0173(98)00049-6. [DOI] [PubMed] [Google Scholar]
- Nägerl UV, Mody I. Calcium-dependent inactivation of high-threshold calcium currents in human dentate gyrus granule cells. The Journal of Physiology. 1998;509:39–45. doi: 10.1111/j.1469-7793.1998.039bo.x. [DOI] [PMC free article] [PubMed] [Google Scholar]
- Neher E. Concentration profiles of intracellular calcium in the presence of a diffusable chelator. Experimental Brain Research. 1986;14:80–96. [Google Scholar]
- Neher E. The use of fura-2 for estimating Ca2+ buffers and Ca2+ fluxes. Neuropharmacology. 1995;34:1423–1442. doi: 10.1016/0028-3908(95)00144-u. [DOI] [PubMed] [Google Scholar]
- Neher E. Usefulness and limitations of linear approximations to the understanding of Ca2+ signals. Cell Calcium. 1998;24:345–357. doi: 10.1016/s0143-4160(98)90058-6. [DOI] [PubMed] [Google Scholar]
- Neher E, Augustine GJ. Calcium gradients and buffers in bovine chromaffin cells. The Journal of Physiology. 1992;450:273–301. doi: 10.1113/jphysiol.1992.sp019127. [DOI] [PMC free article] [PubMed] [Google Scholar]
- Palecek J, Lips MB, Keller BU. Calcium dynamics and buffering in motoneurons of the mouse spinal cord. The Journal of Physiology. 1999;520:485–502. doi: 10.1111/j.1469-7793.1999.00485.x. [DOI] [PMC free article] [PubMed] [Google Scholar]
- Reiner A, Medina L, Figueredo CG, Anfinson S. Brainstem motoneuron pools that are selectively resistant in amyotrophic lateral sclerosis are preferentially enriched in parvalbumin: evidence from monkey brainstem for a calcium-mediated mechanism in sporadic ALS. Experimental Neurology. 1995;131:239–250. doi: 10.1016/0014-4886(95)90046-2. [DOI] [PubMed] [Google Scholar]
- Roberts WM. Localization of calcium signals by a mobile calcium buffer in frog saccular hair cells. Journal of Neuroscience. 1994;14:3246–3262. doi: 10.1523/JNEUROSCI.14-05-03246.1994. [DOI] [PMC free article] [PubMed] [Google Scholar]
- Rothstein JD, Kammen MVan, Levey AI, Martin LJ, Kuncl RW. Selective loss of glial glutamate transporter GLT-1 in amyotrophic lateral sclerosis. Annual Neurology. 1995;38:73–84. doi: 10.1002/ana.410380114. [DOI] [PubMed] [Google Scholar]
- Rothstein JD, Kuncl RW. Neuroprotective strategies in a model of chronic glutamate-mediated motor neuron toxicity. Journal of Neurochemistry. 1995;65:643–651. doi: 10.1046/j.1471-4159.1995.65020643.x. [DOI] [PubMed] [Google Scholar]
- Rothstein JD, Martin LJ, Kuncl RW. Decreased glutamate transport by the brain and spinal cord in amyotrophic lateral sclerosis. New England Journal of Medicine. 1992;326:1464–1468. doi: 10.1056/NEJM199205283262204. [DOI] [PubMed] [Google Scholar]
- Roy J, Minotti S, Dong L, Figlewicz DD, Durham HD. Glutamate potentiates the toxicity of mutant Cu/Zn – superoxide dismutase in motor neurones by postsynaptic calcium-dependent mechanisms. Journal of Neuroscience. 1998;18:9673–9684. doi: 10.1523/JNEUROSCI.18-23-09673.1998. [DOI] [PMC free article] [PubMed] [Google Scholar]
- Shaw PJ, Ince PG. Glutamate, excitotoxicity and amyotrophic lateral sclerosis. Journal of Neurology. 1997;244:3–14. doi: 10.1007/BF03160574. [DOI] [PubMed] [Google Scholar]
- Shaw PJ, Williams TL, Slade JY, Eggett EY, Ince PG. Low expression of GluR2 Ampa receptor subunit protein by human motor neurons. NeuroReport. 1999;10:261–265. doi: 10.1097/00001756-199902050-00011. [DOI] [PubMed] [Google Scholar]
- Siklos L, Engelhardt GI, Alexianu ME, Siddique T, Appel SH. Intracellular calcium parallels motoneuron degeneration in SOD-1 mutant mice. Journal of Neuropathology and experimental Neurology. 1998;57:571–587. doi: 10.1097/00005072-199806000-00005. [DOI] [PubMed] [Google Scholar]
- Smith RG, Hamilton S, Hofmann F, Schneider T, Nastainczyk W, Birnbaumer L, Stefani E, Appel SH. Serum antibodies to L-type calcium channels in patients with amyotrophic lateral sclerosis. New England Journal of Medicine. 1992;327:1721–1728. doi: 10.1056/NEJM199212103272405. [DOI] [PubMed] [Google Scholar]
- Snutch TP, Reiner PB. Ca2+ channels: diversity of form and function. Current Opinion in Neurobiology. 1992;2:247–253. doi: 10.1016/0959-4388(92)90111-w. [DOI] [PubMed] [Google Scholar]
- Stuart GJ, Dodt HU, Sakmann B. Patch clamp recordings from the soma and dendrites of neurones in brain slices using infrared video microscopy. Pflügers Archiv. 1993;423:511–518. doi: 10.1007/BF00374949. [DOI] [PubMed] [Google Scholar]
- Titz S, Keller BU. Rapidly deactivating AMPA receptors determine excitatory synaptic transmission to interneurons in the nucleus tractus solitarius from rat. Journal of Neurophysiology. 1997;78:82–91. doi: 10.1152/jn.1997.78.1.82. [DOI] [PubMed] [Google Scholar]
- Trotti D, Rolfs A, Danbolt NC, Brown RH, Jr, Hediger M A. SOD1 mutants linked to amyotrophic lateral sclerosis selectively inactivate a glial glutamate transporter. Nature Neuroscience. 1999;2:427–433. doi: 10.1038/8091. [DOI] [PubMed] [Google Scholar]
- Tu PH, Raju O, Robinson KA, Gurney ME, Trojanowski JQ, Lee MY. Transgenic mice carrying a human mutant superoxide dismutase transgene develop neuronal cytoskeletal pathology resembling human amyotrophic lateral sclerosis lesions. Proceedings of the National Academy of Sciences of the USA. 1996;93:3155–3160. doi: 10.1073/pnas.93.7.3155. [DOI] [PMC free article] [PubMed] [Google Scholar]
- Tymianski M, Charlton MP, Carlen PL, Tator CH. Properties of neuroprotective cell-permeant Ca2+ chelators: effects on [Ca2+]i and glutamate neurotoxicity in vitro. Journal of Neurophysiology. 1994;72:1973–1992. doi: 10.1152/jn.1994.72.4.1973. [DOI] [PubMed] [Google Scholar]
- Vandenberghe W, Robberecht W, Brorson JR. AMPA receptor calcium permeability, GluR2 expression, and selective motoneuron vulnerability. Journal of Neuroscience. 2000;20:123–132. doi: 10.1523/JNEUROSCI.20-01-00123.2000. [DOI] [PMC free article] [PubMed] [Google Scholar]
- Williamson TL, Bruijn LI, Zhu Q, Anderson KL, Anderson SD, Julien J, Cleveland DW. Absence of neurofilaments reduces the selective vulnerability of motor neurons and slows disease caused by a familial amyotrophic lateral sclerosis-linked superoxide dismutase 1 mutant. Proceedings of the National Academy of Sciences of the USA. 1998;95:9631–9636. doi: 10.1073/pnas.95.16.9631. [DOI] [PMC free article] [PubMed] [Google Scholar]
- Zhou Z, Neher E. Calcium permeability of nicotinic acetylcholine receptor channels in bovine adrenal chromaffin cells. Pflügers Archiv. 1993a;425:511–517. doi: 10.1007/BF00374879. [DOI] [PubMed] [Google Scholar]
- Zhou Z, Neher E. Mobile and immobile calcium buffers in bovine adrenal cells. The Journal of Physiology. 1993b;469:245–273. doi: 10.1113/jphysiol.1993.sp019813. [DOI] [PMC free article] [PubMed] [Google Scholar]