

Abstract
Many agonists linked to the generation of inositol 1,4,5-trisphosphate (InsP3) and release of Ca2+ from intracellular stores induce repetitive transients in cytosolic Ca2+ whose frequency increases over a certain range of agonist concentrations.
In order to investigate the mechanisms underlying this frequency modulation, the fluorescent Ca2+ sensor mag-fura-2 was loaded into intracellular calcium stores and used to monitor InsP3-induced dynamics of the intraluminal calcium concentration ([Ca2+]L) in secretory cells of permeabilized blowfly Calliphora vicina salivary glands.
In this preparation, increasing concentrations of InsP3 induced graded decreases in [Ca2+]L that were often superimposed with repetitive [Ca2+]L transients produced by sequential Ca2+ release and re-uptake. These [Ca2+]L oscillations developed at frequencies of 3–11 min−1 unrelated to the concentration of InsP3 present.
In contrast, incremental concentrations of InsP3 applied in the presence of the oxidizable mitochondrial substrates citrate, succinate, or pyruvate-malate induced repetitive [Ca2+]L transients whose frequency increased with the concentration of InsP3.
This InsP3 concentration-dependent modulation of oscillation frequency was abolished after dissipating the mitochondrial membrane potential (Δψm) by combined treatment with carbonyl cyanide p-trifluoromethoxyphenyl hydrazone + oligomycin or after application of Ruthenium Red, an inhibitor of mitochondrial Ca2+ uptake.
Taken together, the data indicate that energized mitochondria exert negative control over the frequency of InsP3-induced Ca2+ oscillations. It is concluded that mitochondria play a crucial role in determining the duration of the interspike period and, therefore, for the encoding of amplitude-modulated, InsP3-liberating stimuli into the frequency of cytosolic Ca2+ oscillations.
The activation of receptors coupled to the phosphoinositide pathway induces changes in the free cytosolic calcium concentration ([Ca2+]C) that are generated by release of Ca2+ from intracellular stores. These dynamics are often temporally and spatially complex. In many electrically non-excitable cells, inositol 1,4,5-trisphosphate (InsP3) causes repetitive [Ca2+]C transients, which are also termed Ca2+ oscillations. Locally detected [Ca2+]C transients often represent Ca2+ waves that propagate coordinatedly through individual cells and between clusters of cells coupled by gap junctions. In most of the cells studied so far, the frequency at which consecutive Ca2+ spikes are triggered increases with the concentration of the extracellular stimulus or InsP3 introduced into a cell. This property of the InsP3/Ca2+ second messenger system is assumed to provide the basis for a frequency encoding of external signals (Rapp & Berridge, 1981; Berridge, 1993). Several functional advantages of this signalling mode over amplitude modulated signals have been put forward; among these are an improved signal-to-noise relationship and the avoidance of an adaptation of Ca2+-dependent targets (Meyer & Stryer, 1991; Thomas et al. 1996). Furthermore, this property might allow the selective activation of different cellular responses by using Ca2+ as a multifunctional messenger. In support of this view, recent experimental evidence suggests that Ca2+-dependent enzymes and transcription factors are differentially tuned to and activated by trains of Ca2+ transients of certain frequencies (De Koninck & Schulman, 1998; Dolmetsch et al. 1998; Li et al. 1998).
Several divergent models have been developed to account for Ca2+ oscillations on the basis of extensive experimental and theoretical work (reviewed in Fewtrell, 1993). They have been proposed to be the result of the InsP3-induced cycling of Ca2+ between Ca2+-sensitive and Ca2+-insensitive stores (Goldbeter et al. 1990) or, alternatively, to periodic changes in the concentration of InsP3 caused by feedback of Ca2+ on the activity of phospholipase C (Meyer & Stryer, 1991). Several more recent models have incorporated the modulatory effects of Ca2+ on the InsP3 receptor itself (Bezprozvanny et al. 1991; Finch et al. 1991). According to these latter models, the rapid upstroke of a Ca2+ spike is mediated by feed-forward activation of the InsP3 receptor by released Ca2+. The termination of Ca2+ release and subsequent fall of [Ca2+]C to basal levels are thought to be attributable to intrinsic or Ca2+-dependent inactivation of the InsP3 receptor enabling sarco-endoplasmic reticulum-type Ca2+-ATPases to restore basal Ca2+ levels by pumping Ca2+ back into the InsP3-sensitive Ca2+ stores. Alternatively, the termination of Ca2+ spikes is proposed to result from a transient emptying of the Ca2+ stores or to be mediated by periodic Ca2+-dependent changes of InsP3 receptor sensitivity toward InsP3 (Oancea & Meyer, 1996). In addition to causing the falling phase of individual Ca2+ spikes, Ca2+-dependent negative-feedback mechanisms have also been implicated in controlling spike frequency. Thus, the interspike interval has been suggested to reflect the time required by the InsP3-receptor to recover from inactivation or desensitization (De Young & Keizer, 1992; Atri et al. 1993; Oancea & Meyer, 1996).
There is accumulating evidence that mitochondria contribute to the regulation of the dynamics of cytosolic Ca2+ signals. In many cells, mitochondria are found in close apposition to the endoplasmic reticulum (ER; Rizzuto et al. 1998), and it has been shown that Ca2+ released from the ER by InsP3 can be taken up by mitochondria through a process driven by the mitochondrial-membrane potential and mediated by an electrogenic uniport (Nicholls & Crompton, 1980; Rizzuto et al. 1993, 1994, 1999). Based on these morphological and physiological findings, the opening of Ca2+ release channels has been suggested to expose mitochondria to microdomains of high [Ca2+], which in turn promotes mitochondrial Ca2+ uptake. Thus, mitochondria could act as Ca2+ sinks and potentially affect both the amplitude and the time course of InsP3-induced [Ca2+]C changes. Indeed, a series of recent studies has demonstrated that experimental activation of mitochondrial metabolism or inhibition of mitochondrial activity causes changes in InsP3-mediated spatio-temporal [Ca2+]C dynamics underlining the close functional coupling between InsP3-dependent Ca2+ release and mitochondrial uptake (Jouaville et al. 1995; Budd & Nicholls, 1996; Simpson & Russell, 1996; Babcock et al. 1997; Boitier et al. 1999; Hajnóczky et al. 1999).
In previous studies, we have shown that the secretory cells of the intact salivary gland of the blowfly respond to stimulation with the neurohormone 5-hydroxytryptamine (5-HT) or intracellular injections of InsP3 with repetitive [Ca2+]C spikes (Zimmermann & Walz, 1997, 1999). Spike frequency has been found to be positively related to the strength of the stimulus. The aim of the present study has been to investigate further the mechanisms controlling the temporal pattern of the agonist-induced [Ca2+]C dynamics, especially oscillation frequency. To this end, we used a permeabilized preparation in which the [Ca2+] in InsP3-sensitive Ca2+ stores (the endoplasmic reticulum) and the ‘cytosol’ could be monitored during the direct application of InsP3.
METHODS
Solutions and media
Ringer solution
Calliphora Ringer solution contained (mM): NaCl, 128; KCl, 10; CaCl2, 2; MgCl2, 2; sodium glutamate, 2.7; malic acid, 2.7; Tris, 10; and D-glucose, 10; pH 7.2.
Intracellular-like media (ICM)
Calcium sponge S-treated medium was prepared by passing a solution containing (mM): KCl, 125; NaCl, 20; Na2ATP, 3; Hepes, 10 at pH 7.3 through a column containing ∼1 g of calcium sponge S (Molecular Probes, Leiden, Netherlands). MgCl2 was subsequently added to the solution to yield a final concentration of 2 mM. Between passages, the column was regenerated by washing with 100 ml 125 mM KCl, 20 mM NaCl, 10 mM Hepes, pH 4.0 (Tanimura & Turner, 1996). ICM-Chelex was prepared by incubating solutions composed of 125 mM KCl, 20 mM NaCl, 3 mM ATP, 10 mM Hepes at pH 7.3 with 5 g Chelex 100 (Sigma, Deisenhofen, Germany) for ∼60 min. After removal of the exchanger resin, MgCl2 was added to give a final concentration of 2 mM. The free Ca2+ concentration of media treated with Calcium Sponge S or Chelex was 200–300 nM as determined by Ca2+-sensitive minielectrodes (sensor: ETH129, Fluka, Buchs, Switzerland).
Unless noted otherwise, ICM-EGTA contained (mM): KCl, 125; NaCl, 20; MgCl2, 2; Na2ATP, 3; EGTA, 0.1; CaCl2, 0.06; Hepes, 10 at pH 7.3. When ICM-EGTA was supplemented with the mitochondrial substrates citric acid (10 mM), succinic acid (10 mM), or pyruvic acid-malic acid (5 mM each), KCl was reduced to 100 mM. The free [Ca2+] of these media was ∼250 nM as determined either with Ca2+-selective minielectrodes or fluorometrically with fura-2 (1 μM free acid) by using solutions with defined free-Ca2+ concentrations from Molecular Probes (Leiden, Netherlands) as calibration standards.
Blowflies, Calliphora vicina, were reared at the Institute. They were kept at 24–26°C under a dark:light cycle of 12:12 h. Salivary glands were dissected under Ringer solution from the abdomina of adult flies 3–14 days after emergence.
Dye loading and cell permeabilization
Loading of fura-2 into cells of the intact salivary gland
For measurements of [Ca2+]C in intact secretory cells, the glands were loaded for 20–30 min at room temperature with 5 μM fura-2 acetoxymethyl ester (AM) dissolved in Ringer solution. They were subsequently attached to a coverslip coated with Cell Tak (Collaborative Biomedical Products, Bedford, USA). This coverslip formed the bottom of a perfusion chamber that was mounted to the stage of a Zeiss Axiovert 135TV or Axiovert 100 M inverted epifluorescence microscope. Solution changes were accomplished by means of a peristaltic pump that provided a continuous flux of 0.8 ml min−1.
Mag-fura-2 loading and cell permeabilization
Mag-fura-2 was loaded into cells of intact salivary glands by a 20 min incubation with 5 μM mag-fura-2 AM in Ringer solution. After mounting in the superfusion chamber, glands were briefly washed with ICM and permeabilized for 4–8 min with 50 μg ml−1 (w/v) β-escin in ICM, before excessive β-escin was removed with ICM. Permeabilization was monitored by following the washout of cytosolic indicator, i.e. monitoring the fall of mag-fura-2 fluorescence (excited at 340 and 380 nm and detected at 515–565 nm). As a result of the permeabilization, the fluorescence emitted from all the cells within the field of view fell to less than 20 % of its initial intensity.
Loading permeabilized cells with Calcium Green C18
In experiments utilizing Calcium Green C18, cells were first loaded with mag-fura-2 and permeabilized as described. Subsequently, they were incubated for 5 min with 10 μM Calcium Green C18, and washed with ICM until the Calcium Green C18 signal (excited at 490 nm) had fallen to a stable level.
TMRE loading
Tetramethylrhodamine ester (TMRE), a lipophilic cationic dye, enters mitochondria in a membrane potential (Δψm)- dependent manner. Accumulation of the dye causes quenching of fluorescence, whereas mitochondrial depolarization is followed by the release of dye, dequenching and an increase in fluorescence. Changes in TMRE fluorescence can therefore be used to monitor Δψm. TMRE and mag-fura-2 were coloaded into intact cells by 20 min incubation with 5 μM mag-fura-2 AM and 0.5 μM TMRE in Ringer solution. Subsequently, the cells were permeabilized as described above and further incubated in the presence of 0.1 μM TMRE. Monitoring of the mag-fura-2 fluorescence signals verified successful permeabilization prior to assessing the effects of mitochondrial inhibitors.
Digital fluorescence imaging of Ca2+ and Δψm
Digital Ca2+ imaging was essentially carried out as previously described (Zimmermann & Walz, 1997, 1999). Briefly, fura-2 and mag-fura-2 were alternately excited through a × 20 Fluar, 0.75 NA objective at wavelengths 340 and 380 nm provided by a Xenon arc lamp and/or monochromator unit (Till Photonics, Tamm, Germany). Corresponding pairs of fluorescence images taken at 1–2 s intervals were band pass filtered at 515–565 nm, captured by a CCD camera (TE/CCD-512EFT, Princeton Instruments Corp., Trenton, USA) digitized, and transferred to a personal computer for offline processing with the imaging software Metafluor 2.75 (Universal imaging Corp., West Chester, USA). Pairs of fluorescence emission signals (at 515–565 nm) were used to calculate mag-fura-2 ratios. For simultaneous recording of mag-fura-2 and Calcium Green C18 fluorescence, the excitation light was sequentially switched between 340, 380 (for mag-fura-2 excitation), and 490 nm (Calcium Green C18 excitation). Calcium Creen C18 fluorescence was used as a qualitative measure of near-membrane [Ca2+] changes in the permeabilized cytosolic compartment. Fura-2 ratios were calculated after the subtraction of background fluorescence determined at the end of each experiment by quenching fura-2 fluorescence with MnCl2 (Zimermann & Walz, 1997). TMRE fluorescence was excited at 549 nm and detected after passage through a 590 nm long-pass filter.
A single representative region of interest of 19 × 19 μm was selected and used for quantitative evaluations in each preparation. Space-time plots of the [Ca2+]L dynamics were constructed from series of mag-fura-2 ratio images by sequentially extracting the fluorescence ratio along a line of 1 × 102 pixels (3.8 μm × 385 μm) projected onto the salivary epithelium.
Each trace shown is a representative of at least three independent experiments.
Chemicals
Chemicals were purchased from the following suppliers: fura-2 AM, fura-2 free acid, mag-fura-2 AM, Calcium Green C18, tetramethylrhodamine ester (TMRE) and Calcium Sponge S from Molecular Probes (Leiden, Netherlands); D-myo-inositol 1,4,5-trisphosphate was from Alexis (Grünberg, Germany), ionomycin from Calbiochem (Bad Soden, Germany), and carbonyl cyanide p-trifluoromethoxyphenyl hydrazone (FCCP), oligomycin, and Ruthenium Red from Sigma (Deisenhofen, Germany). All other chemicals were of analytical grade.
Statistical analysis
Data are expressed as means ±s.d. Statistical comparisons were made by an independent Student's t test. P values of less than 0.05 were considered as being significant.
RESULTS
Ca2+ oscillations in intact cells
Stimulation of the intact blowfly salivary gland with subsaturating concentrations of 5-HT causes [Ca2+]C oscillations that are generated by periodic Ca2+ fluxes out of and into intracellular Ca2+ stores. Oscillation frequency rises from ∼1 min−1 at threshold [5-HT] to ∼7 min−1 as the strength of the stimulus is increased (Fig. 1; see also Zimmermann & Walz, 1997).
Figure 1. Concentration-response relationship of 5-hydroxytryptamine (5-HT)-induced [Ca2+]C responses in the intact salivary gland.
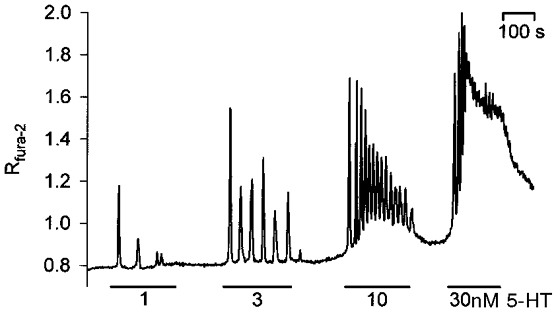
Stimulation of glands loaded with fura-2 elicits repetitive [Ca2+]C spikes whose frequency increases with the concentration of 5-HT applied. Duration of individual stimulations and concentrations of the agonist are indicated by horizontal bars and numbers, respectively.
Ca2+ oscillations in β-escin-permeabilized cells
In order to gain experimental access to the intracellular Ca2+ stores and to directly control the cytosolic factors that contribute to the spatio-temporal characteristics of Ca2+ oscillations we used β-escin-permeabilized secretory cells and the fluorescent low-affinity Ca2+-indicator mag-fura-2, which has been reported to accumulate in InsP3-sensitive Ca2+ stores (Hofer & Machen, 1993; Chatton et al. 1995). As shown in Fig. 2A, the addition of InsP3 to permeabilized, mag-fura-2-loaded secretory cells bathed in artificial intracellular medium (ICM, supplemented with 1 mM EGTA) caused concentration-dependent sustained decreases of the fluorescence ratio. These declines followed simple kinetics and were completely reversed by the addition of heparin, a competitive inhibitor of InsP3-mediated Ca2+ release, demonstrating that the indicator indeed monitored [Ca2+] changes in InsP3-sensitive Ca2+ stores (Fig. 2B). In contrast to InsP3, application of caffeine (10 or 25 mM), a substance that induces Ca2+ release through ryanodine receptors did not cause decreases in the mag-fura-2 signal. This result is in line with the findings of an earlier study in intact glands (Zimmermann & Walz, 1997) which also failed to produce evidence for ryanodine receptors in this type of cells. Likewise, addition of the mitochondrial uncoupler FCCP (1 μM) and oligomycin (2.5 μg ml−1) to permeabilized gland cells did not cause any detectable change in the mag-fura-2 ratio (n= 3), indicating that mag-fura-2, under these conditions, did not detect [Ca2+] changes within mitochondria (compareHofer & Machen, 1994).
Figure 2. Effects of Ca2+, InsP3 and heparin on [Ca2+]L.
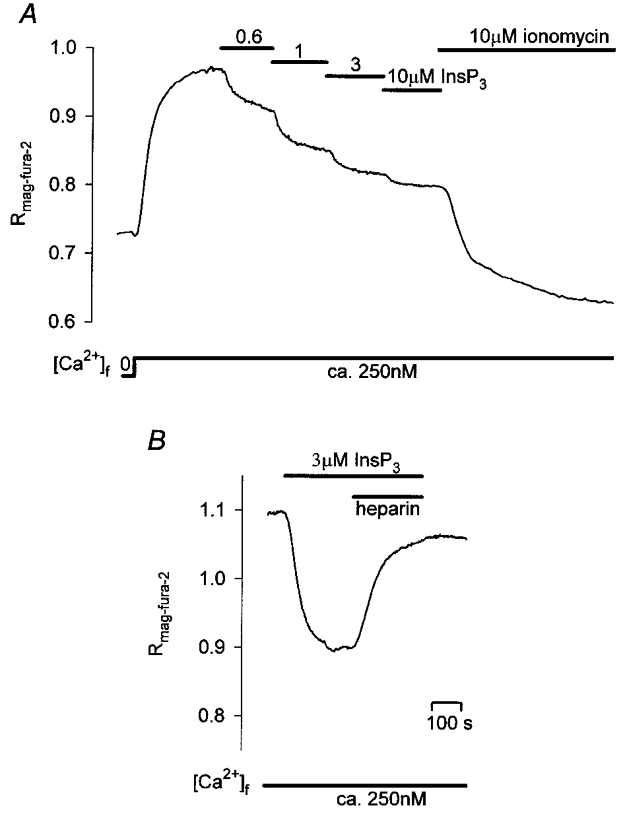
A, following permeabilization in Ca2+-free ICM, addition of Ca2+ to ICM-1 mM EGTA (1 mM EGTA, 600 μM CaCl2, [Ca2+]free, 250 nM) caused rises in the mag-fura-2 ratio indicative of Ca2+ uptake into Ca2+-storing organelles. The subsequent incremental addition of InsP3 resulted in graded declines of [Ca2+]L. B, inhibition of InsP3-induced Ca2+ release by heparin (1 mg ml−1). Additions were made as indicated. The traces shown in A and B are representative of 6 and 3 independent experiments, respectively.
When added to ICM pretreated with Chelex 100 or Calcium Sponge S, or to ICM supplemented with only 100 μM EGTA, InsP3 induced tonic declines of [Ca2+]L that were often superimposed with repetitive Ca2+ transients consisting of a rapid initial decrease (time to reach the inverted peak < 4 s) that was followed by a slower recovery (Fig. 3A). Thus, when applied in ICM in which Ca2+ was only weakly buffered, InsP3 evoked [Ca2+]L oscillations that were inverted relative to the [Ca2+]C oscillations elicited by 5-HT or InsP3 in intact cells. This suggested that [Ca2+]C changes were necessary for the [Ca2+]L oscillations to occur.
Figure 3. Effects of InsP3 on [Ca2+]L and near-membrane [Ca2+]C of permeabilized salivary gland cells bathed in ICM-Chelex.
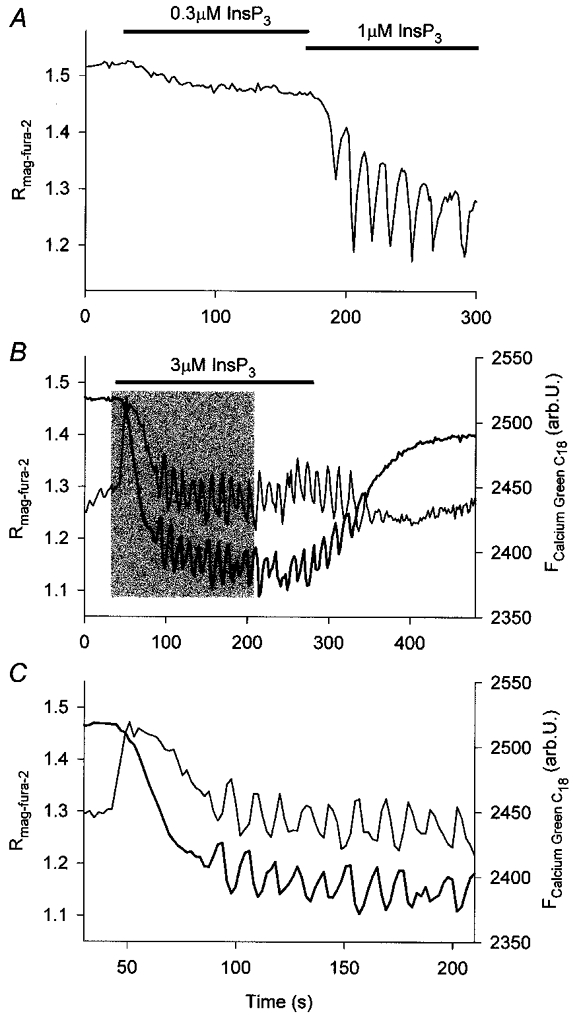
A, changes in [Ca2+]L induced by InsP3. Under these conditions, the addition of InsP3 resulted in graded declines in [Ca2+]L often accompanied by repetitive [Ca2+]L transients. B and C,[Ca2+]L (thick line) and near-membrane [Ca2+]C (thin line) monitored simultaneously with mag-fura-2 and Calcium Green C18, respectively. C shows part of the traces marked by the shaded area in B on an extended time scale. InsP3 (3 μM) was added as indicated.
To record [Ca2+]L oscillations and [Ca2+] simultaneously in the cytosolic compartment, mag-fura-2-loaded permeabilized cells were briefly incubated with Calcium Green C18, a Ca2+ indicator whose lipophilic alkyl side chain intercalates into lipid membranes. Calcium Green C18 can therefore be used to monitor [Ca2+] in the vicinity of membranes (Lloyd et al. 1995). In these experiments, mag-fura-2 and Calcium Green C18 reported temporally tightly coupled complementary [Ca2+] changes in response to the addition of InsP3 (Fig. 3B and C) consistent with an InsP3-induced periodic Ca2+ exchange between Ca2+ stores and cytosol. Most notably, the temporal evolution of [Ca2+]C monitored by Calcium Green C18 was remarkably similar to [Ca2+]C changes elicited by 5-HT or InsP3 in intact cells (cf. Fig. 2B and C in Zimmermann & Walz, 1999). Taken together, these findings demonstrated that the permeabilized system reproduced key parameters of InsP3-dependent Ca2+ signalling previously described in intact cells (see also Tanimura & Turner, 1996; Hajnóczky & Thomas, 1997).
In order to establish the relationship between InsP3 concentration and the threshold, the amplitude and the frequency of these [Ca2+]L oscillations, InsP3 was next incrementally varied from 0 to 10 μM. Such stepwise elevations of [InsP3] in either ICM-Chelex or ICM-100 μM EGTA caused gradual tonic decreases in [Ca2+]L whose amplitudes were similar to the respective decreases elicited in the presence of 1 mM EGTA (Figs 4 and 5A; Table 1). As shown in Fig. 4, sustained decreases in [Ca2+]L were frequently accompanied by rapid [Ca2+]L oscillations, with an increasing fraction of preparations displaying oscillations when [InsP3] was raised from 0.3 to 3 μM (Fig. 5B). Surprisingly, [Ca2+]L oscillation frequencies appeared to be little affected by the concentration of InsP3 present. Statistical comparison of the experimental data confirmed that there was no significant dependence of absolute or relative oscillation frequencies on [InsP3] (Fig. 5C, Table 2). Like oscillation frequency, [Ca2+]L-spike amplitudes showed little change with changes in [InsP3] in most of the preparations studied. Only in a few experiments did spike amplitudes increase when InsP3 was varied between 0.3 and 1 μM. Most notably, changes in amplitude were not accompanied by concomitant changes in oscillation frequency (Fig. 4B). In summary, application of different concentrations of InsP3 to permeabilized cells failed to duplicate the prominent concentration-dependent frequency modulation of InsP3-mediated [Ca2+]C oscillations in intact cells (cf. Fig. 1). In particular, low frequency oscillations (f < 3 min−1) generated by low agonist concentrations in intact cells were not observed.
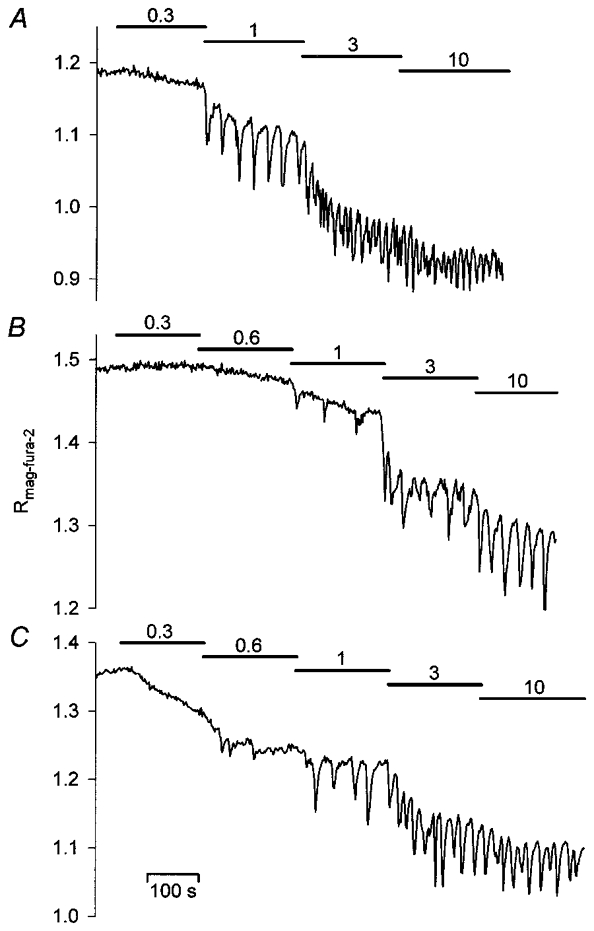
Figure 4. Dependence of changes in [Ca2+]L on the concentration of InsP3 added to weakly Ca2+-buffered media.
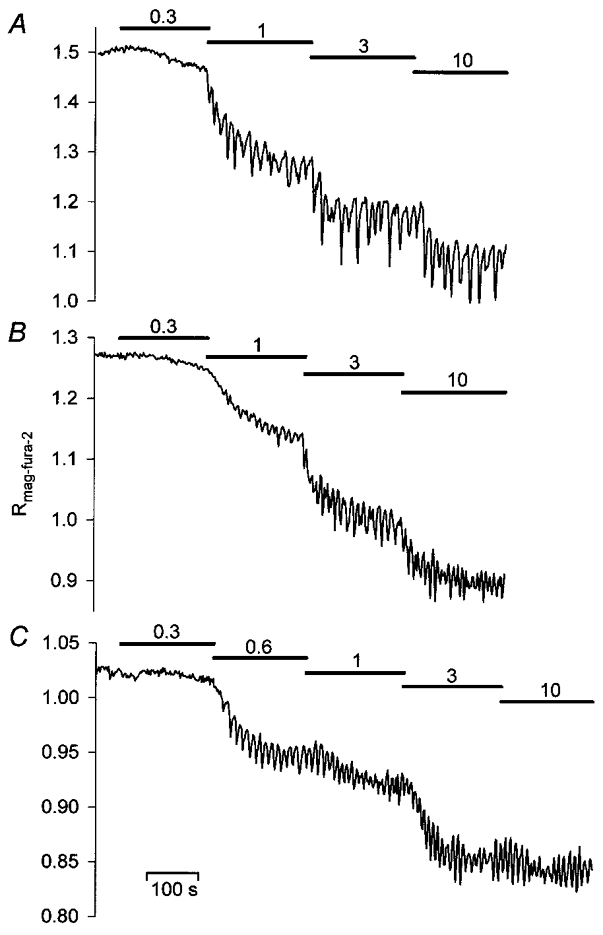
InsP3 was applied to ICM pretreated with Chelex (A) or supplemented with 100 μM EGTA (B and C). Stepwise increases in InsP3 elicited sustained decreases in [Ca2+]L and [Ca2+]L oscillations, whose frequencies are apparently independent of the [InsP3] present. InsP3 was added as indicated by the horizontal bars, numbers indicate the respective InsP3 concentration in μm.
Figure 5. Concentration dependence of amplitude, threshold and frequency of InsP3-induced changes in [Ca2+]L.
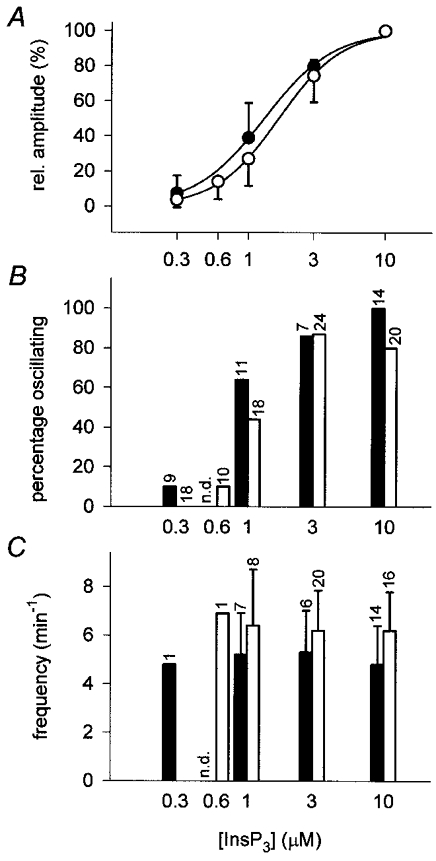
A, relative amplitudes of InsP3-induced persistent falls of the mag-fura-2 ratio in response to the application of InsP3 in ICM-Chelex (•) and ICM-100 μM EGTA (○). Amplitudes were determined from traces as shown in Fig. 4, 3 min after the addition of the respective concentration of InsP3. Amplitudes of declines at 10 μM InsP3 were set to 100 %. Lines indicate the best least squares fits of the data to the Hill function. B, fraction of preparations exhibiting [Ca2+]L oscillations at a given InsP3 in ICM-Chelex (filled bars) or ICM-100 μM EGTA (open bars). Numbers on top of the bars indicate the total number of preparations studied. Preparations that did not show oscillations at any of the concentrations tested were excluded. C, frequencies of Ca2+ oscillations at various [InsP3] in ICM-Chelex (filled bars) and ICM-100 μM EGTA (open bars). Numbers on top indicate the number of preparations exhibiting oscillations (preparations that did not show [Ca2+]L oscillations at the respective [InsP3] were not included). Data were extracted from experiments representatively depicted in Fig. 4.
Table 1.
Apparent EC50 of InsP3 on sustained declines in [Ca2+]L under various experimental conditions
| EGTA 1mM | Chelex | EGTA 100μM | EGTA-citra | EGTA-succinate | EGTA pyruvate/malate | |
|---|---|---|---|---|---|---|
| Control (μM) | 2.5 | 1.3 | 1.7 | 1.0 | 1.3 | 2.6 |
| FCCP–oligomycin (μM) | n.d. | n.d. | n.d. | 1.3 | n.d. | 2.1 |
Table 2.
[Ca2+]L oscillation frequencies determined at 1 or 10 μM InsP3 in various intracellular-like media and in the presence of mitochondrial inhibitors
| InsP3 alone | + FCCP–oligomycin | + Ruthenium Red | |||||||
|---|---|---|---|---|---|---|---|---|---|
| Intracellular medium | 1 μM InsP3 | 10 μM InsP3 | P | 1 μM InsP3 | 10 μM InsP3 | P | 1 μM InsP3 | 10 μM InsP3 | P |
| Chelex | 5.2 ± 1.7 (7) | 4.8 ± 1.6 (14) | >0.5 | — | — | — | — | — | — |
| 100 μM EGTA | 6.4 ± 2.3 (8) | 6.2 ± 1.6 (15) | >0.7 | — | — | — | — | — | — |
| EGTA-citrate | 2.9 ± 1.4 (15) | 4.7 ± 1.6 (16) | <0.002 | 4.7 ± 1.3 (5) | 4.4 ± 1.0 (7) | >0.6 | 4.5 ± 1.1 (4) | 3.7 ± 1.0 (5) | >0.3 |
| EGTA-succinate | 3.1 ± 1.6 (6) | 5.8 ± 1.8 (8) | <0.01 | — | — | — | — | — | — |
| EGTA-pyruvate/malate | 2.3 ± 0.7 (5) | 3.9 ± 1.6 (7) | <0.05 | — | — | — | — | — | — |
Oscillation frequencies are given in spikes min−1. Numbers in parentheses indicate the number of experiments performed under each condition. P values indicate the levels of significance with respect to differences in oscillation frequency at 1 and 10 μM InsP3 in a given medium using Student's nonpaired t test. Bold type highlights values considered to be significantly different.
Contribution of mitochondrial activity to InsP3-evoked Ca2+ oscillations in permeabilized cells
Earlier studies have demonstrated that the frequency of agonist- and InsP3-evoked Ca2+ oscillations is sensitive to changes in the mitochondrial membrane potential (Δψm) (Jouaville et al. 1995). Thus, we hypothesized that the apparent loss of frequency modulation after cell permeabilization might be the result of impaired mitochondrial function and therefore, attempted to test whether increasing Δψm by the addition of oxidizable mitochondrial substrates affected the InsP3-evoked [Ca2+]L dynamics. Effects of tricarboxylic acid cycle substrates on Δψm were first directly examined by monitoring the fluorescence of TMRE, a cationic fluorescent indicator that exhibits a Nernstian distribution across the inner mitochondrial membrane and is subject to self-quenching at high concentrations. To this end, glands were loaded with TMRE, permeabilized and first incubated in ICM supplemented with the mitochondrial substrate citrate (10 mM). Subsequently citrate was removed from the bathing medium. This resulted in a large increase in TMRE fluorescence which could be fully reversed by re-administrating citrate (Fig. 6A; n= 6). These changes in the fluorescence of TMRE are indicative of the release and re-uptake of dye from and into mitochondria, i.e. a reversible decrease of the mitochondrial membrane potential. Addition of the mitochondrial uncoupler FCCP (1 μM) in citrate-deficient medium was followed by a further increase in TMRE fluorescence showing that removing the mitochondrial substrate from the intracellular-like medium had diminished but not completely dissipated Δψm (Fig. 6B).
Figure 6. Effect of oxidizable mitochondrial substrates on the mitochondrial membrane potential.
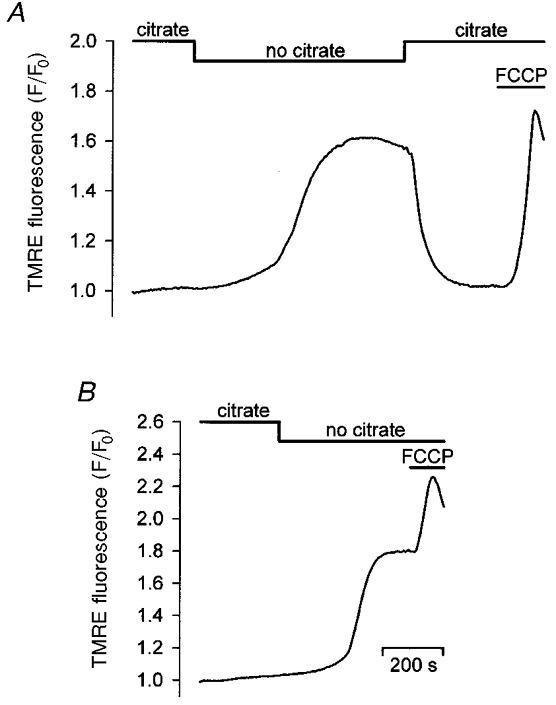
A, glands were permeabilized in ICM-citrate. Removal of citrate from the incubation medium was followed by an increase in TMRE fluorescence, indicative of mitochondrial depolarization. TMRE fluorescence decreased to its initial level after readdition of citrate. Addition of FCCP (1 μM) to dissipate Δψm at the end of the experiment caused a rapid rise of the signal. B, withdrawal of citrate from the intracellular-like medium resulted in a persistent rise in TMRE fluorescence. Subsequent dissipation of Δψm with FCCP (1 μM) further increased the TMRE signal.
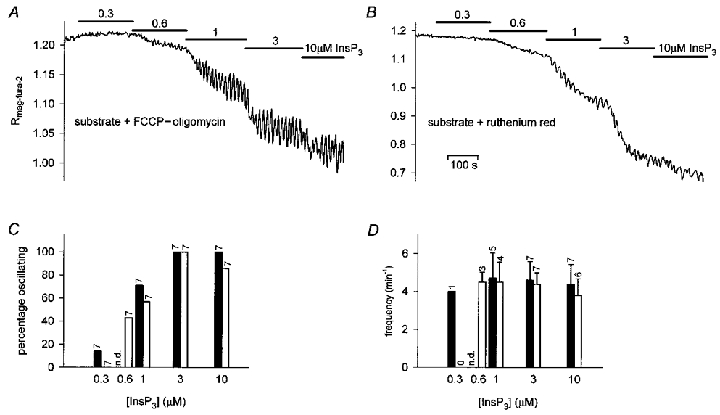
Increasing concentrations of InsP3 applied in the presence of the mitochondrial substrates citrate (10 mM), succinate (10 mM), or pyruvate/malate (5 mM/5 mM) caused changes in [Ca2+]L that consisted of graded declines and concomitant repetitive transient falls (Fig. 7). These responses were qualitatively similar to the responses observed in the absence of mitochondrial substrates. Plotting of the tonic changes in [Ca2+]L as a function of [InsP3] revealed that the decline of [Ca2+]L was little affected by the addition of substrates (compare Figs 5A and 8A; Table 1). In contrast to the previous experiments, however: (1) a greater fraction of the preparations showed [Ca2+]L oscillations at low and intermediate InsP3 concentrations (71 vs. 10 % at 0.6 μM InsP3 in ICM-citrate and ICM-EGTA, respectively; Fig. 8B); (2) transients reached larger amplitudes than in the absence of substrates (Fig. 7) and (3) oscillation frequencies clearly increased as the concentration of InsP3 was raised (Fig. 8C, Table 2). Some preparations responded to the addition of 0.3 or 0.6 μM InsP3 with only a single transient during a 3 min stimulation period. Therefore, the lowest frequencies measured in these experiments are likely to overestimate the lower limit of oscillation frequencies. Despite the greater interspike intervals at low and intermediate levels of stimulation, [Ca2+]L did not completely recover to pre-stimulation levels between individual transients (Figs 7, and 9A and C) indicating that repetitive transient release and continuous Ca2+ efflux from the Ca2+ stores between spikes contributed to the overall decrease in store Ca2+ content.
Figure 7. InsP3-induced changes in [Ca2+]L determined in the presence of oxidizable mitochondrial substrates.
Preparations were challenged by step-wise increases in [InsP3] applied in ICM-citrate (A), ICM-succinate (B), or ICM-pyruvate/malate (C). Under all these conditions, increasing [InsP3] caused graded declines in [Ca2+]L accompanied by an increase in the frequency of [Ca2+]L oscillations. To avoid changes in the free Ca2+ concentration of the intracellular-like media resulting potentially from the addition of mitochondrial substrates, these experiments were performed in ICM supplemented with 100 μM EGTA.
Figure 8. Concentration dependence of amplitude, threshold and frequency of InsP3-induced changes in [Ca2+]L in the presence of oxidizable mitochondrial substrates.
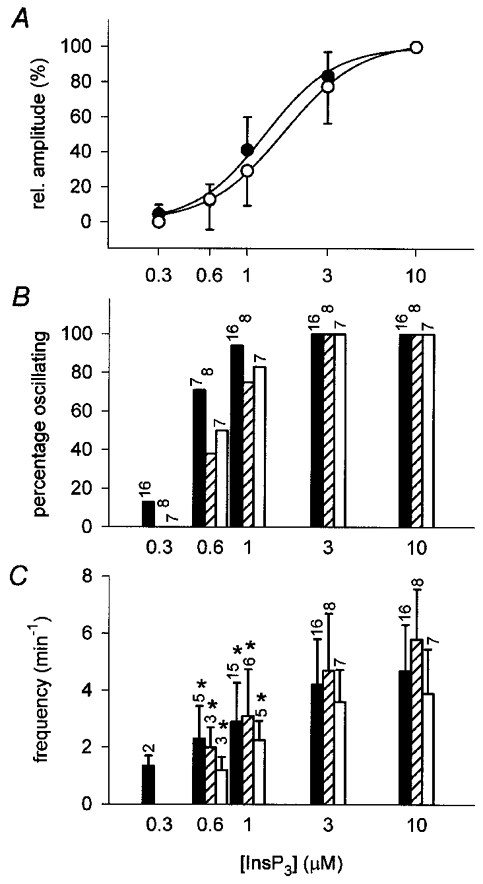
A, relative amplitudes of InsP3-evoked tonic falls in the mag-fura-2 ratio determined in ICM-citrate (•) or ICM-puruvate/malate (○). Amplitudes of declines at 10 μM InsP3 were set to 100 %. Data from experiments performed in ICM-succinate are similar and are not shown for reasons of clarity. B, fraction of preparations responding with [Ca2+]L oscillations to a given [InsP3] in ICM-citrate (filled bars), ICM-succinate (hatched bars), or ICM-pyruvate/malate (open bars). Numbers above bars indicate the number of experiments included in each data set. C, oscillation frequencies at different [InsP3] in the presence of mitochondrial substrates: citrate (10 mM, filled bars), succinate (10 mM, hatched bars), or pyruvate/malate (5 mM each, open bars). Numbers, as B. *Oscillation frequencies that are significantly (P < 0.05) different from the frequencies at 10 μM InsP3 (see also Table 2). Amplitudes of tonic declines, fractions of responsive preparations, and oscillation frequencies were determined as described in Fig. 5.
Figure 9. Spatio-temporal pattern of InsP3-mediated [Ca2+]L oscillations.
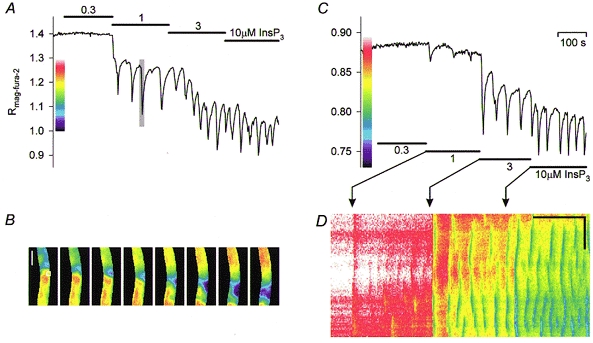
InsP3 delivered at increasing concentrations in ICM-citrate (A) or ICM-pyruvate/malate (C). B, series of pseudocolour images of the mag-fura-2 fluorescence ratio corresponding to the time segment indicated by the shaded area in A. Image intervals 2 s. The lateral diameter of the secretory cells that form the tube-like single-layered epithelium is ≈15-20 μm. The white box (19 μm × 19 μm) indicates the region selected to construct the graph in A; vertical scale bar 100 μm. D, space-time plot of B. A line (1 pixel × 102 pixels, 3.8 μm × 385 μm) projected onto the permeabilized gland was sequentially extracted from a series of pseudocolour images of the mag-fura-2 ratio and stacked according to the time of acquisition. Thus, the ordinate of the plot represents the location, whereas the abscissa represents time. Bands of altered pseudocolours in the plot reflect coordinate transient falls in [Ca2+]L. Horizontal scale bar 100 s, vertical scale bar 100 μm.
The low oscillation frequencies observed at low [InsP3] in the presence of mitochondrial substrates allowed the spatio-temporal organization of the intraluminal [Ca2+] changes to be resolved. This analysis revealed coordinated waves of Ca2+ release over distances corresponding to the lateral diameters of several cells (Fig. 9B and D).
The substances used to activate mitochondria are also known to bind Ca2+, though with low affinity. To test whether the effects of the substrates were due to increasing the Ca2+ buffer capacity of the media or mitochondrial activation, we investigated the effects of blocking mitochondrial activity while mitochondrial substrates were present. The rationale behind this experiment was that blocking mitochondrial activity should reverse the effects of the mitochondrial substrates while the Ca2+-buffering capacity of the intracellular-like medium should not be changed. To this end, we used FCCP (1 μM) in combination with oligomycin (2.5 μg ml−1), to prevent activation of the mitochondrial ATP synthase in the reverse mode. Pre-incubation with FCCP-oligomycin in ICM-citrate did not measurably affect the amplitudes of InsP3-induced persistent declines of [Ca2+]L (Table 2), but, as shown in Fig. 10A and D, the presence of FCCP-oligomycin resulted in the complete loss of the [InsP3]-dependent modulation of Ca2+ oscillation frequency and produced oscillations of high frequencies at any concentration of InsP3 tested. Thus, the preparations treated according to this protocol behaved like the preparations stimulated in the absence of mitochondrial substrates.
Figure 10. Effects of mitochondrial inhibitors on InsP3-induced dynamics of [Ca2+]L.
A, time course of changes of the mag-fura-2 ratio induced by graded increases of [InsP3] in the presence of the mitochdrial uncoupler FCCP (1 μM) and the mitochondrial F0F1-ATPase inhibitor oligomycin (2.5 μg ml−1). Both substances were added approximately 5 min before stimulation. The experiment was performed in ICM-citrate. B, time course of changes of the mag-fura-2 ratio induced by graded increases of [InsP3] in the presence of Ruthenium Red (10 μM). C, fraction of preparations exhibiting [Ca2+]L oscillations at given InsP3 and FCCP-oligomycin (filled bars, see also A) or Ruthenium Red (open bars, see also B). Numbers above the bars indicate the total number of preparations studied. Preparations that did not show oscillations at any of the concentrations tested were not included. D, frequencies of Ca2+ oscillations at different [InsP3] in the presence of FCCP-oligomycin (filled bars) or Ruthenium Red (open bars). Numbers above the bars indicate the number of preparations exhibiting oscillations.
FCCP and oligomycin can be expected to dissipate mitochondrial proton motive force, Δψm and inhibit mitochondrial ATP production. Therefore, the effects of these substances on InsP3-evoked Ca2+ oscillations in the salivary gland may have resulted from the inhibition of Δψm-dependent mitochondrial Ca2+ uptake or from local ATP depletion in the vicinity of InsP3 receptors whose gating has been shown to be sensitive to [ATP] (Smith et al. 1985; Ferris et al. 1990; Landolfi et al. 1998). To discriminate between these potential effects, glands were stimulated with InsP3 in the presence of citrate (10 mM) and Ruthenium Red, an inhibitor of the mitochondrial Ca2+ uniporter. Upon treatment with Ruthenium Red (10 μM) the frequency of the Ca2+ oscillations again became independent of the InsP3 concentration (Fig. 10B and D; Table 2), suggesting that functional mitochondrial Ca2+ uptake was required for the [InsP3]-dependent modulation of Ca2+ oscillation frequency.
To follow the effects of the dissipation of Δψm directly in the presence of InsP3, FCCP and oligomycin were next added after low-frequency oscillations were elicited at a constant intermediate concentration of InsP3 in ICM-citrate. Following the addition of FCCP-oligomycin, [Ca2+]L oscillations ceased in three out of six preparations treated according to this protocol (Fig. 11A), whereas the frequency in the remaining three experiments increased from 2.2 ± 1.30 to 4.7 ± 0.82 min−1 (cf. Fig. 11B). This finding shows directly that the dissipation of Δψm relieves the negative control of mitochondria over the frequency of Ca2+ oscillations and shifts the threshold for the establishment of Ca2+ oscillations to lower [InsP3] as suggested by the previous experiments (compare Figs 5B and C and 8B and C). An additional immediate effect of the application of inhibitors in these experiments was, as shown in Fig. 11A and B, a slow fall of [Ca2+]L and subsequent recovery. We cannot rule out that this is the result of a direct effect of the inhibitors on InsP3-sensitive stores rather than on mitochondria. However, such transients were not observed when FCCP-oligomycin were applied in the absence of InsP3 (see also above), and the dissipation of Δψm is known to reverse the activity of the mitochondrial Ca2+ uniporter, which then becomes an efflux pathway. Thus, the FCCP-oligomycin-induced transient decreases in [Ca2+]L may be a consequence of the activation of Ca2+ release via InsP3 receptor channels triggered by Ca2+ leaking from depolarized mitochondria.
Figure 11. Effects of mitochondrial inhibitors on [Ca2+]L at constant [InsP3].
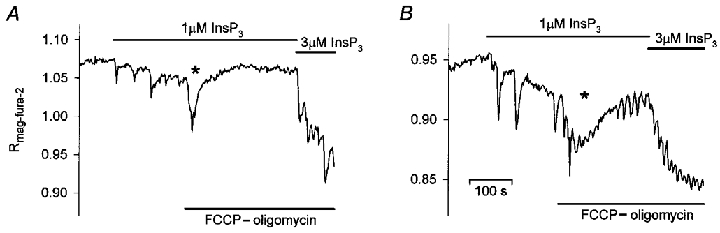
Experiments were carried out in ICM-citrate. Addition of FCCP (1 μM) and oligomycin (2.5 μg ml−1) was followed by a transient fall in [Ca2+]L (*) and either stopped the [Ca2+]L oscillations induced by InsP3 (1 μM) (A) or caused the oscillation frequency to increase (B). InsP3 (3 μM) was added at the end of the experiments to verify the responsiveness of the preparations.
DISCUSSION
The results of the present study demonstrate that the application of InsP3 to permeabilized salivary gland cells of the blowfly causes periodic Ca2+ release from intracellular Ca2+ stores into the cytosol and thereby reproduces hormone-evoked [Ca2+]C oscillations in the intact gland. Most remarkably, InsP3-induced oscillatory Ca2+ release episodes spread over several neighbouring cells as a coordinated wave, as do cytoplasmic Ca2+ oscillations in intact cells.
Mechanism underlying Ca2+ oscillations in the permeabilized cells
Ca2+ oscillations in the permeabilized preparation did not occur under conditions of strong Ca2+ buffering suggesting that changes in [Ca2+]C are crucial for this process. When buffering of [Ca2+]C with high concentrations of EGTA prevented Ca2+ oscillations, InsP3 caused declines of [Ca2+]L whose amplitude increased with the concentration of InsP3. Under the conditions of these experiments, constant [Ca2+]L reflects a steady state produced by opposing fluxes of Ca2+ out of and into InsP3-sensitive Ca2+ stores. The observed monotonous declines in [Ca2+]L are, therefore, readily explained by stably increased rates of InsP3-induced Ca2+ release at a constant rate of Ca2+ uptake, most likely via SERCA-type Ca2+ pumps. Thus, the present findings suggest that increasing concentrations of InsP3 at clamped [Ca2+]C recruited an increasing population of InsP3 receptors, which then provided a steady concentration-dependent flux of Ca2+ from the Ca2+ stores. A similar pattern of Ca2+ release occurred when low Ca2+ buffering of the artificial intracellular medium permitted Ca2+ oscillations. The tonic falls of [Ca2+]L observed under these conditions clearly do not result from an incomplete recovery between spikes, because they were also seen under conditions that produced interspike intervals long enough for [Ca2+]L to recover completely from the phases of enhanced release (see Figs 7 and 9). This implies that Ca2+ release induced by InsP3 in permeabilized salivary gland cells bathed in weakly Ca2+-buffered media consists of two components: (1) periodic transient Ca2+ release events dependent on fluctuations in [Ca2+]C and (2) an apparently steady Ca2+ efflux between Ca2+ spikes whose magnitude varies with the concentration of InsP3.
Our data are therefore consistent with a subsaturating concentration of InsP3 causing the opening of a fraction of InsP3 receptor Ca2+ channels located in the membranes of intracellular Ca2+ stores, thereby creating increased concentration-dependent fluxes of Ca2+ into the cytosol. The resultant local elevations in [Ca2+]C then excite neighbouring InsP3 receptors and induce the regenerative release of additional Ca2+, which underlies the rapid fall in [Ca2+]L and the upstroke of a [Ca2+]C spike. This phase of rapid release is probably the result of the well-documented Ca2+-mediated shift in InsP3 receptor sensitivity toward InsP3 (Baumann & Walz, 1989; Parker & Ivorra, 1990; Bezprozvanny et al. 1991; Finch et al. 1991). Subsequent closure of the channels may be induced by Ca2+ feedback inhibition (Iino, 1990; Meyer & Stryer, 1991; Bezprozvanny et al. 1991; Finch et al. 1991) or by intrinsic inactivation of Ca2+-bound receptors (Hajnóczky & Thomas, 1997). This inactivation, in concert with the activity of SERCA-type Ca2+ pumps, is likely to terminate the spike and to lead to a fall of [Ca2+]C back to baseline. Finally, recovery from inactivation reestablishes the initial sustained InsP3-induced Ca2+ fluxes, thereby completing the cycle and resetting the system. According to this sequence of events, Ca2+ oscillations are essentially driven by InsP3-evoked Ca2+ efflux periodically triggering Ca2+-induced Ca2+ release from a single internal Ca2+ pool. This model does not invoke periodic changes in concentration of InsP3 and directly explains the spatial spread of Ca2+ waves from sites of Ca2+ spike initiation (Fig. 9B and D; De Young & Keizer, 1992; Atri et al. 1993).
Mechanisms controlling Ca2+ oscillation frequency in the permeabilized cells
A central observation of the present study is that the frequency modulation of Ca2+ oscillations observed in intact cells was, in our hands, completely lost after permeabilization of the plasma membranes. This means that whatever the specific mechanism underlying periodic InsP3 receptor Ca2+-release channel closure, it is unlikely to account for the moduation of oscillation frequency. Consistent with this notion, others have found that the recovery of the InsP3 receptor from InsP3- or Ca2+-dependent inactivation proceeds with half-times ranging from one to a few seconds (Ogden et al. 1990; Finch et al. 1991; Parker et al. 1996; Hajnóczky & Thomas, 1997). Thus, recovery from inactivation is too rapid to limit oscillation frequency at low stimulus strengths, when interspike intervals reach 1–2 min in the salivary gland (Zimmermann & Walz, 1997) and up to several minutes in other cells. The present data show that, in permeabilized salivary gland cells, the addition of the tricarboxylic acid-cycle substrates citrate, succinate, and pyruvate/malate restores, whereas mitochondrial uncoupling in the presence of mitochondrial substrates abolishes, the InsP3 concentration-dependent modulation of Ca2+ oscillation frequency that is characteristic for the intact cells. Moreover, mitochondrial substrates increase the amplitudes of individual Ca2+ spikes and appear to facilitate Ca2+ oscillations at threshold InsP3 concentration. This clearly indicates an important role for mitochondria in controlling InsP3-mediated Ca2+ signalling in this system. Effects of either the activation of mitochondrial metabolism or the breakdown of the mitochondrial membrane potential on the frequency of Ca2+ oscillations have also been reported by others in intact cells. First, Jouaville and coworkers (1995) have shown that the microinjection of pyruvate and malate into Xenopus oocytes increases Ca2+ spike amplitudes and interspike intervals at a given InsP3 concentration, whereas the blocking of mitochondrial function has the opposite effects. Subsequently, interference with mitochondrial function has also been found to affect agonist-evoked Ca2+ signals in oligodendrocytes and astrocytes (Simpson & Russell, 1996; Boitier et al. 1999). In contrast to the present study, these reports failed to clarify, however, whether the contribution of mitochondria to the control of oscillation frequency is secondary to other mechanisms or whether mitochondria provide the primary control over this process.
There are several potential mechanisms through which mitochondria might exert negative control over the Ca2+ oscillation frequency. First, mitochondria might control Ca2+ oscillation frequency through taking up Ca2+ ions that are released from the InsP3-sensitive stores. Alternatively, addition of mitochondrial substrates or dissipation of the mitochondrial proton gradient may have produced or abolished localized gradients in [ATP] which, in turn, may have affected InsP3 receptor gating (Smith et al. 1985; Ferris et al. 1990; Landolfi et al. 1998). However: (1) throughout the present study, glands were superfused with a high concentration of ATP (3 mM) to minimize the contributions of endogenously produced ATP and (2) addition of Ruthenium Red, an inhibitor of mitochondrial Ca2+ uptake, mimicked the effects of FCCP-oligomycin.
Since Ca2+ uptake into mitochondria via the electrogenic mitochondrial Ca2+ uniporter and driven by the mitochondrial membrane potential exhibits a relatively low Ca2+ affinity (Kd > 1 μM), it has long been controversial whether mitochondria can play a significant role in cytoplasmic Ca2+ clearing at concentrations reached under physiological conditions (Carafoli, 1987; Gunter, 1994). Several recent studies, however, have demonstrated that mitochondrial Ca2+ uptake is indeed stimulated and can even be saturated by physiological [Ca2+]C elevations (Rizzuto et al. 1993; Werth & Thayer, 1994; Hajnóczky et al. 1995; Sparagna et al. 1995; Rizzuto et al. 1998; Csordás et al. 1999). Thus, mitochondria positioned close to sites of Ca2+ influx or release are thought to be exposed to microdomains of [Ca2+]C severalfold higher than the peak [Ca2+]C averaged over greater regions of a cell. Energized mitochondria have therefore to be considered as stationary buffers for intracellular Ca2+ that may quantitatively and qualitatively influence physiological Ca2+ signals.
On the basis of the model for Ca2+ oscillations outlined above, a regenerative Ca2+ spike will be triggered when InsP3-mediated Ca2+ efflux via InsP3 receptors causes [Ca2+]C to exceed the threshold for the activation of neighbouring closed, but excitable InsP3 receptors, i.e. when InsP3-induced Ca2+ efflux from InsP3-sensitive Ca2+ stores critically exceeds the rate of Ca2+ removal by all Ca2+-buffering mechanisms. Ca2+ uptake into energized mitochondria positioned close to the sites of release would thus retard InsP3-induced [Ca2+]C rises, thereby delaying Ca2+ mediated activation of closed InsP3 receptors and increasing interspike intervals at constant [InsP3] (Jouaville et al. 1995; and present study). Such an effect of mitochondrial Ca2+ uptake can directly explain the InsP3 concentration-dependent modulation of Ca2+ oscillations in the presence of mitochondrial substrates, as shown in this study, because increasing InsP3-mediated Ca2+ release will increase the rate of [Ca2+]C rise and consequently reduce the time required to generate the Ca2+ trigger necessary for eliciting a Ca2+ spike. Conversely, in the absence of mitochondrial Ca2+ uptake, rates of [Ca2+]C rise may become so fast that they, even at low [InsP3], no longer limit oscillation frequency. Under these conditions, the recovery of InsP3 receptors from Ca2+-dependent inactivation may become a rate-limiting step, resulting in the high-frequency Ca2+ oscillations with all-or-none characteristics observed in the absence of mitochondrial substrates and after mitochondrial uncoupling in the presence of substrates. In addition to delaying positive Ca2+ feedback, mitochondrial Ca2+ uptake may also delay negative Ca2+ feedback operative at higher [Ca2+]C. This would prolong the opening of InsP3 receptor channels and result in enhanced transients of [Ca2+]C and [Ca2+]L as observed in the permeabilized blowfly salivary gland and intact Xenopus oocytes (Jouaville et al. 1995).
In summary, the data presented in this study emphasize the role of mitochondria in controlling the amplitude of Ca2+ spikes and the duration of interspike intervals in InsP3-mediated Ca2+ oscillations. They indicate that energized mitochondria are essential for the generation of temporal patterns of Ca2+ oscillations that are related to the concentration of InsP3 or agonist. Furthermore, they raise the possibility that in vivo changes in mitochondrial membrane potential, either as a consequence of changes in the cell's metabolic state or because of active regulation, may modulate the spatio-temporal organization of InsP3-induced intracellular Ca2+ signals.
Acknowledgments
I wish to thank Drs Bernd Walz and Otto Baumann for critically reading the manuscript and Mrs Angela Hubig and Mrs Ruth Schmidt for outstanding technical assistance. This work was supported by the Deutsche Forschungsgemeinschaft (Zi467/4-1).
References
- Atri A, Amundson J, Clapham D, Sneyd J. A single-pool model for intracellular calcium oscillations and waves in the Xenopus laevis oocyte. Biophysical Journal. 1993;65:1727–1739. doi: 10.1016/S0006-3495(93)81191-3. [DOI] [PMC free article] [PubMed] [Google Scholar]
- Babcock DF, Herrington J, Goodwin PC, Park YB, Hille B. Mitochondrial participation in the intracellular Ca2+ network. Journal of Cell Biology. 1997;136:833–844. doi: 10.1083/jcb.136.4.833. [DOI] [PMC free article] [PubMed] [Google Scholar]
- Baumann O, Walz B. Calcium- and inositol polyphosphate-sensitivity of the calcium-sequestering endoplasmic reticulum in the photoreceptor of the honeybee drone. Journal of Comparative Physiology A. 1989;165:627–636. [Google Scholar]
- Berridge MJ. Inositol trisphosphate and calcium signalling. Nature. 1993;361:315–325. doi: 10.1038/361315a0. [DOI] [PubMed] [Google Scholar]
- Bezprozvanny I, Watras J, Ehrlich BE. Bell-shaped calcium-response curves of Ins(1,4,5)P3- and calcium-gated channels from endoplasmic reticulum of cerebellum. Nature. 1991;351:751–754. doi: 10.1038/351751a0. [DOI] [PubMed] [Google Scholar]
- Boitier E, Rea R, Duchen MR. Mitochondria exert a negative feedback on the propagation of intracellular Ca2+ waves in rat cortical astrocytes. Journal of Cell Biology. 1999;145:795–808. doi: 10.1083/jcb.145.4.795. [DOI] [PMC free article] [PubMed] [Google Scholar]
- Budd SL, Nicholls DG. A reevaluation of the role of mitochondria in neuronal Ca2+ homeostasis. Journal of Neurochemistry. 1996;66:403–411. doi: 10.1046/j.1471-4159.1996.66010403.x. [DOI] [PubMed] [Google Scholar]
- Carafoli E. Intracellular calcium homeostasis. Annual Review of Biochemistry. 1987;56:395–433. doi: 10.1146/annurev.bi.56.070187.002143. [DOI] [PubMed] [Google Scholar]
- Chatton J-Y, Liu H, Stucki JW. Simultaneous measurements of Ca2+ in the intracellular stores and the cytosol of hepatocytes during hormone-induced Ca2+ oscillations. FEBS Letters. 1995;368:165–168. doi: 10.1016/0014-5793(95)00632-j. [DOI] [PubMed] [Google Scholar]
- Csordás G, Thomas AP, Hajnóczky G. Quasi-synaptic calcium signal transmission between endoplasmic reticulum and mitochondria. EMBO Journal. 1999;18:96–108. doi: 10.1093/emboj/18.1.96. [DOI] [PMC free article] [PubMed] [Google Scholar]
- De Koninck P, Schulman H. Sensitivity of CaM kinase II to the frequency of Ca2+ oscillations. Science. 1998;279:227–230. doi: 10.1126/science.279.5348.227. [DOI] [PubMed] [Google Scholar]
- De Young GW, Keizer J. A single-pool inositol 1,4,5-trisphosphate-receptor-based model for agonist-stimulated oscillations in Ca2+ concentration. Proceedings of the National Academy of Sciences of the USA. 1992;89:9895–9899. doi: 10.1073/pnas.89.20.9895. [DOI] [PMC free article] [PubMed] [Google Scholar]
- Dolmetsch RE, Xu K, Lewis RS. Calcium oscillations increase the efficiency and specificity of gene expression. Nature. 1998;392:933–936. doi: 10.1038/31960. [DOI] [PubMed] [Google Scholar]
- Ferris CD, Huganir RL, Snyder SH. Calcium flux mediated by purified inositol 1,4,5-trisphosphate receptor in reconstituted lipid vesicles is allosterically regulated by adenine nucleotides. Proceedings of the National Academy of Sciences of the USA. 1990;87:2147–2151. doi: 10.1073/pnas.87.6.2147. [DOI] [PMC free article] [PubMed] [Google Scholar]
- Fewtrell C. Ca2+ oscillations in non-excitable cells. Annual Review of Physiology. 1993;55:427–454. doi: 10.1146/annurev.ph.55.030193.002235. [DOI] [PubMed] [Google Scholar]
- Finch EA, Turner TJ, Goldin SM. Calcium as a coagonist of inositol 1,4,5-trisphosphate-induced calcium release. Science. 1991;252:443–446. doi: 10.1126/science.2017683. [DOI] [PubMed] [Google Scholar]
- Goldbeter A, Dupont G, Berridge MJ. Minimal model for signal-induced Ca2+ oscillations and for their frequency encoding through protein phosphorylation. Proceedings of the National Academy of Sciences of the USA. 1990;87:1461–1465. doi: 10.1073/pnas.87.4.1461. [DOI] [PMC free article] [PubMed] [Google Scholar]
- Gunter TE. Cation transport by mitochondria. Journal of Bioenergetics and Biomembranes. 1994;26:465–469. doi: 10.1007/BF00762731. [DOI] [PubMed] [Google Scholar]
- Hajnóczky G, Hager R, Thomas AP. Mitochondria suppress local feedback activation of inositol 1,4,5-trisphosphate receptors by Ca2+ Journal of Biological Chemistry. 1999;274:14157–14162. doi: 10.1074/jbc.274.20.14157. [DOI] [PubMed] [Google Scholar]
- Hajnóczky G, Robb-Gaspers LD, Seitz MB, Thomas AP. Decoding of cytosolic calcium oscillations in the mitochondria. Cell. 1995;82:415–424. doi: 10.1016/0092-8674(95)90430-1. [DOI] [PubMed] [Google Scholar]
- Hajnóczky G, Thomas AP. Minimal requirements for calcium oscillations driven by the IP3 receptor. EMBO Journal. 1997;16:3533–3543. doi: 10.1093/emboj/16.12.3533. [DOI] [PMC free article] [PubMed] [Google Scholar]
- Hofer AM, Machen TE. Technique for in situ measurement of calcium in intracellular inositol 1,4,5-trisphosphate-sensitive stores using the fluorescent indicator mag-fura-2. Proceedings of the National Academy of Sciences of the USA. 1993;90:2598–2602. doi: 10.1073/pnas.90.7.2598. [DOI] [PMC free article] [PubMed] [Google Scholar]
- Hofer AM, Machen TE. Direct measurements of free Ca2+ in organelles of gastric epithelial cells. American Journal of Physiology. 1994;267:G442–451. doi: 10.1152/ajpgi.1994.267.3.G442. [DOI] [PubMed] [Google Scholar]
- Iino M. Biphasic Ca2+ dependence of inositol 1,4,5-trisphosphate-induced Ca2+ release in smooth muscle cells of the guinea pig taenia coli. Journal of General Physiology. 1990;95:1103–1122. doi: 10.1085/jgp.95.6.1103. [DOI] [PMC free article] [PubMed] [Google Scholar]
- Jouaville LS, Ichas F, Holmuhamedov EL, Camacho P, Lechleiter JD. Synchronization of calcium waves by mitochondrial substrates in Xenopus laevis oocytes. Nature. 1995;377:438–441. doi: 10.1038/377438a0. [DOI] [PubMed] [Google Scholar]
- Landolfi B, Cruci S, Debellis L, Pozzan T, Hofer AM. Ca2+ homeostasis in the agonist-sensitive internal store: functional interactions between mitochondria and the ER measured in situ in intact cells. Journal of Cell Biology. 1998;142:1235–1243. doi: 10.1083/jcb.142.5.1235. [DOI] [PMC free article] [PubMed] [Google Scholar]
- Li W, Llopis J, Whitney M, Zlokarnik G, Tsien RY. Cell-permeant caged InsP3 ester shows that Ca2+ spike frequency can optimize gene expression. Nature. 1998;392:936–941. doi: 10.1038/31965. [DOI] [PubMed] [Google Scholar]
- Lloyd QP, Kuhn MA, Gay CV. Characterization of calcium translocation across the plasma membrane of primary osteoblasts using a lipophilic calcium-sensitive fluorescent dye, Calcium Green C18. Journal of Biological Chemistry. 1995;270:22445–22451. doi: 10.1074/jbc.270.38.22445. [DOI] [PubMed] [Google Scholar]
- Meyer T, Stryer L. Calcium spiking. Annual Review of Biophysics and Biophysical Chemistry. 1991;20:153–174. doi: 10.1146/annurev.bb.20.060191.001101. [DOI] [PubMed] [Google Scholar]
- Nicholls DG, Crompton M. Mitochondrial calcium transport. FEBS Letters. 1980;111:261–268. doi: 10.1016/0014-5793(80)80806-4. [DOI] [PubMed] [Google Scholar]
- Oancea E, Meyer T. Reversible desensitization of inositol trisphosphate-induced calcium release provides a mechanism for repetitive calcium spikes. Journal of Biological Chemistry. 1996;271:17253–17260. doi: 10.1074/jbc.271.29.17253. [DOI] [PubMed] [Google Scholar]
- Ogden DC, Capiod T, Walker JW, Trentham DR. Kinetics of the conductance evoked by noradrenaline, inositol trisphosphate or Ca2+ in guinea-pig isolated hepatoytes. The Journal of Physiology. 1990;422:585–602. doi: 10.1113/jphysiol.1990.sp018002. [DOI] [PMC free article] [PubMed] [Google Scholar]
- Parker I, Ivorra I. Inhibition by Ca2+ of inositol trisphosphate-induced Ca2+ liberation: a possible mechanism for oscillatory release of Ca2+ Proceedings of the National Academy of Sciences of the USA. 1990;87:260–264. doi: 10.1073/pnas.87.1.260. [DOI] [PMC free article] [PubMed] [Google Scholar]
- Parker I, Yao Y, Ilyin V. Fast kinetics of calcium liberation induced in Xenopus oocytes by photoreleased inositol trisphosphate. Biophysical Journal. 1996;70:222–237. doi: 10.1016/S0006-3495(96)79565-6. [DOI] [PMC free article] [PubMed] [Google Scholar]
- Rapp PE, Berridge MJ. The control of transepithelial potential oscillations in the salivary gland of Calliphora erythrocephala. Journal of Experimental Biology. 1981;93:119–132. [Google Scholar]
- Rizzuto R, Bastianutto C, Brini M, Murgia M, Pozzan T. Mitochondrial Ca2+ homeostasis in intact cells. Journal of Cell Biology. 1994;126:1183–1194. doi: 10.1083/jcb.126.5.1183. [DOI] [PMC free article] [PubMed] [Google Scholar]
- Rizzuto R, Brini M, Murgia M, Pozzan T. Microdomains with high Ca2+ close to IP3-sensitive channels that are sensed by neighboring mitochondria. Science. 1993;262:744–747. doi: 10.1126/science.8235595. [DOI] [PubMed] [Google Scholar]
- Rizzuto R, Pinton P, Brini M, Chiesa A, Filippin L, Pozzan T. Mitochondria as biosensors of calcium microdomains. Cell Calcium. 1999;26:193–199. doi: 10.1054/ceca.1999.0076. [DOI] [PubMed] [Google Scholar]
- Rizzuto R, Pinton P, Carrington W, Fay FS, Fogarty KE, Lifshitz LM, Tuft RA, Pozzan T. Close contacts with the endoplasmic reticulum as determinants of mitochondrial Ca2+ responses. Science. 1998;280:1763–1766. doi: 10.1126/science.280.5370.1763. [DOI] [PubMed] [Google Scholar]
- Simpson PB, Russell JT. Mitochondria support inositol 1,4,5-trisphosphate-mediated Ca2+ waves in cultured oligodendrocytes. Journal of Biological Chemistry. 1996;271:33493–33501. doi: 10.1074/jbc.271.52.33493. [DOI] [PubMed] [Google Scholar]
- Smith JB, Smith L, Higgins BL. Temperature and nucleotide dependence of calcium release by myo-inositol 1,4,5-trisphosphate in cultured vascular smooth muscle cells. Journal of Biological Chemistry. 1985;260:14413–14416. [PubMed] [Google Scholar]
- Sparagna GC, Gunter KK, Sheu SS, Gunter TE. Mitochondrial calcium uptake from physiological-type pulses of calcium. A description of the rapid uptake mode. Journal of Biological Chemistry. 1995;270:27510–27515. doi: 10.1074/jbc.270.46.27510. [DOI] [PubMed] [Google Scholar]
- Tanimura A, Turner RJ. Inositol 1,4,5-trisphosphate-dependent oscillations of luminal [Ca2+] in permeabilized HSY cells. Journal of Biological Chemistry. 1996;271:30904–30908. doi: 10.1074/jbc.271.48.30904. [DOI] [PubMed] [Google Scholar]
- Thomas AP, Bird GStJ, Hajnóczky G, Robb-Gaspers LD, Putney JW., Jr Spatial and temporal aspects of cellular calcium signaling. FASEB Journal. 1996;10:1505–1517. [PubMed] [Google Scholar]
- Werth JL, Thayer SA. Mitochondria buffer physiological calcium loads in cultured rat dorsal root ganglion neurons. Journal of Neuroscience. 1994;14:348–356. doi: 10.1523/JNEUROSCI.14-01-00348.1994. [DOI] [PMC free article] [PubMed] [Google Scholar]
- Zimmermann B, Walz B. Serotonin-induced intercellular calcium waves in salivary glands of the blowfly Calliphora erythrocephala. The Journal of Physiology. 1997;500:17–28. doi: 10.1113/jphysiol.1997.sp021995. [DOI] [PMC free article] [PubMed] [Google Scholar]
- Zimmermann B, Walz B. The mechanism mediating regenerative intercellular Ca2+ waves in the blowfly salivary gland. EMBO Journal. 1999;18:3222–3231. doi: 10.1093/emboj/18.12.3222. [DOI] [PMC free article] [PubMed] [Google Scholar]