Abstract
The human luminance mechanism (LUM) detects rapid flicker and motion, summating the neurally integrated L′ and M’‘contrast’ signals from the long- and middle-wave cones, respectively.
We previously observed large temporal phase shifts between the L′ and M′ signals in LUM, which were maximal and of reversed sign on green versus orange background fields and which were accompanied by large variations in the relative L′ and M′ contrast weights. The effects were modelled with phasic magnocellar retinal ganglion cells.
The changing L’ versusM′ contrast weights in the model predict that the temporal dynamics of the L′ and M′ luminance signals will differ on green and orange fields. This is assessed with several protocols.
Motion thresholds for 1 cycle deg−1 drifting gratings or static pulsed gratings on the orange field show that the M' signal is more temporally bandpass than the L' signal; this reverses on the green field. Strong motion due to the different dynamics of the L' and M' signals is even seen with a pair of L' and M' gratings pulsed simultaneously.
Impulse response functions were measured with gratings pulsed spatially in phase or antiphase. The impulse response was clearly biphasic for the M' signal on the orange field and L' signal on the green field, while the other signals were more sustained. The impulse responses predicted the motion seen with gratings pulsed in spatial quadrature.
A luminance mechanism (LUM) in humans detects rapid motion and flicker. The mechanism originates in the phasic retinal ganglion cells as shown by single cell recordings in macaque (Lee et al. 1988). Lesions of this phasic, magnocellular (MC) pathway strongly elevate contrast thresholds for detecting rapid flicker and motion (Schiller et al. 1990).
The LUM mechanism is thought to be achromatic, responding to a neural sum of L' and M' contrast signals originating in the long-wave (L) and middle-wave (M) cones (Lennie et al. 1993). However, flicker studies in humans show that coloured adapting backgrounds strongly influence the LUM mechanism. Swanson et al. (1988) observed that at intermediate temporal frequencies (6 Hz), orange backgrounds induce a large phase lag of the L' signal relative to M', with the phase shift weakly reversing on green backgrounds. The coloured backgrounds also affect the relative L' and M′ contrast weights in the LUM pathway (Eisner & MacLeod, 1981; Stromeyer et al. 1987). Stromeyer et al. (1997) using flicker or motion showed that orange and green backgrounds produce large, opposite phase shifts between the L′ and M′ signals, and that the phase shifts are accompanied by large changes in the ratio of L′ and M′ contrast weights as a function of temporal frequency.
Smith et al. (1992) demonstrated that the phase shifts arise not in the cones (since the L and M cones have very similar temporal responses) but instead arise in the phasic MC retinal ganglion cells. In nearly every MC cell, on orange backgrounds, the L′ signal strongly lagged the M′ signal. Green backgrounds were not tried.
Stromeyer et al. (1997) presented a simple model of the receptive field of the MC ganglion cells which quantitatively explains both the phase shift and the varying ratio of L′ and M′ contrast weights. The model (described in Results) predicts that the temporal dynamics of the L′ and M′ signals in LUM will clearly differ on orange and green backgrounds. We show that the predicted differences in dynamics of the L′ and M′ signals can be directly measured with several simple protocols.
METHODS
Stimuli and calibration
Vertical, red-plus-green sine-wave gratings (3.5 deg diameter) were superposed on monochromatic backgrounds (4.2 deg diameter, 8 nm half-bandwidth) seen in Maxwellian view (Stromeyer et al. 1995). Gratings were produced with a pair of optically superposed, spectrally filtered red and green Tektronix 608 cathode ray tube monitors running at a frame rate of 106 or 200 Hz. Contrast was controlled with 12 bit digital-to-analog converters. Stimuli were monocularly viewed through a 3 mm artificial pupil and achromatizing lens, with the head stabilized using a hard bite bar mounted on an x-y-z translator. The red and green display rasters were adjusted to be temporally synchronous at each retinal point.
To calculate the L and M cone contrast of the gratings, the spectral radiance distributions of the lights (Stromeyer et al. 1995) were weighted by the Smith & Pokorny (1975) cone spectral sensitivity functions. L cone contrast, L′=ΔL/L, is the increment in L cone stimulation, ΔL, owing to the amplitude of the grating normalized by mean L field stimulation, L; M cone contrast, M′, is similarly defined. Contrast is specified by the vector length, VL = ((L′)2+ (M′)2)1/2. Stimuli were typically L′ or M′ gratings, uniquely modulating the L or M cones; we used a variation of the cone isolation procedure of Stockman et al. (1993) to make small adjustments for each observer (Stromeyer et al. 1997).
Field colour and intensity is specified for the central 3.5 deg grating region, including the background. Colour is indicated by the wavelength of the field metameric (matched) for the L and M cones alone, since mean short-wave cone stimulation has little affect on the LUM (Stromeyer et al. 1997). Green and orange adapting fields were generally used since they maximize the relative phase shift and thus produce the greatest temporal differences between the L′ and M′ signals (Stromeyer et al. 1997). Green and orange fields of 510 and 596 nm, respectively, produce L/M stimulation ratios of 1.16 and 3.6 calculated on the basis of the Smith & Pokorny (1975) fundamentals.
Psychophysical procedures
Three protocols were used.
Motion: drifting gratings
On each trial a vertical grating drifted left or right chosen randomly, and the observer judged direction. The temporal contrast envelope of the grating was ramped on for 94 ms with a raised cosine, held constant for 470 ms then ramped off with the cosine. A staircase estimated the contrast direction threshold (at the 71 % correct level) from several runs devoted to a single test condition. Tones signalled the trial interval and provided response feedback.
Motion: pulsed grating pair
Motion was also produced with a pair of static, pulsed gratings. A grating was pulsed briefly and then pulsed again at the same contrast after a fixed delay (stimulus onset asynchrony, SOA). To produce motion, the second grating was shifted 90 deg in ‘quadrature’ spatial phase to the right or left of the first grating. The observer judged direction and the staircase equally varied the contrast of both gratings. (Alternatively, contrast was fixed and we measured the probability that the direction judgement would be correct (probability correct).) To obtain sufficient contrast on the bright backgrounds, each pulse lasted several display frames. The display phosphors decay rapidly (< 1 ms) so each frame is a brief ‘spike’. The pulse duration is specified as the total duration of the intervals between several spikes.
Impulse response functions measured with pairs of pulsed gratings, eliciting no motion
Each trial had two temporal intervals separated by 200 ms. A pair of L′ or M′ test gratings, of equated contrast, was presented in one interval chosen randomly. For each SOA value of the test pair, two staircases were randomly interleaved in a run – in one staircase the gratings were spatially in phase and in the other staircase the gratings were in spatial antiphase (phases not eliciting motion).
In this simple detection task we used a chromatic mask to eliminate chromatic cues so that the test pattern would be detected by the LUM pathway. The mask was an equiluminant red-green grating of the same spatial frequency as the test, presented in both trial intervals. The mask was ramped on for 140 ms with a raised cosine envelope, held constant for 380 ms and then ramped off; the test was presented near the temporal middle of the mask. To reduce chromatic cues, the relative spatial phase of mask and test was randomly set at 120 or 240 deg and the mask contrast was selected randomly (within the range ∼1.5-4.5 times detection threshold) on each of the two trial intervals. This contrast variation swamps any weak red-green cues from the test, while the relative spatial phase minimizes the effect of any red-green test increment. The angle of the equiluminant mask in the L′,M′ co-ordinates was 94-274 deg on the orange field, 112-292 deg on the yellow field and 138-318 deg and 154-334 deg on the green field (observers C.F.S. and P.D.G.).
Observers were male and female, 20-56 years old, with normal colour vision (Farnsworth-Munsell 100-hue test). They participated with informed consent, and the study was approved by the University ethics committee and conformed to the Declaration of Helsinki.
RESULTS
Model of MC retinal ganglion cells
The model predicts large differences between the temporal dynamics of the L′ and M′ signals dependent on background colour. The model characterized the L′versusM′ phase shifts previously measured in LUM (Stromeyer et al. 1997).
Figure 1 shows the assumed receptive field for an on-centre MC cell on the orange background. Phasors (arrows) represent the response of the centre and surround of the receptive field to temporal sinusoidal luminance modulation – phasor length specifies relative response magnitude and phasor angle specifies relative response phase. L and M components of the cell are shown separately, as though there are two superposed receptive fields: one with an L centre and surround (Lc and Ls) and the other with an M centre and surround (Mc and Ms). For an off-centre cell all phasors are of reversed sign.
Figure 1. Phasors showing model response of on-centre MC retinal ganglion cells to luminance flicker on the orange field.
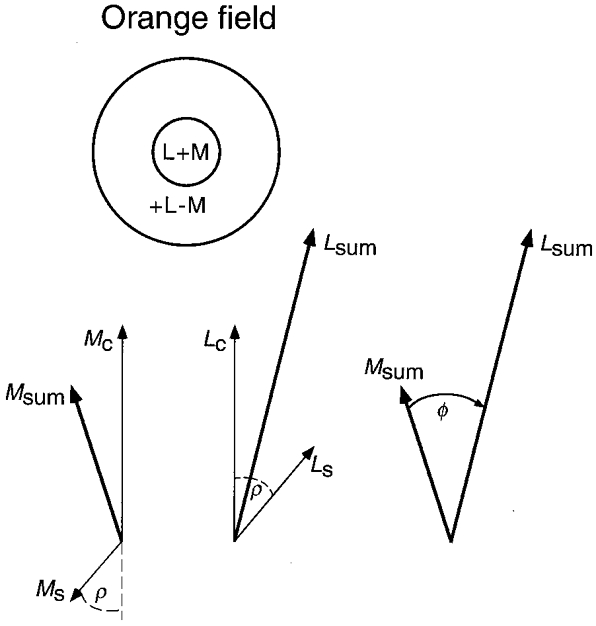
Response phasors are shown separately for L and M components of the receptive field centre (C) and surround (S). The centre summates L and M signals (L+M). Chromatic adaptation modifies the surround – on the orange field at low temporal frequency the M surround is antagonistic to the M centre, but the L surround with opposite sign is facilitory (+L-M). (On the green field the L and M surround components are reversed in sign.) L and M surround components are delayed by ρ deg relative to the centre. Total L and M responses to luminance flicker are represented by sum phasors Lsum and Msum. The angle between Lsum and Msum represents the phase shift (Φ) between the L′ and M′ signals in LUM, and the ratio of lengths Lsum/Msum represents the ratio of L′ and M′ contrast weights. Both effects vary with temporal frequency owing to the surround delay. (The phasors depicted here were previously used to fit phase data for observer C.F.S. measured with 1 cycle deg−1 patterns on the orange field, with the delay shown for 3 Hz.)
The centre summates L and M signals with no relative phase shift, since the L and M cones per se have similar temporal responses (Smith et al. 1992). L and M centre responses are thus represented by the upward-pointing phasors. To explain the phase shift, the spectral nature of the surround must differ from the centre and there must be a delay of the surround response relative to the centre response (Smith et al. 1992). We assume the delay is significant (16-20 ms) causing the surround phasors to rotate about a half-turn relative to the centre phasors by 20 Hz – this was needed to fit the previous data on the phase shift and the large variations in the relative L′ and M′ contrast weights (Stromeyer et al. 1997). The relative strength of the centre and surround response is also assumed to be constant up to ∼20 Hz. These assumptions are discussed later.
Figure 1 shows the phasors previously used to fit the data of observer C.F.S. for patterns of 3 Hz and 1 cycle deg−1 on the orange field. Orange adaptation causes the M surround response to be antagonistic to that of the M centre, so the M centre and surround phasors point approximately in opposite directions, while the L surround response is opposite in sign and thus facilitory. The surround is thus of type +L-M. Owing to the surround response delay Ms and Ls are rotated clockwise by equal amounts (ρ deg from vertical-collinear, but of opposite sign).
The total L′ signal of a cell in response to the luminance flicker is specified by Lsum– the vector sum of the L centre and surround phasors. Similarly, the M′ signal of a cell is specified by Msum. The phase shift between the L′ and M′ signals is specified by the angle (Φ) between the sum phasors, Lsum and Msum. As shown in Fig. 1, the L′ signal strongly lags M′ on the orange field. The opposite phase shift on the green field is obtained by inverting the spectral signs of both surround components, forming a surround of type +M-L. Chromatic adaptation is thus assumed to modify the L and M surround components.
The phase shifts are accompanied by large variations in the relative L′ and M′ contrast weights, specified by the ratio of lengths of the two sum phasors, Lsum/Msum, at each temporal frequency. The ratio changes owing to the surround response delay. For example, on the orange field at low temporal frequency (Fig. 1) the L components, Lc and Ls, point in approximately the same direction and support each other. But as the frequency is raised to 20 Hz, the L surround phasor rotates about a half-turn relative to the L centre phasor, thus producing cancellation between centre and surround responses (Stromeyer et al. 1997). Thus the L′ signal is expected to be temporally low-pass, with sensitivity falling with increasing temporal frequency. In contrast, the M phasors, Mc and Ms, point in approximately opposite directions at low temporal frequency, but the phasors come into phase as temporal frequency is raised, causing the M′ signal to be more bandpass with greater high-frequency extension. Thus on the orange field the M′ contrast weight will grow relative to L′ as temporal frequency is raised. The relationship will reverse on the green field since the surround components are of opposite spectral sign.
Temporal dynamics of LUM measured with motion
We first examined the temporal dynamics of the L′ and M′ signals for motion, using simple drifting L′ or M′ gratings to show that the results are consistent with the model. Motion was then examined with pairs of pulsed L′ or M′ gratings to show variations in the response transience for the L′ and M′ signals. Next, we used a pair of pulsed L′ and M′ gratings to demonstrate that strong motion can be generated even when the pulses are simultaneous, owing to the different temporal dynamics of the L′ and M′ signals. Finally, we measured the impulse response functions for the L′ and M′ signals with pulsed gratings which do not elicit motion; these impulse response functions are then shown to predict the motion seen in the earlier experiments with pulsed gratings.
First motion protocol: drifting L′ or M′ gratings
We previously estimated the relative L′ and M′ contrast weights in several complex ways, for example, by measuring contrast thresholds in a motion quadrature protocol using flickering test gratings which uniquely stimulate L′ and M′, at the optimal temporal phase (Stromeyer et al. 1997). Measurements were made with gratings of 1 cycle deg−1 on green and orange adapting fields of 1300 Td, as used here. We first test whether the predicted variation in the relative weights occurs for detecting motion of simple drifting gratings.
Figure 2 shows contrast sensitivity for identifying drift direction (left versus right) of 1 cycle deg−1 gratings which uniquely stimulate L or M cones. Sensitivity is specified by the reciprocal of the threshold vector length in the L′,M′ cone-contrast co-ordinates. Observers remarked that the direction could be judged when the gratings became just visible and the gratings appeared to drift with veridical velocity – two signatures of motion detected by the LUM pathway (Cavanagh & Anstis, 1991).
Figure 2. LUM motion sensitivity for L′ and M′ drifting gratings of 1 cycle deg−1 on green and orange fields.
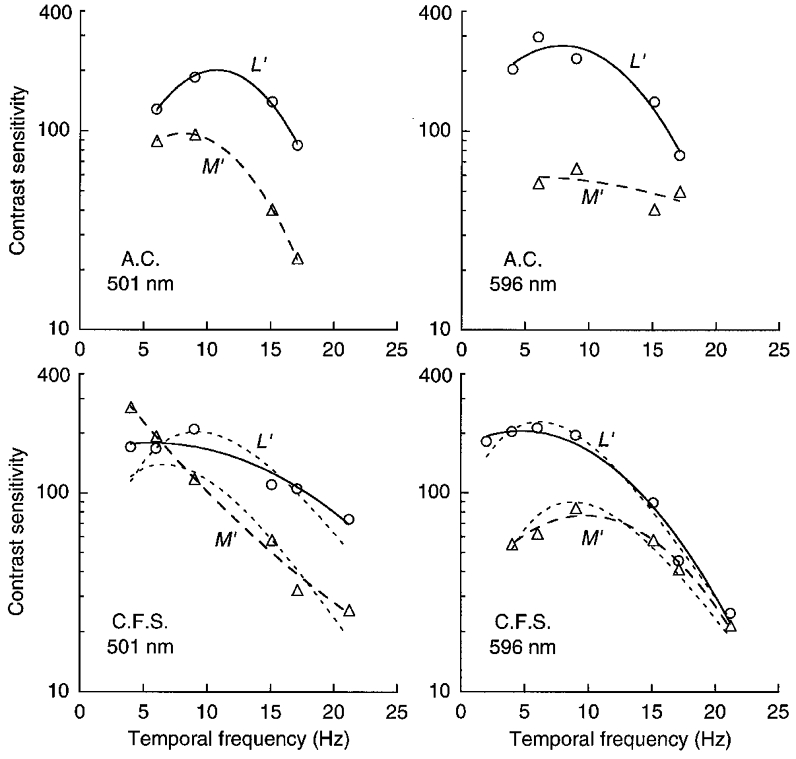
Cone contrast sensitivity is shown for discriminating left versus right motion for patterns stimulating L or M cones. On the green field (501 nm, 1300 Td; left panels) L′ and M′ sensitivities are similar at low temporal frequency, but L′ sensitivity is greater at high temporal frequency. On the orange field (596 nm, 1300 Td; right panels) L′ sensitivity is considerably greater than M′ sensitivity at low temporal frequency and the curves converge at high temporal frequency. The continuous and dashed lines simply help connect data points. (Short-dashed lines for C.F.S. are based on estimates of the impulse response functions.)
On the green field (Fig. 2, left panels) L′ and M′ sensitivities are most similar at low temporal frequency and L′ sensitivity increases relative to M′ at higher temporal frequency. Thus L′ sensitivity extends to higher temporal frequency, while M′ sensitivity drops faster and is more low-pass. The opposite is seen on the orange field (Fig. 2, right panels); L′ sensitivity is much higher than M′ at low temporal frequency and L′ and M′ sensitivities converge at high temporal frequency. Thus M′ sensitivity shows rather little fall-off with increasing temporal frequency, while L′ sensitivity declines rapidly. (The short-dashed lines for observer C.F.S. are vertically scaled estimates of the amplitude responses derived from the impulse response functions described later.)
Figure 3 shows the ratio of L′ and M′ weights for the drifting gratings on the green (▪) and orange (□) fields – these ratios are simply the ratios of the L′ to M′ contrast sensitivities in Fig. 2. Continuous curves from the previous study (Stromeyer et al. 1997) show the fit of the MC cell model for the two observers. The shape and vertical position of the curves is fixed by the previous fit; however, in some cases small vertical shifts give better fits (dashed curves with arrows). The good fit provided by these curves demonstrates an agreement between estimates of the relative weights from the previous complex procedures and estimates from the present results for simple drifting gratings.
Figure 3. Ratio of L′ to M′ weights in LUM mechanism from Fig. 2.
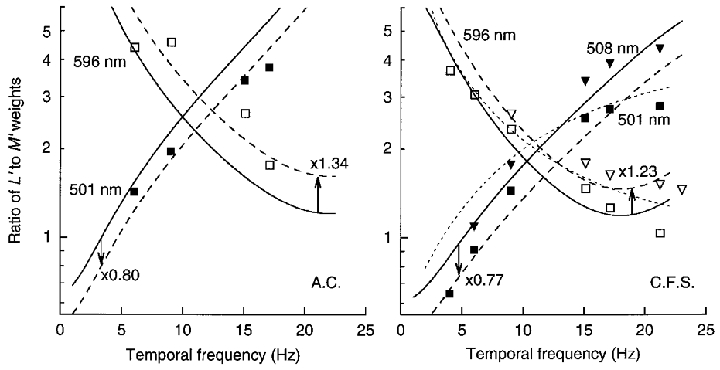
The ratio of weights represents the ratio of L′ and M′ contrast sensitivities in Fig. 2. The ratios change strongly with temporal frequency in opposite directions on the green (▪) and orange (□) fields. (Additional measurements for C.F.S. were obtained with slightly different fields of 508 (▾) and 596 nm (▿) at 1580 Td.) Continuous curves are fits of the MC cell model – small vertical shifts (dashed lines) improve the fits in some cases. (The short-dashed lines for C.F.S. are based on the short-dashed lines of Fig. 2 for the estimated impulse response functions.)
Curve fitting
The continuous curves in Fig. 3 were assessed in two steps by fitting the MC cell model to previous data. First, we fitted data for the L′versusM′ phase shift on the green and orange fields, by varying the length and sign of the surround phasors (Ls and Ms in Fig. 1) relative to the fixed centre phasors (having chosen the appropriate surround delay). This determined the shape of the continuous curves in Fig. 3: the shape specifies the relative lengths of the two sum phasors (Lsum/Msum) as a function of temporal frequency, except for a single scaling factor. Second, the scaling factor was assessed by vertically shifting the continuous curves to fit the previous data on relative weights plotted as in Fig. 3. The shifts in effect scale up the length of the L phasor components (both Lc and Ls, Fig. 1) ∼3-fold relative to the M components (Mc and Ms), indicating that the L component signals in LUM are about 3 times more effective than the M components on the orange and green fields.
Figure 3 shows that the relative L′ and M′ weights changed strongly with temporal frequency on the orange and green fields. However, as is shown next, there are two conditions which produce little variation in the relative weights.
For each observer there is an exact yellow field which nulls the phase shift (Stromeyer et al. 1997). Direction thresholds for the 1 cycle deg−1 drifting gratings were remeasured for observer C.F.S. on a yellow field of 567 nm and ∼1300 Td. The ratio of L′ to M′ weights was nearly constant: 2.46, 2.71, 2.65 and 2.34 at temporal frequencies of 9, 15.1, 17.1 and 21.2 Hz – comparable to the ratio of ∼3 at 2-21 Hz as measured for the observer on a very similar field using the quadrature motion protocol (Stromeyer et al. 1997). The present measurements were confined above ∼9 Hz to prevent intrusion of the red-green chromatic mechanism on the neutrally coloured yellow field.
The large change in relative weights observed with the 1 cycle deg−1 gratings on the green and orange fields (Fig. 3) is presumably caused by an interaction of the centre and surround of the MC cells. The surround response can be reduced by raising spatial frequency, since the smaller centre of the cells responds to finer gratings than does the surround (Enroth-Cugell & Robson, 1966; Croner & Kaplan, 1995). Thus finer gratings may produce less change in the relative weights, as confirmed in Fig. 4 which shows direction sensitivity for L′ (○) and M′ (▵) drifting gratings of 4 cycle deg−1 on the green and orange fields, and their weight ratios (▪, □– right axes). The ratio is nearly constant between 4 and 17.7 Hz: the mean ratio is 2.1 for the green field and 2.5 for the orange field. Using the quadrature motion protocol at 4 cycle deg−1, we previously measured (observer C.F.S.) a similar ratio of 2.3 and 2.7 on the green and orange fields, respectively, at 1 Hz and a ratio of 2.8 and 2.7 at 4 Hz (Stromeyer et al. 1997). The relative phase shift was also reduced at 4 cycle deg−1. Increasing spatial frequency thus decreases the surround response.
Figure 4. LUM motion sensitivity for L′ and M′ drifting gratings of 4 cycle deg−1 on green and orange fields.
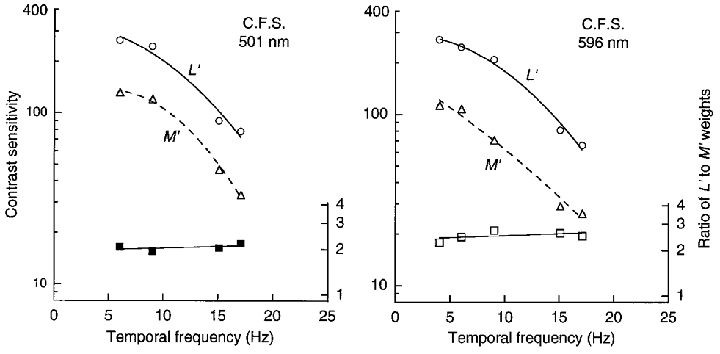
Contrast sensitivity (○, ▵) was measured as in Fig. 2 with gratings of 4 cycle deg−1. The ratio of L′ and M′ weights (▪, □– right axes) is nearly constant with increasing temporal frequency.
Second motion protocol: pulsed L′ or M′ gratings
Purpura et al. (1990) describe several signs of an increased response transience: stronger response attenuation at low temporal frequencies (hence, a more bandpass temporal frequency curve) and a more biphasic impulse response. In contrast, a sustained mechanism will generate a low-pass temporal frequency curve and a prolonged, monophasic impulse response.
Sensitivity for drifting gratings (Fig. 2) on the orange field showed that the M′ signal was more bandpass than the L′ signal, with greater high frequency extension; this reversed on the green field. Thus the M′ signal ought to be more transient on the orange field and the L′ signal on the green field.
One way of demonstrating response transience is to measure direction thresholds for double-pulsed gratings (Pantle & Turano, 1992). We pulsed a pair L′ or M′ gratings of 1 cycle deg−1. The members of each pair were equated in contrast. Motion to the right or left was produced by setting the relative spatial phase to 90 or 270 deg. Figure 5 shows contrast sensitivity for identifying direction as a function of the stimulus onset asynchrony (SOA) of the two pulses. Negative sensitivity indicates that the motion is ‘reversed’– for example, when the second pulsed grating is shifted rightwards 90 deg in spatial phase relative to the first, motion is seen leftwards. On the green field (Fig. 5, left panels) the L′ signal is more transient, since L′ sensitivity drops rapidly and motion reverses beyond ∼60 ms, while M′ sensitivity changes more slowly with SOA and the motion does not reverse even at 85 ms. The opposite effects (Fig. 5, right panels) are seen on the orange field – sensitivity for L′ changes slowly with SOA and motion does not reverse even at 85 ms, while M′ sensitivity falls more rapidly, with motion reversing at ∼65 ms. On both green and orange fields, the maximal sensitivity of the L′ signal is considerably greater than the M′ signal, consistent with the fit of the relative L′ and M′ contrast weights (Fig. 3), where the L phasor components in the model were scaled up ∼3 times in length relative to the M components.
Figure 5. LUM motion sensitivity for pairs of pulsed L′ or M′ gratings of 1 cycle deg−1 on green and orange fields.
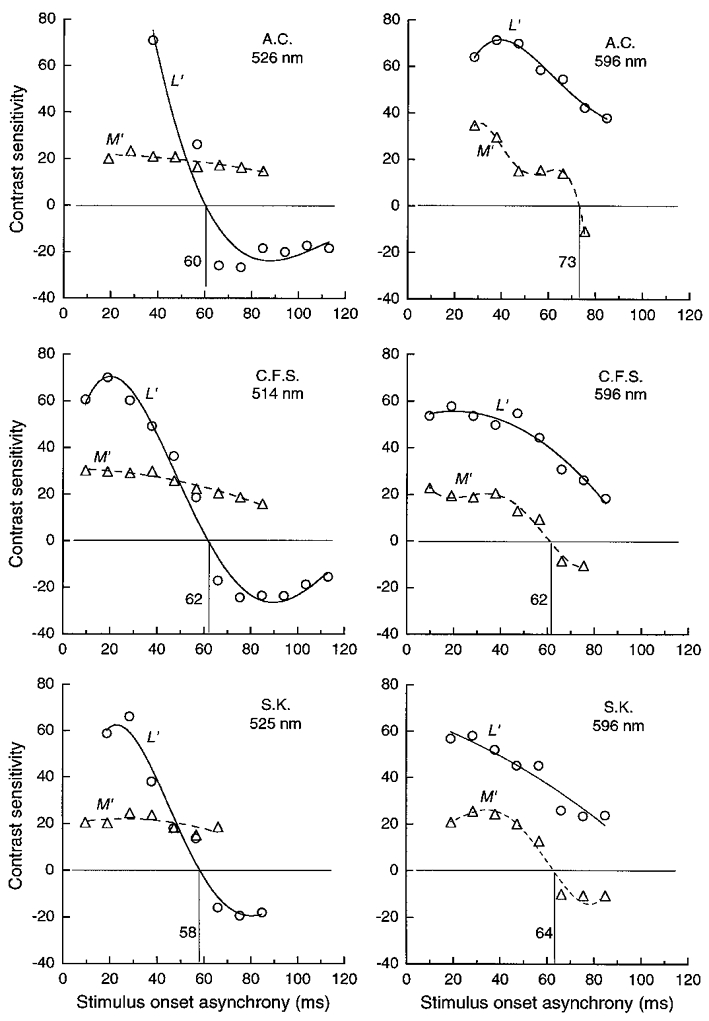
Contrast sensitivity for pairs of pulsed L′ or M′ gratings of equated contrast, as a function of stimulus onset asynchrony (SOA) between the two pulses. Each pair was presented in spatial quadrature phase to produce motion. Negative sensitivity indicates ‘reversed’ perceived motion. The reversals occur near 60 ms for L′ patterns on the green field (left panels) and M′ patterns on the orange field (right panels); the functions are flatter and without a reversal for the other patterns. Orange field luminance was 1440 Td and green field luminance was 1040, 900 and 1100 Td for observers A.C., C.F.S. and S.K., respectively; pulse duration was 15 ms for A.C. and 10 ms for other observers.
Similar features of the results can be revealed with a briefer method. Contrast was fixed at a level several times detection threshold and probability correct was measured for identifying motion direction, with probability correct < 0.5 indicating reversed perceived motion. The method has the advantage that data can be obtained at low visibility levels near 0.5 correct, thus providing a more complete curve of sensitivity variation. Again the L′ signal is seen to be more transient on the green field (Fig. 6, top) and the M′ signal is more transient on the orange field (Fig. 6, bottom).
Figure 6. LUM motion for pairs of pulsed L′ or M′ gratings of 1 cycle deg−1 on green and orange fields.
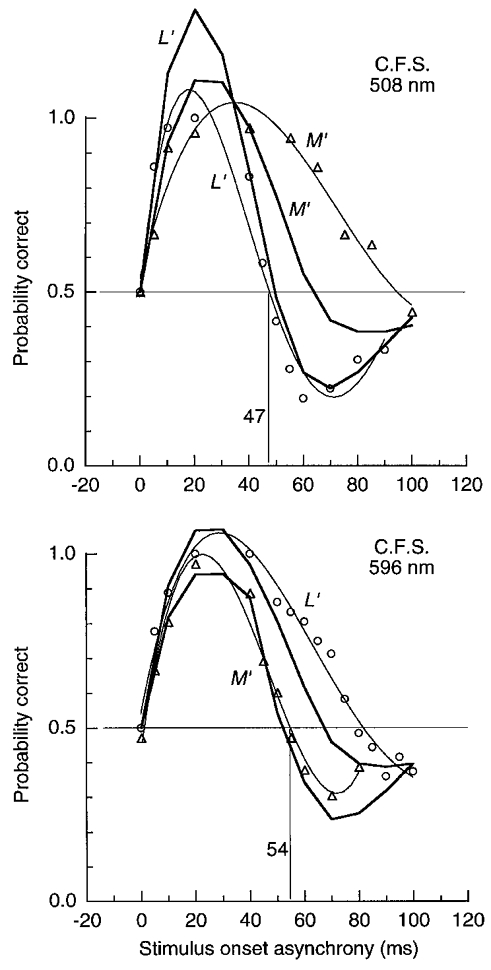
Probability correct for direction judgements of pairs of pulsed (15 ms) L′ or M′ gratings in quadrature spatial phase as function of SOA. Gratings were of fixed contrast: L′ and M′ contrast were 0.067 and 0.056 on the green field and 0.046 and 0.106 on the orange field. Reversed motion is indicated by < 0.5 probability correct. Fitted curves extend above the response ceiling of 100 % correct – thin curves simply help connect data points; thick curves show predictions from the impulse response functions described later (jags in curves indicate points where predictions were calculated). Field luminance was 1580 Td.
The thick curves in Fig. 6 show predictions of the motion responses derived from the impulse response functions measured later. The present procedure imposes a response ceiling at 100 %-correct, but we allowed the fitted curves to extend above the ceiling (in Fig 6, Fig 8 and Fig 9). These predictions provide a reasonable fit for the more transient conditions (the L′ signal on the green field and the M′ on the orange field). The other measurements show more extended forward motion than do the predictions; perhaps these latter results are partially affected by an intrusion of the chromatic mechanisms.
Figure 8. LUM motion for a pair of pulsed L′ and M′ gratings of 1 cycle deg−1 on the orange field.
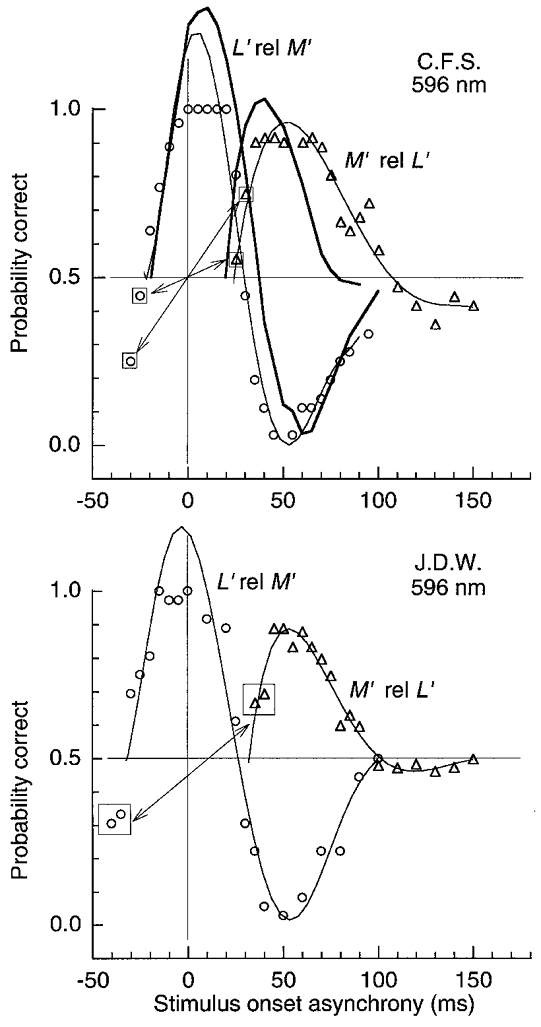
For ○, SOA is specified for the L′ pattern varied relative to M′– motion is strong at 0 SOA and the L′ pattern must be temporally advanced ≈25 ms (to about -25 SOA) to null the motion. ▵, data with the SOA of the M′ pattern varied relative to L′ originally plotted as ○ from -30 to -150 SOA, but now transformed to ▵ by reflection, as illustrated by boxed symbols. Thin curves connect data points; thick curves (for C.F.S.) show predictions from the impulse response functions described later. Pulse duration was 15 ms; L′ and M′ contrast was 0.045 and 0.10; field luminance was 1580 Td.
Figure 9. LUM motion for pair of pulsed L′ and M′ gratings of 1 cycle deg−1 on the green field.
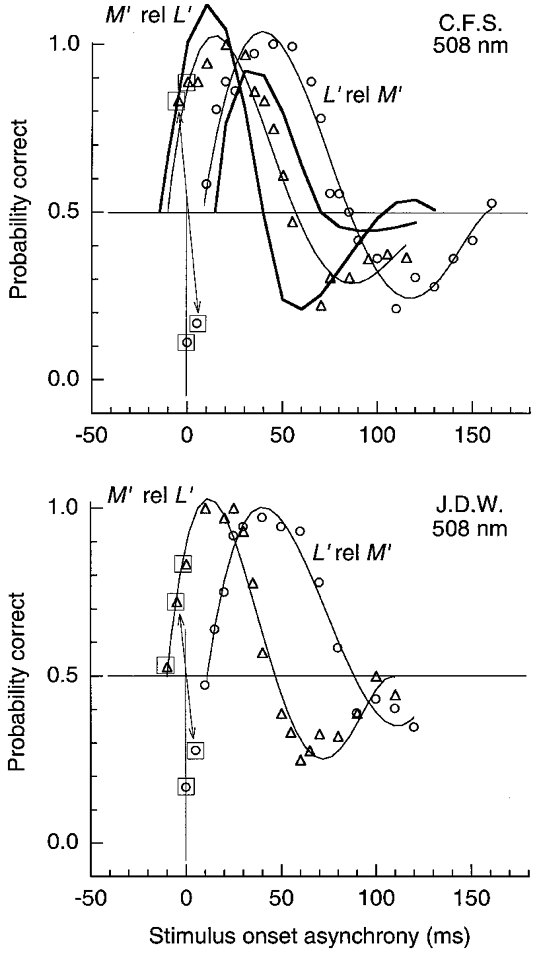
Results plotted in the same format as Fig. 8. On the green field the L′ pattern must be delayed relative to M′ (○) by ≈11 ms to null the motion. Pulse duration was 15 ms; L′ and M′ contrast was 0.065 and 0.062; field luminance was 1580 Td.
Third motion protocol: pairs of pulsed L′ and M′ gratings
If the L′ and M′ temporal signals in LUM clearly differ, then pulsing a pair of L′ and M′ gratings simultaneously in spatial quadrature phase ought to produce a strong motion sensation. We first show that such motion is absent on a yellow field which was carefully selected for each observer, and then show that the motion is strong on the orange or green field.
The yellow field was chosen for each observer to null the L′versusM′ phase shift. A pair of 1 cycle deg−1, L′ and M′ gratings was presented in spatial quadrature phase, flickering temporally in phase at 9 Hz. The psychometric function for left versus right motion discrimination was measured as a function of the wavelength of the yellow field (data not shown). The 0.5 correct point on the function specifies the adapting field wavelength which nulls motion and thus nulls the phase shift.
Next, the static L′ and M′ patterns were briefly pulsed (15 ms) in spatial quadrature phase on the yellow field chosen to null the phase shift. Clear motion (Fig. 7) is seen in the forward and reverse directions at SOAs as short as +5 ms and -5 ms, respectively, and discrimination is near chance at 0 SOA. The absence of the relative phase shift and the lack of motion at 0 SOA imply that the temporal L′ and M′ signals in LUM are essentially identical on the yellow field.
Figure 7. LUM motion for a pair of pulsed L′ and M′ gratings of 1 cycle deg−1 on the yellow field which produces no phase shift.
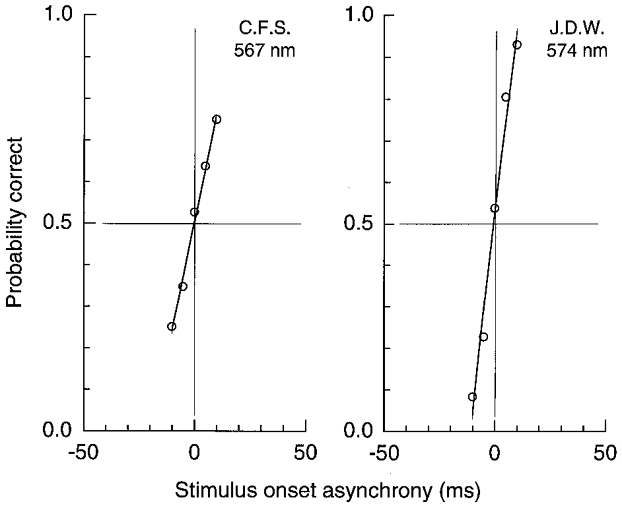
Probability correct for direction judgements of a pair of pulsed (15 ms) L′ and M′ gratings in spatial quadrature phase. Motion is near chance when two patterns are simultaneous (0 SOA). SOA is specified for the L′ pattern relative to M’.L′ contrast was 0.038 and 0.044 (C.F.S and J.D.W., respectively) and M′ was 0.071. Field luminance was 1580 Td and the wavelength was selected to yield no L’ versusM′ phase shift for each observer.
Figure 8 shows measurements similar to those in Fig. 7 but on the orange field. For open circles, the L′ pattern is varied in SOA relative to M′, which isconsidered as the temporal reference. Motion is strong when the two patterns are simultaneous (0 SOA). This is the first demonstration we are aware of where strong motion is elicited with a static flash of no net velocity. The L′ pattern must be temporally advanced relative to the M′ pattern by 24 and 33 ms for the two observers (to -24 and -33 ms SOA) to null the motion. The motion (○) reverses when the L′ pattern is delayed more than 30 ms relative to M′ (at > 30 ms SOA).
These measurements, with the L′ pattern varied relative to M′ (○), were extended to negative SOA values of -150 ms, but only a few of these points are shown, depicted by the boxed open circles to the left. The data at more negative SOAs are represented by open triangles, derived by reflecting the data about the origin as illustrated by arrows. The open triangles in effect show the motion produced by varying the SOA of the M′ pattern relative to the L′ pattern now considered as the temporal reference. Not surprisingly, the M′ pattern must be delayed by ∼25-30 ms relative to L′ to null the motion (at 25-30 ms SOA). Also, the reversed motion occurring beyond 100 ms SOA is much weaker.
The stronger motion reversal (Fig. 8) for the sequence L′ relative to M′ (○) than for the opposite sequence (▵) is expected from the more biphasic response obtained with the M′ patterns than the L′ patterns on the orange field. When the L′ pattern follows M′ by more than 30 ms (Fig. 8, ○, at > 30 ms SOA), M′ has generated a biphasic impulse response which is in its negative mode when the L′ signal occurs, thus generating clear reversed motion (Shioiri & Cavanagh, 1990; Pantle & Turano, 1992). For the converse case, where the M′ pattern is pulsed after the L′ pattern (▵), the L′ response will be in a less negative mode and thus will generate less reversed motion when the M′ signal occurs. The thick lines (observer C.F.S.) show predictions from the impulse response functions, described later. The predictions provide a reasonably good fit of the relative heights of the curves and the zero crossings, despite the fact that the present measurements and the impulse response functions were obtained several years apart using quite different methods.
The results are little affected by the relative contrast of the two patterns. For example, the point where the curves cross the horizontal axis (Fig. 8, ○, near 30 ms SOA) varied by only 3 ms for the two observers as the ratio of L′ and M′ contrast was changed from 2/1 to 1/2 (data not shown). This insensitivity to relative contrast agrees with our previous measurements showing that the L′versusM′ phase shift is also little affected by variations in the relative contrast (Stromeyer et al. 1997).
Figure 9 shows measurements for the same patterns as in Fig. 8 but on the green field. When the L′ pattern is varied in SOA relative to M′ (○), reversed motion occurs at 0 SOA, contrary to the non-reversed motion on the orange field. The L′ pattern must be delayed by ∼11 ms relative to M′ to null the motion, while on the orange field the L′ pattern had to be advanced to achieve the null. We would expect (from Fig. 5) that the motion reversal would be stronger when the M′ pattern follows L′ (▵) than for the converse condition (○) – as illustrated by the thick curves (observer C.F.S.) which show predictions from the impulse response functions. Results for C.F.S. do not show the stronger predicted reversal, but the predictions approximately capture the zero crossings.
Increasing spatial frequency isolates the centre of MC cells and might thus diminish the present effects. Measurements (not shown) were repeated with patterns of 4 cycle deg−1 on the orange field. The effects largely disappeared for observer C.F.S., since the null was achieved with an SOA offset of just 4 ms, compared with the 24 ms required at 1 cycle deg−1, and there was little evidence for reversed motion. For observer J.D.W. the effects were much diminished, for the two patterns had to be offset by 10 ms to achieve the null compared with the 33 ms needed at 1 cycle deg−1, and reversed motion was weaker. The results implicate the receptive field surround in producing these large temporal effects.
Impulse response functions for L′ and M′ signals measured with pulsed gratings which elicit no motion
For the final measurements we estimated the impulse response of the L′ and M′ signals in LUM using pairs of pulsed gratings which do not elicit motion. The impulse response functions are then shown to be consistent with the motion seen with pulsed gratings in the earlier experiments.
Detection thresholds were measured for a pair of contrast-equated, 1 cycle deg−1L′ or M′ gratings, as a function of the SOA between two 10 ms pulses. At each SOA the threshold was assessed for the gratings presented spatially in phase and in antiphase (Broekhuijsen et al. 1976; Watson & Nachmias, 1977). A prolonged, weak red-green mask was used to assure that the LUM pathway detects the test; the test appeared as luminance agitation seen through a quiescent chromatic veil.
Figure 10 shows an example of thresholds on the orange field. At short SOAs the thresholds are much lower for the in phase pair of gratings than for the antiphase pair. However, beyond 25 ms the M′ patterns are clearly more visible when presented in antiphase, thus revealing a strong biphasic response. The curves do not cross in this manner for the L′ patterns so the response is monophasic. From such measurements we can infer the impulse response functions for the L′ or M′ luminance signals, using the procedure of Rashbass (1970) and Watson & Nachmias (1977).
Figure 10. LUM contrast thresholds on the orange field for pulsed L′ or M′ gratings of 1 cycle deg−1 presented spatially in phase or antiphase (not eliciting motion).
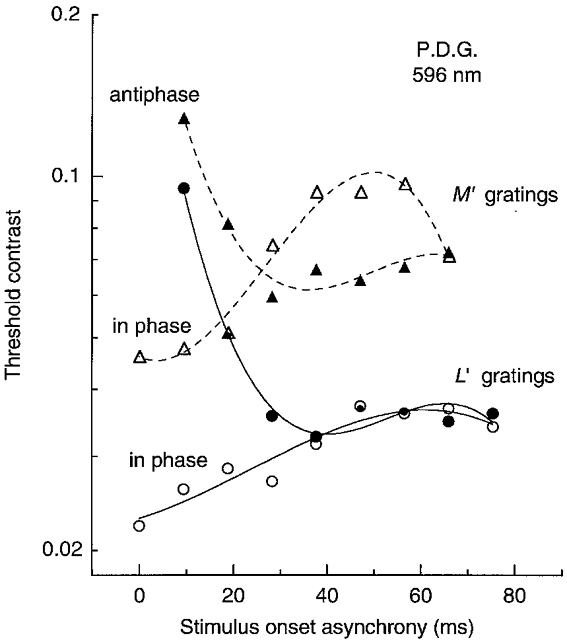
Example of contrast thresholds for pairs of pulsed (10 ms) L′ or M′ gratings as a function of SOA between the pulsed gratings. Members of each pair were of equated contrast. Field luminance was 1580 Td.
Summation index and the autocorrelation function of the impulse response
At each SOA, the contrast thresholds for the two pulses can be expressed by terms A and B. The thresholds for each SOA are represented as an ellipse in the AB-plane, provided the two pulses are separated by delays short enough to be visually integrated (Rashbass, 1970). The ellipse has the form:
intercepting the axes at ±1 (equal unit thresholds on each axis), with major and minor axes at ±45 deg (Broekhuijsen et al. 1976). For each SOA, we estimate the ellipticity variable, εT, from the thresholds on the +45 deg axis for the equal amplitude in phase pair of gratings and from the thresholds on the -45 deg axis for the equal amplitude antiphase pair. Watson & Nachmias (1977) refer to εT as the ‘summation index’, which is plotted in Fig. 11 and Fig. 12. The index ranges from +1, representing the complete positive summation at 0 SOA, to a possible maximal negative value of -1, representing negative summation of the antiphase pair at an SOA longer than ∼25 ms.
Figure 11. LUM summation for pulsed L′ or M′ gratings of 1 cycle deg−1 on green (left) and orange (right) fields.
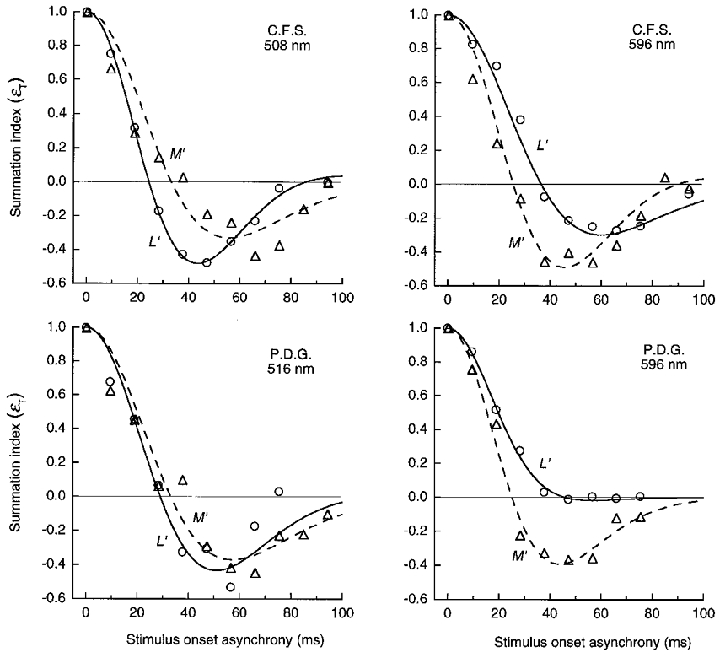
Summation between pairs of L′ or M′ pulsed (10 ms) gratings as function of SOA. Summation index (εT, normalized to 1.0 at 0 SOA) was derived from the thresholds for in phase and antiphase gratings (see text). The summation index describes the autocorrelation function of impulse response of the L′ and M′ signals in LUM. Curves show least-squares fits of the autocorrelation function based on a model of the impulse response. Orange field luminance was 1580 Td and green field luminance was 1580 or 1380 Td (C.F.S. or P.D.G., respectively).
Figure 12. LUM summation for pulsed gratings of 1 cycle deg−1 on the yellow field.
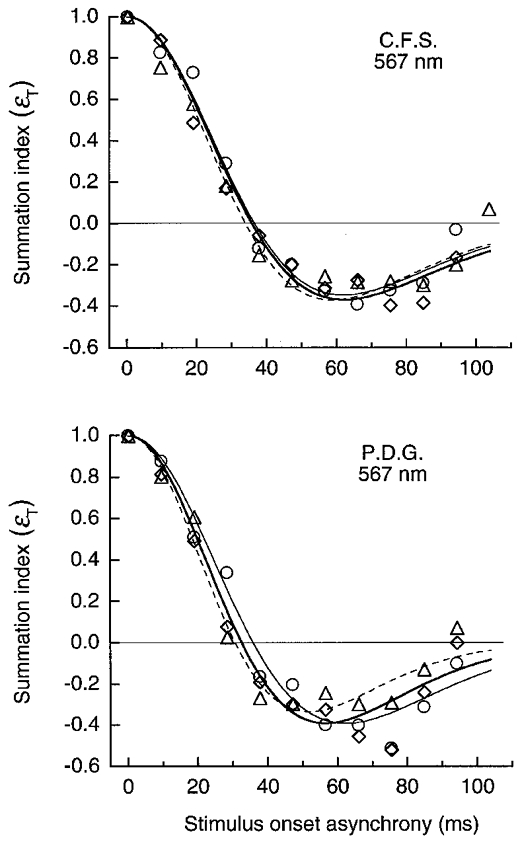
Summation, depicted as in Fig. 11, for pairs of L′ (○, thin continuous line), M′ (▵, dashed line) or pure luminance LUM (⋄, thick continuous line) gratings. Curves show fits based on the impulse response. Pulse duration was 10 ms; field luminance was 1580 Td.
Rashbass (1970) argues that the summation index, εT, plotted as a function of SOA, is equivalent to the autocorrelation function of the impulse response. Thus εT represents the autocorrelation function:
 |
where Φ(t) denotes the impulse response for one pulse and Φ(t – T) denotes the same impulse response for the other pulse temporally shifted by T. This is an approximation since other models, having plausible forms of probability summation for detection, will produce minor deviations from an ellipse in the AB-plane (Rashbass, 1976; Watson & Nachmias, 1977).
The impulse response
To fit the autocorrelation function to the summation data we used Watson's (1986) model of the impulse response:
where the term α serves to normalize the function to a positive peak value of 1 and β is used to scale the negative lobe (Φ2(t)) of the function. The first filter is described:
where n1 is the number of identical cascaded low-pass stages, u(t) is the unit step function, and τ is the time constant. The second filter, Φ2(t), is the same except it has a time constant of kτ and n2 stages. We fixed the values of n1= 9 and n2= 10 as suggested by Watson (1986), while k, β, and τ were free to vary.
Figure 11 shows εT for the L′ and M′ pulses on the green and orange fields. The summation index is an approximation of the autocorrelation function of the impulse response of the L′ and M′ signals. The curves show the least-squares fit of the autocorrelation function based on the model of the impulse response, described above.
On the orange field (Fig. 11, right panels) summation for the M′ pattern drops rapidly and becomes negative at 25 ms SOA, while for L′ patterns positive summation extends to longer SOAs. The L′ function does not become negative for observer P.D.G, and for C.F.S the negative lobe of the L′ function is considerably weaker than for M′. On the green field (Fig. 11, left panels) the roles are reversed: now the L′ function inverts at a short duration of 24 and 29 ms, and the M′ function has a shallower negative lobe beginning at longer SOAs.
Similar measurements (Fig. 12) were made on the 567 nm yellow field using L′, M′ or luminance, LUM, patterns (a 45-225 deg vector in the L′,M′ co-ordinate). The curves for the three stimuli are quite similar, but invert at longer SOAs (34-36 ms for C.F.S. and 31-36 ms for P.D.G.) than the more transient curves on the green or orange fields (inversions at 24-29 ms SOA). The curve for the LUM grating (Fig. 12) inverts at 36 and 33 ms, similar to the 32 ms inversion measured by Watson & Nachmias (1977) with a 1.75 cycle deg−1 luminance grating on a yellow-green field of ∼300 Td.
We used a weak chromatic mask to isolate the LUM mechanism for all of the impulse measurements. Isolation is shown by the similar results on the yellow field (Fig. 12) for the L′ or M′ patterns (which might potentially stimulate the red-green detection mechanism) and for the LUM pattern (which was matched to the field colour so it does not stimulate the red-green mechanism).
Figure 13 and Figure 14 show the impulse responses used to generate the autocorrelation curves in Fig. 11 and Fig. 12. The orange field (Fig. 13) makes the M′ impulse response more transient with a stronger negative lobe, compared with the L′ impulse response. On the green field the situation is reversed – the L′ impulse response is more transient and less extended in time compared with the M′ impulse response. On the yellow field the impulse responses (Fig. 14) for the L′, M′ and LUM patterns are more similar, especially for observer C.F.S. for whom the yellow field was carefully chosen to minimize the L′versusM′ phase shift. The variability in the impulse responses for P.D.G. suggests that the yellow field should have been set to a slightly longer wavelength (thus better minimizing the L′versusM′ phase shift).
Figure 13. Impulse response functions for the L′ and M′ signals in LUM on green and orange fields.
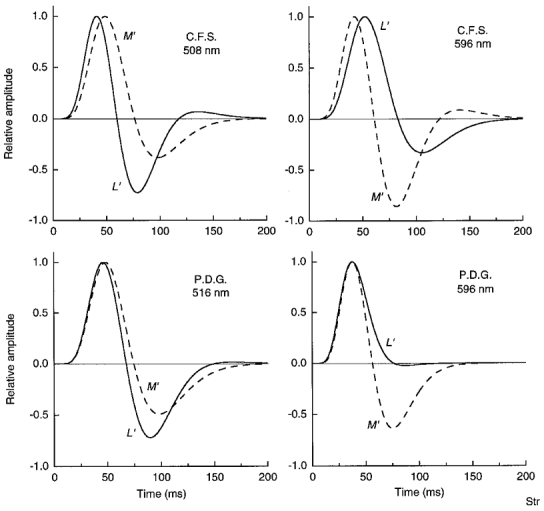
The impulse response functions were derived from the summation data in Fig. 11.
Figure 14. Impulse response functions for the L′, M′ and LUM signals in LUM on the yellow field.
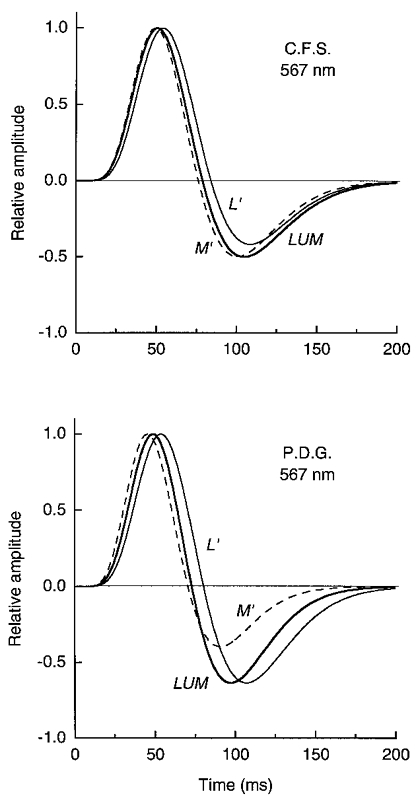
The impulse response functions were derived from the summation data in Fig. 12.
The Fourier transformation of the impulse response provides an estimate of the temporal frequency amplitude response. As shown in Fig. 15, the amplitude response for L′ changes from being bandpass on the green field to more low-pass on the orange field; conversely, the amplitude response for M′ changes from being bandpass on the orange field to more low-pass on the green field. Figure 16 shows that the amplitude responses are similar for the L′, M′ and LUM patterns on the yellow field.
Figure 15. Temporal frequency amplitude response of L′ and M′ signals in LUM on the green and orange fields.
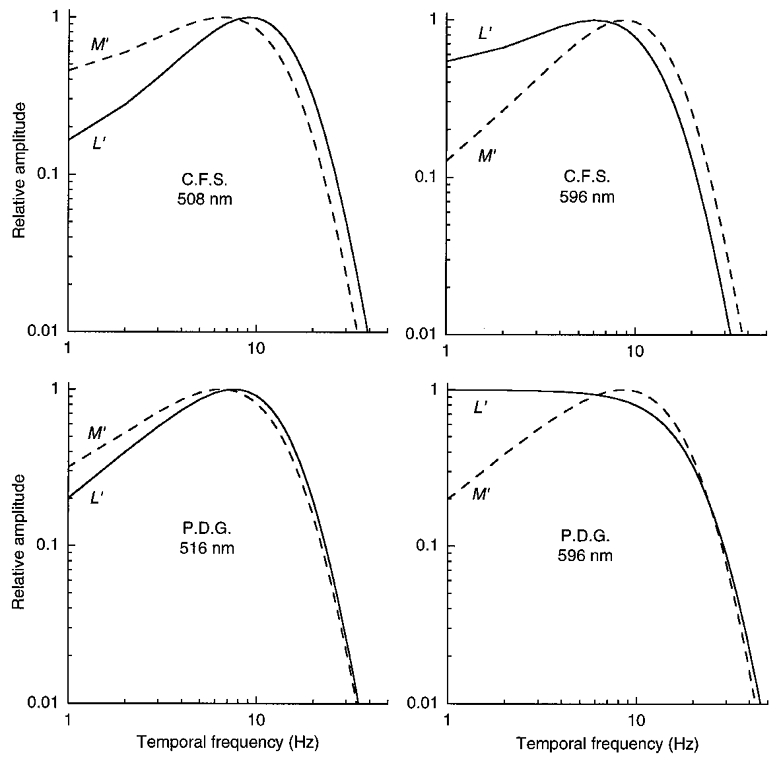
These functions, normalized to the same height, were derived from the impulse responses in Fig. 13.
Figure 16. Temporal frequency amplitude response of L′, M′ and LUM signals in LUM on the yellow field.
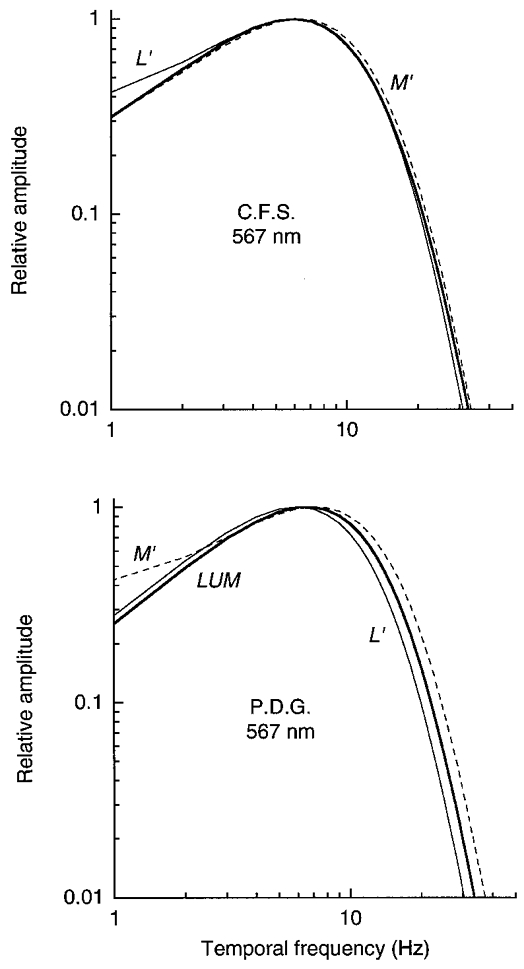
These functions, normalized to the same height, were derived from the impulse responses in Fig. 14.
Predicting motion from the impulse response functions (IRFs)
Figure 8 (top panel) showed the motion responses obtained on the orange field with the pair of pulsed L′ and M′ gratings in spatial quadrature phase. We can now predict these motion responses from the L′ and M′ IRFs measured on the orange field (Fig. 13, observer C.F.S.).
First consider the motion produced when the L′ grating was varied in SOA relative to M′ (Fig. 8, ○). In Fig. 17 we represent the M′ IRF on the horizontal axis and the L′ IRF on the vertical axis. Because the L′ and M′ gratings are in spatial quadrature, the effective spatial phase (θ) of the LUM moving grating signal at each instant of time is given by the angle of the sum vector of the two IRFs, and the effective contrast is given by its length (r). The data in Fig. 17 depict the tips of these vectors at 2 ms intervals over the duration of the IRFs. The three panels show the trace of the vectors for three interesting SOA values – for each SOA, the L′ IRF is delayed relative to the M′ IRF by the SOA value. The direction of motion is given by the direction in which the spatial phase, θ, changes, with dθ/d t= 0 (anticlockwise rotation) indicating motion in the forward direction and dθ/d t= 0 indicating motion in the reverse direction. The strength of the motion signal for each trace is given by the integral, r dt, evaluated over the duration of the impulse responses.
Figure 17. Using the impulse response functions (IRFs) to predict the motion with pulsed L′ and M′ gratings in spatial quadrature phase.

Motion was previously generated on the orange field with a pair of pulsed L′ and M′ gratings, where the L′ grating was varied in SOA relative to M′ (Fig. 8, ○). The L′ and M′ impulse response functions for observer C.F.S. measured on the orange field can be used to predict the motion responses. L′ and M′ IRFs are represented on the vertical and horizontal axes respectively since the gratings were in quadrature spatial phase. Data points show the orthogonal vector sum of the two IRFs at 2 ms increments, representing the moving LUM grating signal – the vector angle indicates the spatial phase of the LUM grating and vector length indicates its effective contrast. At 0 ms SOA (A) the vector rotates anticlockwise (starting at the origin and proceeding from vector a and pass b) producing motion in the forward direction. At 35 ms SOA (B), the vector rotates anticlockwise (from vector a to b) but later reverses, yielding little net directional motion response. At 60 ms SOA (C) the vector rotates clockwise producing reversed motion.
For 0 SOA (Fig. 17A), the vector rotates anticlockwise producing motion in the forward direction – this corresponds to the positive peak near 0 SOA in Fig. 8. For 35 ms SOA (Fig. 17B), the vector initially rotates anticlockwise but then reverses direction, thus nulling the integrated motion – this corresponds to the zero crossing near 35 ms in Fig. 8. For 60 ms SOA (Fig. 17C), the vector rotates clockwise, giving strong reversed motion – this corresponds to the negative peak near 60 ms in Fig. 8.
Details of fitting
The integral of motion strength was calculated at 1 ms intervals over the course of the impulse responses. This was done for each 5 or 10 ms increment of the SOA.
The IRFs for observer C.F.S. were used to fit the motion data for the pairs of L′ or M′ gratings (Fig. 6) and for the pair of L′ and M′ gratings on the orange (Fig. 8) and green fields (Fig. 9). For the latter fits the L′ IRF was weighted relative to the M′ IRF by ×1.12 and ×2.2 on the orange and green field, respectively, to reflect both the relative contrast of the L′ and M′ gratings and the relative signal weightings of L′ and M′ in LUM on the orange and green fields (estimated from Fig. 4). Surprisingly, the predicted response was little affected by these weighting factors, for example, varying the ratio by a factor of 2 in either direction caused the relative heights of the positive peaks (Fig. 9) to change by only 9 % and the three central zero crossing to change by only 2-3 ms.
The size of the motion integral specifies only the relative strength of motion. Thus the function was scaled vertically by a single constant to fit the motion data. The scaling factor constrains the relative height of the peaks for the two conditions where the L′ grating was varied in SOA relative to the M′ grating and conversely (Fig. 8 and Fig. 9). Some discrepancy in the fits might be caused by the use of 15 ms pulses for the motion data and 10 ms pulses to assess the IRFs.
DISCUSSION
Adapting field colour affects the temporal response of L′ and M′ signals in the LUM pathway
For low spatial frequency patterns, orange and green adapting fields produce large, opposite changes in the temporal responses of the L′ and M′ signals in LUM. These effects were demonstrated in several ways. First, on the orange field, thresholds for discriminating the direction of drift of L′ and M′ gratings revealed that the M′ signal had a more transient or bandpass temporal frequency sensitivity curve than did L′, and this reversed on the green field. The ratios of L′ and M′ temporal contrast sensitivities agreed with estimates from the MC cell model. Second, the more transient signals had a more biphasic impulse response. Third, these more biphasic impulses agreed with the stronger motion reversals obtained with the pulsed gratings in spatial quadrature phase, and the impulse response functions roughly predicted the motion produced with the pulsed gratings.
The difference in temporal dynamics of the L′ and M′ signals on green and orange fields is ascribed to an interaction between the centre and surround of the MC cells. Smith et al. (1992) observed that the L′versusM′ phase shift in the MC cells vanished when the centre was isolated with a small flickering spot. Similarly, Kremers et al. (1994) measured a reduction in the phase shift in both humans and MC cells using small flickering spots, and Stromeyer et al. (1997) showed that fine gratings reduced both the phase shift and the variation in the ratio of L′ and M′ weights. In the present study, the weight ratio was constant with temporal frequency for relatively fine drifting gratings of 4 cycle deg−1 on the green and orange fields.
We measured the wavelength of the yellow field which nulled the L′versusM′ phase shift (at 9 Hz) for each observer. On this field no motion was seen with the simultaneously pulsed pair of L′ and M′ gratings in spatial quadrature phase (although strong motion was seen on the green or orange fields). The results indicate that the L′ and M′ signals have similar temporal courses on the yellow field – consistent with the finding that the impulse response was nearly identical for the L′ and M′ signals (observer C.F.S.).
The absence of phase shift on the yellow field might be explained in two ways within the model (Stromeyer et al. 1997). First, on the yellow field the centre and surround of MC cells may have identical spectral sensitivities; this would eliminate the phase shift regardless of a surround delay. Second, there may be two equally represented populations of on-centre (or off-centre) cells, with surrounds of reversed spectral sensitivities – the opposite phase shifts produced by these two populations would cancel for the psychophysical judgements which depend upon the ensemble. Present evidence favours the latter explanation (Stromeyer et al. 1997).
The receptive field surround of MC cells affects the transience of L′ and M′ signals in LUM
At low spatial frequency, the M′ signal is more transient than L′ on the orange field and the L′ signal is more transient than M′ on the green field. In the model of MC cells, the receptive field surround affects the degree of transience, or degree of low-frequency attenuation. On the orange field, for example, the M′ centre and surround signals (Fig. 1) oppose each other at low temporal frequency, but at high temporal frequency the surround supports the centre response owing to the surround delay. This attenuates low temporal frequencies. The opposite effects occur for the L′ signal on the orange field.
The inhibitory surround of ganglion cells may augment response transience. Cat X cells show (Enroth-Cugell et al. 1983) greater low temporal frequency attenuation when stimulated with a low spatial frequency grating (affecting centre and surround) than when stimulated with fine gratings which isolate the centre – mimicking the pattern of thresholds for similar stimuli in humans (Robson, 1966). The centre and surround signals in the X cells are approximately out of phase at low temporal frequency, but come more into phase at high temporal frequency owing to the surround delay – thus causing the temporal response of the cell to be more bandpass (Enroth-Cugell et al. 1983).
Macaque red-green PC cells also show increased transience owing to the surround. The centre, for example, may have an excitatory L cone input and the surround may have an inhibitory M cone input (Reid & Shapley, 1992; Benardete & Kaplan, 1999b). The temporal response will be more low-pass for uniform red-green flicker and more bandpass for uniform luminance flicker, since low-frequency red-green flicker produces synergy between the centre and surround signals, while low-frequency luminance flicker produces antagonism (Lee et al. 1994). Consistent with this difference, the impulse response in the PC cells is largely monophasic for red-green pulses and biphasic for luminance pulses (Lee et al. 1994; Benardete & Kaplan, 1999b).
Evidence is less direct in showing that the surround of MC cells increases response transience. For fine luminance gratings, sensitivity declines 3- to 4-fold between 10 and 1 Hz (Derrington & Lennie, 1984; Purpura et al. 1990) indicating that the centre is temporally bandpass to some degree. However, for spatially uniform luminance flicker (Lee et al. 1990, 1994) the low-frequency decline is greater, 8- to 10-fold between 10 and 1 Hz. This greater attenuation may be caused by the delayed, antagonistic surround. Benardete & Kaplan (1999a) showed that subunits in the surround may also provide a contrast gain control which attenuates the response at low temporal frequency. The gain control is not manifest for a small spot confined to the centre, but does occur with either a surround-stimulating annulus or with a relatively fine grating which affects the small surround subunits.
In summary, a delayed inhibitory surround may augment response transience as postulated in the model of MC cells.
MC cells and psychophysical luminance sensitivity
Lee et al. (1990) showed that sensitivity to luminance flicker in humans and MC ganglion cells is parallel up to 20 Hz, but the cells are more sensitive at high frequencies, responding up to 80 Hz. A low-pass cortical filter, with 20 Hz corner frequency, was postulated to explain the greater high-frequency decline in humans. In spite of this difference, the psychophysically observed L′ and M′ phase shift and variation in the relative L′ and M′ weights may be determined by the MC ganglion cells, with the higher mechanisms simply providing a low-pass filter.
Further physiologica l recordings are needed to test features of the MC cell model. We postulate that the spectral nature of the surround reverses on green versus orange fields. Measurements by Smith et al. (1992) suggest that the cells do have spectral surrounds as postulated in the model for orange adaptation, but green adapting fields need to be tested. We postulate a surround delay of ∼20 ms, which appears somewhat longer than that observed physiologically, for C. Reid & R. M. Shapley (personal communication) measured surround delays in MC cells of 10-18 ms (Stromeyer et al. 1997). Similarly, we observed that on the orange field the L′versusM′ phase shift is nulled near 20 Hz then strongly reverses above 20 Hz; the large delay can explain the reversal point at about 20 Hz (Stromeyer et al. 1997).
The relative strength of the centre and surround is also assumed to be constant up to ∼20 Hz, as is the case in cat X ganglion cells (Enroth-Cugell et al. 1983) and macaque PC ganglion cells (Benardete & Kaplan, 1997). The null in the phase shift near 20 Hz on the orange field cannot simply be explained by a large drop in sensitivity of the spectrally opponent surround, since the surround still strongly controls the relative L′ and M′ weights near 20 Hz (Stromeyer et al. 1997). Our previous results can thus be explained with the assumptions that there is a substantial surround delay and the relative strength of centre and surround are about constant up to at least 20 Hz.
Flicker versus motion
We observed different patterns of temporal response in using the pulsed gratings to measure motion responses and to measure the impulse response functions. For both tasks a clear ‘transient’ biphasic response was observed for M′ patterns on the orange field and L′ patterns on the green field. In measuring the impulse response the patterns were pulsed spatially in phase or antiphase: for these transient signals, positive summation was maximal at 0 SOA and ‘crossed-over’ to become negative at only ∼25 ms SOA. In the motion task, the patterns were pulsed in spatial quadrature: motion was strongest when the two patterns had a relative delay of ∼20 ms and the motion did not ‘cross-over’ or reverse until ∼60 ms SOA.
The temporal differences between these tasks simply reflect the extra delay required to generate a motion signal, since motion involves a processing delay – a difference in temporal response, asymmetrically disposed across the receptive field of the motion detector (Reid et al. 1987). However, Levinson & Sekuler (1975) concluded that both motion and flicker are eventually detected by a direction-selective mechanism.
We previously observed that the L′versusM′ phase shift in LUM was identical when measured with flicker and motion (Stromeyer et al. 1997). The L′versusM′ phase shift should be identical if it arises in the ganglion cells. For example, the phase of the temporal response in cat X ganglion cells is the same for drifting gratings or stationary flickering gratings – this is not surprising because the cells lack direction selectivity (Enroth-Cugell et al. 1983). At low spatial and temporal frequencies which engage the centre and surround, the response phase leads the stimulus (Enroth-Cugell et al. 1983), hence the ensemble of ganglion cells will encode the position of a drifting grating as being ahead of its actual spatial phase position. In one of our motion tasks, direction was judged for a pair of L′ and M′ gratings drifting at the same velocity, but separated in spatial phase (Stromeyer et al. 1997). The L′ and M′ components of the MC ganglion cells may cause differential spatial phase shifts between the encoded spatial representations of the drifting L′ and M′ gratings. The higher motion mechanisms may then simply assess whether the L′ and M′ retinal signals are in synchrony to produce optimal motion summation.
Do the L and M photoreceptors have similar temporal responses?
Several findings argue against the view that the temporal differences of the L′ and M′ signals in LUM reflect properties of the L and M photoreceptors per se. First, there is virtually no L′versusM′ phase shift within the isolated centre of the MC receptive field, and no L′versusM′ phase shift within blue-yellow ganglion cells which respond to the difference of short-wave (S) cones and L-plus-M cones (Smith et al. 1992). In these latter chromatic cells there is also no phase shift between the S signal and the combined L-plus-M signal measured up to 40 Hz (Yeh et al. 1995), although Chichilnisky & Baylor (1999) recording from excised retina found that the S signal may be somewhat advanced relative to the L and M signals. These recordings in general suggest that the three cone types have fairly similar temporal responses, consistent with recordings from single macaque cones (Schnapf et al. 1990). Second, increased light adaptation might speed up the photoreceptor response (Baylor & Hodgkin, 1974). Thus orange fields might be expected to make the L cones relatively faster than M cones; however, the phase shift in LUM is in the opposite direction. Third, chromatic fields which induce large phase shifts in LUM produce no measurable effects in the red-green mechanism, so the phase shift is largely post-receptoral (Stromeyer et al. 1997).
Hamer & Tyler (1992) isolated the human LUM mechanism and concluded that M photoreceptors are faster than L. The main evidence for slower L cones was that the critical fusion frequency (the fastest just-visible flicker) rises more slowly with the mean luminance of a red flickering field than a green flickering field. However, the present results indicate that the field colour itself can influence which cone signal will appear faster in LUM: on the green field the L′ signal may appear faster, on the orange field the M′ signal may appear faster, and on a certain yellow field, the L′ and M′ signals appear essentially indistinguishable. The model of MC cells predicts that these effects are caused by an interaction of the centre and surround responses.
The reduced sensitivity for red flicker observed by Hamer & Tyler may reflect a chromatic effect. Our results show that long-wave backgrounds can suppress the L′ signal – on the orange field, the ratio of L′ to M′ weights decreased with increasing temporal frequency (measured at low spatial frequency). Earlier we isolated the LUM mechanism and observed that high-frequency L′ flicker on a red background became more visible when the red background was replaced by a yellow background that produced an equivalent mean rate of quantal catches in the L cones (Stromeyer et al. 1987). This demonstrates that it is the red background colour which suppresses flicker sensitivity. Pokorny et al. (1994) have shown that MC retinal cells mimic these effects. Thus, the fall-off in high-frequency response for red luminance flicker may reflect properties of the MC cells, not the photoreceptors.
Consequence for studies on human vision
The magnocellular based LUM pathway appears highly plastic, since chromatic adaptation influences the relative temporal phase and relative contrast weights of the L′ to M′ signals, as functions of spatial and temporal frequency. This will cause large changes in psychophysical equiluminant settings as these parameters are varied. The changes clearly do not reflect such factors as the relative number of L and M cones, but are probably caused by an interaction of the centre and surround responses of the MC cells. Fortunately, there is a yellow field for each observer where the relative phase shift and variations in relative contrast weights simply vanish. Our study shows a method for achieving this condition.
Acknowledgments
This research was supported by NIH grants EY11246 and EY01808.
References
- Baylor DA, Hodgkin AL. Changes in time scale and sensitivity in turtle photoreceptors. The Journal of Physiology. 1974;242:729–758. doi: 10.1113/jphysiol.1974.sp010732. [DOI] [PMC free article] [PubMed] [Google Scholar]
- Benardete EA, Kaplan E. The receptive field of the primate P retinal ganglion cells, I: linear dynamics. Visual Neuroscience. 1997;14:169–185. doi: 10.1017/s0952523800008853. [DOI] [PubMed] [Google Scholar]
- Benardete EA, Kaplan E. The dynamics of primate M retinal ganglion cells. Visual Neuroscience. 1999a;16:355–368. doi: 10.1017/s0952523899162151. [DOI] [PubMed] [Google Scholar]
- Benardete EA, Kaplan E. Dynamics of primate P retinal ganglion cells: responses to chromatic and achromatic stimuli. The Journal of Physiology. 1999b;519:775–790. doi: 10.1111/j.1469-7793.1999.0775n.x. [DOI] [PMC free article] [PubMed] [Google Scholar]
- Broekhuijsen M, Rashbass C, Veringa F. The threshold of visual transients. Vision Research. 1976;16:1285–1289. doi: 10.1016/0042-6989(76)90055-9. [DOI] [PubMed] [Google Scholar]
- Cavanagh P, Anstis S. The contribution of color to motion in normal and color-deficient observers. Vision Research. 1991;31:2109–2148. doi: 10.1016/0042-6989(91)90169-6. [DOI] [PubMed] [Google Scholar]
- Chichilnisky EJ, Baylor DA. Receptive-field microstructure of blue-yellow ganglion cells in primate retina. Nature Neuroscience. 1999;2:889–893. doi: 10.1038/13189. [DOI] [PubMed] [Google Scholar]
- Croner LJ, Kaplan E. Receptive fields of P and M ganglion cells across the primate retina. Vision Research. 1995;35:7–24. doi: 10.1016/0042-6989(94)e0066-t. [DOI] [PubMed] [Google Scholar]
- Derrington AM, Lennie P. Spatial and temporal contrast sensitivities of neurones in lateral geniculate nucleus of macaque. The Journal of Physiology. 1984;357:219–240. doi: 10.1113/jphysiol.1984.sp015498. [DOI] [PMC free article] [PubMed] [Google Scholar]
- Eisner A, MacLeod DIA. Flicker photometric study of chromatic adaptation: selective suppression of cone inputs by colored backgrounds. Journal of the Optical Society of America. 1981;71:705–718. doi: 10.1364/josa.71.000705. [DOI] [PubMed] [Google Scholar]
- Enroth-Cugell C, Robson JG. The contrast sensitivity of retinal ganglion cells of the cat. The Journal of Physiology. 1966;187:517–552. doi: 10.1113/jphysiol.1966.sp008107. [DOI] [PMC free article] [PubMed] [Google Scholar]
- Enroth-Cugell C, Robson JG, Schweitzer-Tong DE, Watson AB. Spatio-temporal interactions in cat retinal ganglion cells showing linear spatial summation. The Journal of Physiology. 1983;341:279–307. doi: 10.1113/jphysiol.1983.sp014806. [DOI] [PMC free article] [PubMed] [Google Scholar]
- Hamer RD, Tyler CW. Analysis of visual modulation sensitivity. V. Faster visual response for G- than for R-cone pathway? Journal of the Optical Society of America. 1992;A9:1889–1904. doi: 10.1364/josaa.9.001889. [DOI] [PubMed] [Google Scholar]
- Kremers J, Yeh T, Lee BB. The response of macaque ganglion cells and human observers to heterochromatically modulated lights: the effect of stimulus size. Vision Research. 1994;34:217–221. doi: 10.1016/0042-6989(94)90334-4. [DOI] [PubMed] [Google Scholar]
- Lee BB, Martin PR, Valberg A. The physiological basis of heterochromatic flicker photometry demonstrated in the ganglion cells of the macaque retina. The Journal of Physiology. 1988;404:323–347. doi: 10.1113/jphysiol.1988.sp017292. [DOI] [PMC free article] [PubMed] [Google Scholar]
- Lee B, Pokorny J, Smith VC, Kremers J. Responses to pulses and sinusoids in macaque ganglion cells. Vision Research. 1994;34:3081–3096. doi: 10.1016/0042-6989(94)90074-4. [DOI] [PubMed] [Google Scholar]
- Lee BB, Pokorny J, Smith VC, Martin PR, Valberg A. Luminance and chromatic modulation sensitivity of macaque ganglion cells and human observers. Journal of the Optical Society of America. 1990;A7:2223–2236. doi: 10.1364/josaa.7.002223. [DOI] [PubMed] [Google Scholar]
- Lennie P, Pokorny J, Smith VC. Luminance. Journal of the Optical Society of America. 1993;A10:1283–1293. doi: 10.1364/josaa.10.001283. [DOI] [PubMed] [Google Scholar]
- Levinson E, Sekuler R. The independence of channels in human vision selective for direction of movement. The Journal of Physiology. 1975;250:347–366. doi: 10.1113/jphysiol.1975.sp011058. [DOI] [PMC free article] [PubMed] [Google Scholar]
- Pantle A, Turano K. Visual resolution of motion ambiguity with periodic luminance- and contrast-domain stimuli. Vision Research. 1992;32:2093–2106. doi: 10.1016/0042-6989(92)90071-p. [DOI] [PubMed] [Google Scholar]
- Pokorny J, Smith VC, Lee BB, Yeh T. Temporal sensitivity of macaque ganglion cells to lights of different chromaticities. Investigative Ophthalmology and Visual Science. 1994;35:2126. [Google Scholar]
- Purpura K, Tranchina D, Kaplan E, Shapley RM. Light adaptation in the primate retina: Analysis of changes in gain and dynamics of monkey retinal ganglion cells. Visual Neuroscience. 1990;4:75–93. doi: 10.1017/s0952523800002789. [DOI] [PubMed] [Google Scholar]
- Rashbass C. The visibility of transient changes of luminance. The Journal of Physiology. 1970;210:165–186. doi: 10.1113/jphysiol.1970.sp009202. [DOI] [PMC free article] [PubMed] [Google Scholar]
- Rashbass C. Unification of two contrasting models of the visual increment threshold. Vision Research. 1976;16:1281–1283. doi: 10.1016/0042-6989(76)90054-7. [DOI] [PubMed] [Google Scholar]
- Reid RC, Shapley RM. Spatial structure of cone inputs to receptive fields in primate lateral geniculate nucleus. Nature. 1992;356:716–718. doi: 10.1038/356716a0. [DOI] [PubMed] [Google Scholar]
- Reid RC, Soodak RE, Shapley RM. Linear mechanisms of directional selectivity in simple cells of cat striate cortex. Proceedings of National Academy of Sciences of the USA. 1987;84:8740–8744. doi: 10.1073/pnas.84.23.8740. [DOI] [PMC free article] [PubMed] [Google Scholar]
- Robson JG. Spatial and temporal contrast-sensitivity function of the visual system. Journal of the Optical Society of America. 1966;56:1141–1142. [Google Scholar]
- Schnapf JL, Nunn BJ, Meister M, Baylor DA. Visual transduction in cones of the monkey Macaca Fascicularis. The Journal of Physiology. 1990;427:681–713. doi: 10.1113/jphysiol.1990.sp018193. [DOI] [PMC free article] [PubMed] [Google Scholar]
- Schiller PH, Logothetis NK, Charles ER. Role of the color-opponent and broad-band channels in vision. Visual Neuroscience. 1990;5:321–346. doi: 10.1017/s0952523800000420. [DOI] [PubMed] [Google Scholar]
- Shioiri S, Cavanagh P. ISI produces reverse apparent motion. Vision Research. 1990;30:757–768. doi: 10.1016/0042-6989(90)90101-p. [DOI] [PubMed] [Google Scholar]
- Smith VC, Lee BB, Pokorny J, Martin PR, Valberg A. Responses of macaque ganglion cells to the relative phase of heterochromatically modulated lights. The Journal of Physiology. 1992;458:191–221. doi: 10.1113/jphysiol.1992.sp019413. [DOI] [PMC free article] [PubMed] [Google Scholar]
- Smith VC, Pokorny J. Spectral sensitivity of the foveal cone photopigments between 400 and 500 nm. Vision Research. 1975;15:161–171. doi: 10.1016/0042-6989(75)90203-5. [DOI] [PubMed] [Google Scholar]
- Stockman A, MacLeod DIA, Vivien JA. Isolation of the middle- and long-wavelength-sensitive cones in normal trichromats. Journal of the Optical Society of America. 1993;A10:2471–2490. doi: 10.1364/josaa.10.002471. [DOI] [PubMed] [Google Scholar]
- Stromeyer CF, III, Chaparro A, Tolias AS, Kronauer RE. Colour adaptation modifies the long-wave versus middle-wave cones weights and temporal phases in human luminance (but not red-green) mechanism. The Journal of Physiology. 1997;499:227–254. doi: 10.1113/jphysiol.1997.sp021923. [DOI] [PMC free article] [PubMed] [Google Scholar]
- Stromeyer CF, III, Cole GR, Kronauer RE. Chromatic suppression of cone inputs to the luminance flicker mechanism. Vision Research. 1987;27:1113–1137. doi: 10.1016/0042-6989(87)90026-5. [DOI] [PubMed] [Google Scholar]
- Stromeyer CF, III, Kronauer RE, Ryu A, Chaparro A, Eskew RT., Jr Contributions of human long-wave and middle-wave cones to motion detection. The Journal of Physiology. 1995;485:221–243. doi: 10.1113/jphysiol.1995.sp020726. [DOI] [PMC free article] [PubMed] [Google Scholar]
- Swanson WH, Pokorny J, Smith VC. Effects of chromatic adaptation on phase-dependent sensitivity to heterochromatic flicker. Journal of the Optical Society of America. 1988;A5:1976–1982. doi: 10.1364/josaa.5.001976. [DOI] [PubMed] [Google Scholar]
- Watson AB. Temporal sensitivity. In: Boff KR, Kaufman L, Thomas JP, editors. Handbook of Perception and Human Performance, Sensory Processes and Perception. I. New York: Wiley; 1986. pp. 6.1–6.43. [Google Scholar]
- Watson AB, Nachmias J. Patterns of temporal interaction in the detection of gratings. Vision Research. 1977;17:893–902. doi: 10.1016/0042-6989(77)90063-3. [DOI] [PubMed] [Google Scholar]
- Yeh T, Lee BB, Kremers J. Temporal response of ganglion cells of the macaque retina to cone-specific modulation. Journal of the Optical Society of America. 1995;A12:456–464. doi: 10.1364/josaa.12.000456. [DOI] [PubMed] [Google Scholar]


