

Abstract
We studied the spontaneous discharge variability of thalamocortical somatosensory neurones in the awake cat in order to disclose its possible information content. The presence of slow (0.09–1.39 Hz) regular fluctuations in the discharge rate of these cells during the waking state has been previously reported. Oscillations in a similar frequency range are known to characterize the activity of central and peripheral neurones pertaining to the autonomic nervous system and the variability of heart period (RR interval variability).
A surrogate data test, performed on our database, confirmed the presence of slow (0.05–1 Hz) non-random fluctuations in firing rate.
Linear regression detected the presence of an inverse relationship between the values of RR interval and the concurrent levels of neural discharge.
Frequency domain analysis indicated that a significant coupling between the two variability signals preferentially occurred in two frequency bands: in the frequency of the respiratory sinus arrhythmia and in correspondence with a slower rhythm (0.07–0.3 Hz), the two signals being in phase opposition in most of the cases.
Coherent fluctuations could also be observed when epochs of evoked activity were analysed, while coupling between the two variability signals appeared to be disrupted after sleep onset.
We conclude that RR interval variability, an internally generated dynamic related to basic visceral regulation, is encoded in the discharge of single somatosensory thalamocortical neurones during wakefulness. A possible interaction with the transmission of somatosensory information has to be evaluated.
The discharge properties of thalamocortical somatosensory neurones are mainly studied in the awake animal, on the basis of a stimulus-response protocol. Using this approach, the activity that is time locked to the actual stimulation of the specific peripheral receptor is extracted, while the rest of the discharge (i.e. the spontaneous discharge) cannot be interpreted and some information, possibly encoded, might not be evaluated.
Werner & Mountcastle (1963) have previously described a lack of stationarity in subsequent samples of spontaneous activity recorded from single ventrobasal neurones in the awake monkey. Non-stationarities were eliminated by shuffling the original data into random sequences. Departures from randomness were found to be due to the presence of periodic fluctuations in discharge rate, having a frequency ranging from 0.09 to 1.39 Hz.
These slow periodicities are unlikely to be related to intrinsic membrane properties since, as revealed by numerous studies, thalamocortical cells, during wakefulness, fire tonically on the basis of a steadily depolarized membrane potential (Hirsch et al. 1983; Jahnsen & Llinás, 1984; Steriade & Deschênes, 1984; McCormick & Bal, 1997). Spontaneous periodic changes in the discharge rate of these cells could be due to the effect of an input different from the specific somatosensory one. The source of this input should meet some prerequisites: its activity should be characterized by the presence of slow fluctuations in discharge rate and it should generate slow oscillatory patterns also during the waking state.
Slow rhythmic fluctuations (< 1 Hz) characterize the firing pattern of neurones pertaining to the autonomic nervous system. Lambertz & Langhorst (1998) detected the presence of slow oscillations in the impulse activity recorded from units located in the reticular formation and different brainstem nuclei. Such oscillations were coherent with those present in the variability of efferent sympathetic discharge and of cardiovascular signals such as heart period and arterial pressure. In view of this the reticular formation has been considered as part of a ‘common brainstem system’, provided with ascending and descending projections and integrating the regulation of somatic and visceral functions (Schulz et al. 1983, 1985; Langhorst et al. 1996). Fluctuations in discharge rate have been recorded in specific brainstem nuclei involved in cardiovascular regulation (Montano et al. 1996) and in the activity of sympathetic fibres projecting to the heart (Montano et al. 1992). Similar oscillations have been detected in muscle sympathetic nerve activity recorded in awake human subjects (Pagani et al. 1997). These neural oscillations are coherent with the rhythms observable in the variability of heart period. In particular, spectral analysis of heart rate variability has been widely used as a tool to assess indirectly the state of sympathetic and parasympathetic neural modulations to the sinus node (Malliani et al. 1991).
The aim of our study was to assess whether the rate fluctuations detectable in thalamic somatosensory spontaneous discharge could be related to an oscillatory input coming from structures pertaining to the autonomic nervous organization. Therefore, using linear regression and frequency domain analysis (via coherence and phase functions) we evaluated the possible relationships existing between heart rate (expressed as its reciprocal – the RR interval) and the discharge of single ventroposterior thalamocortical neurones in the awake cat.
METHODS
Surgical procedure and signal recording
Experiments were carried out on four adult cats (2.8-4.2 kg). Animals were chronically implanted. Care and handling of animals was in accordance with international guidelines (NIH) and approved by the Animal Care Commitee of the University of Milan.
In order to obtain head fixation without pressure or pain during the subsequent recording sessions, two nylon cylinders, fitted to the stereotaxic bars, were cemented to the skull while the animal was anaesthetized with ketamine (15 mg kg−1i.m.) followed by barbiturate anaesthesia (Somnotol 35 mg kg−1i.p.). Craniotomy was performed in the right parietal skull, to allow a stereotaxic approach to the ventroposterolateral (VPL) and the ventroposteromedial (VPM) thalamic nuclei. The hole was then temporarily closed with bone wax. Four screws were inserted in the frontal and parietal bone on both sides of the head for EEG recording and attached to a connector.
Animals were allowed to recover for three weeks and were then habituated to the stereotaxic frame. During the recording sessions, tungsten microelectrodes (9 to 12 MΩ resistance) were lowered stereotaxically (A 8.5/9.8; L 3/7.8; H +3/−1.5) to reach and record thalamic units, extracellularly. Needles for ECG recording were inserted subcutaneously. Respiratory rate was measured using a strain-gauge transducer connected to a small mask that was adjusted and placed a few millimetres in front of the nostrils of the cat. This signal was not calibrated and reflected only the rate of respiration and not the respiratory activity.
A brief puff of air on the animal's hair was used to stimulate the peripheral receptive field of the recorded neurone. Stimuli, with a mean duration of 15 ms and a peak pressure of 6.5 g cm2, at a frequency of 1.5 Hz, were delivered on left limbs, neck and head. Electrophysiological identification of ventroposterior (VP) units was obtained by displaying on-line post-stimulus histograms (PSTH; 1 ms bin) (Fig. 1A; Mariotti & Formenti, 1990). Both spontaneous and evoked neuronal activity were recorded during wakefulness and, in some cases, after sleep onset. Activity of 10 to 15 min was recorded for each neurone. At the end of the experimental cycle, animals were given a lethal dose of Nembutal (100 mg kg−1).
Figure 1. Criteria for database selection.
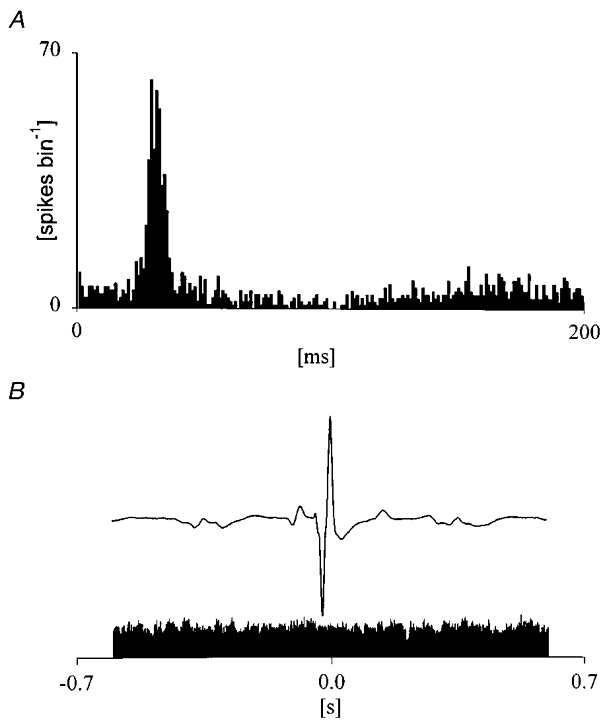
A, typical response of a ventroposterior thalamic neurone following 100 repeated stimulations of the hairy skin (bin width 1 ms). B, peri-trigger histogram on R wave of the QRS of ECG complex performed on 600 beats. Mean ECG (upper trace) and discharge distribution (bin width 1 ms; lower trace) do not show relationships between neural firing and the heart beat.
Signal preprocessing
All signals were stored on tape and off-line A/D converted with a sampling frequency of 18 kHz. Neural activity was then retrieved and visually inspected; only neurones with a high and stable signal-to-noise ratio were selected.
Peri-trigger histograms on R wave of the electrocardiogram (ECG) were calculated for all neurones in order to detect the presence of heart beat related spiking, which may reflect artifacts resulting from pulsatile movement (Fig. 1B). Neurones whose discharge was correlated to the heart beat were thus excluded from further analysis.
Visual scoring of EEG and neural discharge, together with interspike interval histograms, were used to select periods of tonic discharge-low voltage EEG and periods of burst discharge-high voltage EEG.
Time series extraction
The ECG signal was compressed to 600 Hz, QRS complexes were automatically detected using a threshold derivative algorithm and the time occurring between each R wave was calculated in order to obtain a time series of RR interval variability (tachogram).
The respiratory signal was compressed to 600 Hz and sampled once per cardiac beat.
Spikes from VP were discriminated by means of a digital threshold and were counted on a 20 ms time basis producing a step-wise signal (the counted VP) with levels proportional to the number of detected spikes. The counted signal was compressed to 600 Hz and low-pass filtered at 1 Hz with a finite impulse response (FIR) filter (2400 coefficients, Hanning windowed). The filtered neuronal signal was then sampled once per cardiac beat giving a beat-to-beat time series of neural discharge variability (neurogram) synchronous with the tachogram.
The tachogram and the neurogram of each neurone were superimposed and visually inspected. Stable segments of about 250 beats were selected for further analysis. The criteria for stability were the absence of artifacts in the series due to error in R wave detection and the absence of transients due to sudden increases or decreases in neuronal firing or very slow trends in the mean values of RR interval and discharge rate. Series smaller than 250 samples did not allow reliable detection of oscillations with a frequency lower than 0.05 Hz (considering a maximum heart rate of 3 Hz).
Data analysis
Linear correlation
Linear regression in the plane (VP(i), RR(i)) was performed to assess the type and degree of correlation between the tachograms and neurograms. A direct relationship (positive changes in RR interval determine positive variations in VP) was detected by a positive slope (a > 0). An inverse relationship was found when a is negative. The strength of the relationship was quantified by the correlation coefficient r. Signals were considered significantly correlated for P < 0.01.
Power spectral density estimation
Power spectral analysis was utilized to assess the power and the frequency of the oscillations present in the beat-to-beat variability signals of RR interval and VP. A beat-to-beat series x= (x(i)), where i is the progressive cardiac beat, is described as an autoregressive (AR) process (Kay & Marple 1981):
| (1) |
where ak are the coefficients of the model and e(i) is a white noise with zero mean and variance λ2. The identification of the p coefficients ak and of the variance λ2 of the white noise e(i) was performed by Levinson-Durbin recursion (Kay & Marple, 1981) and the model order p was chosen according to the Akaike figure of merit (Akaike, 1974). The power spectral decomposition (PSD) procedure (Baselli et al. 1997) allowed us to decompose the PSD in a sum of spectral peaks and to calculate power and central frequency of these peaks.
Surrogate data approach
In order to assess if the beat-to-beat neural discharge variability series is a coloured process (i.e. it is different from a white noise) a surrogate data test was performed. The counted VP signal was shuffled by randomizing the levels representing the number of spikes found in 20 ms. Ten different surrogate realizations of the same original signal were obtained by changing the random sequence utilized to shuffle. The surrogate signals are processed like the original series to derive the beat-to-beat series of the VP discharge. The power of the oscillations evaluated in the original series was compared with the power found in the surrogate series. Rhythmicity in a given frequency band was considered significant if the power in the original series was larger than the mean power plus two times the standard deviation calculated in the surrogate data (Fig. 3) (Theiler et al. 1985).
Figure 3. Surrogate data test performed on the variability of neural discharge.
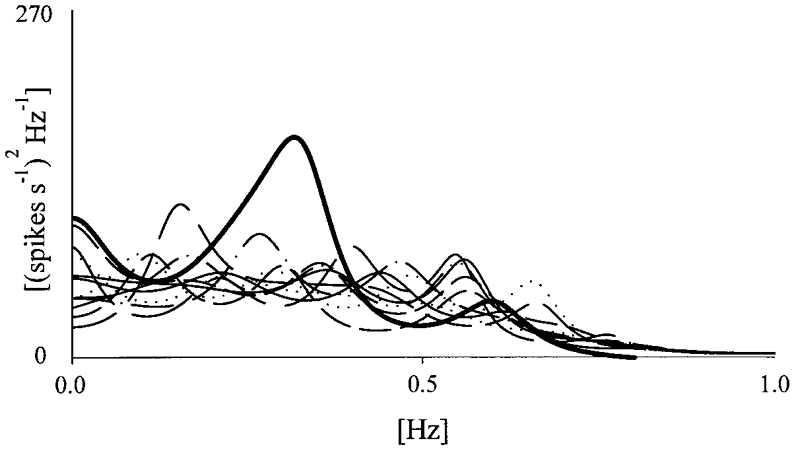
Example of surrogate-data analysis. Spectra performed on the neurogram (300 beats length) extracted from the real signal (thick line) and from the time series derived from ten different surrogate realizations of the same signal (dotted lines). The spectrum of the original signal met the criteria for a coloured process.
Phase relationship and coherence function estimation
The analysis of the relationships between RR interval and VP was performed via calculation of the phase relationship and coherence function. The linear relationship between two beat-to-beat variability series x= (x(i)) and y= (y(i)) are described by a bivariate AR process (Morf et al. 1985):
| (2) |
| (3) |
where a11k, a12k, a21k, a22k are the coefficients of the bivariate AR process setting the influences of several past values on the current one and the effects of one signal on the other one. The joint process v=|x y| can be seen as the output of the 2 × 2 transfer matrix H(z) with elements:
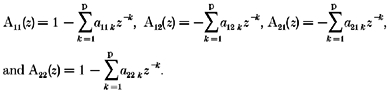 |
After identification of the coefficients of the bivariate model via the least squared method (Baselli et al. 1997), the cross-spectrum Sxy(f) was obtained as the non-diagonal terms of the matrix:
| (4) |
where H′(z−1) is the transpose of H(z−1) and Λ2 is the variance matrix of the joint process e=|e1e2|. The phase relationship is the phase of the cross-spectrum Sxy(f), where x leads for positive phase values. The squared coherence function k2(f) is obtained by normalizing the squared modulus of the cross-spectrum by the product of the two spectra Sx(f) and Sy(f). The coherence function ranges from 0 to 1 and measures the degree of linear correlation between two oscillations found in the two signals at the same frequency. A k2(f) > 0.5 was considered significant (De Boer et al. 1985). Phase values were evaluated only in correspondence with significant coherence values.
RESULTS
One hundred and twenty-seven of the recorded neurones were selected for analysis. Neurones included in our database displayed in the PSTHs a typical response to hairy skin receptor stimulation. The response was characterized by a peak of facilitation (with latency around 20 ms) followed by a reduction of cell discharge, lasting about 60–120 ms (Mariotti & Formenti, 1990) as shown in Fig. 1A. None of the selected neurones showed the presence of spikes in phase with the QRS complexes of the ECG. Mean frequency of spontaneous tonic firing during wakefulness was 26.9 Hz (s.e.m.± 1.9).
Linear regression between neural discharge and RR interval
The time series extracted from the 127 neurones were analysed in terms of their relationship to RR interval using a linear regression. For 108 cells (85 %) the slope (a) of the regression line was negative, indicating an impulse activity increasing with the decrease of RR interval. The discharge of 46 neurones (33 %) displayed a significant correlation (P < 0.01) with the RR interval (Fig. 2).
Figure 2. Linear regression between RR interval and neural discharge variability.
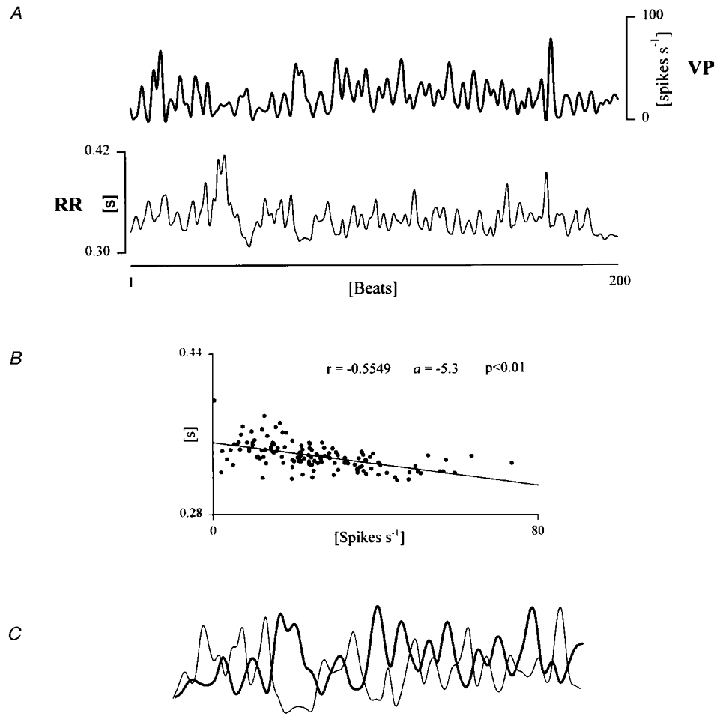
A, example of time series of RR interval (thin line) and VP spontaneous discharge (thick line) in awake conditions. B, linear regression analysis is performed on the same period. Notice that the slope of the regression line is negative (a= -5.3) indicating an increased neural firing associated with shorter RR intervals and vice versa. C, smaller parts of the segments on which linear regression has been performed are superimposed in order to visually inspect the reciprocal relationships between the two variability signals.
Frequency domain analysis
According to the surrogate data test, epochs characterized by non-random fluctuations (below 1 Hz) during wakefulness were found in 94 neurones out of the 127 (Fig. 3).
Spectral analysis of RR interval variability revealed the presence of two major oscillatory components, the higher one being synchronous with the dominant oscillation detectable in the spectral profile of the respiratory signal. In our experiments respiratory rate varied between 0.3 and 0.85 Hz. We termed ‘respiratory-related fluctuation’ (RRF) the high frequency peak and ‘non-respiratory-related fluctuation’ (NRRF) the lower frequency one (Fig. 4). Cross-spectral analysis between RR interval and neuronal discharge variability revealed a significant coherence (K2 > 0.5) in at least one of the above frequency bands in 53 out of the 94 (56 %) neurones that passed the surrogate data test. In 37 out of these 53 cases (70 %) coherence was significant in the RRF band (Fig. 5A), and in 16 cases in the NRRF band (30 %) (Fig. 5B). In 12 cases coherence was simultaneously detectable in both bands.
Figure 4. Spectral components of RR interval, neural discharge variability and respiration.
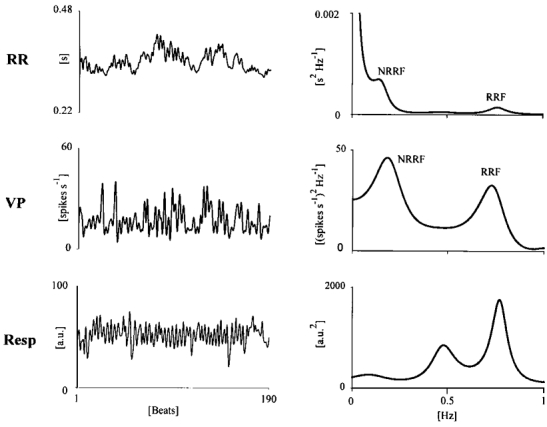
Time series of RR interval, VP spontaneous discharge and respiration (Resp; left panels) and their variability spectra (right panels). Two oscillatory components are detectable in RR and VP spectra, the higher frequency ones being centred around the major respiratory frequency peak. We termed as respiratory-related frequency (RRF) the spectral components synchronous with respiration and as non-respiratory-related frequency (NRRF) the lower frequency component.
Figure 5. Coherence and phase function between RR interval and neural discharge variability.
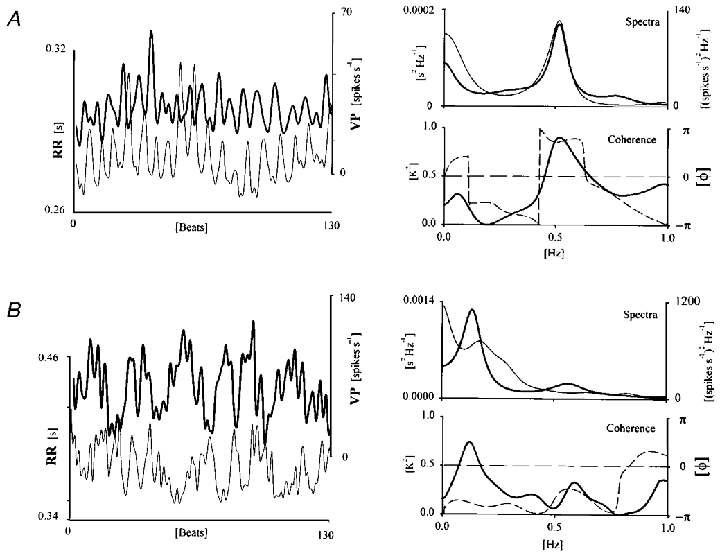
A, time series of RR interval (thin line) and VP spontaneous discharge (thick line; left traces). The spectra of both signals are overplotted (upper right panel). A major respiratory related component (RRF) can be detected. A significant coherence (K2) and opposition of phase (dashed line) is detected within this band (lower right panel). B, same as in A, but here spectral power is concentrated in the range of the non-respiratory-related frequency (NRRF).
Neurograms and tachograms were, in all but three cases, in phase opposition for significant levels of coherence in the RRF band (Fig. 5A). This was the case in only nine out of 16 neurones (56 %) exhibiting coherent fluctuations in the NRRF band (Fig. 5B).
Correlation during evoked activity
We also analysed epochs of neural activity evoked by air-puff stimulation delivered at a frequency of 1.5 Hz. In these cases the low-pass FIR filter was set at 2 Hz in order to include the stimulation rate in the spectral frequency range. The effect of the rhythmic stimulation of the peripheral receptors was clearly visible in the spectral profile, as a narrow peak centred around 1.5 Hz (Fig. 6). Lower frequencies were also present, being coherent with the oscillatory components detectable in the RR variability spectra in nine out of 17 neurones (Fig. 6).
Figure 6. Spectral analysis and coherence during evoked activity.
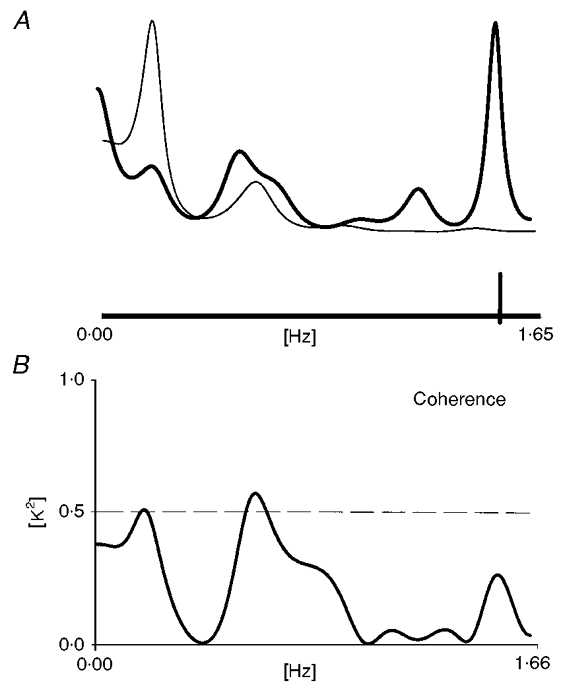
A, the RR interval variability spectrum (thin line) and the VP discharge variability spectrum (thick line), during evoked activity, are superimposed. On the discharge variability spectra, a narrow peak, synchronous with the stimulation rate (indicated on the abscissa by a vertical bar) is observable. Slower components, in the same frequency range as those present in RR interval variability, are simultaneously present. B, cross-spectral analysis, detects the presence of coherent oscillations in the range 0–1 Hz.
Correlation after sleep onset
The activity of five neurones displaying fluctuations coherent with RR interval oscillations during wakefulness was analysed also during sleep. In correspondence with a marked EEG synchronization, tonic firing was replaced by burst discharge. A narrow peak after 3–5 ms was observable in the interspike interval histogram. All neurones passed the surrogate data test displaying a coloured spectral profile with oscillatory components below 1 Hz. During sleep, the spectra of both tachogram and neurogram were characterized by a peak in the RRF range. Despite the presence of a very similar spectral profile on both signals, coherence decreased below the level of significance (K2 < 0.5) in all cases (Fig. 7).
Figure 7. Spectral analysis and coherence after sleep onset.
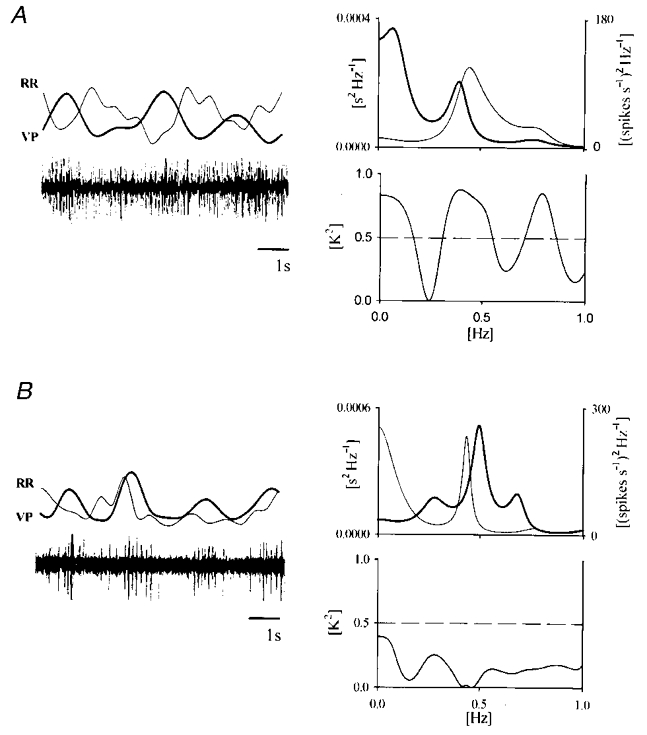
Spectral analysis and coherence are calculated over 250 beats epochs before (A) and after (B) slow-wave sleep onset. Small segments of RR and VP variability series (20 beats length) are superimposed and raw (compressed) VP signal is depicted below (left panels). A, tonic discharge and the reciprocal relationship between the two variability signals are visually detectable during wakefulness. B, burst discharge and no reciprocal fluctuations are observable during sleep: spectral analysis shows similar oscillatory components (RRF band) on the two signals during both wakefulness (A, right panels) and sleep (B, right panels) while coherence, after sleep onset, is lost.
DISCUSSION
The finding of Werner & Mountcastle (1963) has been confirmed by the surrogate data analysis we performed on our database. Indeed, we found a high proportion of neurones (around 70 %) displaying coloured spectra in the 0.05-1 Hz frequency range during wakefulness.
Oscillations in a similar range are known to be present in the central and peripheral discharge variability of autonomic neurones and fibres (Langhorst et al. 1986; Malliani et al. 1991; Montano et al. 1992, 1996; Pagani et al. 1997; Lambertz & Langhorst, 1998) and in the variability of RR interval. Numerous studies have already reported the presence of two major oscillatory components in the short term RR interval and arterial pressure variabilities both in humans and animals (Malliani et al. 1991). The higher frequency oscillation, the so-called ‘respiratory sinus arrhythmia’, represents the neurally mediated effect of respiration on sinus node pacemaker activity. This fluctuation is due to the alternating of relative tachycardia and bradycardia associated with the inspiratory and expiratory phases of the respiratory cycle, respectively. The low frequency rhythm, on the other hand, is synchronous with arterial pressure vasomotor waves (Mayer waves) and has been attributed to the effect of a sympathetic excitatory modulation (Preiss & Polosa, 1974; Malliani, 1999). In our approach, RR interval variability, an internally generated dynamic, was used as a reference in an effort to interpret the spike sequences giving rise to the intersample variability detectable in VP neurones firing. These sequences are present in the spontaneous discharge, and they probably fall into the noise band of the discharge distribution histogram when a specific external sensory stimulus is used as a trigger.
In our procedure the neuronal signal was counted, low-pass filtered with a cut-off at 1 Hz and sampled in correspondence with each cardiac beat in order to enhance the variability in the explored frequency range and obtain a synchronous time scale with RR interval series.
A first unexpected finding was a strong correlation, independent of the temporal sequence of the samples revealed by linear regression, between each pair of RR interval and neuronal discharge values. In one third of the neurones the level of significance was maintained for periods of at least 200 beats. Moreover, in 85 % of all analysed neurones the slope of the regression line was negative (Fig. 2B) indicating that higher levels of neuronal firing were associated with shorter RR intervals and vice- versa. This inverse correlation was not due to transient events since epochs including very slow trends, possibly related to shifts in the state of vigilance, or step changes in the series due to movements or sudden arousals, were rejected. Even a simple visual inspection of the two superimposed series reveals the presence of repetitive reciprocal variations as exemplified in Fig. 2C.
Analysis in the frequency domain indicated that a significant coupling between RR interval and neuronal discharge variability preferentially occurred in particular frequency bands. Half of the neurones displaying coloured spectra were coherent with the RR series, and in 70 % of those cells coherence was above 0.5 in the RRF band, corresponding to the respiratory sinus arrhythmia. This was true even when longer epochs (more than 600 beats) were analysed. In almost all cases, opposition of phase between the two variability signals was observed indicating an increase in neural firing in correspondence with the inspiratory tachycardia (Fig. 5A).
In contrast to our results, Werner & Mountcastle (1963) found no relationship between the fluctuations in neural discharge rate and respiration, butunder quite different conditions since, in their experiments, artificial ventilation was performed on paralysed animals. On the other hand, Chen et al. (1992) detected, in neurones of the medial thalamus, the presence of increased firing rate related to the inspiratory phase of integrated phrenic nerve activity for high levels of respiratory drive. This modulation of thalamic neural firing was not necessarily coupled to the artificial ventilation-related rhythm being instead the reflection of the central neural respiratory activity. A respiratory-modulated discharge was also observed in neurones located in the midbrain (Chen et al. 1991). We suggest that the RRF observable in our VP neurones consistently reflects a widespread representation of the central neural respiratory pattern. Since our neurones were identified as responsive to stimulation of hairy skin peripheral receptors located on the limbs and head it is unlikely that they were affected, through specific receptors and pathways, by chest wall movements. Morover, increases in discharge rate related to inspiration have been observed in other strucures above the brainstem level such as the amygdala in awake humans and cats (Zhang et al. 1986; Frysinger & Harper, 1988).
Coupling between neuronal discharge and RR interval variability was not limited to the respiratory band, coherence being above the level of significance also in the lower part of the spectra (Fig. 5B). The NRRF band ranged from 0.07 to 0.3 Hz in our experiments. Rhythms in this frequency range have been observed by Langhorst in different regions of the brainstem, coherent with cardiovascular variability (Langhorst et al. 1986; Lambertz & Langhorst, 1998). Similar fluctuations in discharge rate, with a periodicity around 11 s, were reported by Oakson & Steriade (1982) in the midbrain reticular formation of the cat during both sleep and wakefulness.
Our animals were not distressed during fixation in the stereotaxic apparatus; cortical EEG was indeed normal and they often fell asleep while in the apparatus. In five cases we could follow the changes in the degree of correlation between neuronal activity and RR interval variability also after sleep onset. As expected, a shift from tonic mode to burst discharge was observed in all VP neurones. Despite the persistence of coloured spectra (< 1 Hz) in neuronal discharge, a significant coherence with the RR variability series was no longer detectable (Fig. 7). In this respect, a slow cortically generated oscillation has recently been characterized both at the EEG and intracellular level in anaesthetized and naturally sleeping cats (Steriade et al. 1993). The slow cortical depolarizing-hyperpolarizing cycle is transmitted to thalamic reticular and relay neurones and is able to trigger and synchronize the activity of thalamo-cortical neurones. The slight fluctuations in discharge rate related to cardiovascular variability observable during wakefulness in VP neurones could be disrupted, after sleep onset, by the powerful effect of a highly synchronized cortically generated oscillation competing for the same frequency range.
The major finding of our study is that the spontaneous tonic firing of thalamocortical somatosensory neurones is not randomly distributed, having instead an information content. Indeed, during wakefulness, part of the discharge rate fluctuations of these cells is tightly coupled to the variability of RR interval, which contains information related to the autonomic regulation of cardiovascular function. Moreover, spectral analysis performed on epochs of evoked discharge detected the presence of a stimulus-related oscillation, together with slower fluctuations coherent with those present in RR interval variability. This variability is internally generated and appeared to be relayed by thalamocortical somatosensory neurones to the cortex, together with information conveyed by specific receptors and pathways from the external environment. Apart from a few studies in the field of psychophysiology (Nakayama & Hori, 1966), some electrophysiological evidence suggests an effect exherted by vegetative correlates on somatosensory transmission. For example, respiratory-related modifications have been reported in cutaneously evoked cortical potentials of man and cats (Shimamura & Mori, 1982), while it has been observed that chemoreceptor stimulation is capable of reducing the latency and increasing the probability of discharge of somatosensory thalamocortical neurones in response to forepaw stimulation in the anaesthetized rat (Angel & Harris, 1998).
In conclusion, these results provide evidence that RR interval variability is encoded in the spontaneous discharge of thalamic somatosensory neurones. The presence of an impulse activity related to internal basic visceral regulation, within a neural system, characterized by a very high spatio-temporally defined coding of external inputs, raises the question whether it may represent a continuous rhythmic input integrating and/or modulating the transmission of the somatosensory information to the cortex or whether it is just an interference phenomenon.
Acknowledgments
We gratefully acknowledge Renato Calcaterra for his helpful technical assistance and Marzia Martina and Mario Rosanova for their highly valued collaborative work.
References
- Akaike H. A new look at the statistical novel identification. IEEE Transactions on Autonomic Control. 1974;19:716–723. [Google Scholar]
- Angel A, Harris MC. The effect of chemoreceptor stimulation on the centripetal transfer of somatosensory information in the urethane-anaesthetized rat. Neuroscience. 1998;86:321–335. doi: 10.1016/s0306-4522(97)00633-7. [DOI] [PubMed] [Google Scholar]
- Baselli G, Porta A, Rimoldi O, Pagani M, Cerutti S. Spectral decomposition in multichannel recordings based on multivariate parametric identification. IEEE Transactions on Biomedical Engineering. 1997;44:1092–1101. doi: 10.1109/10.641336. [DOI] [PubMed] [Google Scholar]
- Chen Z, Eldridge FL, Wagner P. Respiratory-associated rhythmic firing of midbrain neurones in cats: relation to the level of respiratory drive. The Journal of Physiology. 1991;437:305–325. doi: 10.1113/jphysiol.1991.sp018597. [DOI] [PMC free article] [PubMed] [Google Scholar]
- Chen Z, Eldridge FL, Wagner P. Respiratory-associated thalamic activity is related to level of respiratory drive. Respiration Physiology. 1992;90:99–113. doi: 10.1016/0034-5687(92)90137-l. [DOI] [PubMed] [Google Scholar]
- De Boer JM, Karemaker M, Strackee J. Relationships between short-term blood pressure fluctuations and heart rate variability in resting subjects. Medical and Biological Engineering and Computing. 1985;23:352–358. doi: 10.1007/BF02441589. [DOI] [PubMed] [Google Scholar]
- Frysinger R, Harper RM. Cardiac and respiratory correlations with unit discharge in human amygdala and hippocampus. Electroencephalography and Clinical Neurophysiology. 1989;72:463–470. doi: 10.1016/0013-4694(89)90222-8. [DOI] [PubMed] [Google Scholar]
- Hirsch JC, Fourment A, Marc ME. Sleep-related variations of membrane potential in the lateral geniculate body relay neurones of the cat. Brain Research. 1983;259:308–312. doi: 10.1016/0006-8993(83)91264-7. [DOI] [PubMed] [Google Scholar]
- Jahnsen H, Llinás R. Electrophysiological properties of guinea-pig thalamic neurones: an in vitro study. The Journal of Physiology. 1984;349:205–206. doi: 10.1113/jphysiol.1984.sp015153. [DOI] [PMC free article] [PubMed] [Google Scholar]
- Kay SM, Marple SL. Spectrum analysis: a modern perspective. Proceedings of IEEE. 1981;69:1380–1418. [Google Scholar]
- Lambertz M, Langhorst P. Simultaneous changes of rhythmic organization in brainstem neurons, respiration, cardiovascular system and EEG between 0.05 Hz and 0.5 Hz. Journal of the Autonomic Nervous System. 1998;68:58–77. doi: 10.1016/s0165-1838(97)00126-4. [DOI] [PubMed] [Google Scholar]
- Langhorst P, Lambertz M, Shulz G. Assessment of rhythmicity in the visceral nervous system. In: Lown B, Malliani A, Prosdocimi M, editors. Neural Mechanisms and Cardiovascular Diseases. Padova: Liviana Press; 1986. pp. 133–144. [Google Scholar]
- Langhorst P, Schulz G, Seller H, Koepchen HP. Convergence of visceral and somatic afferents on single neurones in the reticular formation of the lower brainstem. Journal of the Autonomic Nervous System. 1996;57:149–157. doi: 10.1016/0165-1838(95)00132-8. [DOI] [PubMed] [Google Scholar]
- McCormick DA, Bal T. Sleep and arousal: thalamocortical mechanisms. Annual Review of Neurosciences. 1997;20:185–215. doi: 10.1146/annurev.neuro.20.1.185. [DOI] [PubMed] [Google Scholar]
- Malliani A. The pattern of sympathovagal balance explored in the frequency domain. News in Physiological Sciences. 1999;14:111–117. doi: 10.1152/physiologyonline.1999.14.3.111. [DOI] [PubMed] [Google Scholar]
- Malliani A, Pagani M, Lombardi F, Cerutti S. Cardiovascular neural regulation explored in the frequency domain. Circulation. 1991;84:482–492. doi: 10.1161/01.cir.84.2.482. [DOI] [PubMed] [Google Scholar]
- Mariotti M, Formenti A. Somatosensory transmission through the ventroposterolateral thalamic nucleus during wake and sleep. In: Mancia M, Marini G, editors. The Dyencephalon and Sleep. New York: Raven Press Ltd; 1990. pp. 301–311. [Google Scholar]
- Montano N, Gnecchi-Ruscone T, Porta A, Lombardi F, Malliani A, Barman SM. Presence of vasomotor and respiratory rhythms in the discharge of single medullary neurons involved in the regulation of the cardiovascular system. Journal of the Autonomic Nervous System. 1996;57:116–122. doi: 10.1016/0165-1838(95)00113-1. [DOI] [PubMed] [Google Scholar]
- Montano N, Lombardi F, Gnecchi-Ruscone T, Contini M, Finocchiaro ML, Baselli G, Porta A, Cerutti S, Malliani M. Spectral analysis of sympathetic discharge, RR interval, and systolic arterial pressure in decerebrate cats. Journal of the Autonomic Nervous System. 1992;40:21–32. doi: 10.1016/0165-1838(92)90222-3. [DOI] [PubMed] [Google Scholar]
- Morf A, Viera TL, Kailath T. Recursive multichannel maximum entropy spectral estimates in the study of electrical brain activity. Biological Cybernetics. 1985;51:239–247. doi: 10.1007/BF00337149. [DOI] [PubMed] [Google Scholar]
- Oakson G, Steriade M. Slow rhythmic rate fluctuation of cat midbrain reticular neurons in syncronized sleep and waking. Brain Research. 1982;247:277–288. doi: 10.1016/0006-8993(82)91252-5. [DOI] [PubMed] [Google Scholar]
- Nakayama T, Hori T. Cortical evoked potential and subjective sensation to electric stimulation of the skin: effects of posture and respiratory movement. Japanese Journal of Physiology. 1966;16:612–624. doi: 10.2170/jjphysiol.16.612. [DOI] [PubMed] [Google Scholar]
- Pagani M, Montano N, Porta A, Malliani A, Abboud FM, Birkett CL, Somers VK. Relationship between spectral components of cardiovascular variabilities and direct measures of muscle sympathetic nerve activity in humans. Circulation. 1997;95:1441–1448. doi: 10.1161/01.cir.95.6.1441. [DOI] [PubMed] [Google Scholar]
- Preiss G, Polosa C. Patterns of sympathetic neuron activity associated with Mayer waves. American Journal of Physiology. 1974;226:724–730. doi: 10.1152/ajplegacy.1974.226.3.724. [DOI] [PubMed] [Google Scholar]
- Schulz B, Lamberts M, Schulz G, Langhorst P. Reticular formation of the lower brainstem. A common system for cardiorespiratory and somatomotor functions: discharge patterns of neighboring neurons influenced by somatosensory afferents. Journal the of Autonomic Nervous System. 1983;9:433–449. doi: 10.1016/0165-1838(83)90006-1. [DOI] [PubMed] [Google Scholar]
- Schulz B, Lamberts M, Schulz G, Langhorst P. Reticular formation of the lower brainstem. A common system for cardiorespiratory and somatomotor functions. Cross-correlation analysis of discharge patterns of neighboring neurons. Journal of the Autonomic Nervous System. 1985;12:35–62. doi: 10.1016/0165-1838(85)90039-6. [DOI] [PubMed] [Google Scholar]
- Shimamura M, Mori A. Sensory evoked potentials and their changes with respiration in mnd cat. Electroencephalography and Clinical Neurophysiology. 1982;(suppl. 36):297–304. [PubMed] [Google Scholar]
- Steriade M, Contreras D, Curro' Dossi D, Nuñez A. The slow (< 1 Hz) oscillation in reticular thalamic and thalamocortical neurons: scenario of sleep rhythm generation in interacting thalamic and neocortical networks. Journal of Neuroscience. 1993;13:3284–3299. doi: 10.1523/JNEUROSCI.13-08-03284.1993. [DOI] [PMC free article] [PubMed] [Google Scholar]
- Steriade M, Deschênes M. The thalamus as a neuronal oscillator. Brain Research Reviews. 1984;8:1–63. doi: 10.1016/0165-0173(84)90017-1. [DOI] [PubMed] [Google Scholar]
- Theiler A, Eubank S, Longtin A, Galdrikian J. Testing for nonlinearity in time series: the method of surrogate data. Physica. 1992;58:239–247. [Google Scholar]
- Werner G, Mountcastle VB. The variability of central neural activity in a sensory system, and its implications for the central reflection of sensory events. Journal of Neurophysiology. 1963;26:958–977. doi: 10.1152/jn.1963.26.6.958. [DOI] [PubMed] [Google Scholar]
- Zhang J, Harper RM, Frysinger C. Respiratory modulation of neuronal discharge in the central nucleus of the amygdala during sleep and waking state. Experimental Neurology. 1986;91:193–207. doi: 10.1016/0014-4886(86)90037-3. [DOI] [PubMed] [Google Scholar]