Abstract
In secretory epithelial cells, complex patterns of Ca2+ signals regulate physiological processes. How these patterns are generated is still not fully understood. In particular, the basis of global Ca2+ waves is not clear.
We have studied regional differences in InsP3-evoked Ca2+ release in single mouse pancreatic acinar cells, using high-speed (∼90 frames s−1), high-sensitivity Ca2+ imaging combined with rapid (10 ms) spot photolysis (2 μm diameter) of caged InsP3. Within a single region we measured Ca2+ response latency and rate of rise to construct an InsP3 dose-response relationship.
Spot InsP3 liberation in the secretory pole region consistently elicited a dose-dependent, rapid release of Ca2+.
Spot InsP3 liberation in the basal pole region of ∼50 % of cells elicited a similar dose-response relationship but with a lower apparent InsP3 affinity than in the secretory pole. In the other cells, basal pole InsP3 liberation did not elicit active Ca2+ release, even at the highest stimulus intensities we employed, although these same cells did respond when the stimulus spot was moved to different regions.
We conclude that in the basal pole active sites of rapid Ca2+ release have a lower functional affinity for InsP3 than those in the secretory pole and are spread out in discrete sites across the basal pole. These properties explain the propagation of Ca2+ waves across the basal pole that are only observed at higher stimulus levels.
In secretory epithelial cells, agonists evoke complex Ca2+ responses (Kasai & Augustine, 1990; Toescu et al. 1992; Thorn et al. 1993) thought to be important in cell physiology (Petersen, 1992; Thorn, 1996). These responses include local Ca2+ release within the secretory (apical) pole region and, at higher stimulus intensities, global Ca2+ waves and oscillations that are initiated in the secretory pole and then spread as a wave across the cell to the basal pole (Kasai & Augustine, 1990; Toescu et al. 1992; Nathanson et al. 1992; Kasai et al. 1993; Thorn et al. 1993; Lee et al. 1997). The local Ca2+ signal in the secretory pole has now been shown to be due to the co-ordinated activity of a cluster of smaller elementary Ca2+ spikes (Thorn et al. 1996; Kidd et al. 1999; Fogarty et al. 2000). The basis of these local spikes appears to be the regional location of InsP3 receptors, which have been immunolocalized to the secretory pole (Lee et al. 1997; Yule et al. 1997). The question that now arises is what is the basis of the global Ca2+ signal observed in these cells. We still have no direct evidence of the mechanisms of Ca2+ release that are present in the basal pole that might be recruited during a global Ca2+ wave. The aim of this paper is to provide an insight into the basal pole Ca2+ signal.
Functional evidence indicates that the basal pole region is capable of an active Ca2+ response (Kasai et al. 1993; Thorn et al. 1993), suggesting that Ca2+ release sites are present. However, immunological staining for InsP3 receptors suggests a low density of receptors in this region of the cell (Lee et al. 1997; Yule et al. 1997). Furthermore, studies aimed at characterizing the basal pole response (Toescu et al. 1994; van de Put & Elliott, 1996; Ito et al. 1999) have been hampered by the fact that the global signal is always initiated in the secretory pole. This means that it has been impossible to study the basal pole signal in isolation, as it is always contaminated by the Ca2+ released from the secretory pole. To overcome this problem, and to study the basal pole signal in isolation, we have developed methods of localized, regional application of InsP3.
Our results indicate that the basal pole contains discrete regions which are capable of active InsP3-evoked Ca2+ release. This Ca2+ response is comparable to that in the secretory pole but has a lower functional affinity for InsP3. However, other regions of the basal pole show no active InsP3-evoked Ca2+ response. The low affinity and spatial separation of active sites of Ca2+ release are proposed to explain why the global Ca2+ responses always originate in the secretory pole and only invade the basal pole at higher stimulus intensities.
METHODS
Imaging
Outbred male albino mice were killed by cervical dislocation. Single, and small clusters of, mouse pancreatic acinar cells were prepared by collagenase digestion as previously described (Thorn & Petersen, 1992). Ca2+ imaging experiments were performed by microinjection of individual acinar cells with 70 000 MW dextran-coupled Calcium Green and caged InsP3 (Molecular Probes) calculated to give a final, cellular concentration of 4-20 and 10-50 μm, respectively (these calculated concentrations matched estimates from comparison of the fluorescence of microinjected cells with fluorescence measurements in whole-cell patch clamp experiments where the Calcium Green concentration was known). The high-molecular weight Ca2+ indicator spread throughout all regions of the cell. The low concentration and slow diffusion rate of 70 000 MW dextran-coupled Calcium Green minimized artifacts due to diffusional redistribution of the Ca2+ signal by the probe. Imaging was carried out using a custom-built, high-speed, high-sensitivity, wide-field digital-imaging microscope (Fig. 1A) as previously described (Kidd et al. 1999). Briefly, single cells were illuminated with a visible laser (Coherent Innova 70, Coherent, Santa Clara, CA, USA) at 488 nm and imaged through a Nikon × 40 UV, 1.3 NA, oil-immersion objective through a 510 nm long-pass filter. Full-frame images (128 pixels × 128 pixels) were captured on a cooled, frame-transfer CCD camera (70 % quantum efficiency, 5 electrons readout noise at 500 frames s−1; Massachusetts Institute of Technology (MIT), Lincoln Laboratory) with a pixel size of 200 nm at the specimen. All images were acquired at 90 frames s−1 (11 ms between images) and with 5 ms exposures. Data were recorded to computer, then analysed with customized software following appropriate bleach correction and smoothing. We assumed a monoexponential decline for the bleaching. Errors in the correction led to minor discrepancies in the ratio signal (for example in Fig. 2 the initial ratio is slightly less than 0). Images were displayed as ΔF/Fo images (100(F–Fo)/Fo), where F is the recorded fluorescence and Fo is the mean fluorescence of the first 40 sequential image frames prior to flash photolysis.
Figure 1. The process of spot photolysis of InsP3 was modelled in order to estimate the relative [InsP3] that evoked regional Ca2+ release.
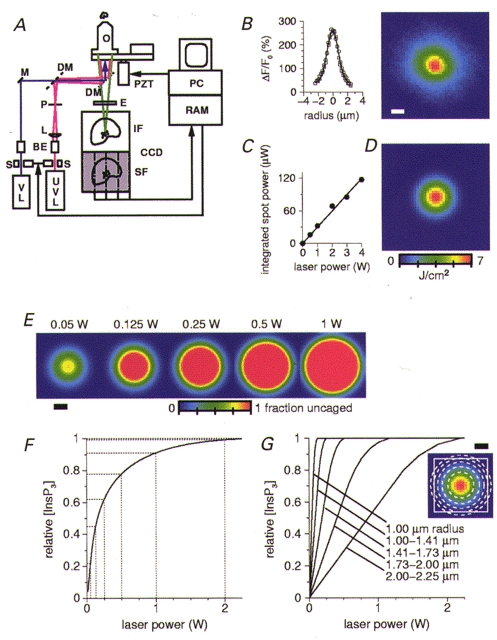
A, a simplified diagram of the high-speed microscope. An argon-krypton visible laser (VL; λ= 488 nm, shown in purple), was used to excite Calcium Green, while an Argon-Ion ultraviolet laser (UVL; λ= 351 and 361 nm, shown in pink), was used for photolysis of InsP3. The UV beam was passed through a 3 mm aperture laser shutter (S), a telescope beam expander optic (BE), a converging lens (L) and a pinhole (P). The visible and UV beams were combined by a dichroic beam combiner (DM, 400DCLP, Chroma), and focused onto the cell through a Nikon × 40 UV, 1.3 NA, oil-immersion objective lens (O). The Calcium Green fluorescence, shown in green, was imaged onto the 128 pixel × 128 pixel image frame (IF) of the high-speed, frame-transfer CCD camera. At the end of an exposure, this image was quickly (∼50 μs) shifted into the storage frame (SF) for transfer to the PC. (Abbreviations: M, mirror; PZT, piezomotor; E, emission filter.) B, the photolysis spot produced within the cells was imaged using the Calcium Green fluorescence excited by the UV beam, and used to determine the spatial profile of the spot. The image shown is the average of five, 1 W, spots from five different cells. Scale bars here and in E and G are 1 μm. Intensity profiles through the average spot, both horizontally (○) and vertically (□) are shown to the left, and were well fitted with a gaussian profile (σ= 0.818 μm) having a full-width at half-maximal intensity (FWHM) of ∼2 μm. C, the actual total (integrated) spot photolysis power seen at the cell was measured and shown to vary linearly with the range of laser power settings used in the experiments. D, the image shows the 2-D gaussian profile of photon density (J cm−2) calculated from the total number of UV photons delivered by a 1 W laser setting at the spot in a 10 ms period. E, the fraction of InsP3 that was uncaged was calculated from the photon density images from five laser power settings using the cross-section and quantum yield of caged InsP3. For laser settings above 0.05 W, there is a region at the centre of the spot where the photon density is sufficient to uncage all the InsP3 present. The size of this region increases with the laser power. F, the relationship between laser power and the average, relative [InsP3] within a 4 μm diameter area, corresponding to the ΔF/F0 measurement region, is not linear, due to the contribution from the expanding region of photolysis saturation. G, the relationship between laser power and the average, relative uncaged [InsP3] at different radii from the centre of the spot is shown for five annuli of equal area (as indicated in the inset by the dotted lines at radii of 1, 1.41, 1.73, 2 and 2.25 μm).
Figure 2. The global Ca2+ response to global photolytic liberation of InsP3.
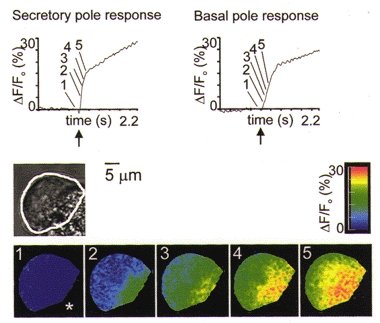
Cells were microinjected with Calcium Green and caged InsP3. The bright-field image shows the outline of the cell (estimated by eye from the fluorescence image) as a white line. This outline was used as the mask for the ΔF/Fo images. The secretory pole was identified by the clustering of zymogen granules. Cells responded, with a short latency and a secretory to basal pole Ca2+ wave, to global photolytic release of InsP3 (time point indicated by arrow on graphs). Indicated on the graphs are the responses recorded in 2 μm diameter regions in the secretory pole and basal pole. The ΔF/Fo images of Calcium Green fluorescence are proportional to the changes in intracellular [Ca2+] and are shown as a pseudocolour representation according to the colour scale on the right. The asterisk indicates the orientation of the cell and is placed in the direction of the secretory pole. Prior to the photolytic release of InsP3 the resting [Ca2+] was low (image 1). The first image that exceeds a threshold of 5 % in the secretory pole is shown (image 2) and subsequent frames were taken at consecutive 36 ms intervals.
In global photolysis experiments we limited the photolysis area (UV spot of ∼20 μm at the image plane) to just the cell of interest. Ca2+ responses to spot InsP3 liberation were recorded as the average ΔF/Fo Calcium Green fluorescence ratio within an area of 4 μm diameter centred on the region of the photolysis spot. The latency of the response was measured as the time taken to reach a 5 % increase in fluorescence intensity. The rate of rise of the Ca2+ response within this area was obtained from the first derivative. Spot photolysis of InsP3 was repeated many times (up to ∼10) in the same cell and gave reproducible responses (see Figs 3B and 5A). Our spot photolysis protocol randomized the order of presentation of the different stimulus intensities to a given cell. We allowed a period of more than 2 min between flashes to allow the cell to recover; this was determined by a return to baseline fluorescence levels.
Figure 3. Control spot photolysis experiments.
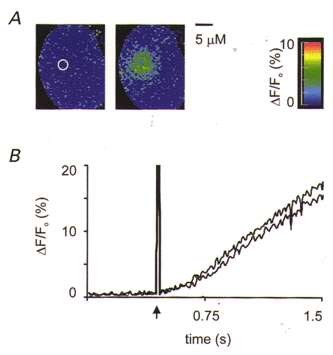
A, cells filled via the patch pipette with caged fluorescein were used to test the spatial extent of the stimulus. In these experiments exactly the same spatial stimulus parameters were used as for those with caged InsP3; that is, a spot of ∼2 μm diameter at the image plane. The first image (left) shows an even fluorescence throughout the cell. Also indicated, by the white circle, is the region of the UV spot (FWHM). An image taken 200 ms after spot photolysis (right) shows a spatially limited increase in fluorescence in the region of the UV flash. B, cells filled with caged InsP3 were given repeated high-intensity UV spot flashes. Two consecutive Ca2+ responses from a 4 μm diameter region, centred over the photolysis region are shown in the graph. The similarity of these responses shows reproducibility and along with the ‘dose’-response relationships shown in Figs 5A, and 6C and D suggests that the cells were not significantly damaged by laser light.
Figure 5. The secretory pole Ca2+ dose-response to spot InsP3 liberation in the secretory pole.
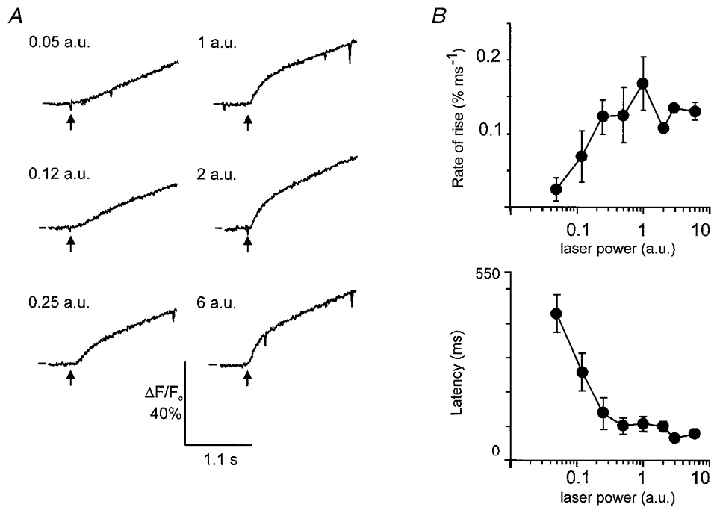
A, in a single cell, repeated photolytic liberation of InsP3, at different intensities of UV laser light, gave rise to a ‘dose’-dependent increase in the rate of rise and amplitude of the Ca2+ response. The order of presentation of the different intensity UV flashes was randomized. In this particular case the order was (laser power (a.u.)): 1, 0.25, 0.12, 0.05, 2, 6. The data show the reproducibility of the responses and saturation at the higher stimulus intensities. The lines on the left-hand side of each trace indicate ΔF/F0= 0. B, the means of the maximal rates of rise of the fluorescence signal are shown plotted against laser power. Mean latency to a 5 %ΔF/F0 change is plotted against UV laser intensity, showing a decline to a minimum with increasing light intensities. Error bars are s.e.m.
Spot photolysis
As shown in Fig. 1A, an argon-ion UV laser (Coherent), λ= 351 and 361 nm, was used for photolysis of InsP3. The UV laser intensity was regulated by manually adjusting the laser power setting to between a minimum of 0.05 W and a maximum of 6 W. A 3 mm aperture electronic shutter (Uniblitz, Vincent Assoc., USA) was used to control a 10 ms photolysis period with 1 ms resolution. The UV beam was then passed through a telescope beam expander optic, a converging lens and a 35 μm pinhole in order to produce a ∼2 μm diameter photolysis spot at the focal plane of the objective. The photolysis spot was imaged using the Calcium Green fluorescence excited by the UV beam, and used to determine the spatial profile of the spot. The image shown in Fig. 1B is the average of five 1 W spots from five different cells. Intensity profiles through the averaged spot were well fitted by a gaussian distribution (σ= 0.818 μm) having a full-width at half-maximal intensity (FWHM) of ∼2 μm. The actual total (integrated) spot photolysis power seen at the cell was measured and shown to vary linearly with the range of laser power settings used in the experiments (Fig. 1C for example – a 1 W setting on the laser resulted in 32 μW at the cell).
In order to estimate the relative concentration of InsP3 that was uncaged at the focal plane by different laser power settings, a computer model of the photolysis spot was constructed. The total number of UV photons delivered at the spot in the 10 ms period was calculated from the integrated spot power for each of the laser settings used. Then, using the fitted 2-D gaussian spatial profile, an image of the photon density was calculated (Fig. 1D). The fraction of InsP3 that was uncaged (Fig. 1E) was then calculated from these photon density images. To do this each photon density image (J cm−2) was multiplied by 1.8 × 10¹⁸ photons J−1 (λ= 357 nm), by the absorption cross-section σ (Lakowitz, 1983) for caged InsP3 of 2.3 × 10⁻¹⁸ cm2 (σ=ε(3.82 × 10⁻²¹), calculated using an extinction coefficient ε= 600 M−1 cm−1; Dr J. Walker, personal communication), and by the quantum yield for caged InsP3 of 0.6 (Dr J. Walker).
As can be seen in Fig. 1E, for laser settings above 0.05 W, there is a region at the centre of the spot where the photon density is sufficient to uncage all the InsP3 present, which experimentally corresponds to 10-50 μm InsP3. The graph in Fig. 1F shows the average, relative [InsP3] within the 4 μm diameter area of the spot corresponding to the ΔF/F0 measurement region. The relationship between laser power and the average [InsP3] is not linear, due to the contribution from the expanding region of photolysis saturation. The size of this region of saturation increases with the laser power.
Since the location and density of InsP3 receptors within the cells was unknown, randomly different alignments of the spot profile with the location of discrete patches of InsP3 receptors would be expected to result in different laser power settings evoking the same responses. This is illustrated in Fig. 1G, where the relationship between laser power and the average, relative uncaged [InsP3] at different radii from the centre of the spot is shown for five annuli of equal area (as indicated by the dotted lines at radii of 1, 1.41, 1.73, 2 and 2.25 μm). If this analysis was correct, a discrete site of InsP3-evoked Ca2+ release, which happened to be positioned under the exact centre of the spot, would respond maximally with as little as a 0.1 W laser flash. In fact we did observe one such event, where the response to 0.1 W was comparable to other responses obtained at higher laser intensities.
Actual calculations as to the amount of InsP3 liberated are complex and will be affected by degradation rates (Fink et al. 1999) and diffusional effects. To study diffusion, control experiments with the spot release of caged fluorescein were performed (injected to a final concentration of 10-50 μm inside the cell, fluorescent only after uncaging; Molecular Probes). The results showed a rapid rise in fluorescence, localized to the photolysis region, followed by a slow spread of the wavefront of fluorescence (10 μm s−1) across the cell (Fig. 3A). The molecular weights of InsP3 and fluorescein are similar (649 and 600, respectively) and therefore the patterns of photolytic liberation and diffusion should also be similar.
In order to investigate whether diffusion would be an important factor in determining the free [InsP3] produced in the region of the photolysis spot, we modelled the dynamics of the process. This model combined the kinetics of the uncaging process with diffusion of both caged and free InsP3 in 2-D, using software previously described (Zou et al. 1999). Computer simulation showed that with diffusion coefficients for caged and free InsP3 set in the range 50-250 μm2 s−1, while the total amount of InsP3 liberated in the dynamic model was up to 5 times greater, the [InsP3] generated locally within the photolysis region was similar to that calculated from the simpler, static model (data not shown; the breakdown of caged InsP3 was modelled as an exponential process with τ½= 2 ms, Dr J. Walker personal communication).
We have only considered the variation in [InsP3] resulting from positioning of the photolysis spot within the plane of focus. Due to the much lower axial resolution of the microscope, the intensity of the spot, as well as the spatial profile, would be expected to vary much more slowly with changes in focus. The analysis of the spot profile could be extended to 3-D. The general nature of the relationship between the laser power setting and the resulting average [InsP3] evoking Ca2+ release would be similar, but probably shifted to lower estimates of [InsP3]. While modelling in 3-D would be valuable, in the light of the uncertainty in some physical parameters of the behaviour of the caged InsP3 and the complexity in our optical system we feel a 2-D analysis provides at least a minimal model for understanding the processes. Throughout the paper we have expressed the stimulus intensity as the power setting on the laser (in absolute units (a.u.)). Based on our modelling and on previous characterizations of the caged InsP3 (Walker et al. 1989), we have estimated that 1 a.u. or greater is equivalent to a rapid elevation in [InsP3] to an average of 10-50 μm at the focal plane.
Even though there may be errors in the estimates of [InsP3], due to the limitations of our models, we would expect these errors to be consistent in the different regions of the cell. As such, comparisons between responses in different regions of the cell evoked by the same intensity UV photolysis spots are valid.
RESULTS
Intracellular Ca2+ changes were imaged with high temporal resolution using a high-speed, digital-imaging microscope (up to 500 Hz full-frame image capture) in cells microinjected with 70 000 MW dextran-coupled Calcium Green (see Methods). The amount of InsP3 liberated was controlled by regulating the intensity of the UV flash. An example of a global Ca2+ response is shown in Fig. 2, and as previously reported for agonists, the initial response was observed in the secretory pole (defined by the location of zymogen granules) followed by a delayed response in the basal pole (Fig. 2). We determined that this global response was not affected by the addition of 100 μm ryanodine (n = 3, data not shown) and therefore conclude that, consistent with previous reports, ryanodine receptors play no role in InsP3-mediated responses (Thorn et al. 1994).
Despite the delay in the response, the rapid rise of the Ca2+ signal in the basal pole suggests an active mechanism of Ca2+ release, rather than passive diffusion of Ca2+ from the secretory pole. However, in these relatively small cells it is difficult to isolate regional Ca2+ signals during a global response. We therefore aimed to try to study the local mechanisms of Ca2+ release by spatially limiting the stimulus. To this end InsP3 was locally liberated by photolytic breakdown of a caged precursor using a UV laser beam focused down to a narrow spot within the cell (2 μm diameter at the image plane, FWHM). To determine the spatial characteristics of our spot stimulus we carried out control experiments uncaging fluorescein (Fig. 3A). At up to 200 ms after photolytic release the region showing elevated fluorescence was spatially restricted (Fig. 3A, right-hand image). A further control was carried out to test for the repeatability of the InsP3-evoked Ca2+ responses and the possibility of laser damage. Even at the highest stimulus intensity used (6 a.u.) repeated UV spot photolysis yielded very similar Ca2+ responses (Fig. 3B). In all our experiments with caged InsP3 the Ca2+ signal was recorded from the whole cell but we restricted our analysis to the average response within a 4 μm diameter region centred on the photolysis spot region.
At UV laser intensities of 1 a.u. or above, spot release of InsP3 within the secretory pole nearly always elicited a Ca2+ response initiated within the photolysis region (Fig. 4, response observed in 12/13 cells), with a dose-dependent increase in the magnitude (to a maximum ΔF/Fo plateau of 33.55 ± 0.89 %, mean ±s.e.m., n = 5) and the rate of rise of the Ca2+ response (to a maximum of 0.168 ± 0.037 % ms−1, mean ±s.e.m., n = 8) and a decrease in latency (to a minimum of 79 ± 9.3 ms, mean ±s.e.m., n = 5) (Fig. 5A and B). It is clear in Fig. 5A that the response saturates at the highest stimulus intensities. The maximum amplitude and rate of rise were comparable to those seen in global InsP3 photolysis experiments (such as in Fig. 2) and in response to the injection of Ins(2,4,5)P3 (Kidd et al. 1999). This suggests that it is the Ca2+ release mechanism that is saturated, rather than any local depletion of InsP3 that might occur at higher flash intensities.
Figure 4. The Ca2+ response to spot InsP3 liberation in the secretory pole.
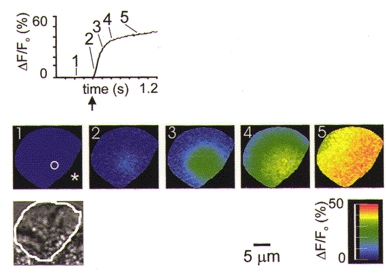
The apex of the secretory pole is shown by an asterisk and region of the UV photolysis spot (FWHM of the photolysis spot) is shown by the white circle in the first ratio image. After InsP3 liberation (time point shown by the arrow on the response graph, 1 a.u. laser power) in the secretory pole, the local Ca2+ response, measured in the region of photolysis (4 μm diameter), developed rapidly and with a short latency. The series of whole-cell ΔF/Fo images, collected at 11 ms sampling intervals, shows the origin of the signal beneath the photolysis spot that then spreads as a wave across the cell. The time at which the images were collected is also shown on the graph. In this figure, and in Fig. 6A and B, image 2 was selected as the time point when the ΔF/Fo signal reached a 5 % increase over baseline.
The Ca2+ release induced by spot release of InsP3 in the basal pole region was much more variable (Fig. 6A and B). In about half of the cells (5/12) little active response was observed, even at the highest stimulus intensities used. These responses had long latencies and the Ca2+ signal, under the region of the photolysis spot, was sometimes contaminated with a Ca2+ signal, back spreading, from a delayed response in the secretory pole (Fig. 6A). In the other cells, however, spot release of InsP3 in the basal pole did induce a clear response, initiated in the photolysis region, of a magnitude, rate of rise and latency similar to that found in the secretory pole (Fig. 6B). Separate Ca2+ traces are shown in Fig. 6C and D for the two cells shown in Fig. 6A and B, respectively. It is clear that the poorly responding cell (Fig. 6A and C) has slow responses with a rise time that shows little dependence on laser power (Fig. 6E, squares). In contrast, the cell in Fig. 6B and D shows a fast component that develops at higher stimulus intensities (Fig. 6E, circles).
Figure 6. Examples of the Ca2+ response, in two different cells, to the spot liberation of InsP3 in the basal pole region.
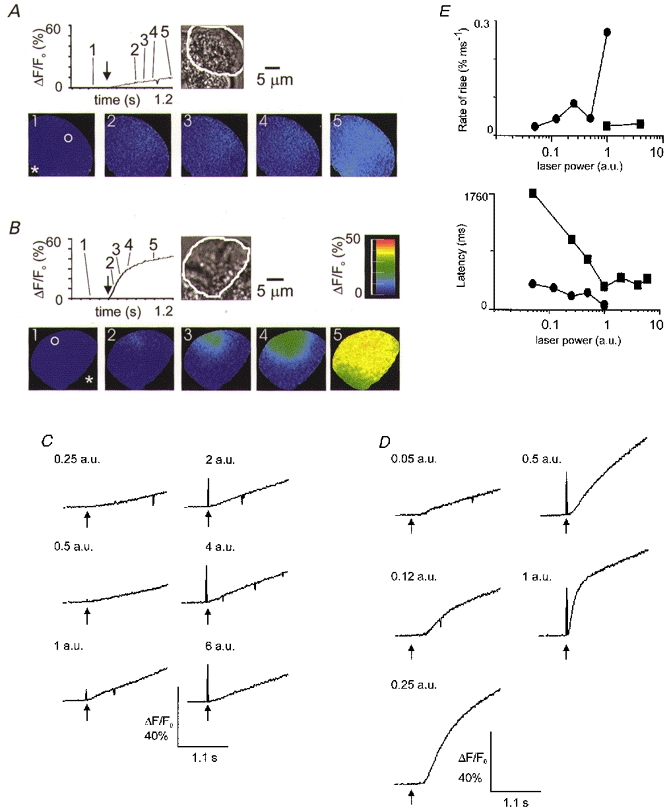
InsP3 release in the basal pole region elicited either a weak response (A, 1 a.u. laser power) or a response indistinguishable from that induced in the secretory pole (B, 1 a.u. laser power). C, in a single cell (the same as that shown in A), repeated UV photolysis in the basal pole elicited poor Ca2+ responses that showed little ‘dose’ dependence in the rate of rise and long latencies to a ΔF/F0 of 5 %. The order of presentation of the stimuli was random; in this particular case it was (laser power, a.u.): 1, 0.5, 0.25, 2, 4, 6. D, in a single cell (the same as that shown in B), repeated UV photolysis in the basal pole elicited a ‘dose’-dependent effect on the rate of rise of the Ca2+ signal and on the latency. Again the order of presentation of the stimuli was random; in this particular case it was (laser power, a.u.): 1, 0.25, 0.12, 0.05, 0.5. E, graphs show the latency and maximum rates of rise for each of the cells (▪, cell in A and C; •, cell in B and D). (Note, a latency of longer than 1760 ms (at 0.125 a.u. for the cell in A and C) is indicated on the graphs as 1760 ms. Also rates of rise of less than 0.02 % ms−1 were difficult to measure for the cell in A and C and were not included on the graph.)
In the poorly responding cells, moving the photolysis spot to other regions did elicit a rapid response, indicating that these cells were capable of responding. Figure 7 shows an example of this, with data obtained from a single cell giving markedly different Ca2+ responses to the same InsP3 liberation, in different regions of the basal pole.
Figure 7. The Ca2+ response to regional spot photolysis of InsP3 in four places within a single cell.
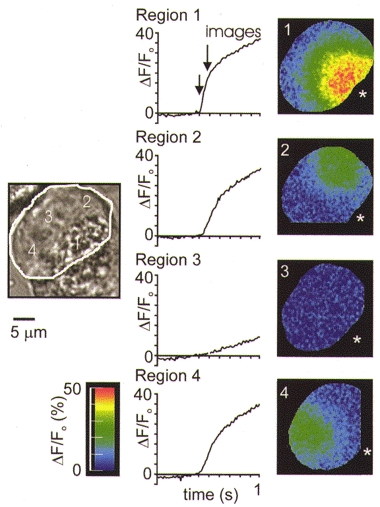
The response of a single cell to repeated InsP3 liberation in different regions. The left-hand arrow shows the time point of flash photolytic release of InsP3. The pseudocolour images were taken at the time point indicated by the arrow marked ‘images’. In the secretory pole (region 1) a vigorous response was observed. Regions 2, 3 and 4 in the basal pole show variability in the responses to the same stimulus. To position the photolysis spot in some regions of the basal pole, parts of the cell sometimes fell outside the camera field of view (images 2 and 4).
Figure 8 compares the relationship between the InsP3 dose and the rate of Ca2+ rise of active responses in the basal and secretory pole. The response is shown plotted against absolute units (Fig. 8A) and also plotted against the relative [InsP3] calculated from our models (Fig. 8B). The basal pole and secretory pole responses rose to the same maximum (not significantly different, Student's t test) indicating that the flux, within the analysed spot, is similar. However the basal pole responses were shifted to the right (the data at the mid-point of the curve were significantly different, Student's t test, P < 0.05) indicating a lower functional affinity for InsP3.
Figure 8. Comparison of the InsP3 dose relationship to the rate of Ca2+ rise.
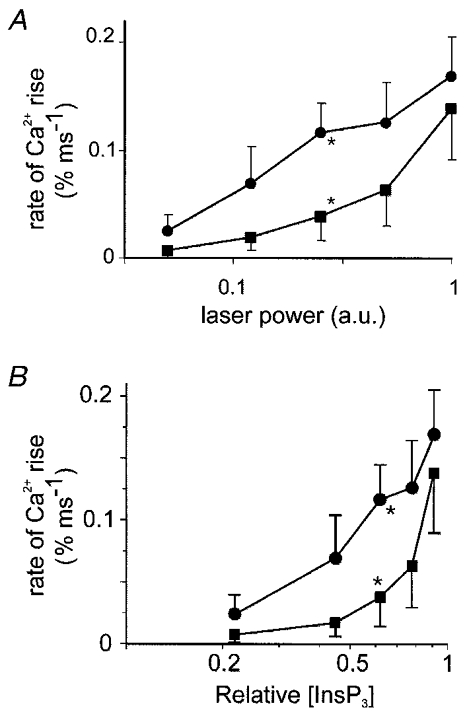
The responses are plotted either against laser power expressed in absolute units (A) or against the relative [InsP3] calculated from our model (B). The mean secretory pole responses (n = 12 cells, •, error bars are s.e.m.) and the mean of the active basal pole responses (n = 4, ▪, error bars are s.e.m.) are shown. The points indicated by the asterisks were significantly different at P < 0.05 (Student's one-tailed t test), all other points were not. The units of the InsP3 dose are relative [InsP3], estimated as described in Methods and illustrated in Fig. 1. From the injected concentrations of caged InsP3 we would estimate the maximum [InsP3] to be 10-50 μm.
DISCUSSION
These results provide a functional description of regional InsP3-evoked Ca2+ responses in single epithelial cells. In particular we have addressed the basis of the global Ca2+ response in acinar cells. The spot photolytic liberation of InsP3 showed that some regions of the basal pole were incapable of rapid InsP3-evoked Ca2+ release even at the highest stimulus levels we used. We conclude that these regions either do not contain InsP3 receptors or have receptors with very different characteristics. However, other sites in the basal pole did show InsP3-evoked responses, which had similar kinetics of Ca2+ release, but with a lower apparent InsP3 affinity, compared to the secretory pole responses.
Secretory pole Ca2+ responses
The local secretory pole spikes and the initiation of global Ca2+ waves at the secretory pole have long been postulated to be due to a greater InsP3‘sensitivity’ in this region (Kasai & Augustine, 1990; Thorn et al. 1993). Experiments on permeabilized cells have shown that it is a property of Ca2+ release that gives rise to the polarized Ca2+ signal in acinar cells (van de Put & Elliott, 1996; Tanimura et al. 1998). However, attempts to functionally identify the basis of the secretory pole Ca2+ release characteristics, compared to that of the basal pole, have not shown any regional differences in response (Toescu et al. 1994; van de Put & Elliott, 1996). Recently, Ito et al. (1999) have measured a difference in the functional affinity for InsP3 between the secretory pole (estimated EC50≡ 5 μm) and the basal pole (EC50≡ 50 μm) based on global flash photolysis experiments. These experiments provide the first evidence that there are regional differences in InsP3 sensitivity. However, interpretation of these experiments is compromised due to the potential for contamination of the basal pole Ca2+ signal with secretory pole Ca2+ responses and also the lack of spatial resolution in the basal pole response.
To overcome these problems our experimental approach used microinjection of a minimum amount of 70 000 MW dextran-coupled Calcium Green. This technique, unlike whole-cell patch clamp, retains native intracellular Ca2+ buffers and minimizes disturbances in intracellular Ca2+ buffering due to exogenous dyes. We also designed a system capable of delivering a localized InsP3 stimulus and recording the localized regional Ca2+ responses. In this way we were able to determine the regional InsP3 responses, in isolation, in the absence of the signal contamination that is inevitable during the global stimulation. Our local stimulus and local recording system had the spatial resolution to determine spatially discrete responses and subdivide the basal pole region. Finally, the high temporal resolution of our recordings allowed full characterization of the extremely rapid responses elicited at the higher stimulus intensities.
With the above methods we can now conclude that the secretory pole is a region of higher apparent InsP3 affinity, although we estimate less than a 5-fold difference (less than a 2-fold difference based on our calculations of relative [InsP3], Fig. 8B), compared to the 10-fold difference seen by Ito et al. (1999). This discrepancy between our work and that of Ito et al. (1999) is likely to be explained by our greater spatial resolution, which has enabled us to identify discrete regions within the basal pole that are essentially unresponsive to InsP3.
Global Ca2+ responses
Our observation on the isolated basal pole responses provides a functional explanation for the global Ca2+ responses seen at higher intensities of stimulation. The apparent difference in InsP3 affinity between the secretory pole and the active sites of release in the basal pole indicates that the basal pole would have a higher threshold for activation. Also, although we consistently observed responses to local InsP3 stimuli in the secretory pole we failed to see rapid responses in some discrete regions within the basal pole. Therefore, under conditions where InsP3 is globally elevated we would expect the release sites in the secretory pole to become more excitable and therefore initially more responsive than those in the basal pole. The basal pole responses would only be recruited at higher levels of InsP3. In this way two parameters are acting to reduce the responsiveness of the basal pole region: firstly, the functional characteristics of the InsP3 receptors, which show a lower apparent affinity, and secondly, the more widespread separation of release sites in the basal pole, which would limit their recruitment to higher stimulus intensities.
Our results indicate that the basal pole has heterogeneous InsP3-evoked Ca2+ responses. This region of the acinar cells is rich in endoplasmic reticulum and is also the region containing the nucleus. It has previously been shown that the nuclear envelope is capable of InsP3-dependent responses (Gerasimenko et al. 1995) and InsP3 receptors have been shown to be clustered on the envelope membrane (Mak & Foskett, 1997), potentially giving rise to the observed local Ca2+ responses (Lipp et al. 1997). It is possible that the regions of active responses we identified arise from Ca2+ release from the nuclear envelope rather than the endoplasmic reticulum.
Role of InsP3 receptor isoforms
This greater apparent InsP3 affinity in the secretory pole may result from a greater concentration of higher affinity InsP3 receptors. Pancreatic acinar cells have been shown to predominantly contain type 2 and type 3 InsP3 receptors (De Smedt et al. 1994; Wojcikiewicz, 1995) and binding studies have shown that type 2 InsP3 receptors have a higher InsP3 affinity than type 3 (Newton et al. 1994; Parys et al. 1995). The type 2 receptor would therefore be predicted to show a secretory pole localization. Consistent with this, immunolocalization studies have shown that the type 2 InsP3 receptor is exclusively located in the secretory pole (Lee et al. 1997; Yule et al. 1997) whereas there is some evidence for the type 3 (Lee et al. 1997; Yule et al. 1997) and type 1 receptors (Yule et al. 1997) in the basal pole regions. This apical clustering of type 2 receptors at the site of initiation of the Ca2+ signal has also been seen at Ca2+ response initiation sites in other cells, such as the submandibular duct cell (Yamamoto-Hino et al. 1998) and astrocytes (Sheppard et al. 1997). The clustering of InsP3 receptors, immunolocalized to the secretory pole, does agree with our data of consistent InsP3-evoked Ca2+ responses in this region. However, our data are not consistent with the apparent low density of receptors immunolocalized in the basal pole (Lee et al. 1997; Yule et al. 1997). In our experiments we observed that the maximum rate of rise of the Ca2+ response achieved in active regions of the basal pole is the same as in the secretory pole. This suggests regional clustering of InsP3 receptors in the basal pole at a similar density to that in the secretory pole. More detailed studies of the cellular localization of InsP3 receptors will be required to resolve this issue, which might arise out of the limitations in immunolocalization techniques or the presence of a novel InsP3 receptor isoform (Lee et al. 1997).
Of course, the affinity for InsP3 is only one aspect of InsP3 receptor behaviour and it has been suggested that a decreased sensitivity to Ca2+-dependent inactivation of the type 3 InsP3 receptor makes this a likely candidate for initiation of the Ca2+ signal in the secretory pole (Hagar et al. 1998). Very similar arguments have been made for the type 2 receptor (Ramos-Franco et al. 1998). Further experiments will be required to determine these isoform-specific characteristics (Taylor, 1998). An additional complication is that heteroligomeric InsP3 receptors may be found in the secretory pole and their behaviour would be dependent on isoform composition (Miyakawa et al. 1999).
Agonist-evoked Ca2+ signals
In pancreatic acinar cells it is clear that the agonist-evoked Ca2+ pool is critically dependent on the regional properties of InsP3-evoked Ca2+ release that we have described above. Agonist responses are blocked by heparin (Thorn et al. 1994) and agents that act on the ryanodine receptor only modulate, but do not block, the global responses (Nathanson et al. 1992; Thorn et al. 1994). However, in trying to build up a complete picture of agonist-evoked Ca2+ signalling we have to include the potential for InsP3-independent pathways. These include cyclic adenosine 5′-diphosphate-ribose (cyclic ADPribose)-evoked Ca2+ release (Thorn et al. 1994) and, more recently, nicotinic acid adenine dinucleotide phosphate (NAADP)-evoked responses (Cancela et al. 1999). These other pathways may play a role in agonist-specific aspects of the Ca2+ signal.
Conclusion
In conclusion we have described regional differences in InsP3-evoked responses in single pancreatic acinar cells. Our results provide a functional explanation for the observation of global Ca2+ signals which initiate in the secretory pole and then spread across the basal pole region.
Acknowledgments
We thank the Wellcome Trust (Travel Grant), the Medical Research Council (project grant to P.T. and Dr T. Cheek), The Royal Society and the National Science Foundation (grants DBI-9200027 and DBI-9724611) for support. J.F.K. is supported by a Biological and Biotechnology Sciences Research Council graduate studentship. This work is dedicated to the late Dr Fredric S. Fay, friend and colleague, as it was initiated while he was still alive. We are indebted to him for the many insights he provided into these experiments.
References
- Cancela JM, Churchill GC, Galione A. Coordination of agonist-induced Ca2+-signalling patterns by NAADP in pancreatic acinar cells. Nature. 1999;398:74–76. doi: 10.1038/18032. [DOI] [PubMed] [Google Scholar]
- De Smedt H, Missiaen L, Parys JB, Bootman MD, Mertens L, Van Den Bosch L, Casteels R. Determination of relative amounts of inositol trisphosphate receptor mRNA isoforms by ratio polymerase chain reaction. Journal of Biological Chemistry. 1994;269:21691–21698. [PubMed] [Google Scholar]
- Fink CC, Slepchenko B, Loew LM. Determination of time-dependent inositol-1,4,5-trisphosphate concentrations during calcium release in a smooth muscle cell. Biophysical Journal. 1999;77:617–628. doi: 10.1016/S0006-3495(99)76918-3. [DOI] [PMC free article] [PubMed] [Google Scholar]
- Fogarty KE, Kidd JF, Tuft RA, Thorn P. A bimodal pattern of InsP3-evoked elementary Ca2+ signals in pancreatic acinar cells. Biophysical Journal. 2000;78:2298–2306. doi: 10.1016/S0006-3495(00)76776-2. [DOI] [PMC free article] [PubMed] [Google Scholar]
- Gerasimenko OV, Gerasimenko JV, Tepikin AV, Petersen OH. ATP-dependent accumulation and inositol trisphosphate- or cyclic ADP-ribose-mediated release of Ca2+ from the nuclear envelope. Cell. 1995;80:439–444. doi: 10.1016/0092-8674(95)90494-8. [DOI] [PubMed] [Google Scholar]
- Hagar RE, Burgstahler AD, Nathanson MH, Ehrlich BE. Type III InsP3 receptor channel stays open in the presence of increased calcium. Nature. 1998;396:81–84. doi: 10.1038/23954. [DOI] [PMC free article] [PubMed] [Google Scholar]
- Ito K, Miyashita Y, Kasai H. Kinetic control of multiple forms of Ca2+ spikes by inositol trisphosphate in pancreatic acinar cells. Journal of Cell Biology. 1999;146:405–413. doi: 10.1083/jcb.146.2.405. [DOI] [PMC free article] [PubMed] [Google Scholar]
- Kasai H, Augustine GJ. Cytosolic Ca2+ gradients triggering unidirectional fluid secretion from exocrine pancreas. Nature. 1990;348:735–738. doi: 10.1038/348735a0. [DOI] [PubMed] [Google Scholar]
- Kasai H, Li YX, Miyashita Y. Subcellular distribution of Ca2+ release channels underlying Ca2+ waves and oscillations in exocrine pancreas. Cell. 1993;74:669–677. doi: 10.1016/0092-8674(93)90514-q. [DOI] [PubMed] [Google Scholar]
- Kidd JF, Fogarty KE, Tuft R, Thorn P. The role of Ca2+ feedback in shaping InsP3-evoked Ca2+ signals in mouse pancreatic acinar cells. The Journal of Physiology. 1999;520:187–201. doi: 10.1111/j.1469-7793.1999.00187.x. [DOI] [PMC free article] [PubMed] [Google Scholar]
- Lakowicz JR. Principles of Fluorescence Spectroscopy. New York: Plenum Press; 1983. pp. 47–48. [Google Scholar]
- Lee MG, Xu X, Zeng W, Diaz J, Wojcikiewicz RJ, Kuo TH, Wuytack F, Racymaekers L, Muallem S. Polarized expression of Ca2+ channels in pancreatic and salivary gland cells. Correlation with initiation and propagation of [Ca2+]i waves. Journal of Biological Chemistry. 1997;272:15765–15770. doi: 10.1074/jbc.272.25.15765. [DOI] [PubMed] [Google Scholar]
- Lipp P, Thomas D, Berridge MJ, Bootman MD. Nuclear calcium signalling by individual cytoplasmic calcium puffs. EMBO Journal. 1997;16:7166–7173. doi: 10.1093/emboj/16.23.7166. [DOI] [PMC free article] [PubMed] [Google Scholar]
- Mak DO, Foskett JK. Single-channel kinetics, inactivation, and spatial distribution of inositol trisphosphate (IP3) receptors in Xenopus oocyte nucleus. Journal of General Physiology. 1997;109:571–587. doi: 10.1085/jgp.109.5.571. [DOI] [PMC free article] [PubMed] [Google Scholar]
- Miyakawa T, Maeda A, Yamazawa T, Hirose K, Kurosaki T, Iino M. Encoding of Ca2+ signals by differential expression of IP3 receptor subtypes. EMBO Journal. 1999;18:1303–1308. doi: 10.1093/emboj/18.5.1303. [DOI] [PMC free article] [PubMed] [Google Scholar]
- Nathanson MH, Padfield PJ, O'Sullivan AJ, Burgstahler AD, Jamieson JD. Mechanism of Ca2+ wave propagation in pancreatic acinar cells. Journal of Biological Chemistry. 1992;267:18118–18121. [PubMed] [Google Scholar]
- Newton CL, Mignery GA, Südhof TC. Co-expression in vertebrate tissues and cell lines of multiple inositol 1,4,5-trisphosphate (InsP3) receptors with distinct affinities for InsP3. Journal of Biological Chemistry. 1994;269:28613–18619. [PubMed] [Google Scholar]
- Parys JB, de Smedt H, Missiaen L, Bootman MD, Sienaert I, Casteels R. Rat basophilic leukemia cells as model system for inositol 1,4,5-trisphosphate receptor IV, a receptor of the type II family: functional comparison and immunological detection. Cell Calcium. 1995;17:239–249. doi: 10.1016/0143-4160(95)90070-5. [DOI] [PubMed] [Google Scholar]
- Petersen OH. Stimulus-secretion coupling: cytoplasmic calcium signals and the control of ion channels in exocrine acinar cells. The Journal of Physiology. 1992;448:1–51. doi: 10.1113/jphysiol.1992.sp019028. [DOI] [PMC free article] [PubMed] [Google Scholar]
- Ramos-Franco J, Fill M, Mignery GA. Isoform-specific function of single inositol 1,4,5-trisphosphate receptor channels. Biophysical Journal. 1998;75:834–839. doi: 10.1016/S0006-3495(98)77572-1. [DOI] [PMC free article] [PubMed] [Google Scholar]
- Sheppard CA, Simpson PB, Sharp AH, Nucifora FC, Ross CA, Lange GD, Russell JT. Comparison of type 2 inositol 1,4,5-trisphosphate receptor distribution and subcellular Ca2+ release sites that support Ca2+ waves in cultured astrocytes. Journal of Neurochemistry. 1997;68:2317–2327. doi: 10.1046/j.1471-4159.1997.68062317.x. [DOI] [PubMed] [Google Scholar]
- Tanimura A, Matsumoto Y, Tojyo Y. Polarized Ca2+ release in saponin-permeabilized parotid acinar cells evoked by flash photolysis of ‘caged’ inositol 1,4,5-trisphosphate. Biochemical Journal. 1998;332:769–772. doi: 10.1042/bj3320769. [DOI] [PMC free article] [PubMed] [Google Scholar]
- Taylor CW. Inositol trisphosphate receptors: Ca2+-modulated intracellular Ca2+ channels. Biochimica et Biophysica Acta. 1998;1436:19–33. doi: 10.1016/s0005-2760(98)00122-2. [DOI] [PubMed] [Google Scholar]
- Thorn P. Spatial domains of Ca2+ signaling in secretory epithelial cells. Cell Calcium. 1996;20:203–214. doi: 10.1016/s0143-4160(96)90107-4. [DOI] [PubMed] [Google Scholar]
- Thorn P, Gerasimenko O, Petersen OH. Cyclic ADP-ribose regulation of ryanodine receptors involved in agonist evoked cytoskeletal Ca2+ oscillations in pancreatic acinar cells. EMBO Journal. 1994;13:2038–2043. doi: 10.1002/j.1460-2075.1994.tb06478.x. [DOI] [PMC free article] [PubMed] [Google Scholar]
- Thorn P, Lawrie AM, Smith PM, Gallacher DV, Petersen OH. Local and global cytosolic Ca2+ oscillations in exocrine cells evoked by agonists and inositol trisphosphate. Cell. 1993;74:661–668. doi: 10.1016/0092-8674(93)90513-p. [DOI] [PubMed] [Google Scholar]
- Thorn P, Moreton R, Berridge M. Multiple, coordinated Ca2+-release events underlie the inositol trisphosphate-induced local Ca2+ spikes in mouse pancreatic acinar cells. EMBO Journal. 1996;15:999–1003. [PMC free article] [PubMed] [Google Scholar]
- Thorn P, Petersen OH. Activation of nonselective cation channels by physiological cholecystokinin concentrations in mouse pancreatic acinar cells. Journal of General Physiology. 1992;100:11–25. doi: 10.1085/jgp.100.1.11. [DOI] [PMC free article] [PubMed] [Google Scholar]
- Toescu EC, Gallacher DV, Petersen OH. Identical regional mechanisms of intracellular free Ca2+ concentration increase during polarized agonist-evoked Ca2+ response in pancreatic acinar cells. Biochemical Journal. 1994;304:313–316. doi: 10.1042/bj3040313. [DOI] [PMC free article] [PubMed] [Google Scholar]
- Toescu EC, Lawrie AM, Petersen OH, Gallacher DV. Spatial and temporal distribution of agonist-evoked cytoplasmic Ca2+ signals in exocrine acinar cells analysed by digital image microscopy. EMBO Journal. 1992;11:1623–1629. doi: 10.1002/j.1460-2075.1992.tb05208.x. [DOI] [PMC free article] [PubMed] [Google Scholar]
- van de Put FH, Elliott AC. Imaging of intracellular calcium stores in individual permeabilized pancreatic acinar cells. Apparent homogeneous cellular distribution of inositol 1,4,5-trisphosphate-sensitive stores in permeabilized pancreatic acinar cells. Journal of Biological Chemistry. 1996;271:4999–5006. doi: 10.1074/jbc.271.9.4999. [DOI] [PubMed] [Google Scholar]
- Walker JW, Feeney J, Trentham DR. Photolabile precursors of inositol phosphates. Preparation and properties of 1-(2-nitrophenyl)ethyl esters of myo-inositol 1,4,5-trisphosphate. Biochemistry. 1989;28:3272–3280. doi: 10.1021/bi00434a023. [DOI] [PubMed] [Google Scholar]
- Wojcikiewicz RJ. Type I, II, and III inositol 1,4,5-trisphosphate receptors are unequally susceptible to downregulation and are expressed in markedly different proportions in different cell types. Journal of Biological Chemistry. 1995;270:11678–11683. doi: 10.1074/jbc.270.19.11678. [DOI] [PubMed] [Google Scholar]
- Yamamoto-Hino M, Miyawaki A, Segawa A, Adachi E, Yamashina S, Fujimoto T, Sugiyama T, Furuichi T, Hasegawa M, Mikoshiba K. Apical vesicles bearing inositol 1,4,5-trisphosphate receptors in the Ca2+ initiation site of ductal epithelium of submandibular gland. Journal of Cell Biology. 1998;141:135–142. doi: 10.1083/jcb.141.1.135. [DOI] [PMC free article] [PubMed] [Google Scholar]
- Yule DI, Ernst SA, Ohnishi H, Wojcikiewicz RJ. Evidence that zymogen granules are not a physiologically relevant calcium pool. Defining the distribution of inositol 1,4,5-trisphosphate receptors in pancreatic acinar cells. Journal of Biological Chemistry. 1997;272:9093–9098. doi: 10.1074/jbc.272.14.9093. [DOI] [PubMed] [Google Scholar]
- Zou H, Lifshitz LM, Tuft RA, Fogarty KE, Singer JS. Imaging Ca2+ entering the cytoplasm through a single opening of a plasma membrane cation channel. Journal of General Physiology. 1999;114:575–588. doi: 10.1085/jgp.114.4.575. [DOI] [PMC free article] [PubMed] [Google Scholar]


